


Introduction
Wildlife tourism is typically divided into ‘non-consumptive’ forms (e.g., wildlife viewing and photography) and ‘consumptive’ forms, such as fishing and hunting, including trophy hunting (TH). TH involves the legal killing of wild animals with specific traits, whereby selected body parts are kept as trophies (IUCN 2016). TH is practised in nearly 80% of Protected and Conserved Areas (PCAs) and surrounding buffer zones in Tanzania, but not in national parks and the Ngorongoro Conservation Area (NCA; URT 2016). Wildlife viewing and photography generate USD 2.5–2.7 billion annually, and TH generates an additional USD 27–36 million annually (Kideghesho et al. Reference Kideghesho, Kimaro, Mayengo and Kisingo2021, Sumba et al. Reference Sumba, Snyman and Masilonyane2021), benefitting wildlife conservation and socio-economic development. Properly managed, TH can be an effective tool for both conservation and sustainable development (Snyman et al. Reference Snyman, Sumba, Vorhies, Gitari, Enders and Ahenkan2021, Keyyu et al. Reference Keyyu, Fyumagwa, Mjingo, Silayo, Masenga and Kakengi2025).
Game animals often hunted for trophies include cape buffalo (Syncerus caffer) and impala (Aepyceros melampus; URT 2022). Trophy hunters value game animals for their size, beauty or the challenge they offer during the hunting process (Di Minin et al. Reference Di Minin, Leader-Williams and Bradshaw2016). TH of well-known game animals such as elephants (Loxodonta africana), lions (Panthera leo) and crocodiles (Crocodylus niloticus), particularly in Africa, has sparked much controversy internationally (Morris Reference Morris2020, Morss Reference Morss2021, Hare et al. Reference Hare, Dickman, Johnson, Rono, Mutinhima and Sutherland2024, Mosenda Reference Mosenda2024, Poole et al. Reference Poole, Dobson, Bonhan, Pope, Fishlock and Goodall2024, Keyyu et al. Reference Keyyu, Fyumagwa, Mjingo, Silayo, Masenga and Kakengi2025). Some argue that TH is unethical and cruel and does not enhance the conservation of species and habitats (Batavia et al. Reference Batavia, Ripple, Nelson, Wallach, Darimont and Paquet2018, Mkono Reference Mkono2019, Vucetich et al. Reference Vucetich, Burnham, Johnson, Loveridge, Nelson, Bruskotter and Macdonald2019, Ghasemi Reference Ghasemi2021). However, others argue that well-regulated TH can help conserve areas that may not have picturesque landscapes or abundant wildlife populations (IUCN 2016, Booth, Reference Booth2017) and therefore are less suitable for photographic tourism (Parker et al. Reference Parker, Khanyari, Ambarli, Buuveibaatar, Kabir and Khanal2023).
In Tanzania, TH is conducted in hunting blocks (i.e., government-designated areas where hunting is allowed under regulated conditions; URT 2022). These blocks are largely found within PCAs such as Game Reserves, Game Controlled Areas (GCAs), and Wildlife Management Areas (WMAs), offering varying levels of protection for wildlife and habitats. Some hunting blocks are located in unprotected buffer zones or village lands with diverse game animals, known as Open Areas (OAs), where there is less protection for wildlife and habitats (Booth Reference Booth2017, Strampelli et al. Reference Strampelli, Henschel, Searle, Macdonald and Dickman2022). Many areas in Tanzania that permit TH may not fully meet International Union for Conservation of Nature (IUCN) criteria for formal protected area designation, such as those aimed at conserving entire ecosystems (Category II) or specific species and habitat fragments (Category IV). This reinforces the need to adopt the broader term ‘PCAs’, which acknowledges diverse land uses and governance types and can contribute to wildlife conservation (Sumba et al. Reference Sumba, Snyman and Masilonyane2021). Northern Tanzania is a conservation hotspot, home to globally significant sites such as the Serengeti National Park, NCA and the Lake Natron Ramsar site. The region hosts over 70% of the country’s wildlife tourism (Snyman et al. Reference Snyman, Sumba, Vorhies, Gitari, Enders and Ahenkan2021). However, increasing human population pressures and expanding settlement networks have intensified unregulated land use in and around hunting blocks, at times threatening habitat suitability for wildlife (Mtui et al. Reference Mtui, Lepczyk, Chen, Miura and Cox2017, National Bureau of Statistics 2022).
Hunting blocks are leased to TH operators and are regulated by wildlife agencies, local authorities and communities (Musika et al. Reference Musika, Wakibara, Ndakidemi and Treydte2022). Although hunting block size can only be changed by the government, increasing human pressures can change the extent and distribution of different land-cover types within hunting blocks, often in ways that are detrimental to wildlife and raise significant conservation concerns (IUCN 2016). ‘Land cover’ refers to vegetation and human-made structures, and changes in it can indicate long-term transformations (Msigwa et al. Reference Msigwa, Komakech, Verbeiren, Salvadore, Hessels, Weerasinghe and Griensven2019). Knowledge about different land-cover types in hunting blocks, including woodlands, bushlands and grasslands, can help us to assess habitat the suitability and functional (usable) area available to game animals, to monitor environmental changes and to inform land management and conservation strategies (Riggio et al. Reference Riggio, Jacobson, Hijmans and Caro2018, Kija et al. Reference Kija, Ogutu, Mangewa, Bukombe, Verones and Graae2020, Temesgen et al. Reference Temesgen, Warkineh and Hailemicael2022). ‘Functional area’ is the portion of a hunting block that is effectively usable by wildlife for feeding, breeding and movement based on land-cover characteristics (Morris et al. Reference Morris, Proffitt and Blackburn2016). Between 2010 and 2017, nearly 80% of land-cover changes in Tanzania were due to agriculture (Nzunda & Midtgaard Reference Nzunda and Midtgaard2019, World Bank 2019, Doggart et al. Reference Doggart, Morgan-Brown, Lyimo, Mbilinyi, Meshack, Sallu and Spracklen2020), leading to a decline in game animal abundance and changes in wild animal movement patterns (Capitani et al. Reference Capitani, van Soesbergen, Mukama, Malugu, Mbilinyi and Chamuya2019, Anthony et al. Reference Anthony, Shaban and Nahonyo2023). Additionally, between 2000 and 2015, Tanzania lost c. 5.86 million ha of tree cover (c. 10%) due to deforestation at an average rate of c. 469 000 ha per year, also contributing to biodiversity loss (FAO 2020).
Understanding the sustainability of TH as a land-use designation is limited, with key factors such as land cover in hunting blocks remaining understudied (IUCN 2016, Musika et al. Reference Musika, Wakibara, Ndakidemi and Treydte2022, Strampelli et al. Reference Strampelli, Henschel, Searle, Macdonald and Dickman2022). Land-cover change in hunting blocks is important because it affects game animal habitats and populations, disrupts wildlife connectivity and alters vegetation structure (Kiffner et al. Reference Kiffner, Wenner, Laviolet, Yeh and Kioko2016, Mtui et al. Reference Mtui, Lepczyk, Chen, Miura and Cox2017), and so it can negatively impact wildlife more generally. Hunting blocks can contribute to conservation efforts by providing designated areas for game animal conservation. Moreover, the revenue generated from TH is often reinvested into local conservation programmes, anti-poaching initiatives and habitat protection (IUCN 2016, Keyyu et al. Reference Keyyu, Fyumagwa, Mjingo, Silayo, Masenga and Kakengi2025). However, hunting blocks face significant pressures from human activities such as agriculture, charcoal production and tree cutting (Booth Reference Booth2017), particularly if those areas are not under the active management of TH operators and remain solely regulated by the government (Strampelli et al. Reference Strampelli, Henschel, Searle, Macdonald and Dickman2022). While studies have examined habitat changes within ecosystems or species-specific impacts, there is limited research focused on land-cover changes in hunting blocks located in areas where competing land uses are also prevalent (Fryxell et al., Reference Fryxell, Wilmshurst and Sinclair2004, Gottschalk et al. Reference Gottschalk, Ekschmitt and Bairlein2007, Gizachew et al. Reference Gizachew, Rizzi, Shirima and Zahabu2020, Komba et al. Reference Komba, Watanabe, Kaneko and Chand2021, Temesgen et al. Reference Temesgen, Warkineh and Hailemicael2022). As a result, the implications of these changes for game populations, wildlife conservation more generally and the sustainability of regulated TH operations remain largely unexplored (Musika et al. Reference Musika, Wakibara, Ndakidemi and Treydte2022). Understanding and quantifying land-cover changes at a finer scale within hunting blocks, compared to broader regional or national assessments, is essential for developing informed land-use management strategies and evaluating the long-term sustainability of TH operations.
Here, we report on changes in functional (usable) area and land cover in hunting blocks in OAs and GCAs in northern Tanzania from 2013 to 2023. We hypothesized that hunting blocks in OAs, due to their lack of formal protection and enforcement, would experience greater land-cover change and larger losses of functional (usable) area than those in GCAs between 2013 and 2023. GCAs are minimally protected but subject to some legal oversight, whereas OAs remain unprotected and more exposed to human pressures due to their weaker enforcement of regulations than GCAs. Our objectives were: (1) to assess changes in the functional (usable) area of hunting blocks; and (2) to examine land-cover changes within hunting blocks. Although we could not directly determine the areas within hunting blocks that are suitable for particular species, such as impala, buffalo and zebra (Equus burchelli), we aimed to infer potential habitat impacts based on land-cover data. These insights could help inform sustainable land-use and wildlife conservation policies in Tanzania.
Materials and methods
Study area
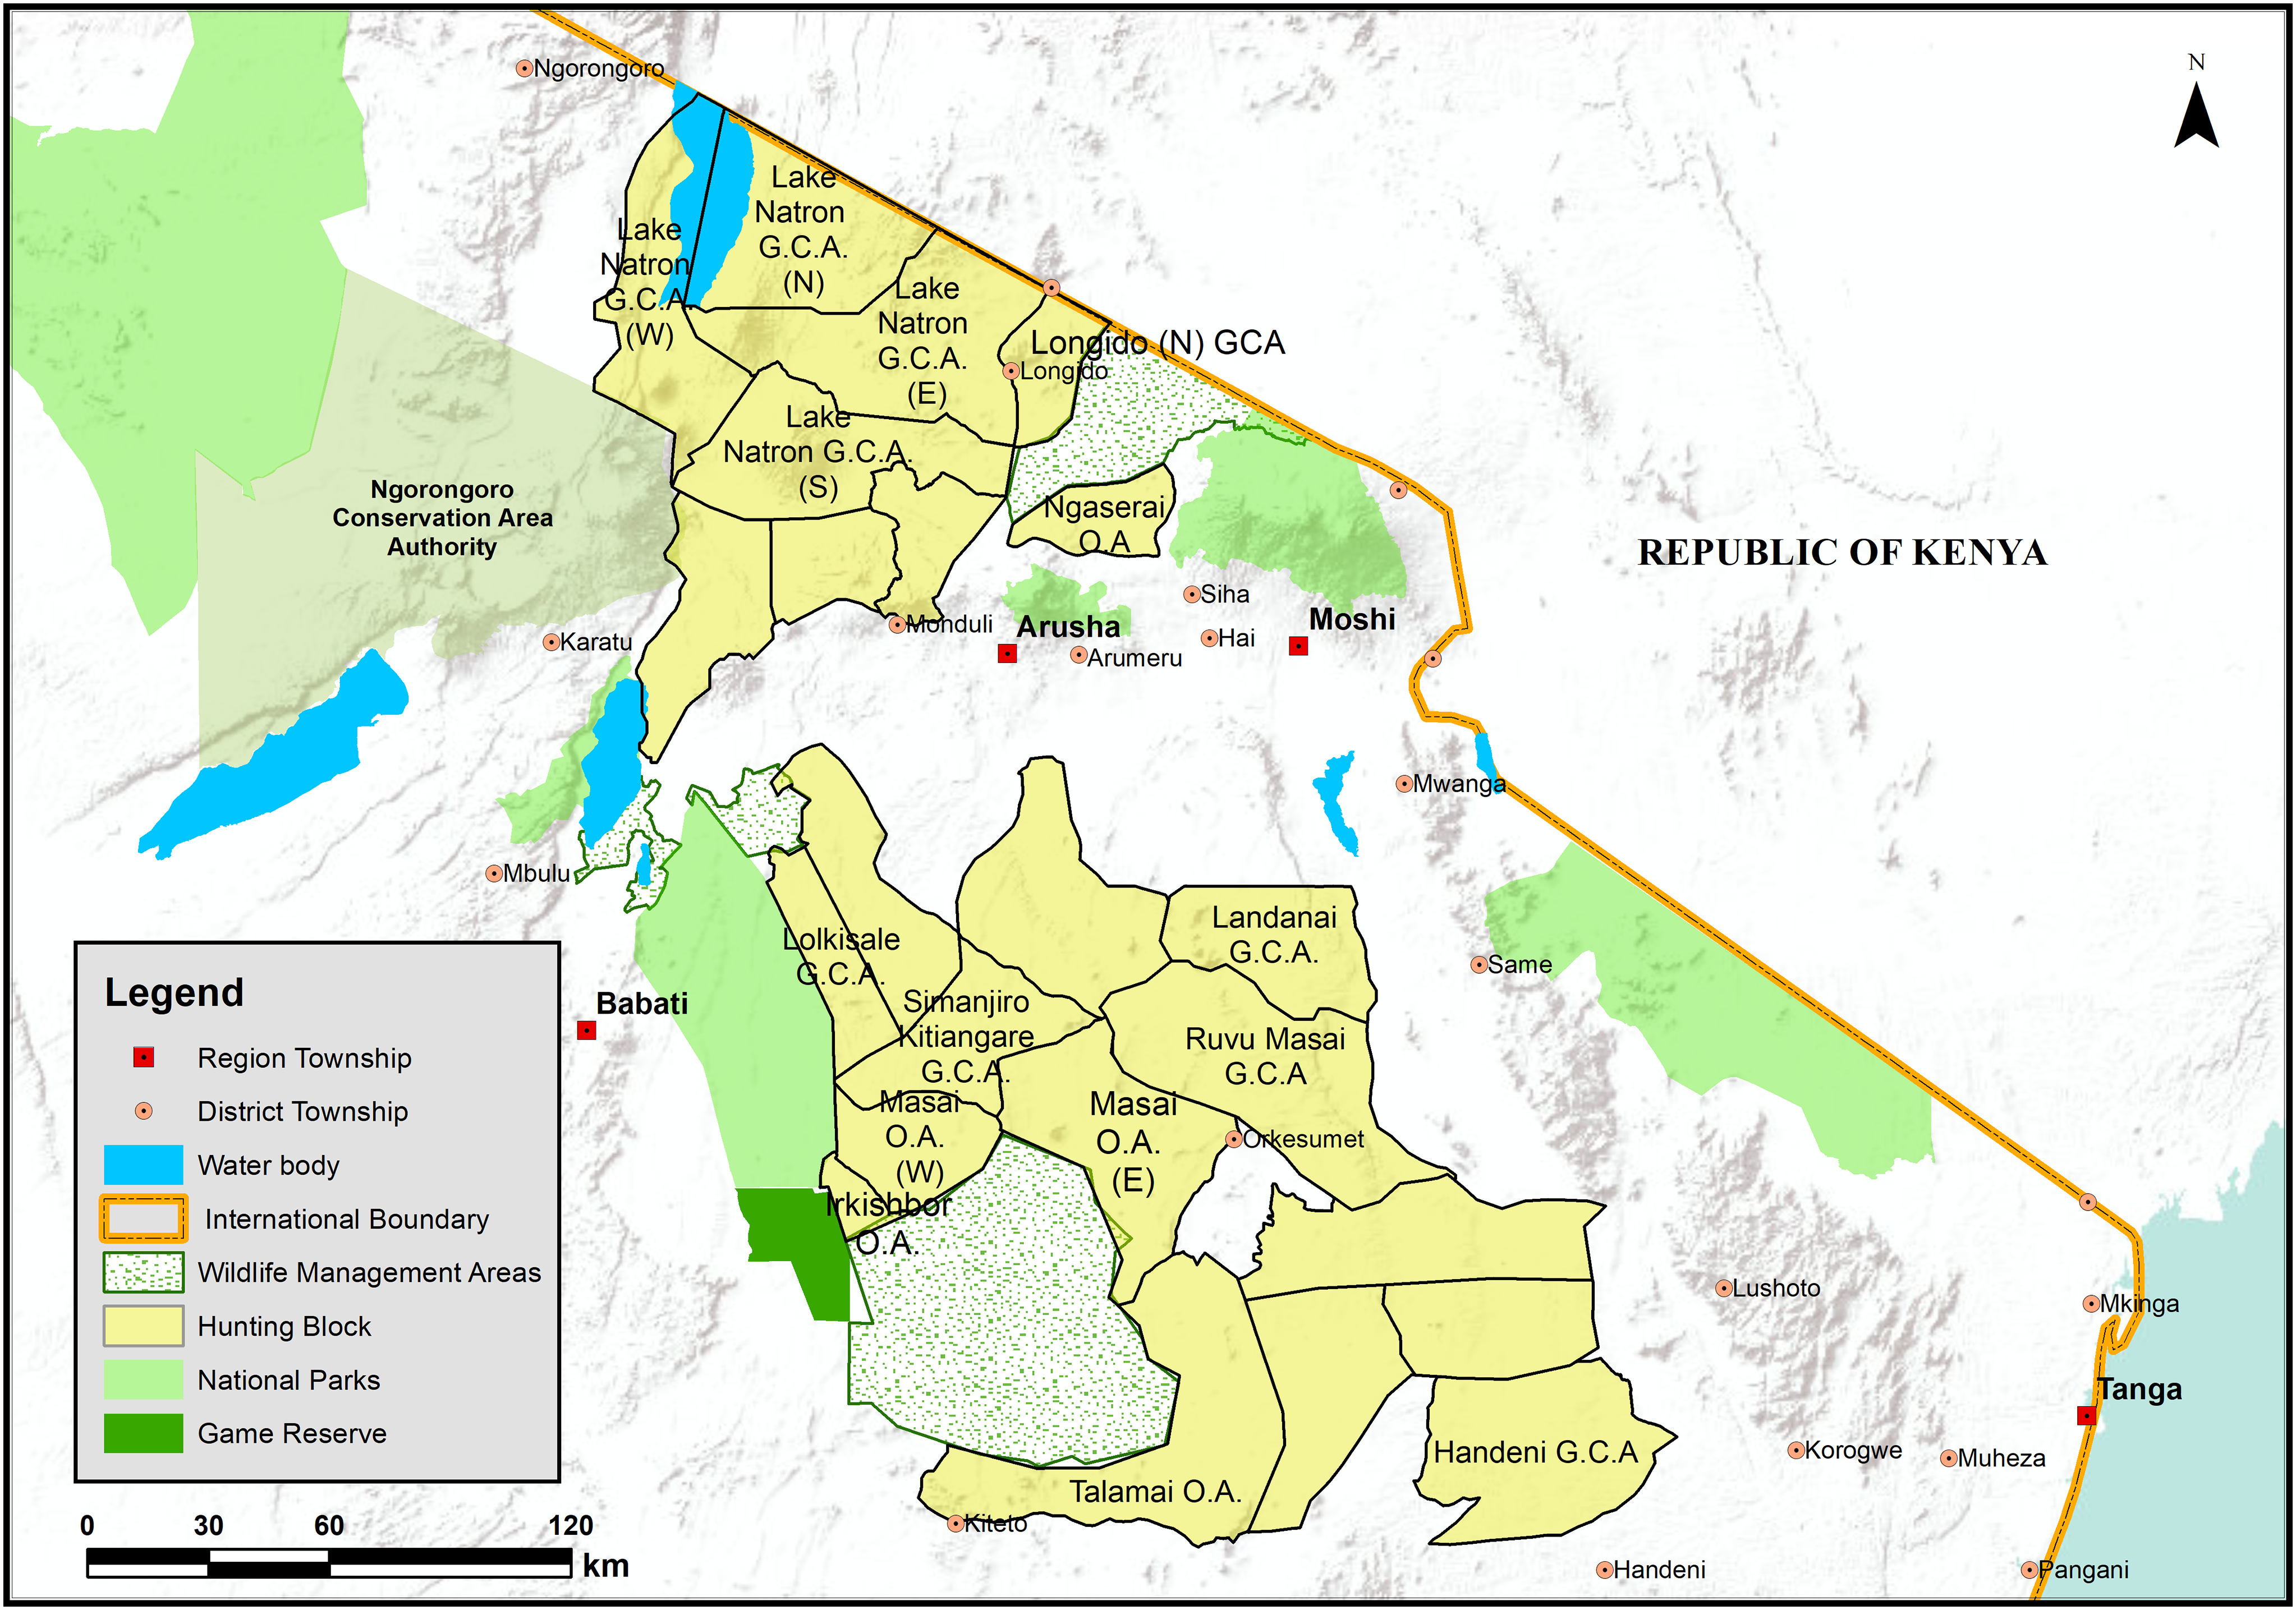
We focused on 15 hunting blocks, 10 located in GCAs and 5 in OAs, in northern Tanzania. These blocks are located within the semi-arid Maasai land ecosystems within Arusha and Manyara regions dominated by Acacia–Commiphora woodlands and grasslands, which are important for wildlife conservation and tourism (Fig. 1). Only the four Lake Natron GCA blocks were actively managed when TH operators abandoned concessions between 2014 and 2018, leaving the management of other blocks to the government, which has limited capacity and resources to ensure effective protection and management. Primary economic activities in the area include livestock production, agriculture and tourism (Mariki et al. Reference Mariki, Svarstad and Benjaminsen2015, Kicheleri et al. Reference Kicheleri, Treue, Nielsen, Kajembe and Mombo2018). Increasing human population density is driving land-use intensification: for instance, Manyara Region’s population density rose from 32 to 51 people/km2 and that of Arusha Region increased from 42 to 62 people/km2 between 2012 and 2022 (National Bureau of Statistics 2012, 2022).
Map of the study area in northern Tanzania encompassing parts of hunting blocks where trophy hunting is conducted in Game Controlled Areas (GCAs) and Open Areas (OAs).

Selection of hunting blocks
We purposively selected the 15 hunting blocks based on their conservation significance as key buffer zones or dispersal areas for game animals, particularly those serving as calving ranges for migratory wildlife from nearby PCAs. These blocks are important for maintaining regional biodiversity and hosting highly valued species such as lions and buffaloes (Kiffner et al. Reference Kiffner, Wenner, Laviolet, Yeh and Kioko2016), and they function as essential corridors for game species, enabling wet and dry season migration, especially for elephants, wildebeest (Connochaetes taurinus) and zebras (Martin et al. Reference Martin, Hardin, Jensen, Shoo, Kisingo, Durrant, Martin, Melubo, Jensen, Hadfield, Hardin and Weisler2020). Land-cover changes within these blocks may significantly impact habitat quality and animal movement patterns. An initial analysis across all 15 hunting blocks assessed the extent and shrinkage of functional (usable) area, especially along the edges affected by human encroachment, to identify broader trends in habitat availability and connectivity. However, due to logistical and financial constraints, as well as terrain and accessibility issues, it was not feasible to conduct detailed land-cover analyses across all hunting blocks. Therefore, to explore the potential drivers behind the observed functional area losses, we randomly selected a subset of three hunting blocks, namely Masai OA (East) (1888 km2), Irkishbor OA (208 km2) and Longido North GCA (589 km2), for detailed assessment. These blocks were analysed to better understand land-cover changes influencing game species’ habitat use.
Data acquisition and processing
We obtained hunting block boundary polygons, lines and point data from the Tanzania Wildlife Authority (TAWA) GIS Unit (www.tawa.go.tz). We also acquired Landsat 8 images from the United States Geological Survey (USGS), with 15-m panchromatic and 30-m multi-spectral spatial resolutions (https://earthexplorer.usgs.gov). The Landsat 8 images with high spatial resolution were appropriate as they aided in identifying, analysing and classifying natural habitat cover from human-modified habitats between 2013, 2019 and 2023 in hunting blocks (Erena & Yesus Reference Erena and Yesus2021). We selected images from 2013, 2019 and 2023 to quantify the distribution of different land-cover types with TH before, during and after the period of hunting block abandonment (2014–2018), when many TH operators left. We used these images to estimate land-cover changes over 2013–2023, 2013–2019 and 2019–2023. We obtained images for hunting blocks during the dry season to obtain a clear image of land-cover classes. We also used a supervised image classification technique to analyse the vegetation cover’s shape, tone, texture, size and relationship with other objects (Kija et al. Reference Kija, Ogutu, Mangewa, Bukombe, Verones and Graae2020). To increase accuracy, we merged subclasses with primary vegetation categories (Table S1). We grouped closed-canopy vegetation types such as thickets and riverine forests as dense vegetation, and we grouped open bushes and shrublands as mixed vegetation. We categorized areas dominated by grasses with minimal tree or shrub cover as grasslands. We grouped all human-made physical features, which are mostly unsuitable for wildlife use, such as buildings and croplands, under barren/built-up or croplands. Using ArcGIS, we calculated the percentage of each land-cover type in hunting blocks within GCAs and OAs using a tabulate intersection tool. To verify the classification of satellite images and ensure the reliability of the land-cover designation, we placed 30 training sites marked by GPS waypoints in each vegetation-cover type to validate the correct interpretation of data obtained from the satellite images, following Msigwa et al. (Reference Msigwa, Komakech, Verbeiren, Salvadore, Hessels, Weerasinghe and Griensven2019). We ensured that at least 50 m around each point represented homogeneous habitat. Finally, we used freely available 5-m spatial resolution imagery from Google Earth (http://www.google.com/intl/de/earth/) to visualize and confirm biophysical conditions and understand habitat changes.
Determination of game animal habitat changes
We analysed the percentage change in the functional (usable) area of each hunting block from 2013 to 2023 using a 50% threshold to identify significant land-cover changes, following Mtui et al. (Reference Mtui, Lepczyk, Chen, Miura and Cox2017) and Thonfeld et al. (Reference Thonfeld, Steinbach, Muro and Kirimi2020). We chose this threshold due to its ability to highlight significant habitat loss or degradation and changes in connectivity, which are detrimental to wildlife conservation and TH operations (Kija et al. Reference Kija, Ogutu, Mangewa, Bukombe, Verones and Graae2020). Dividing the timeline helped us to evaluate how land cover changed during the years without TH operations when active management was lacking (2014–2018) and whether habitat loss and shrinkage of usable area increased, decreased or stayed the same over time. We used observations of spectral characteristics within hunting blocks to determine the size of different land-cover types suitable for game animals such as zebra, wildebeest, impala and buffalo (Table S2). We calculated the percentage rate of land-cover change within hunting blocks using Equation 1 (Duraisamy et al. Reference Duraisamy, Bendapul and Jadhau2018):
 $$\eqalign{{\rm{Change}}\;{\rm{rate}}\;\left( \% \right) & = {{{\rm{Area}}\;{\rm{of}}\,{\rm{final\,}}\;{\rm{year}}\; - \;{\rm{Area}}\;{\rm{of}}\;{\rm{initial}}\;{\rm{year}}} \over {{\rm{Area}}\;{\rm{of}}\;{\rm{initial}}\;{\rm{year}}\;}}\;\times \;{\rm{100}}}$$
Image accuracy assessment
For the accuracy assessment of the 2013, 2019 and 2023 Landsat images, we used four standard parameters: user accuracy, producer accuracy, overall accuracy and Kappa coefficients (K^). We used these metrics to compare the observed vegetation-cover classes with chance agreement using Equation 2, following Lillesand et al. (Reference Lillesand, Kiefer and Chipman2015). K^ measures the degree of agreement between the classification and reference data, adjusted for chance, and it ranges from 0 (no agreement) to 1 (perfect agreement; Mtui et al. Reference Mtui, Lepczyk, Chen, Miura and Cox2017):
 $${\rm{K^\wedge}} = {{\rm{P}}_{\rm{o}}} - {{{{\rm{P}}_{\rm{e}}}} \over {\left( {1 - {{\rm{P}}_{\rm{e}}}} \right)}}$$
where ${\rm{P_o}}$
is the observed agreement and Pe is the expected/change agreement.
${\rm{P_o}}$
is the observed agreement and Pe is the expected/change agreement.
Overall accuracies for the 2013, 2019 and 2023 land-cover imagery exceeded 80%, with Kappa coefficients indicating strong agreement between the classified and reference data (Table S3). Producer and user accuracies were also above 75% across all maps (Table S4), confirming the reliability of the classifications (Rwanga & Ndambuki Reference Rwanga and Ndambuki2017).
Results
Functional area losses in hunting blocks (2013–2023)
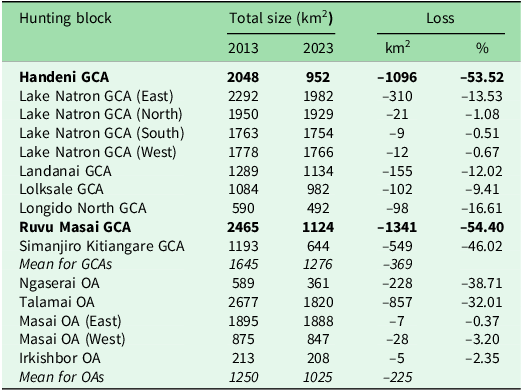
Between 2013 and 2023, 11 out of the 15 examined hunting blocks in northern Tanzania experienced substantial declines in functional (usable) area for game animals within their fixed legal boundaries. In these cases, formerly large and continuous vegetation areas changed into smaller, more isolated patches, reducing the effective habitat availability (Table 1). Contrary to expectations, functional area in GCA hunting blocks decreased by c. 22.4% from 16 452 km2 in 2013 to 12 739 km2 in 2023. This corresponds to a mean functional area loss of 369 km2 per block over the 10-year period. In comparison, the functional area in OAs declined by 18.0%, from 6249 to 5124 km2, with the mean area loss being 225 km2 per block during the same period (Table 1). Some GCAs, including Ruvu Masai and Handeni hunting blocks, experienced losses exceeding 50% between 2013 and 2023.
The functional (usable) area of the hunting blocks and the percentage of the area lost along the border due to human land use, thereby fragmenting game animal habitats in northern Tanzania between 2013 and 2023. Italic rows show the mean (average) values for all Game Controlled Areas (GCAs) and Open Areas (OAs), respectively, and bold rows highlight hunting blocks that experienced losses exceeding the 50% loss threshold.

Habitat and land-cover changes in hunting blocks
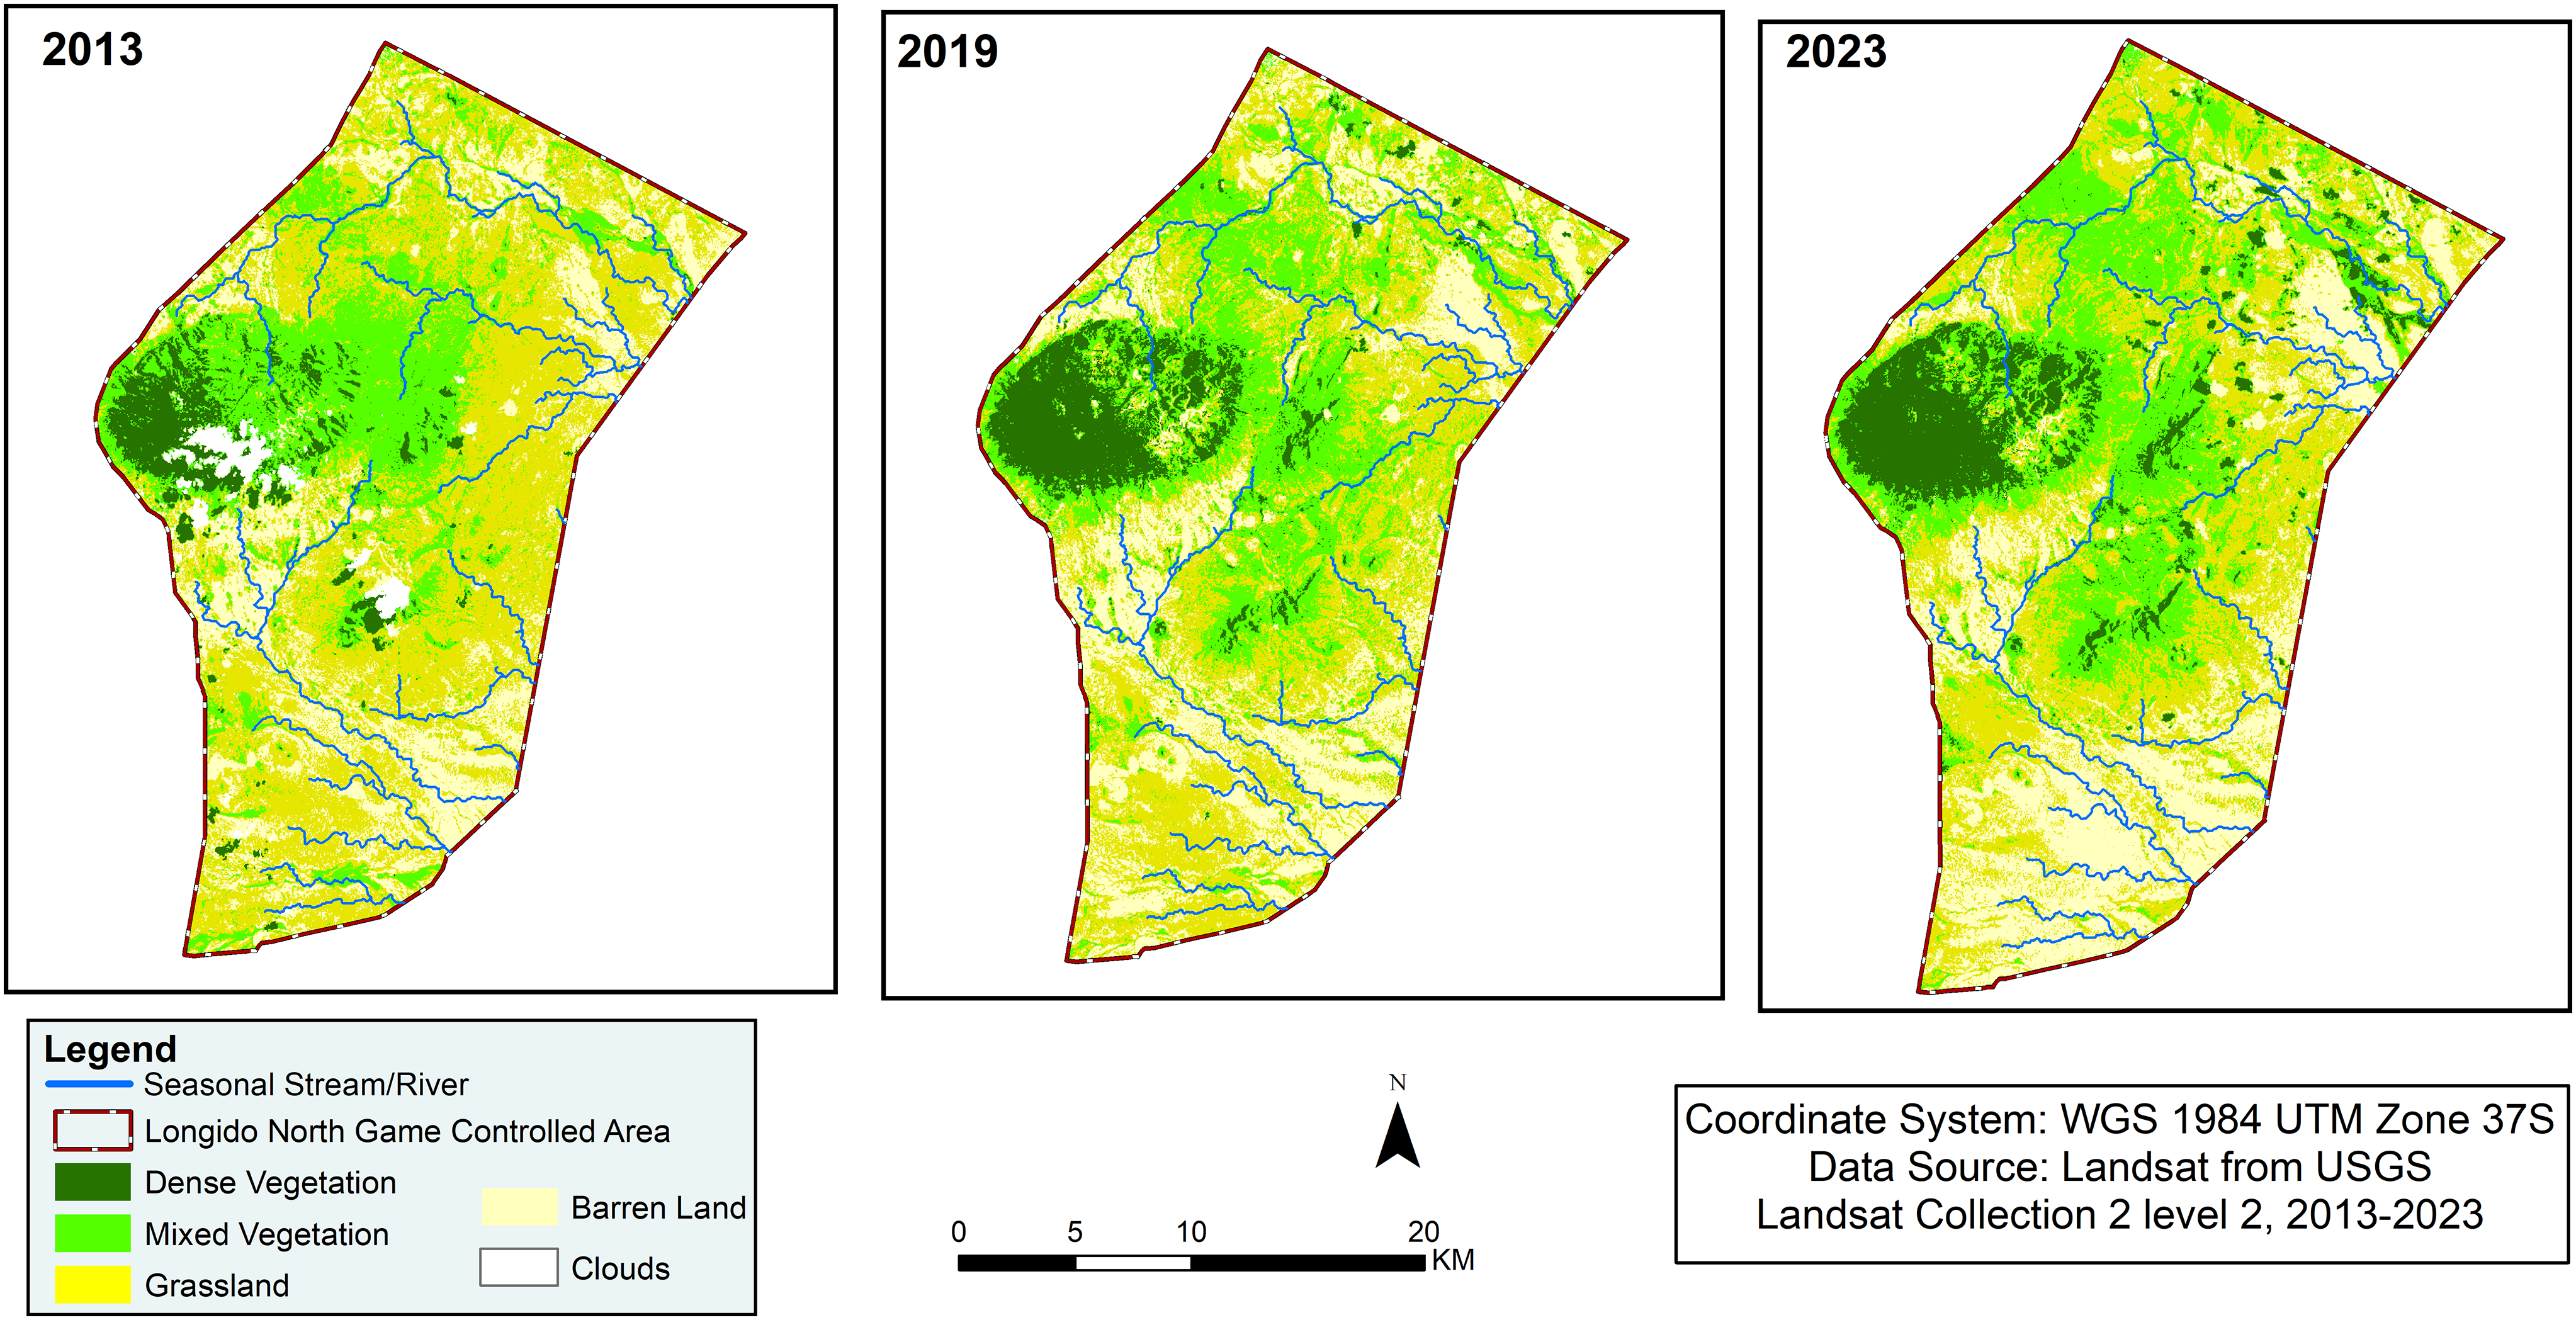
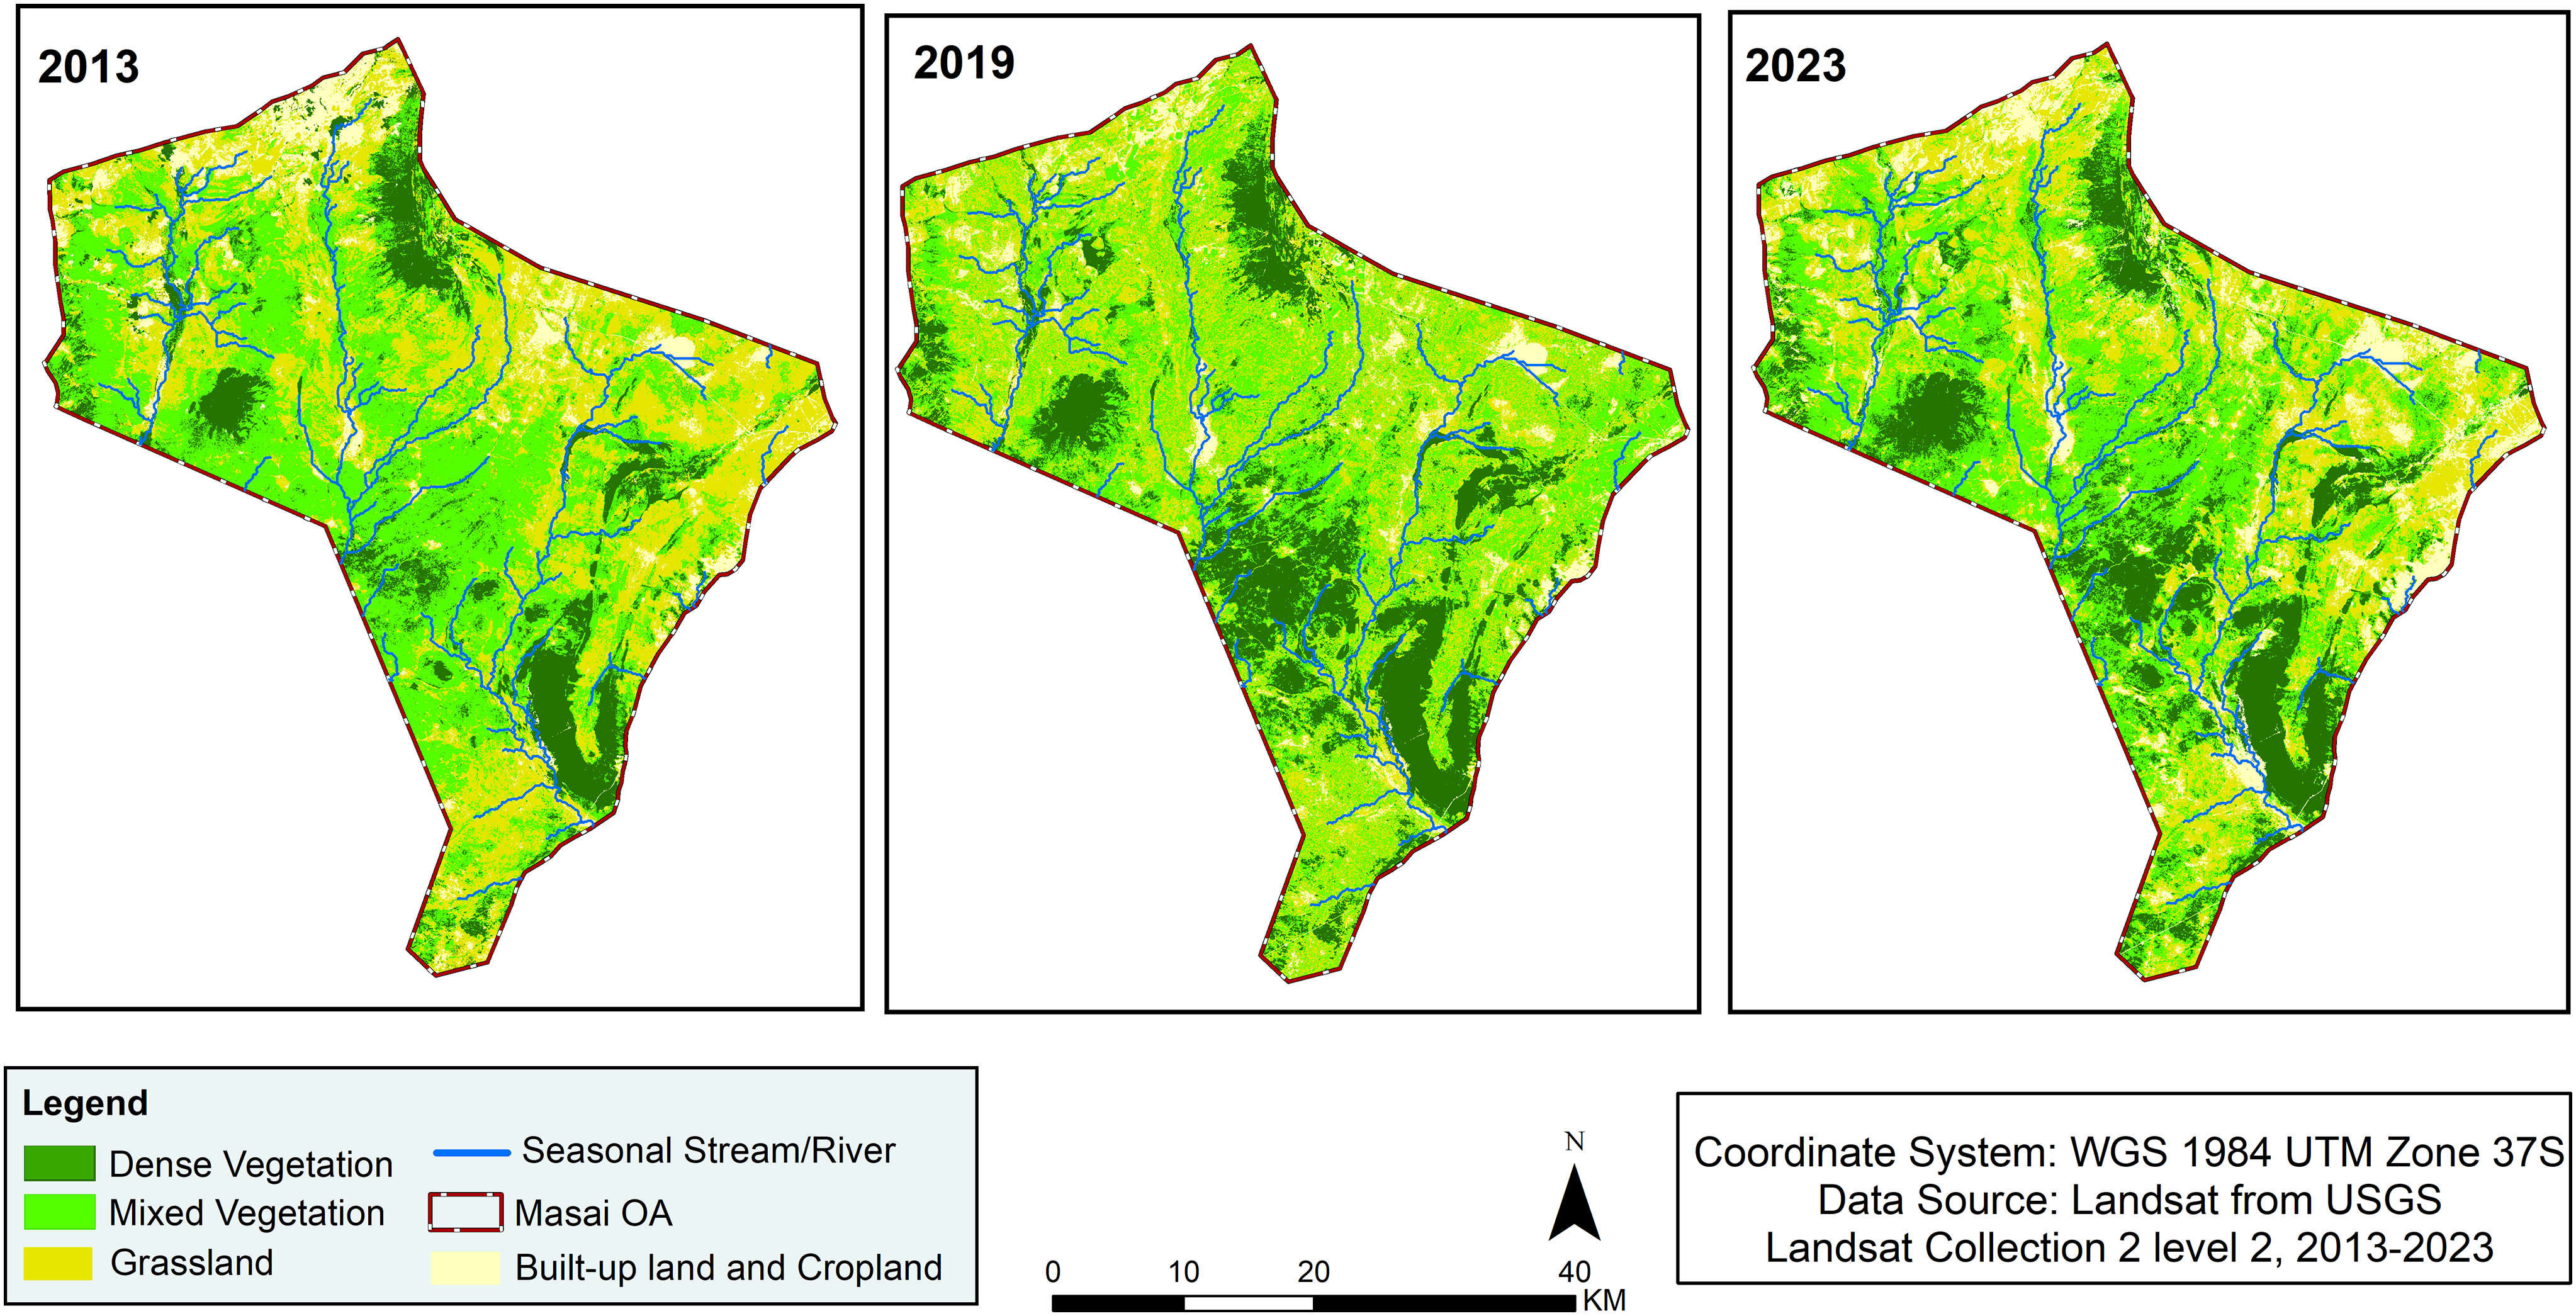
Over 2013–2023, substantial land-cover changes occurred across the study area, with varying patterns among the three hunting blocks (Table S5). Longido North GCA experienced a substantial increase (76%) in dense vegetation, exceeding the 50% threshold. In contrast, Masai OA (East) experienced a 40% decline in dense vegetation, alongside notable 46% increases in built-up areas and croplands, leading to functional area losses. Irkishbor OA exhibited relatively stable conditions, with only minor land-cover changes. However, even these minor land-cover changes contributed to reductions in the functional area available for wildlife within the hunting block (Tables 1 & S5).
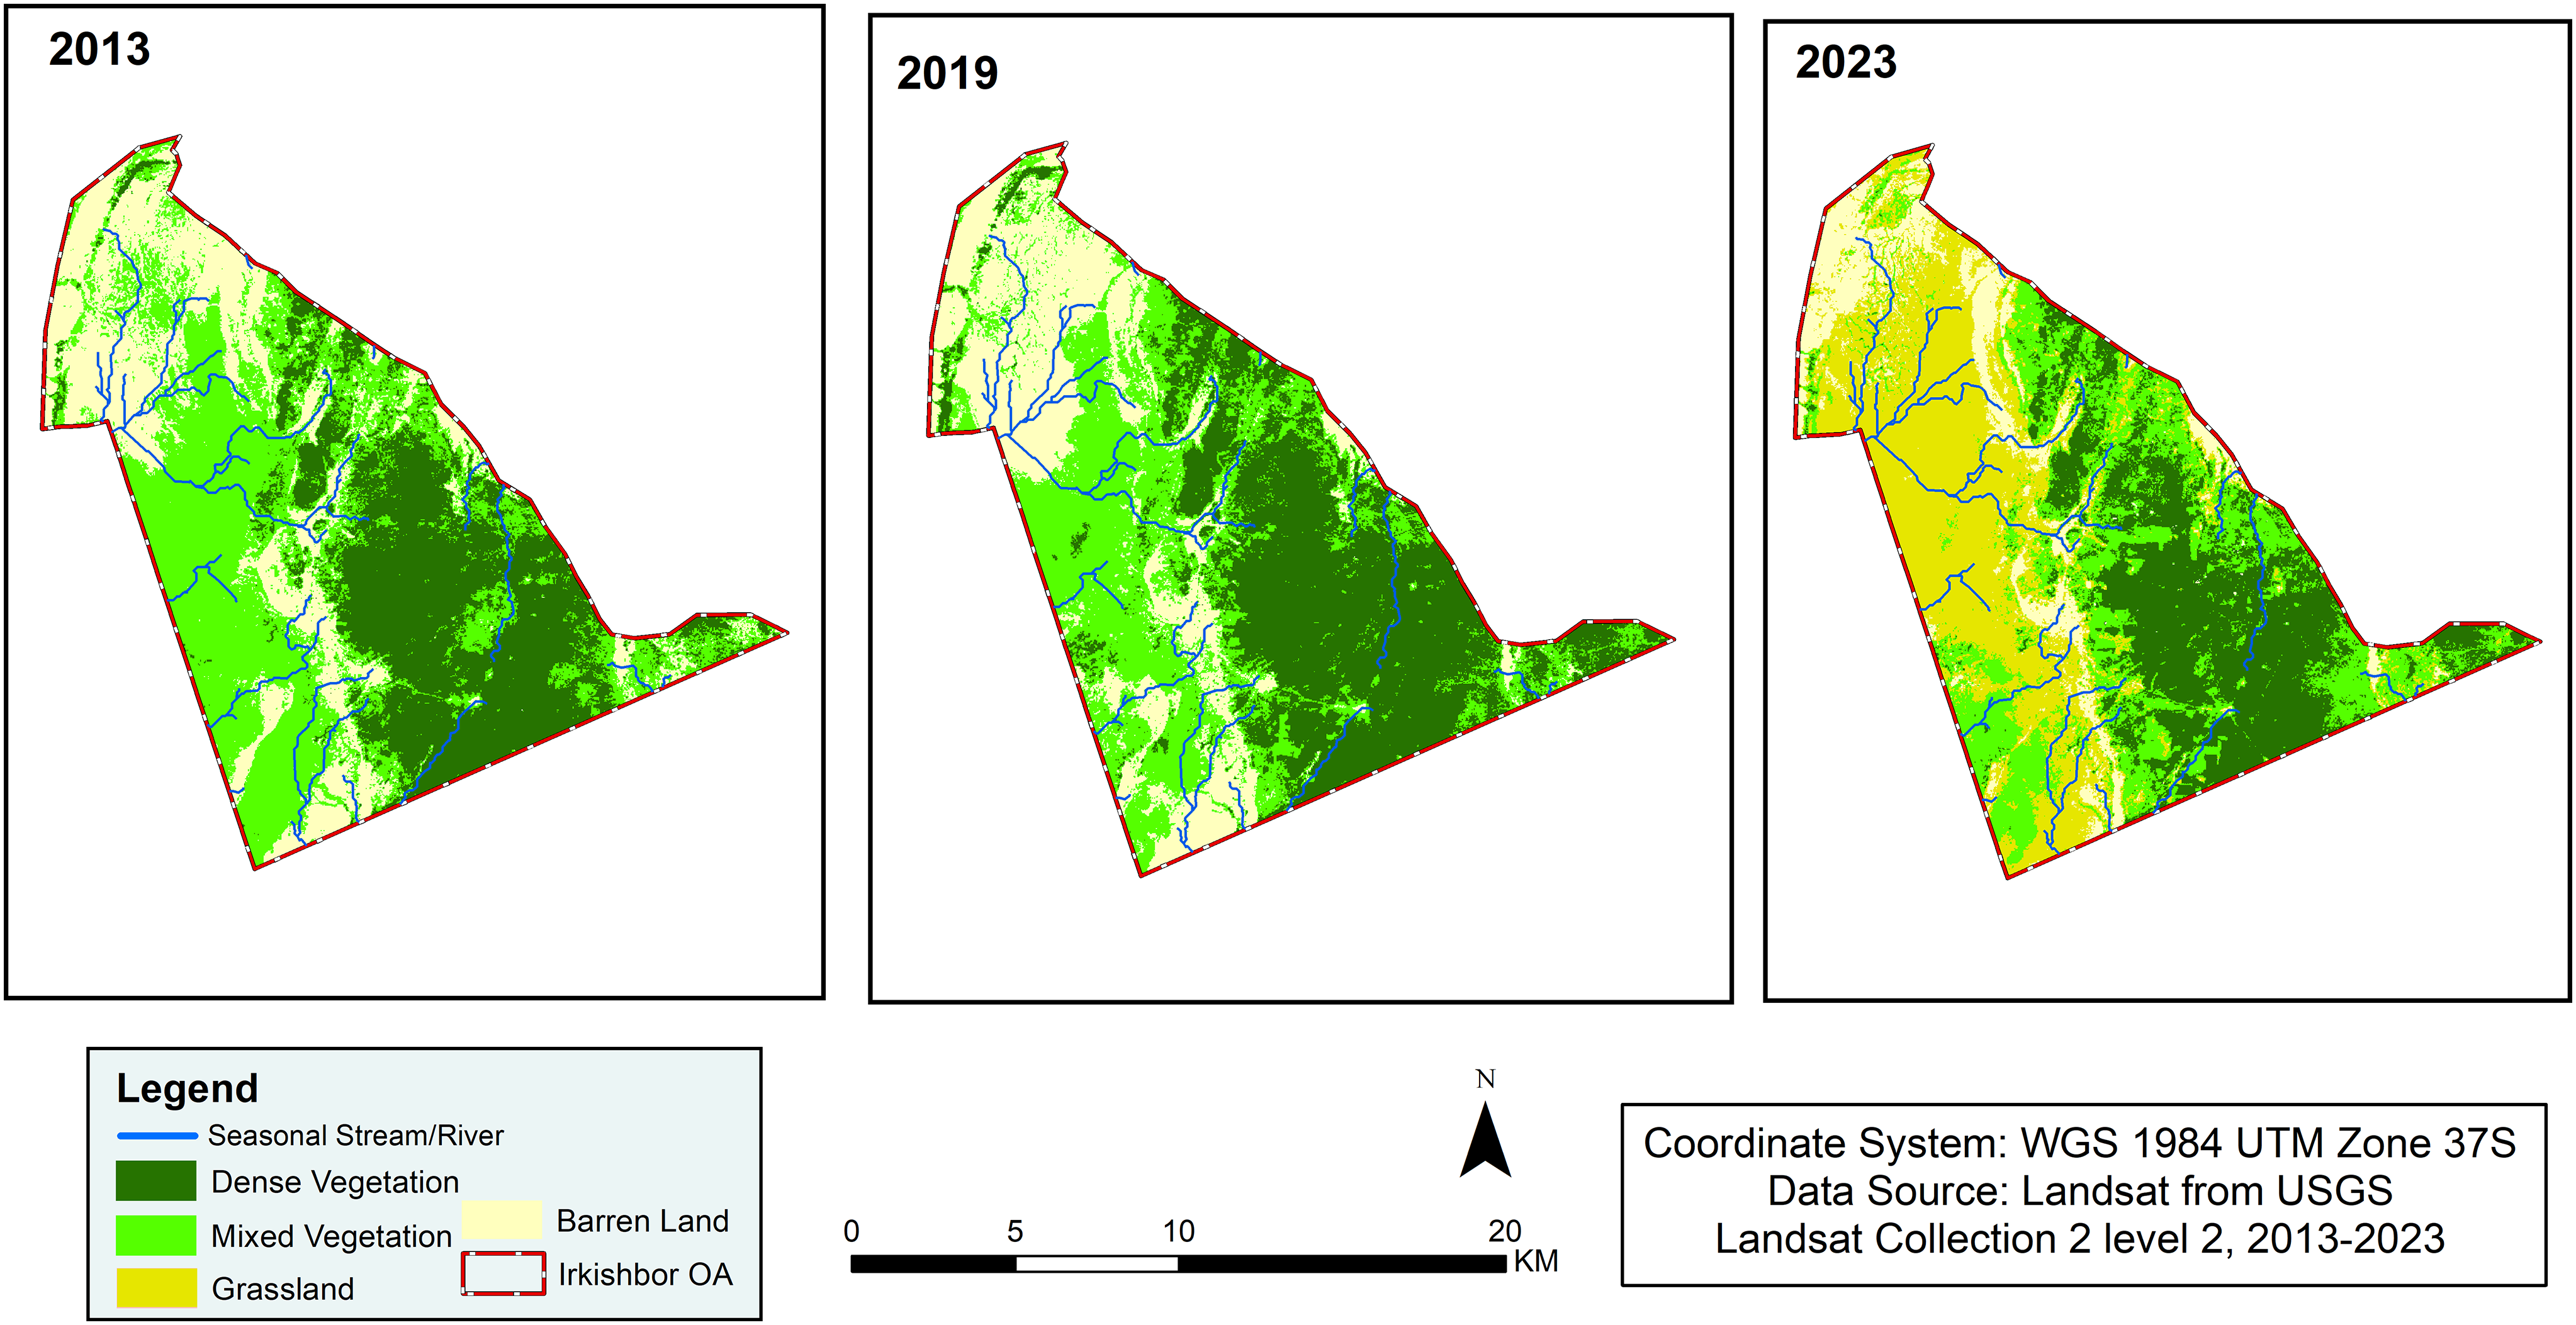
During both the 2013–2019 and 2019–2023 periods, land-cover changes in Longido North GCA, Masai OA (East) and Irkishbor OA hunting blocks remained below the 50% threshold, indicating less significant changes. For example, from 2013 to 2019, Longido North GCA grassland declined from 50% to 40%, while built-up/cropland areas increased from 21% to 25% (Fig. 2). In Masai OA, mixed vegetation dropped from 43% to 33%, and built-up areas doubled from 8% to 16% (Fig. 3). Irkishbor OA saw a decrease in mixed vegetation from 43% to 33%, accompanied by increases in dense vegetation and expansions of barren land (Fig. 4).
Distribution of land-cover types and their respective changes in size between 2013, 2019 and 2023 in Longido North Game Controlled Area (GCA).

Distribution of land-cover types and their respective changes in size between 2013, 2019 and 2023 in Masai Open Area (OA).

Distribution of land-cover types and their respective changes in size between 2013, 2019 and 2023 in Irkishbor Open Area (OA).

From 2019 to 2023, further changes occurred. Grassland in Longido North GCA declined to 37%, whereas mixed and dense vegetation slightly increased in elevated areas (Figs 5 & S1). In Masai OA, mixed vegetation recovered to 38%, and built-up land stabilized at 16% (Figs 3 & S2). In Irkishbor OA, grassland expanded to 36%, reducing mixed vegetation, especially along the western boundary adjacent to the Mkungunero Game Reserve (Figs 1 & 4).
Discussion
Contrary to our initial hypothesis, some legally protected GCAs, such as Ruvu Masai and Handeni, experienced greater losses in functional area than unprotected OAs. This suggests that legal designation alone did not ensure effective conservation. Habitat degradation appeared more associated with land conversion for agriculture, settlement and grazing, which reduced habitat quality and disrupted connectivity with nearby PCAs where TH is not conducted. These findings align with previous studies documenting habitat degradation within GCAs, emphasizing enforcement and local governance roles in conservation (Nzunda & Midtgaard Reference Nzunda and Midtgaard2019, Gizachew et al. Reference Gizachew, Rizzi, Shirima and Zahabu2020). However, the limited data on enforcement and management capacity constrain our ability to attribute habitat loss solely to protection status across all of the blocks we examined. Research that specifically evaluates relationships between enforcement, management capacity and habitat could help inform sustainable management of land for wildlife in northern Tanzania.
Variability in functional area loss across blocks highlights persistent challenges related to enforcement capacity, resource limitations and local socio-economic pressures (Booth Reference Booth2017, Kideghesho et al. Reference Kideghesho, Kimaro, Mayengo and Kisingo2021). For instance, in Lake Natron GCA, which benefits from Ramsar designation, regulated TH and community engagement seem to have helped retain more functional area, sustaining key breeding grounds for lesser flamingo (Phoeniconaias minor) populations despite regional pressures (Yona et al. Reference Yona, Makange, Moshiro, Chengula and Misinzo2022). In contrast, blocks with intermittent or absent TH operations, such as Ruvu Masai and Handeni, remain vulnerable to degradation, consistent with patterns observed in other regions of Tanzania (Musika et al. Reference Musika, Wakibara, Ndakidemi and Treydte2022, Strampelli et al. Reference Strampelli, Henschel, Searle, Macdonald and Dickman2022). Although our data do not allow for causal inference or direct assessment of enforcement efforts, the observed contrast between actively and passively managed blocks suggests that sustained management presence may influence habitat suitability.
Topography appears to shape patterns of habitat degradation and land-cover changes within hunting blocks. In Longido North GCA, for example, mountainous terrain may help limit human encroachment and facilitate vegetation recovery, potentially providing seasonal refuge for species such as elephants, leopards and other forest-dependant wildlife (Fig. S1). Similar elevation buffering effects have also been noted in Tanzania’s Usambara highlands and South Korea’s Jeju Island (Lugazo & Mushy Reference Lugazo and Mushy2018, Kim et al. Reference Kim, Choi, Shin, Yun and Song2022). Conversely, fertile lowland and riverine areas, such as those in Masai OA, are more accessible and prone to cultivation and livestock grazing, thereby degrading breeding and foraging grounds for plains game such as gazelles and zebras (Bowker et al. Reference Bowker, Vos, Ament and Cumming2017, Capitani et al. Reference Capitani, van Soesbergen, Mukama, Malugu, Mbilinyi and Chamuya2019, Martin et al. Reference Martin, Hardin, Jensen, Shoo, Kisingo, Durrant, Martin, Melubo, Jensen, Hadfield, Hardin and Weisler2020). These contrasts suggest that both topography and management may shape habitat vulnerability, underscoring the need for site-specific strategies. To address such vulnerabilities, community-based land management, particularly in high-pressure lowland areas, may offer viable pathways to balance biodiversity conservation and local livelihoods (Leweri et al., Reference Leweri, Bartzke, Msuha and Treydte2022, Sibanda et al. Reference Sibanda, Dickman, Hughes, Tacey, Madsen and Mandoloma2025).
Moreover, proximity to formal PCAs may help buffer adjacent areas, potentially through spillover effects (Komba et al. Reference Komba, Watanabe, Kaneko and Chand2021). In our study, Irkishbor OA, which boarders the Mkungunero Game Reserve and Tarangire National Park, maintained higher land-cover stability than Masai OA (East), despite both being located in the rapidly growing Simanjiro District (in which the human population increased from 178 693 people in 2012 to 291 169 people in 2022; National Bureau of Statistics 2022). This contrast demonstrates the potential of PCAs to influence surrounding land uses by deterring encroachment or enabling ecological connectivity (Gizachew et al. Reference Gizachew, Rizzi, Shirima and Zahabu2020), reinforcing the case for integrated landscape-level planning across both protected and unprotected habitat zones.
The expansion of settlement and cropland in Masai OA (East) probably threatens wildlife corridors for game species such as elephants, consistent with Riggio & Caro (Reference Riggio and Caro2017), who link such land-cover changes to increased genetic isolation. These disruptions not only reduce functional (usable) area but also tend to heighten human–wildlife conflicts (Mariki et al. Reference Mariki, Svarstad and Benjaminsen2015), which can erode local community support for wildlife conservation and TH. This suggests that managing land-use expansion and mitigating conflicts are key for maintaining both biodiversity and sustainable conservation practices in these areas. Again, this calls attention to the importance of understanding the human dimensions of conservation decisions and of co-producing land-use plans with people who live and work in areas that are important for wildlife.
Limitations arise from using land cover as an indirect proxy for habitat quality without direct species abundance data. This approach may underestimate impacts such as poaching, which remains a major driver of wildlife declines in the region (Rija Reference Rija2022). Additionally, satellite imagery often misses small-scale or seasonal disturbances such as localized grazing, which can influence habitat suitability for game species (Riggio & Caro Reference Riggio and Caro2017). Despite these limitations, our core findings are supported by field validation (Msigwa et al. Reference Msigwa, Komakech, Verbeiren, Salvadore, Hessels, Weerasinghe and Griensven2019).
We emphasize that continued functional area loss, particulalry in GCAs, highlights the urgency of targeted, site-specific conservation strategies. Strengthening habitat and wildlife monitoring can support adaptive management, especially in areas vulnerable to degradation. Moreover, protecting both GCAs and OAs is essential to maintaining landscape connectivity, facilitating genetic flow and sustaining viable game populations (Riggio & Caro Reference Riggio and Caro2017). Achieving these goals requires intergrated regional planning that combines enforcement, robust ecological data and active stakeholder engagement, ultimately reinforcing habitat protection and promoting sustainable land uses, including TH, across northern Tanzania.
Conclusion
This study reveals substantial functional area loss across northern Tanzania’s hunting blocks, especially in GCAs, largely driven by expanding agriculture, settlements and unregulated grazing. Blocks lacking effective oversight or management are especially at risk of habitat degradation. Legal protection alone is insufficient to maintain habitat integrity, and sustained conservation outcomes will require active, locally tailored management embedded within broader, coordinated planning frameworks. Such approaches are essential to preserving ecosystem function and retaining the viability of TH as a conservation tool, which also relies on social acceptability, both locally and internationally, amidst growing scrutiny and ethical debate.
Supplementary material
To view supplementary material for this article, please visit https://doi.org/10.1017/S0376892925100246.
Acknowledgements
We thank the editor and two anonymous reviewers for their valuable comments and suggestions. We are also grateful to Shija Mihumo of the Tanzania Wildlife Management Authority for his technical support with ArcGIS.
Author contributions
Study conceptualization, data analysis and writing: SK; revision: all authors critically reviewed and edited the manuscript and gave final approval for publication.
Financial support
The Weatherby Foundation International provided financial support to SK.
Competing interests
The authors declare none.
Ethical standards
Not applicable.


 Open access