





Introduction
Colorectal cancer is the second leading cause of cancer-related mortality worldwide, with an estimated 1.9 million new cases and 904,000 deaths in 2022 (Bray et al. Reference Bray, Laversanne and Sung2024). In Australia, colorectal cancer is responsible for nearly 5,300 deaths each year (Cancer Australia 2024). Advances in cancer treatment have extended survival duration, while simultaneously highlighting the importance of symptom control and better quality of life near the end-of-life (Costi et al. Reference Costi, Leonardi and Zanoni2014). Yet evidence consistently indicates that patients continue to receive potentially burdensome care at the end-of-life (Hu et al. Reference Hu, Yasui and White2014; Mitchell et al. Reference Mitchell, Delaney and Arnolda2024).
Indicators of potentially burdensome end-of-life care, such as multiple hospitalizations, intensive care unit (ICU) admissions, emergency department (ED) visits, or chemotherapy in the final week of life, are important as they may reflect care that offers limited clinical benefit, can negatively impact quality of life, and is often expensive and in limited supply. Despite growing attention, limited Australian evidence exists that examines indicators of potentially burdensome care at end-of-life, particularly for colorectal cancer populations (Mitchell et al. Reference Mitchell, Delaney and Arnolda2024). Previous studies have examined mixed cancer cohorts (Abdel-Razeq et al. Reference Abdel-Razeq, Shamieh and Abu-Nasser2019; Allende-Pérez et al. Reference Allende-Pérez, Valdés-Flores and Rodríguez-Mayoral2024; Boddaert et al. Reference Boddaert, Fransen and de Nijs2024), but colorectal cancer-specific studies on potentially burdensome end-of-life care are limited, despite the distinct disease trajectory of colorectal cancer (Hu et al. Reference Hu, Yasui and White2014). Palliative care is defined as a person-centered approach that aims to improve the quality of life and alleviate suffering for patients with serious illnesses (Rome et al. Reference Rome, Luminais and Bourgeois2011). High-quality palliative care is essential for reducing unnecessary hospitalizations or interventions and aligning care with patient values and preferences (Rome et al. Reference Rome, Luminais and Bourgeois2011).
Understanding how patient, disease, and health system characteristics could influence potentially burdensome end-of-life care within the Australian context is critical to enhancing the quality of end-of-life care delivery for colorectal cancer populations (Mitchell et al. Reference Mitchell, Delaney and Arnolda2024). This study aims to examine factors associated with indicators of potentially burdensome end-of-life care among people who died from colorectal cancer and received hospital-based care in New South Wales (NSW), Australia.
Methods
Study design
A retrospective cohort study of people who had an underlying cause of death from colorectal cancer in NSW, Australia, during 2014–2019. Mortality data were linked to hospital and cancer registry records for 12 months prior to the date of death. The reporting methods were guided by the STROBE checklist (Cuschieri Reference Cuschieri2019).
Data sources and record linkage
Data were obtained from the NSW Cancer Registry, ED presentations and hospital admissions in NSW, nonadmitted patient records, and the NSW Registry of Births, Deaths and Marriages and the Cause of Death Unit Record File (COD-URF). Extracts from these datasets were linked by the Centre for Health Record Linkage (CHeReL) using probabilistic linkage. Probabilistic linkage uses multiple identifiers to estimate whether records from different datasets belong to the same individual when no unique identifier exists (Blake et al. Reference Blake, Sharples and Harron2021). Record groups with linkage probabilities between 0.25 and 0.75 underwent clerical review to ensure accuracy.
Hospital records were sourced for nonadmitted patient services, ED presentations, and hospital admissions across NSW. The nonadmitted patient records identified chemotherapy and radiotherapy services at public hospitals. These data were only available from 2016 to 2019 and included information on patient demographics, service type, mode of contact (e.g. in-person, videoconference), and service provider. Records without any client contact were excluded.
ED presentations to public hospitals in NSW included details on arrival and departure times, visit type, and separation outcome. Hospital admissions across all public and private hospitals in NSW contained information on principal and additional diagnoses, clinical procedures, and separation type, including transfer to another facility or death. Hospital admission diagnoses were classified according to the International Classification of Diseases, 10th Revision, Australian Modification (ICD-10-AM). Mortality data included date of death and up to 20 antecedent underlying causes of death classified using the International Classification of Diseases, 10th Revision (ICD-10).
The NSW Cancer Registry contains notifications of people with cancer in NSW (except for nonmelanoma skin cancer) and was used to identify prior history of cancer, date of diagnosis, spread at diagnosis, and place of death. NSW Cancer Registry data were provided from 1972 to 2019.
Case inclusion criteria
Adults aged ≥20 years whose underlying cause of death was colorectal cancer (ICD-10: C18–C20) in the COD-URF in NSW, Australia, between 1 January 2014 and 31 December 2019 were included. Patients were excluded if they died within 30 days of diagnosis or had a primary cause of death not attributed to colorectal cancer.
Residents of aged care and place of death
Patients living in residential aged care during their final hospital admission were identified using hospital record information such as separation mode, source of referral, and financial class. Deaths occurring in acute care were identified using admission and separation dates, date of death, and separation mode recorded in hospital admission data. Deaths in the ED were identified using separation mode. For individuals who did not use hospital services, place of death was taken from the NSW Cancer Registry.
Palliative or hospice care
Palliative or hospice care was identified using any data items in hospital admission records that indicated palliative or hospice care (i.e. episode of care type, service-related group, unit type on admission, peer-group, facility type, separation mode) or an additional diagnosis in up to 50 diagnosis codes of palliative care (ICD-10-AM: Z51.5).
Intensive care unit admissions and mechanical ventilation
Hospital admission records identify hours in an ICU, which were categorized as ICU admission (Y/N). Hours on mechanical ventilation are recorded in hospitalization records and were categorized as mechanical ventilation (Y/N).
End-of-life care indicators
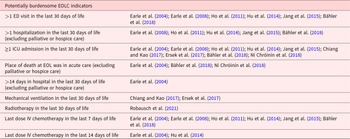
The indicators of potentially burdensome end-of-life care for colorectal cancer patients were identified from the literature and where the indicators could be identified in population-based administrative health data collections in NSW (Table 1). A composite measure of potentially burdensome end-of-life care was defined as having at least one of the following: >1 ED presentation, >1 hospital admission, ≥1 ICU admission, or death in acute care in the last 30 days of life (Earle et al. Reference Earle, Park and Lai2003; Hu et al. Reference Hu, Yasui and White2014; Mitchell et al. Reference Mitchell, Delaney and Arnolda2024). The composite measure was categorized as: no indicator, 1 indicator, or 2 or more indicators of potentially burdensome end-of-life care.
Indicators of potentially burdensome end-of-life care that could be identified in population-based administrative health data collections

Table 1 Long description
The table lists indicators that population-based administrative health data can use to flag potentially burdensome care near the end of life. Utilization indicators include more than one emergency department visit in the last 30 days of life and more than one hospitalisation in the last 30 days, excluding palliative or hospice care. Intensive treatment indicators include at least one ICU admission in the last 30 days and mechanical ventilation in the last 30 days. Location and time-in-hospital indicators include death occurring in acute care (excluding palliative or hospice care) and spending more than 14 days in hospital during the last 30 days, again excluding palliative or hospice care. Cancer-treatment timing indicators include radiotherapy in the last 30 days and intravenous chemotherapy given very close to death, within the last 7 days or within the last 14 days. Each indicator is paired with citations showing it has been used in prior studies, but the table does not provide rates, counts, or thresholds beyond the time windows. Interpretation should consider that administrative records may not capture patient preferences, clinical appropriateness, or palliative intent consistently across settings.
Identification of comorbidities
The Charlson comorbidity index (Quan et al. Reference Quan, Li and Couris2011) was used to identify comorbidities using up to 50 diagnosis classifications in hospitalization records using ICD-10-AM codes with a 1-year lookback from the date of death. Charlson comorbidities excluding malignancies were categorized as 0, 1, or ≥2 comorbidities. Comorbid conditions related to mental health (ICD-10-AM: F00–F99) and tobacco use (ICD-10-AM: F17.0–F17.9, P04.2, T65.2, Z58.7, Z71.6, Z72.0, Z81.2, Z86.43) were also identified using hospital diagnosis records.
Socioeconomic status and geographic location
Socioeconomic disadvantage was measured using the index of relative socioeconomic disadvantage from Socio-Economic Indexes for Areas (ABS 2011a) and Statistical Area Level 2 (SA2) of residence in hospital or NSW Cancer Registry records. Scores were grouped into quintiles (1 = most disadvantaged to 5 = least disadvantaged). The quintiles are derived from Australia’s population census using information including education, employment, occupation, and income. Geographic location was determined using the Australian Statistical Geography Standard Remoteness Areas (ABS 2011b) or SA2 of residence in hospital or NSW Cancer Registry records. These were categorized as urban (major cities) and rural (inner regional, outer regional, remote, very remote) based on distance to service centers.
Chemotherapy and radiotherapy
Chemotherapy administered in the hospital was identified from hospital records using a principal diagnosis of cancer (ICD-10-AM: C00–C96, D45–D47.5) and procedure block codes 1920 (“administration of pharmacotherapy”) or 1922 (“other procedures related to pharmacotherapy”), or AR-DRG R63Z (“chemotherapy”). Nonadmitted patient data were also used to identify outpatient chemotherapy services, as was radiotherapy, using service types and service classifications.
Data management and analysis
Descriptive statistics summarized cohort characteristics, and chi-square tests of independence compared categorical variables. Logistic regression examined factors associated with each indicator, and multinomial logistic regression examined predictors of the composite measure, of potentially burdensome end-of-life care. Variables with p ≤ 0.20 in univariate analyses were included in backward stepwise models (significance at p < 0.05). Backward stepwise modeling sequentially removes nonsignificant variables to identify the most important predictors (Chowdhury and Turin Reference Chowdhury and Turin2020). Odds ratios (OR) and 95% confidence intervals (CIs) were calculated. Analyses were conducted in Stata v18 (StataCorp 2025).
Demographic and clinical covariates were identified from the literature (Hu et al. Reference Hu, Yasui and White2014; Schulkes et al. Reference Schulkes, van Walree and van Elden2018; Keating et al. Reference Keating, Cleveland and Wright2021; Sachdev et al. Reference Sachdev, Shearn-Nance and Vu2024; Webber et al. Reference Webber, Hafid and Gayowsky2024) and were those available in the data and included: age at death (categorized: 20–54, 55–64, 65–74, 75–84, ≥85), sex, Charlson comorbidity index (excluding malignancies) categorized as 0, 1, ≥2, cancer spread (localized, regional, metastatic), history of other malignancies (Y/N), mental health conditions (Y/N), tobacco use (Y/N), geographic location of residence (urban or rural), socioeconomic status, survival duration from diagnosis to death (i.e. 31–89, 90–179, ≥180 days), hospital type at last admission (public or private), and year of death.
Results
A total of 9,476 colorectal cancer decedents were included. The median age at death was 74 years (IQR 13.4), and 54.4% were male. More than half of the cohort resided in urban areas, and around two-thirds had at least 1 comorbidity. In the last 30 days of life, 13.1% had >1 ED presentation, 9.2% had >1 hospital admission, 7.4% spent ≥14 days in hospital, 3.1% had ≥1 ICU admission, and 1.2% received ≥1 mechanical ventilation. In the last 90 days, 17.4% had ≥3 hospital admissions (Supplementary Table 1). A total of 1,488 (15.7%) people died in acute care. In the last 7 days of life, 3.1% received chemotherapy; in the last 14 days of life, 6.2% received chemotherapy; and 2.8% received radiotherapy in the last 30 days of life during 2016–2019 (Supplementary Table 2). Univariate and multivariable logistic regression examined factors associated with each indicator of potentially burdensome end-of-life care (Supplementary Tables 3–5).
Overall, 71.3% of people with colorectal cancer had no indicator of the composite indicator of potentially burdensome care, 18.9% had 1 indicator, and 9.8% had 2 or more indicators. The oldest group (≥85 years) of patients had the lowest (12.4%) proportion of ≥2 indicators of potentially burdensome end-of-life care. Men had a higher proportion of ≥2 indicators of potentially burdensome end-of-life care (61.1%) compared to women (38.9%). People living in urban areas had a higher proportion of 1 or ≥2 indicators of potentially burdensome end-of-life care than people living in rural locations. A higher proportion of patients whose last admission was to a private hospital received ≥1 indicator (20.4%) compared to no indicators (10.6%) of potentially burdensome end-of-life care. There was no difference in the proportion of people with none, 1, or 2 or more comorbidities by number of indicators of potentially burdensome end-of-life care (Table 2).
Demographic characteristics of the cancer decedents by potentially burdensome end-of-life care composite index descriptive analysis
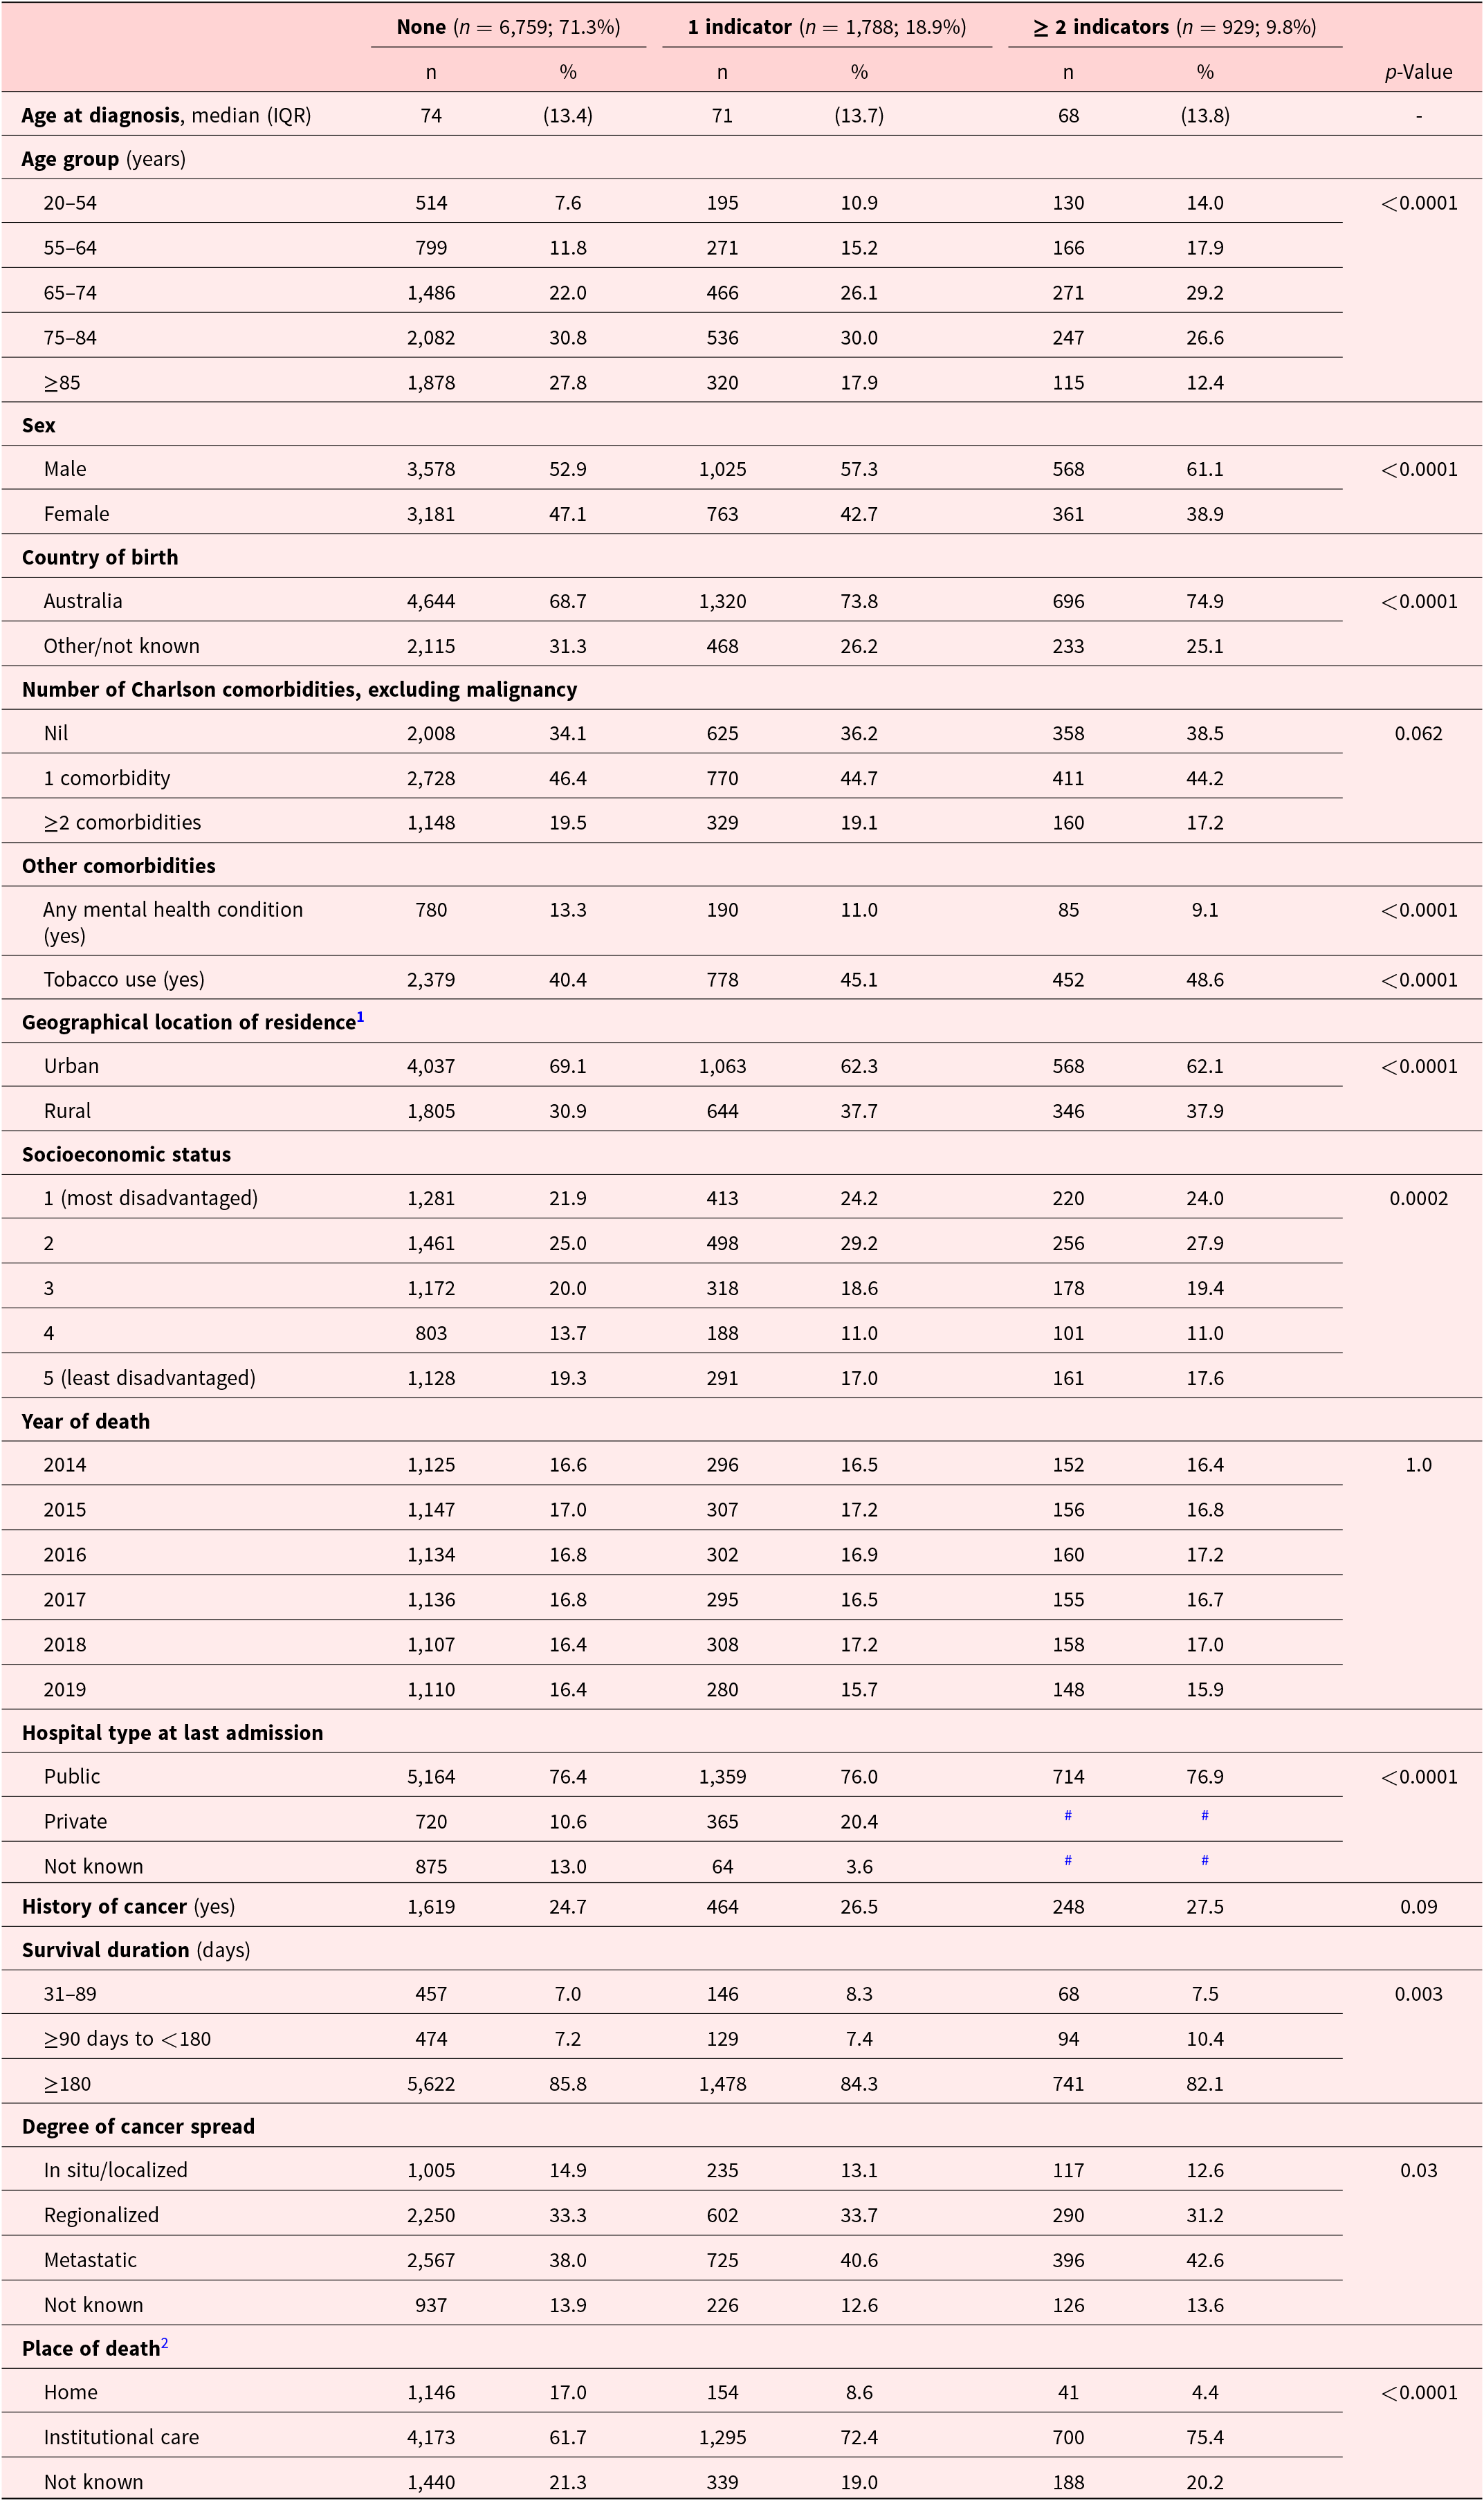
Table 2 Long description
The table compares demographic and clinical characteristics of cancer decedents across three groups: no potentially burdensome end-of-life care indicators (6,759; 71.3%), one indicator (1,788; 18.9%), and two or more indicators (929; 9.8%). Median age at diagnosis decreases as indicators increase (74, 71, and 68 years), and the share aged 85 or older drops from 27.8% with no indicators to 12.4% with two or more, while ages 20 to 54 rise from 7.6% to 14.0%. Men make up a larger proportion as indicators increase (52.9%, 57.3%, 61.1%), and tobacco use also rises (40.4%, 45.1%, 48.6%), while recorded mental health conditions decline (13.3% to 9.1%). Urban residence is more common in the no-indicator group (69.1%) than in the higher-indicator groups (about 62%), and disadvantage is slightly more concentrated in the higher-indicator groups (for example, the most disadvantaged category is about 24% versus 21.9%). Place of death shifts strongly away from home as indicators increase (17.0%, 8.6%, 4.4%) and toward institutional settings (61.7%, 72.4%, 75.4%). Metastatic disease is somewhat more common with more indicators (38.0% to 42.6%), and shorter survival (90 to under 180 days) is more frequent in the two-or-more group (10.4% versus 7.2%). Many differences are statistically significant, while Charlson comorbidity counts and history of cancer show little difference; some hospital-type cells are suppressed due to small counts.
# Cell sizes <5 or to prevent identification of cell sizes <5.
1 There were n = 2 not known geographical location of residence.
2 Institutional care includes: hospice, hospital, or residential aged care.
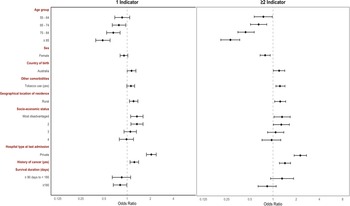
Multinomial regression showed a higher odds of ≥2 indicators of potentially burdensome end-of-life care among smokers (Adjusted Odds Ratio (AOR) 1.23, 95% CI 1.09–1.43), people with a history of prior cancer (AOR 1.43, 95% CI 1.21–1.69), who lived in a rural location (AOR 1.24, 95% CI 1.05–1.46), who lived in an area of low socioeconomic status (AOR 1.31, 95% CI 1.03–1.67), or who had a private hospital admission as their last admission (AOR 2.26, 95% CI 1.88–2.72) compared to no indicators of potentially burdensome end-of-life care and reference categories. Being older (AOR 0.28, 95% CI 0.21–0.37) and female (AOR 0.79, 95% CI 0.68–0.92) had a lower likelihood of receiving ≥2 indicators compared to no indicators and reference categories. Lower odds of receiving 1 indicator of potentially burdensome end-of-life care were found for people who had a longer survival duration (AOR 0.81, 95% CI 0.66–0.99) compared to no indicators (Figure 1 and Supplementary Table 7).
Multinomial model of characteristics associated with potentially burdensome care at the end-of-life for colorectal cancer patients1.

Figure 1 Long description
1 Indicator The x-axis is labeled Odds Ratio, ranging from 0.125 to 4, with tick labels at 0.125, 0.25, 0.5, 1, 2 and 4. A vertical dashed reference line is at 1. The y-axis lists: Age group with 55–64, 65–74, 75–84, 85 plus; Sex with Male and Female; Country of birth; Comorbidities; Other comorbidities; Indicator of cancer; Geographical location of residence; Socio-economic status; Not disadvantaged; 1; 2; 3; 4; Hospital type at last admission with Public and Private; History of cancer (yes); Survival duration (days) with 0 to 90 days and greater than 90 days to 1 year. Each row shows a point estimate with a horizontal confidence interval. The four age-group rows have point estimates left of 1. Male is at 1. Female is left of 1. Country of birth is near 1. Comorbidities is right of 1. Other comorbidities is near 1. Indicator of cancer is right of 1. Geographical location of residence is right of 1. Socio-economic status rows cluster around 1, with Not disadvantaged right of 1 and the numbered categories near 1. Public is near 1. Private is right of 1, around 2. History of cancer (yes) is right of 1, around 1.5. Survival duration (days) shows 0 to 90 days near 1 and greater than 90 days to 1 year left of 1. 2 Indicator The x-axis is labeled Odds Ratio, ranging from 0.125 to 8, with tick labels at 0.125, 0.25, 0.5, 1, 2, 4 and 8. A vertical dashed reference line is at 1. The y-axis lists the same categories as the left plot. Each row shows a point estimate with a horizontal confidence interval. The four age-group rows have point estimates left of 1. Male is at 1. Female is left of 1. Country of birth is near 1. Comorbidities is right of 1. Other comorbidities is near 1. Indicator of cancer is right of 1. Geographical location of residence is right of 1. Socio-economic status rows cluster around 1, with Not disadvantaged right of 1 and the numbered categories near 1. Public is near 1. Private is right of 1, around 2 to 3. History of cancer (yes) is right of 1, around 1.5 to 2. Survival duration (days) shows 0 to 90 days near 1 and greater than 90 days to 1 year left of 1.
Discussion
Key results
Of 9,476 people who died from colorectal cancer in NSW, 15.7% died in acute care. An ED visit and >1 hospital admission were the most common indicators of potentially burdensome end-of-life care. A higher likelihood of experiencing ≥2 indicators of potentially burdensome end-of-life care was identified among smokers, patients with a prior history of cancer, people residing in rural areas, people living in socioeconomically disadvantaged areas, and people whose last admission was to a private hospital, whereas older age, female sex, and longer survival durations were associated with a lower likelihood.
Findings in the context of other studies
Hospital service use
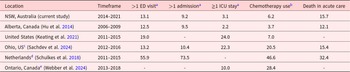
In the current study, 13.1% of patients had >1 ED presentation, and 9.2% had >1 hospital admission in the last 30 days of life (Table 3). In the Netherlands, Schulkes et al. (Reference Schulkes, van Walree and van Elden2018) (2011–2015) reported higher acute care use than the current study, with 55.9% of patients having >1 ED visit and 73.5% having >1 hospital admission in the last 90 days. The differences are likely due to the small sample size of colorectal cancer patients, consisting of 146 patients (24.2% of the total cohort), and the duration being 90 days, which reflects their conceptualization of the end-of-life period, compared to the 30-day timeframe in the current study (Schulkes et al. Reference Schulkes, van Walree and van Elden2018).
Comparison of potentially burdensome end-of-life care indicators for people who had a death from colorectal cancer by country and indicator type
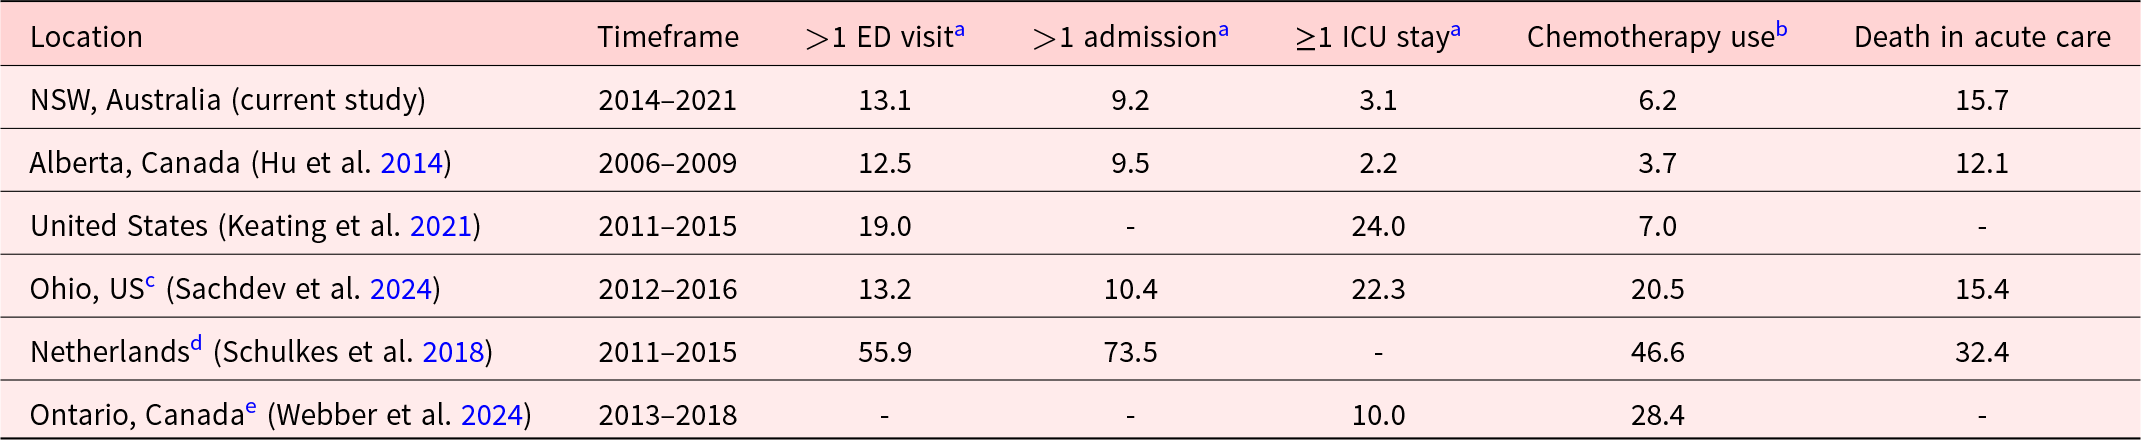
Table 3 Long description
Percentages compare potentially burdensome end-of-life care indicators for people who died from colorectal cancer across regions and study periods. Measures include having more than one emergency department visit, more than one hospital admission, at least one intensive care stay, chemotherapy or other cancer treatment use, and death in acute care; some studies did not report every indicator. NSW, Australia (2014 to 2021) reports 13.1% with more than one ED visit, 9.2% with more than one admission, 3.1% with an ICU stay, 6.2% treatment use, and 15.7% dying in acute care. Alberta, Canada (2006 to 2009) is similar, with 12.5% more than one ED visit, 9.5% more than one admission, 2.2% ICU stay, 3.7% treatment use, and 12.1% death in acute care. The Netherlands (2011 to 2015) is much higher on reported measures: 55.9% more than one ED visit, 73.5% more than one admission, 46.6% treatment use, and 32.4% death in acute care. US studies show higher ICU and treatment use where reported: the United States overall (2011 to 2015) reports 19.0% more than one ED visit, 24.0% ICU stay, and 7.0% treatment use, while Ohio (2012 to 2016) reports 13.2% more than one ED visit, 10.4% more than one admission, 22.3% ICU stay, 20.5% treatment use, and 15.4% death in acute care. Ontario, Canada (2013 to 2018) reports 10.0% ICU stay and 28.4% treatment use, with other indicators not provided. Comparisons should be interpreted cautiously because the end-of-life window differs by indicator and study, and one study’s “chemotherapy” measure reflects any cancer treatment.
a In the last 30 days of life.
b In the last 14 days of life.
c Chemotherapy use value is for “any cancer treatment.”
d All values were for the last 90 days of life.
e All values were for the last 100 days of life.
The present findings show 3.1% of people had ≥1 ICU admissions, whereas Keating et al. (Reference Keating, Cleveland and Wright2021) (United States, 2011–2015) found higher ICU use in the last 30 days of life (24%). This difference may reflect the United States healthcare system, where insurance structures allow more aggressive treatments than in Australia (Dzeng et al. Reference Dzeng, Dohan and Curtis2018). Sachdev et al. (Reference Sachdev, Shearn-Nance and Vu2024) (United States, 2012–2016) also showed high ICU use in the last 30 days of life (22.3%). These differences may be likely due to cohort selection (Table 3) (Sachdev et al. Reference Sachdev, Shearn-Nance and Vu2024). Webber et al. (Reference Webber, Hafid and Gayowsky2024) (Ontario, 2013–2018) reported that 10% had ≥1 ICU admissions in the last 100 days of life, which was a higher proportion than the current study that examined ≥1 ICU admissions in the last 30 days of life (4.7%) (Webber et al. Reference Webber, Hafid and Gayowsky2024). This may reflect Canada’s healthcare structure prioritizing ICU admissions in the last 100 days of life, as well as the shorter timeframe in the present study (Chaudhuri et al. Reference Chaudhuri, Tanuseputro and Herritt2017).
Chemotherapy use
In the present analysis, 6.2% of patients reported chemotherapy use in the last 14 days of life. Hu et al. (Reference Hu, Yasui and White2014) in Alberta, Canada (2006–2009) reported around half the chemotherapy use in the last 14 days of life at 3.7% compared to the current study. This difference is likely due to chemotherapy options expanding after 2010, influencing treatment decisions (Liu et al. Reference Liu, Zhou and Tan2024). Schulkes et al. (Reference Schulkes, van Walree and van Elden2018) reported 46.6% chemotherapy use in the last 90 days of life, and Webber et al. (Reference Webber, Hafid and Gayowsky2024) reported 28.4% chemotherapy use in the last 100 days before end-of-life, the difference likely due to the timeframe differences of 90 and 100 days versus 14 days for the current study.
Characteristics associated with potentially burdensome indicators
Age group and sex
The current analysis found that older patients and women had a lower likelihood of receiving potentially burdensome end-of-life care. Similarly, Hu et al. Reference Hu, Yasui and White2014 observed that older patients (aged ≥61 years) were less likely to receive potentially burdensome end-of-life care than younger patients. This may reflect patient preferences to prioritize comfort-focused care, and clinicians may adopt less burdensome approaches due to frailty or perceived limited benefit (De Schreye et al. Reference De Schreye, Houttekier and Deliens2017). Webber et al. (Reference Webber, Hafid and Gayowsky2024) likewise reported that women experienced slightly lower rates than men, further supported by literature showing greater acceptance of palliative care by women (Gott et al. Reference Gott, Morgan and Williams2020).
All comorbidities and tobacco use
Consistent with present study findings, Sachdev et al. (Reference Sachdev, Shearn-Nance and Vu2024) reported that a prior history of cancer increased the likelihood of potentially burdensome end-of-life care. Tobacco use was associated with higher odds of >1 ED presentations and a higher odds of ≥2 indicators of potentially burdensome end-of-life care in the current study, consistent with prior evidence (Just et al. Reference Just, Winnall, Hurley, Greenhalgh, Scollo and Winstanley2021). Findings may indicate broader health and social disadvantage, including poorer baseline health due to tobacco-related comorbidities and delayed healthcare engagement (Just et al. Reference Just, Winnall, Hurley, Greenhalgh, Scollo and Winstanley2021).
Residential location and socioeconomic status
The present study identified that living in a rural area was associated with a higher likelihood of >1 ED visit and ≥2 indicators of potentially burdensome end-of-life care. Similarly, Hu et al. (Reference Hu, Yasui and White2014) reported that patients living in rural areas were more likely to experience >1 ED visit and >1 hospital admission in the last 30 days of life, reflecting limited availability or access to palliative care services, hence heavy reliance on ED and hospital services for symptom management. However, unlike current results, Webber et al. (Reference Webber, Hafid and Gayowsky2024) reported that higher-income patients had a higher likelihood of experiencing potentially burdensome end-of-life care compared to lower-income patients, which may reflect differences in access to, or barriers against, receipt of palliative or community-based care services in Ontario (Cai et al. Reference Cai, Guerriere and Zhao2017).
Private hospitals with the last admission
The current findings identified that people who had a death from colorectal cancer whose last admission occurred in a private hospital had higher odds for all individual indicators of potentially burdensome End-of-life-care (EOLC) except for >1 ED visit in the last 30 days of life and ≥2 indicators of potentially burdensome end-of-life care. This may be due to private hospitals acting as hospices or providing palliative care at the end-of-life, where these resources are not available in the community (Rosenwax et al. Reference Rosenwax, McNamara and Murray2011). Private hospitals may have more resources for interventions and less integration with community palliative care, contributing to higher acute care use. Insurance incentives and patient or family expectations may also favor continued treatment near the end-of-life, even with limited benefit (Rosenwax et al. Reference Rosenwax, McNamara and Murray2011).
Impact on quality of life and the role of palliative care
The importance of palliative care is highlighted in the context of mitigating potentially burdensome end-of-life care. Palliative care referral has been reported to improve symptom control and reduce unnecessary hospitalizations (Hui et al. Reference Hui, Heung and Bruera2022). However, timely palliative care may be limited, specifically for people living in rural areas where geographic distance and workforce shortage remain barriers to access (Fasolino et al. Reference Fasolino, Mayfield and Valentine2024). These inequities may drive higher reliance on ED and acute care settings for end-of-life care (Cerni et al. Reference Cerni, Hosseinzadeh and Mullan2023). It is important to note that lower health service use does not equate to better care, as it may reflect barriers to accessing hospital or palliative services, rather than patient or family preferences (Cerni et al. Reference Cerni, Hosseinzadeh and Mullan2023).
It is important to acknowledge that health service use at the end-of-life may be necessary and is not unique to colorectal cancer (Grant et al. Reference Grant, McCarthy and Kearney2024). Some hospitalizations may be unavoidable, particularly for acute management of symptoms, such as pain or bleeding (Serra et al. Reference Serra, Spampinato and Riccardi2023). To determine whether each care episode was potentially avoidable would have required expert clinical review of medical records, which was not possible for the current study.
Strengths and limitations
The current study was a large population-based retrospective cohort. However, several limitations should be acknowledged. The reliance on administrative health data meant that patient preferences and quality of life could not be assessed. Future linkage with patient-reported data would be able to capture these aspects. The lack of patient-reported data limited the ability to evaluate whether the end- of-life care was truly “burdensome” from the patient’s perspective.
Chemotherapy and radiotherapy indicator data were only available between 2016 and 2019. Extending data to recent years would strengthen analyses. Furthermore, no data were available for service use, including primary care, community-based palliative, or home care services. There is likely under-representation of people with colorectal cancer who received palliative or hospice care and identification of aged care residents in hospital records.
As the study was limited to NSW, the generalizability of findings to other jurisdictions and countries is restricted. Comparative analyses across jurisdictions would clarify broader applicability. Data were not available on people who died from colorectal cancer in NSW, who lived near border towns and may have received treatment or hospital care in other jurisdictions, potentially impacting findings (Gabriel et al. Reference Gabriel, Barton and Delaney2015). Information on race and ethnicity was not available in the linked datasets, limiting the ability to examine potential disparities in end-of-life care across culturally diverse populations. Further studies may include developing predictive models to identify patients with colorectal cancer at greatest risk of receiving potentially burdensome end-of-life care.
Conclusions
This study demonstrates that disparities exist in end-of-life care for people with colorectal cancer, particularly among socioeconomically disadvantaged and rural populations. By identifying where and for whom potentially burdensome end-of-life care occurs, this research highlights the need for policies and practices that promote high-quality, patient-centered end-of-life care; care that prioritizes dignity, comfort, and alignment with individual values.
Supplementary material
The supplementary material for this article can be found at https://doi.org/10.1017/S1478951526103095.
Data availability statement
The data that support the findings of this study are available from the NSW Ministry of Health and the NSW Cancer Institute. Restrictions apply to the availability of these data, which were used under license for the current study, so they are not publicly available.
Acknowledgments
The authors wish to thank the NSW Ministry of Health for providing access to the nonadmitted patient data, ED visit, hospitalization, and mortality data, the NSW Cancer Institute for providing access to the NSW Cancer Registry, and the Centre for Health Record Linkage for conducting the data linkage.
Author contributions
RM conceived the study concept and design. RM acquired and organized the data. GV conducted the analysis and wrote the first draft of the manuscript. All authors (i.e. GV, RM, GD, GA, WL, JP, RL, RH, JB) were involved in the interpretation of data and critical revision of the manuscript.
Funding
The data linkage and acquisition for this research was supported by an NHMRC Centre of Research Excellence in Implementation Science in Oncology (1135048, CI Braithwaite).
Competing interests
The authors declare that there are no conflicts of interest.
Ethical approval
The study received ethical approval and a waiver of consent from the NSW Population and Health Services Research Ethics Committee (Ethics reference no: 184434) on 08/11/2024. The study was conducted in accordance with relevant research guidelines and regulations.


 Open access

