
Introduction
The agricultural sector plays an important role in the rural economy of the Western Balkans. In this paper, we focus on the former Yugoslav Republic (FYR) of Macedonia, where agriculture, together with forestry and fishing, accounts for about 15 percent of GDP and 17 percent of total employment (State Statistical Office of the Republic of Macedonia 2015). While the agricultural sector is of importance and has naturally high development potential, it suffers from a problem common to many post-socialist countries – low productivity. To combat negative factors hindering rural growth, and to increase agricultural competitiveness, environmental protection, and quality of life in rural areas, the National Strategy for Agriculture and Rural Development was adopted in 2007. The new strategy defines the country's long-term goals aligning Macedonian rural development policy with the common agricultural policy (CAP) of the European Union (EU), in particular with its second pillar, rural development programmes (RDPs) (Dimitrievski et al. Reference Dimitrievski, Kotevska, Janeska Stamenkovska, Tuna, Nacka, Volk, Erjavec and Mortensen2014). RDPs are seven-year programs comprising various support measures such as financing of planning, training, and advice; annual management payments; and investment aid (European Commission 2005, Dwyer and Powell Reference Dwyer and Powell2016). While EU member states must follow common strategic goals for rural development and agriculture, they adjust the design and implementation of RDPs to their country-specific contexts (Dwyer et al. Reference Dwyer, Buckwell, Hart, Menadue, Mantino, Erjavec and Ilbery2012).
Our study examines how a local campaign informing farmers about RDP measures affects their knowledge and interest in taking part in the program in FYR Macedonia. In the course of the campaign, a (randomly) selected group of farmers received a brochure describing the RDP measures and the application process. Based on evidence reported in previous literature (European Commission 2013, IPARD II 2015) and informal exchanges with agricultural specialists in FYR Macedonia (Prof. D. Dimitrievski, June 16, 2015, personal communication), we presume that providing information about existing RDP measures in person can increase farmers’ awareness about the program and, hence, interest in participating. Dwyer and Powell (Reference Dwyer and Powell2016) emphasize the relevance of information-search cost, among other transaction costs, for RDP performance, pointing to a lack of research on “the costs arising from asymmetries in perception and understanding of programmes” (Dwyer and Powell, Reference Dwyer and Powell2016, 548). Such asymmetries are possibly present in FYR Macedonia where RDP uptake is low, despite the availability of governmental means for rural development. Our interest lies in determining if providing farmers with information (hence lowering information-search cost and improving the understanding of procedures), affects their intention to participate in the program. According to policy recommendations drafted in Dwyer and Powell (Reference Dwyer and Powell2016), providing support and advice helping beneficiaries prepare and submit applications is crucial for effective use of funding.
Previous studies in development and agricultural economics focus on several aspects of information provision to farmers, including the role of media and extension services in agricultural information access (Hassan et al. Reference Hassan, Shaffril, Shahkat Ali and Ramli2010, Galadima Reference Galadima2014), farmers’ information needs (Lwoga, Stilwell, and Ngulube Reference Lwoga, Stilwell and Ngulube2011), and their perceptions of the effectiveness of various information sources (Achuonjei, dos Santos and Reyes Reference Achuonjei, dos Santos and Reyes2003). The majority of these investigations are descriptive and do not aim at estimating the size of information provision effects, while a (nonrandomized) survey is the most commonly employed method. While they collect useful information on farmers’ attitudes and behavior, such surveys do not permit a causal interpretation of information provision effects on policy perception and participation. Another issue is limited generalizability, because all cited studies are conducted in developing countries of Africa and Asia, where political and economic background, agricultural practices, rural situations, and information provision might differ substantially from those in transition economies such as FYR Macedonia.
In its research design, our paper is related to a growing body of experimental literature on the effectiveness of randomized information campaigns in various fields of economics, e.g., public economics (Duflo and Saez Reference Duflo and Saez2003, Chetty and Saez Reference Chetty and Saez2013), labour economics (Altmann et al. Reference Altmann, Falk, Jaeger and Zimmermann2015, Liebman and Luttmer Reference Liebman and Luttmer2015), and environmental economics (Ferraro and Miranda Reference Ferraro and Miranda2013, Benders et al. Reference Benders, Kok, Moll, Wiersma and Noorman2006). Most of these investigations find small to moderate effects of information provision on the outcomes of interest (see, for instance, Chetty and Saez Reference Chetty and Saez2013, Altmann et al. Reference Altmann, Falk, Jaeger and Zimmermann2015). However, the effectiveness of randomized information campaigns depends ultimately on the field of study, the context, the exact implementation of an intervention, quality and quantity of provided information, and subjects’ motivation (Saez Reference Saez2009, Feld et al. Reference Feld, Frenzen, Krafft, Peters and Verhoef2013, Altmann and Traxler Reference Altmann and Traxler2014).
This paper contributes to the literature in that it evaluates how information provision affects farmers’ intention to participate in the RDP. To the best of our knowledge, no such study has yet been done in the context of transition economies, in the Western Balkans in particular. From a policy perspective, the paper is interesting as it could shed light on how to enhance RDP participation by lowering farmers’ information acquisition costs and improving agricultural policy implementation in FYR Macedonia. If information provision does indeed increase farmers’ intention to apply for the RDP, this provides policy makers with a relatively inexpensive tool to increase participation rates. Our study also hints at further potential reasons for nonparticipation that appear interesting from a policy perspective, namely: (1) the administrative burden of RDP projects as perceived by farmers, and (2) a specific financing scheme of some RDP measures requiring farmers to provide up to 50 percent of the total investment up front, to be reimbursed upon realized costs.
Institutional Context
Challenges in Rural Areas of FYR Macedonia
FYR Macedonia is a small, landlocked, transitional economy in the Western Balkans region. The country experienced a sharp economic decline after the breakup of Yugoslavia in 1990 that affected all sectors, including agriculture, the main economic activity in rural areas. A number of socioeconomic issues still persist in rural Macedonia a quarter of century later, presenting a challenge for the successful implementation of rural development policies. These problems include farm fragmentation and small-scale private farming, leading to inefficient use of agricultural land (Dimitrievski et al. Reference Dimitrievski, Kotevska, Janeska Stamenkovska, Tuna, Nacka, Volk, Erjavec and Mortensen2014), poor diversification of economic activities, insufficient investments in infrastructure, and limited access to markets and sources of finance (Kotevska et al. Reference Kotevska, Bogdanov, Nikolić, Dimitrievski, Martinovska-Stojcheska, Tuna, Milić, Simonovska, Papić, Petrović, Uzunović, Becirović, Angjelković, Gjoshevski and Georgiev2015). On the demographic side, the ongoing trend of out-migration from rural areas has led to a situation where villages are left with a larger population of older and less-educated residents (European Commission 2013). Unfavorable education structure, poor qualifications, and insufficient professional skills of the economically active population are considered to be among the factors limiting the potential of rural development (Kotevska et al. Reference Kotevska, Bogdanov, Nikolić, Dimitrievski, Martinovska-Stojcheska, Tuna, Milić, Simonovska, Papić, Petrović, Uzunović, Becirović, Angjelković, Gjoshevski and Georgiev2015). This further deepens the gap between urban and rural standards of living. Today, almost half of the country's poor population resides in rural areas (European Commission 2013). Thus, the crucial question is of how the government can effectively use policy instruments, including the RDP, to address the problems of rural development and reverse the persistent negative trends.
Agricultural Policy and RDP
After its independence from Yugoslavia, FYR Macedonia experienced turbulent agricultural policies with many reforms and ad hoc policy decisions. In 2005, the country received the status of an EU candidate. This new trend of European integration brought about changes in the national agricultural policy which had to be adjusted to the CAP. Therefore, FYR Macedonia focused on harmonization of the national policy for development of agriculture and rural areas. The rural development policy is to a large extent aligned with (the second pillar of) the CAP. It has four priority areas and instruments to support them: (1) increasing the competitiveness of the agricultural and forest holdings, (2) protecting and improving the environment and rural areas, (3) improving the quality of life and encouraging diversification of economic activities in rural areas, and (4) supporting local development (Dimitrievski et al. Reference Dimitrievski, Kotevska, Janeska Stamenkovska, Tuna, Nacka, Volk, Erjavec and Mortensen2014, 128). In addition, rural development is financed by the EU via the Instrument for Pre-Accession Assistance for Rural Development (IPARD) (Dimitrievski et al. Reference Dimitrievski, Kotevska, Janeska Stamenkovska, Tuna, Nacka, Volk, Erjavec and Mortensen2014), which is not investigated in this study.
After the 2007 introduction of the National Strategy for Agriculture and Rural Development, the Ministry of Agriculture, Forestry and Water Economy has been preparing and announcing annual programs for rural development. The rural development budget is planned on an annual basis and realized through up to eight calls per year. However, because investments require time to be organized and implemented, and due to limited institutional capacity, budget transfers planned for one year are often conducted only in successive years.
In the period from 2008 to 2014, projects of about EUR 31.4 million were funded under the national program for rural development (see Table 1). In the first few years of implementation, the budget was mainly used to increase competitiveness of agricultural holdings, mostly through farm modernization of primary producers. In 2014, a substantial increase in the budget was devoted to the agrifood processing sectors and for improving the quality of life and infrastructural improvement of rural areas. According to information provided by the Agency for Financial Support in Agriculture and Rural Development, in 2014, funds for increasing competitiveness were allocated to 700 applicants (farmers and companies) of relatively small investments averaging EUR 4,460, whereas funds for improving quality of life in rural areas were used by 80 municipalities, averaging EUR 64,470 (APM Database 2015).
Annual Payments for Structural and Rural Development in FYR Macedonia per Priority Area (2008–2014, million EUR)
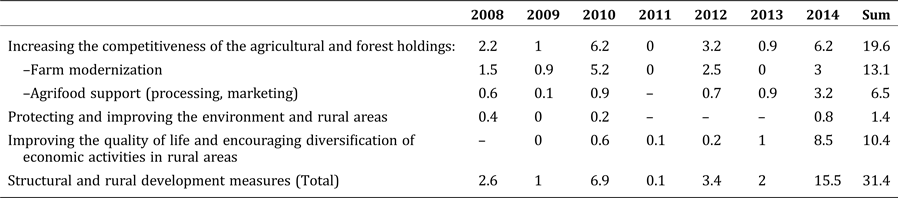
Source: Own calculation based on data in the Macedonian APM database (APM Database 2015).
Study Design
Our study is based on an information campaign experiment conducted in the Southeast of FYR Macedonia in May–June 2015. A brochure was prepared for this purpose in cooperation with the Agency for Financial Support of Agriculture and Rural Development of the Republic of Macedonia. The assessment of the campaign's effectiveness to promote interest in the RDP is motivated by the relatively low number of applications, despite the government's willingness to support the agricultural sector and the availability of funding.
The causal effect of information provision was intended to be evaluated by means of an experiment. We planned to randomly select 600 farmer households in the largest villages in the chosen region. Every second household on a list of households per village would be treated, while the remaining households would comprise the control group. The treatment probability would thus be asymptotically independent of farmers’ characteristics. The treatment group would receive an information brochure on selected RDP measures delivered in person, whereas the control group would receive no such brochure. A survey would be conducted for the entire sample about two weeks later, collecting information on personal and farm characteristics, previous experiences with the RDP application and participation, awareness about the RDP and its potential benefits for the community and the farm, and, importantly, on the farmers’ intention to apply for RDP measures and to cofinance RDP projects.
The actual implementation of the campaign deviated from the initial plan. Due to an unstable political situation and generally low levels of trust in the country, data collectors did not manage to fully follow the protocol. Reportedly, farmers were reluctant to communicate with strangers and accept brochures when the surveyors tried to approach the farmers at their homes. Therefore, instead of going to every second house when delivering the brochure, and going house to house to conduct the survey in preselected villages, the surveyors distributed them in several villages in public places, such as local shops, markets, pharmacies, fields, gardens, and water supply stations. They distributed the brochures in person and collected farmers’ contact information to survey them 1–2 weeks later. Reportedly, the brochures were more likely to be given to younger farmers, owners of small farms, and those who had not had experience with RDP participation, who were supposedly the types of farmers one predominantly meets in public places in rural areas. The face-to-face survey for the control group took place while the brochures were still being distributed to the treatment group. Once brochure dissemination was completed, the treatment group was surveyed. All treated individuals were interviewed, so there was no unit nonresponse. In the control group, an interviewer would go to the next available household in case of a refusal. The violations of the experimental design required the restriction of the evaluation sample to a specific subset of observations and the application of estimation methods that account for the fact that the intervention was not properly randomized.
The distributed brochure (see Appendix B) contains information about four selected RDP measures. The face-side of the brochure presents the title and the logo of the Agency for Financial Support in Agriculture and Rural Development, the phrase “Every year the Government of the Republic of Macedonia prepares financial support programs for rural development,” and three major goals of the program: modernization and structural adjustment of the agrifood sector, support of economic activities related to nature protection and development of rural areas, and transition of national agricultural policy towards the EU CAP. The rest of the brochure describes selected RDP measures along with eligibility criteria, application processes, required documents, and contact details for the responsible authorities. The selected RDP measures include (1) Support of young farmers (Measure 112), (2) Investments in farm modernization (Measure 121), (3) Investments in increasing the economic value of forestry (Measure 122), and finally (4) Support of economic associations of farms for joint agricultural activity (Measure 131). Three of the four listed measures require cofinancing from the farmers’ side. Measures 121 and 122 require 50 percent cofinancing by the farmer, whereas measure 131 requires up to 20 percent, depending on the submeasure (Zakon za Zemjodelstvo i Ruralen Razvoj 2010: 17–20). Importantly, the farmer must first personally finance the full amount of investment while actual RDP support is received upon the realized costs, if previously approved to be eligible. Measure 112 represents a grant of up to 600,000 Macedonian denars (EUR 9,760)Footnote 1 paid to a successful application in three instalments over a three-year period (hence, cofinancing is not required). The brochure targets various groups of farmers and provides the most relevant information regarding RDP measures and the application process. If farmers wanted to obtain more details on the program, the contact information of the responsible authorities could be found on the back of the brochure.
Data and Balancing Tests
In our survey, cross-sectional data on 597 farmer households (represented by a household head), including 292 treated and 305 nontreated farmers, were collected. The dataset contains observations from 34 villages of the Southeastern region.
Respondents were asked about their attitudes and opinions about the RDP measured on a Likert scale ranging from 1 “strongly disagree” to 5 “strongly agree.” The variables generated from these questions are used as outcomes in our analysis. One group of questions relates to farmers’ willingness to apply and participate in the program in the near future (3–5 years): “How do you assess the possibility to use RDP support for your household (e.g., for mechanization, equipment purchases) in the next 3–5 years?” and “How do you assess your intention to use RDP support for your household in the next 3–5 years?” Another group of statements covers awareness and opinions about RDP application process and participation: “I have enough information to independently prepare the application (procedure and documents),” “I have enough knowledge and experience to independently prepare the application (procedure and documents),” “The RDP application (procedure and documents) is easy,” and “The RDP increases the administrative work.” Information on farmers’ previous experiences with RDP was collected, including application for the program in the last three years, use of support in the last three years, and received value of support (in denars).
Background characteristics were also gathered, describing household size; household head's age, sex, educational attainment (primary education, high school, or college/university and higher), and experiences with farming activities, including number of years spent working on a farm, and the primary occupation (whether in agriculture or other industries). Information related to farming activities was available from the survey: farm profitability in the last three years (measured on a scale from 1 to 5: “very unprofitable,” “moderately unprofitable,” “break-even,” “moderately profitable,” “very profitable”), ease of getting a loan (1 to 5: “very difficult,” “difficult,” “medium,” “easy,” “very easy”), dependence on subsidies to break even financially (1 to 3: “not dependent,” “slightly dependent,” “very dependent”), frequency of cooperation with other agricultural producers (1 to 5: “never,” “rarely,” “not sure,” “sometimes,” “always”), share of agricultural production sold on a market, share of household income from farming, whether or not there are additional workers besides family members working on the farm, total farmed area (in hectares), and total livestock (in heads). Finally, the data contain binary indicators for receiving the brochure, reading it, and learning new facts about RDP measures.
Balancing t-tests comparing the mean values of the characteristics between the treatment and control groups revealed statistically significant (at the 5 percent level) differences in age, education, years in farming, having additional workers on the farm, the share of agricultural production sold on a market, farm profitability, farm capacity (in hectares), and some missing indicators, which points to a failure of randomization. For this reason, we use a restricted sample for our evaluation based on the information about the brochure assignment process (i.e., brochures were more likely distributed to younger farmers, owners of small farms, and those who had not participated in the RDP previously) provided by the field personnel and reflected in the data. Specifically, we disregard observations from older age groups and only keep prime-age household heads that are up to 55 years old. Furthermore, we only include households that have not previously received RDP support and do not have any employees working on their farm.
As demonstrated in Table 2, which provides descriptive statistics and balancing t-tests for the covariates, the subsample is relatively well balanced in terms of mean values of a range of selected characteristics. Apart from primary education, farm profitability and a missing indicator for the share of agricultural production sold on a market, no mean is statistically significantly different across treatment states at the 5-percent level. We consider this subsample in our analysis of the brochure's effect outlined further below.
Mean Covariate Values by Treatment Status in the Selected Subsample
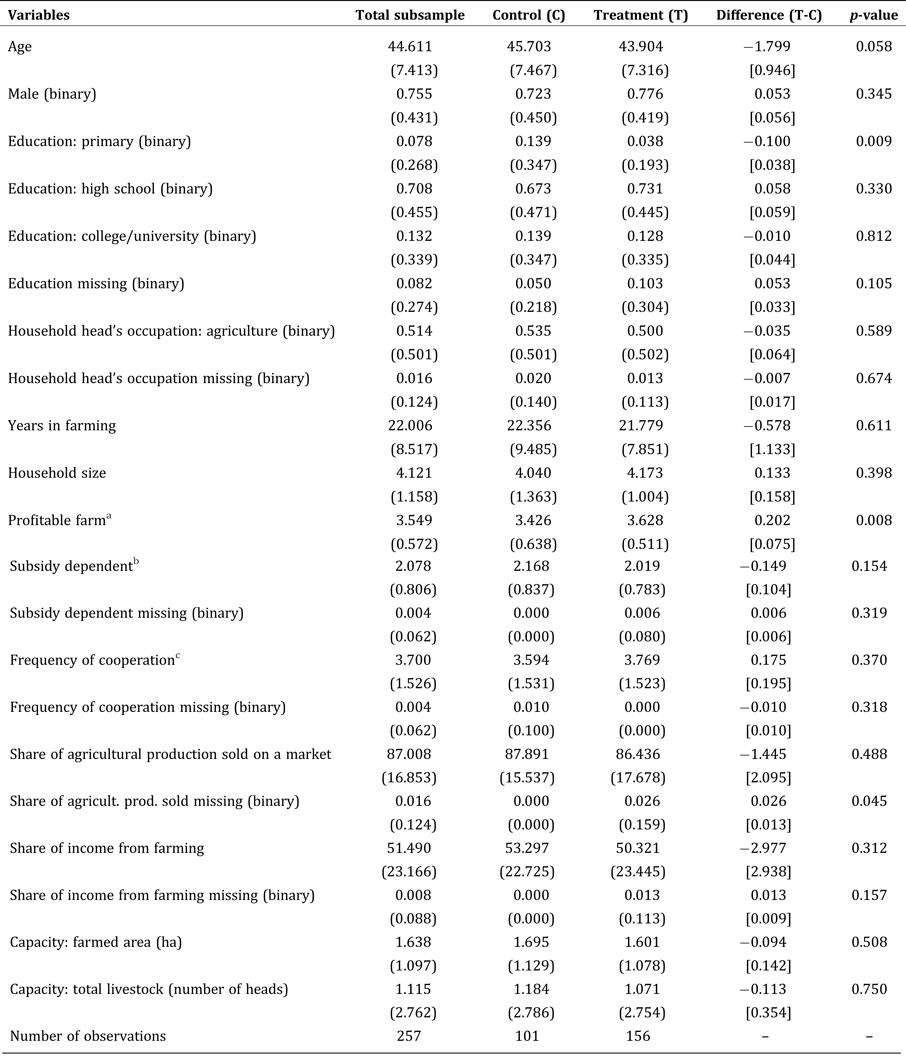
Notes: Standard deviations are in parentheses. Robust standard errors are in brackets.
a Profitable farm: 1 = “very unprofitable;” 2 = “moderately unprofitable;” 3 = “break-even;” 4 = “moderately profitable;” 5 = “very profitable.”
b Subsidy dependent: 1 = “not dependent;” 2 = “slightly dependent;” 3 = “very dependent.”
c Frequency of cooperation: 1 = “never;” 2 = “rarely;” 3 = “not sure;” 4 = “sometimes;” 5 = “always.”
The evaluation sample includes 257 observations, out of which 156 are treated and 101 comprise the control group. As can be seen from Table 2, farmers are, on average, about 45 years old, predominantly males, with a high school degree, who have spent almost half of their life working in farming. For half of the farmers, agriculture is the main occupation. They sell most of what they produce on the market, and more than half of their income comes from farming. Farms in the sample are, on average, moderately profitable or break-even and somewhat dependent on subsidies. Table 3 provides additional insight into how our evaluation sample compares to the average farm household in the Southeast region and in the entire FYR Macedonia, in terms of characteristics available from the 2013 Farm Structure Survey. Household heads in the selected sample are typically younger, more educated, more likely to be female, and their household size tends to be larger, compared to the respective averages in the region and country. The average farm size in the sample is comparable to the regional and national averages but smaller in terms of total livestock.
Mean Values of Characteristics at Sample, Regional, and National Levels
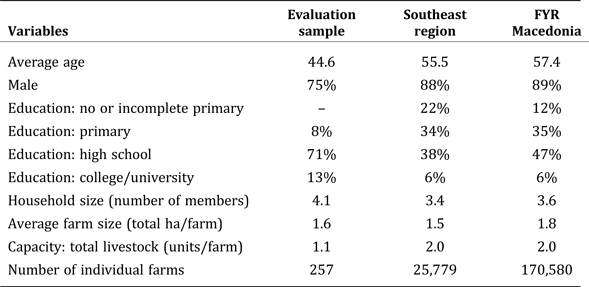
Source: Own 2015 survey and Farm Structure Survey 2013.
Item nonresponse was moderate. In 21 cases (8.2 percent) the educational level was reported in the selected sample. The number of missing values in other covariates is even smaller. For the purpose of our analysis, we introduce binary indicators for missing values in covariates while replacing actual missing values with zeros.
Estimation Methods
To evaluate the impact of the information brochure on farmers’ willingness to apply and participate in the RDP, as well as on other outcome variables, four econometric methods are used: the simple difference in means, OLS, and two non-/semiparametric estimation techniques, namely, propensity score matching and nonparametric multivariate reweighting (entropy balancing). Formally, we estimate regression specifications of the following kind:
 $$Y_i = {\rm \beta} _0 + {\rm \beta} _1T_i + {\rm \beta} _2X_i + {\rm \epsilon} _i\comma \; $$
where the variable Y i measures various outcomes, e.g., farmers’ intention to apply for the RDP, for individual i. T i is a binary indicator that takes a value of 1 if individual is “treated,” i.e., received the information brochure, while β1 is the coefficient of interest, as it captures the treatment effect. X i is the vector of covariates used in the OLS regression, propensity score estimation, and entropy balancing.
First, we consider the simple differences in mean outcomes between treatment and control groups. If randomization had been successful, both groups would have been comparable in all their background characteristics (both observed and unobserved), and the differences in mean outcomes across treatment groups would have been unbiased estimates of the average casual effects of the intervention. However, the randomization was not successful, and even after restricting the original sample, some characteristics are not fully balanced across treatment states. For this reason, the simple difference is unlikely to provide an unbiased estimate of the average casual treatment effect.
As an alternative strategy, we control for a range of observed characteristics X i in the estimation. We rely on the conditional independence assumption (CIA), which states that after conditioning on observed characteristics that jointly affect the treatment probability and the outcome, the independence of the treatment and the potential outcomes hold, such that there are no unobservables jointly affecting the treatment and the outcome (Imbens Reference Imbens2004: 7):
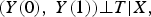 $$\lpar Y\lpar 0\rpar \comma \; Y\lpar 1\rpar \rpar \bot T \vert X\comma \; $$
where Y(0) and Y(1) are potential outcomes under, respectively, nontreatment and treatment, T is a binary treatment indicator and X is the covariate set.Footnote 2
The probability of receiving the brochure was reportedly negatively associated with farmers’ age, farm capacity, and previous participation in the RDP. This is why it is important to control for these and related characteristics. Our dataset contains information about farmers’ age. Farm capacity can be controlled by including variables such as farmed area and total livestock. Farmers who previously participated in the program are excluded from the evaluation sample.
However, we believe it is critical to account for additional characteristics that can be simultaneously related to the outcome variables and the treatment probability, because the brochures were more often distributed to relatively poorly informed farmers. Educational level is likely to affect farmers’ awareness about the RDP and, hence, their potential interest in applying for agricultural support. As mentioned in a recent version of The National Programme for Agriculture and Rural Development, Macedonian small-scale farmers appear to have low educational levels (European Commission 2013: 27). Because the brochure was more often distributed to the owners of smaller farms, it is possible that those who received it had lower educational levels. We also suspect that the relative importance of farming and farm profitability might have affected the probability of receiving the brochure and, at the same time, intention to participate. Individuals for whom farming is the main occupation and whose income is mostly generated by farming should be more interested in obtaining information about the RDP. For this reason, household's head occupation, the share of agricultural production sold on the market, and the share of income from farming are included in the regressions. Furthermore, farm profitability and subsidy dependence should be controlled, because some RDP measures require cofinancing. Given that it is easier for profitable and subsidy-independent farmers to cofinance a project, they might be more interested in learning about RDP measures and obtaining the brochure. Table 2 provides supporting evidence for this, because treated farmers are, on average, more likely to have profitable farms and be less subsidy dependent. Finally, we include an indicator for the frequency of cooperation with other farmers as a control variable. More cooperative farmers might be more socially open and active, which increases their chances of receiving the brochure and being interested in the RDP.
Our first approach to control for the observed confounders is a standard OLS regression of the outcome on a constant, the treatment indicator, and the covariates. However, an important drawback of OLS is that it assumes a linear relationship between regressors and the outcome variable, which may be violated in practice. Hence, we also apply more flexible semi- and nonparametric estimators, relying on less rigid functional form assumptions.
One of the most well-known approaches for the evaluation of treatment effects in nonrandomized studies is propensity score matching. The idea is to find for each treated observation one or more nontreated units with a similar conditional treatment probability, i.e., propensity score. In a general form, the treatment effect  $ \lpar {\hat \Delta}_{\rm match}\rpar $ is defined as the average difference in the outcomes of the treated and the weighted nontreated matched units (see, for instance, Smith and Todd Reference Smith and Todd2005):
 $${\hat \Delta} _{\rm match} = \; \displaystyle{1 \over {N_1}}\mathop \sum \limits_{\lcub i\colon \; T_i = 1\rcub } \lpar{Y_i - \mathop \sum \limits_{\lcub i\colon \; T_j = 0\rcub } W_{i\comma j}Y_j} \rpar\comma \; $$
where W i,j is the weight given to the outcome of a nontreated observation j, when j is matched to a treated unit i, and N 1 is the number of treated observations. In this study, we conduct semiparametric kernel matching. First, the propensity score: p(X) = Pr(T = 1|X) is estimated in a probit regression (see Table 1A in Appendix A for the propensity score specification). Then, kernel regression of the outcome on the estimated propensity score among the nontreated is conducted to estimate the conditional mean outcome given the propensity score without treatment, E(Y|T = 0, p(X)) = :m(0, p(X)) (Huber, Lechner and Wunsch Reference Huber, Lechner and Wunsch2013). Formally,
 $$\hat m\lpar 0\comma \; \hat p\lpar X_i\rpar \rpar = \displaystyle{{\mathop \sum \nolimits_{\lcub j\colon T_j = 0\rcub } K\lpar \hat p\lpar X_i\rpar - \hat p\lpar X_j\rpar /h\rpar Y_j} \over {\mathop \sum \nolimits_{\lcub j\colon T_j = 0\rcub } K\lpar \hat p\lpar X_i\rpar - \hat p\lpar X_j\rpar /h\rpar }}\comma \; $$
where  ${\hat m}\lpar 0\comma \; \hat p\lpar X_i\rpar \rpar$ is an estimate of m(0, p(X)), K is a kernel function and h is a bandwidth operator. In the estimations, the Epanechnikov kernel and a bandwidth of 0.6 is used.Footnote 3 Thereafter, the treatment effect for the treated is estimated by averaging the estimated function by the empirical distribution of p(X) for the treated:
 $$\hat \Delta _{{\rm kernel}\_{\rm match}} = \; \displaystyle{1 \over {N_1}}\mathop \sum \limits_{\lcub i\colon \; T_i = 1\rcub } \lpar Y_i - \hat m\lpar 0\comma \; \hat p\lpar X_i\rpar \rpar \rpar .$$
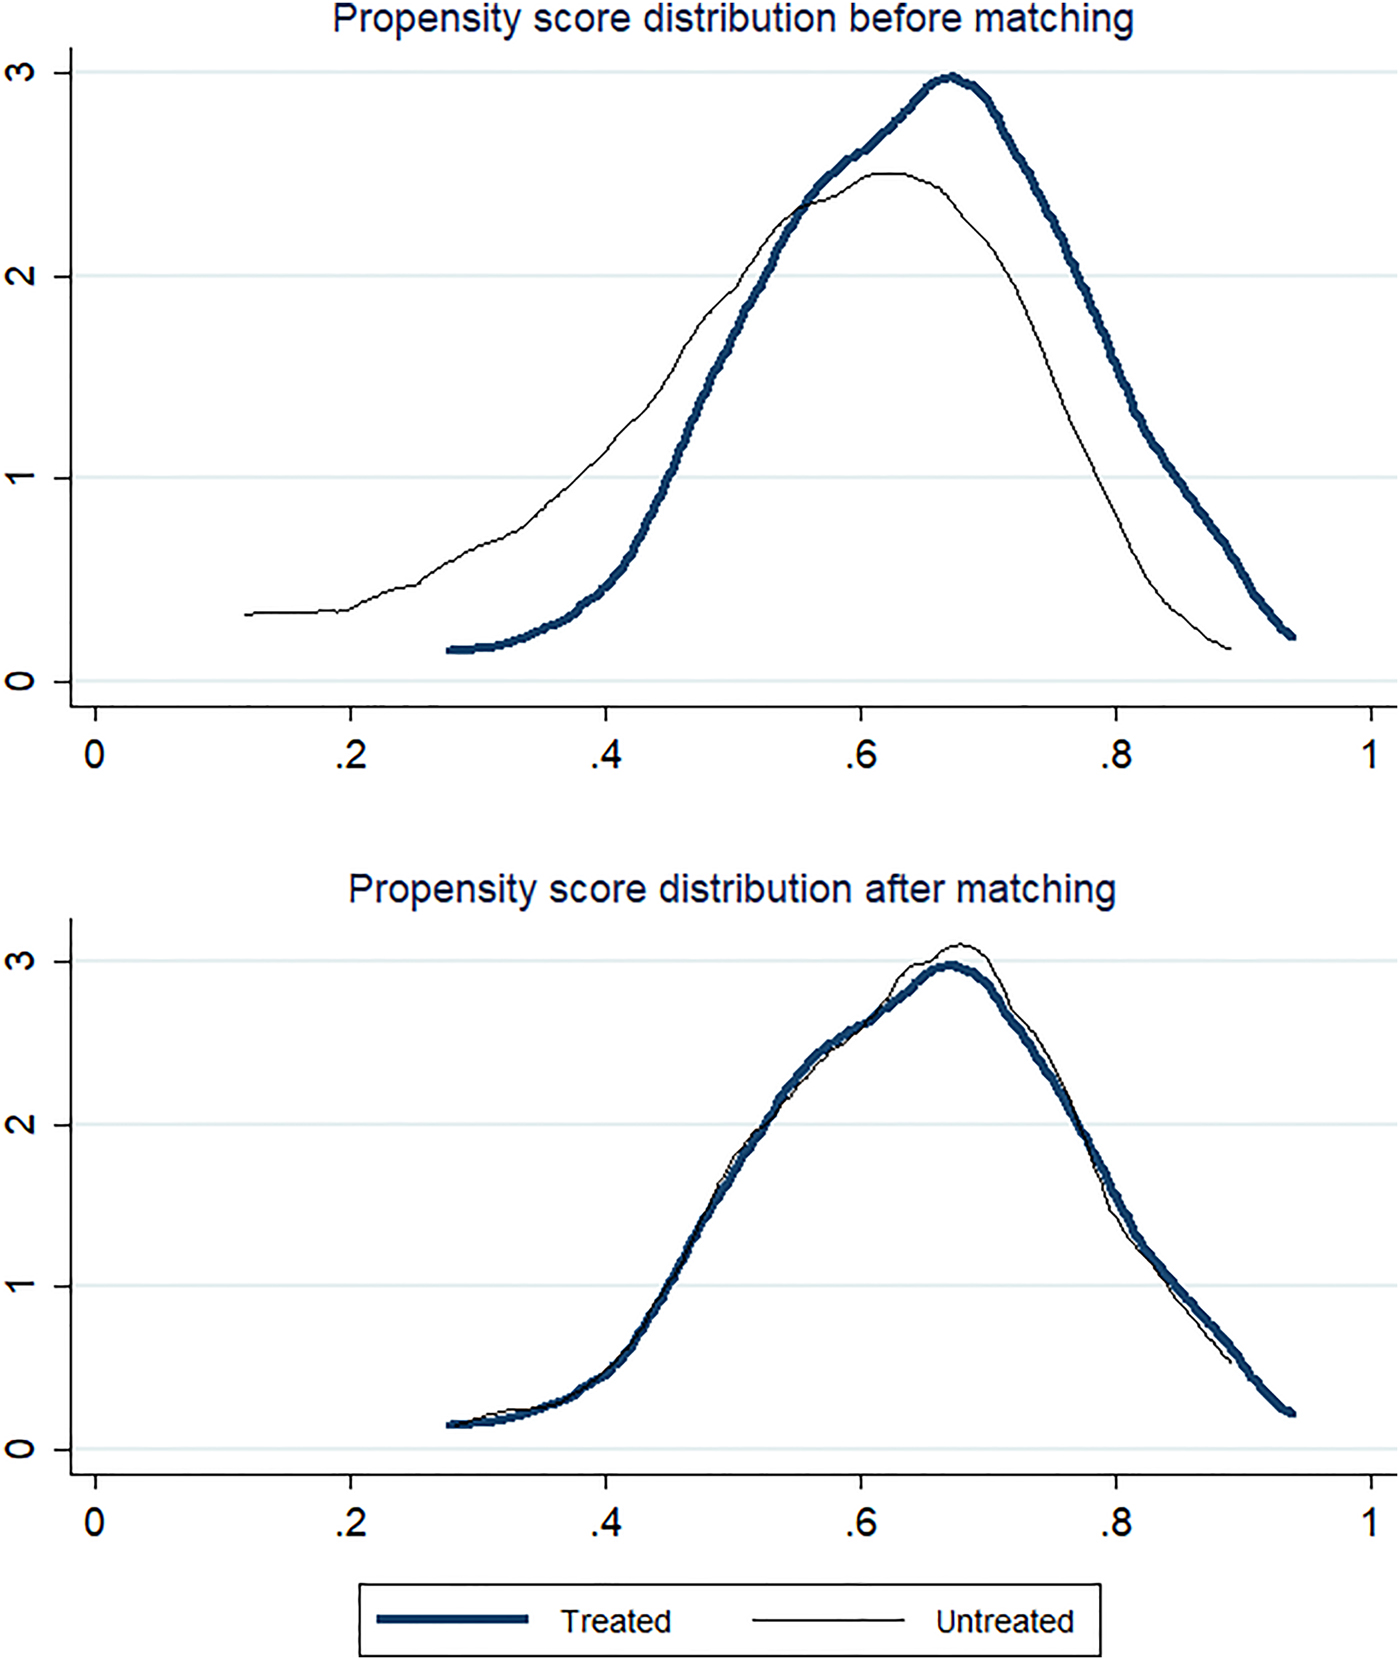
Matching estimators rely on a common support assumption that ensures units with comparable characteristics exist in both treatment states. Figure 1 provides the distribution of the estimated propensity score before and after matching. The upper panel shows some non-overlapping areas in the distribution of the propensity score in the treated and nontreated groups prior to matching. Matching achieves a decent overlap in the propensity score distributions, as illustrated by the lower panel of Figure 1. Only four observations in the treatment group lie outside the common support and therefore need to be excluded from propensity score matching. Additionally, Table 4 presents post-matching mean covariate values by treatment status, standardized differences, and percentage-reduction in standardized differences compared to the original (unmatched) sample, and balancing t-tests on the matched sample. Based on standardized differences and the percentage-reduction in standardized differences, we conclude that matching considerably improved balance in all characteristics (the average reduction in standardized differences was 75 percent), except for farm size.
Density Estimates of the Estimates of the Propensity Score  ${\bf Pr}\lpar {\bi T} = 1\vert {\bi X}\rpar $
Covariate Balance after Propensity Score Matching
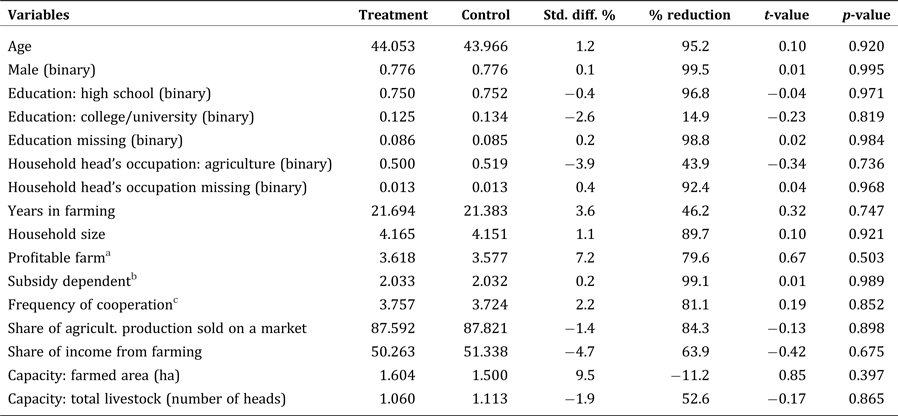
Notes: “Std. diff. %” stands for standardized difference  $\displaystyle{{100\; \lpar {\bar x}_T - {\bar x}_C\rpar } \over {\sqrt {\lpar {\rm var}\lpar x_T\rpar + {\rm var}\lpar x_C\rpar \rpar /2}}}$ (Rosenbaum and Rubin Reference Rosenbaum and Rubin1985). “% reduction” is percentage reduction in the absolute value of standardized difference after matching as compared to before matching. “t-value” and “p-value” refer to two-sample t-tests for equality of means.
a Profitable farm: 1 = “very unprofitable;” 2 = “moderately unprofitable;” 3 = “break-even;” 4 = “moderately profitable;” 5 = “very profitable.”
b Subsidy dependent: 1 = “not dependent;” 2 = “slightly dependent;” 3 = “very dependent.”
c Frequency of cooperation: 1 = “never;” 2 = “rarely;” 3 = “not sure;” 4 = “sometimes;” 5 = “always.”
The next estimation technique employed in our analysis is entropy balancing,Footnote 4 a fully nonparametric multivariate reweighting method proposed by Hainmueller (Reference Hainmueller2012). It does not rest on any propensity score model, but on user-specified initial base weights for nontreated observations. Reweighting is based on computing new weights in a way that the Kullback-Leibler divergence from the baseline weights is minimized, subject to the balancing constraints. Weights of the nontreated are defined in such a way that exact balance in prespecified covariate moments like the mean is attained for the reweighted nontreated group and the treated. Formally, the weights are chosen by minimizing the following loss function, while balancing the (multidimensional) vector of covariates X i:
 $$\mathop {\min} \limits_{w_i} \mathop \sum \limits_{\{ i:\; T_i = 0\}} h({\rm \omega} _i)$$
subject to the balance constraint
 $$\mathop \sum \limits_{\{ i:\; T_i = 0\}} {\rm \omega} _iX_i = \displaystyle{1 \over {N_1}}\mathop \sum \limits_{\{ i:\; T_i = 1\}} X_i$$
and the normalizing constraints
 $$\mathop \sum \limits_{\left\{{i\colon \; T_i = 0} \right\}} {\rm \omega} _i = 1$$
 $${\rm \omega} _i \ge 0\; \forall \; i\; {\rm with}\; T_i = 0\comma \; $$
where ωi is a weight estimated for each nontreated observation i, and h( · ) is a distance metric. Hainmueller (Reference Hainmueller2012) uses the directed Kullback (Reference Kullback1959) entropy divergence: h(ωi) = ωilog(ωi/q i), where q i is the initial base weight. The loss function  $\mathop \sum \nolimits_{\lcub i\colon \; T_i = 0\rcub } h\lpar {\rm \omega} _i\rpar$ measures the distance between the distribution of the estimated weights ${\rm \omega} _1\comma \; \ldots\comma \; {\rm \omega} _{N_0}$ and the initial base weights $q_1\comma \; \ldots\comma \; q_{N_0}$, where N 0 is the number of nontreated units. The distribution of the base weights is usually set to be uniform with q i = 1/N 0. The constraint (7) balances the distribution of X i between the treatment and the reweighted nontreated groups, so that the latter resembles the former in its covariate distribution. The normalizing constraints (8) and (9) force the weights to sum up to 1 and be nonnegative. The treatment effect on the treated can be estimated as the difference in mean outcomes between the treatment and the reweighted control groups:
 $$\hat \Delta _{{\rm ebalance}} = \displaystyle{1 \over {N_1}}\mathop \sum \limits_{\lcub i\colon \; T_i = 1\rcub } \left({Y_i - \; \displaystyle{{\mathop \sum \nolimits_{\lcub i\colon \; T_i = 0\rcub } Y_i{\rm \omega} _i} \over {\mathop \sum \nolimits_{\lcub i\colon \; T_i = 0\rcub } {\rm \omega} _i}}} \right).$$
Finally, it needs to be pointed out that our analysis relies implicitly on the stable unit treatment value assumption (SUTVA) that precludes any interaction, spill-over, and general equilibrium effects related to individual treatment assignment. However, it is possible that some study participants in the treated group spread information about the brochure in their villages, which would result in the contamination of the control group. In the event this happened, we estimate the lower bound of the absolute value of the treatment effect.
Results
This section summarizes our results by presenting the effect estimates for the subsample of farmers up to 55 years of age who do not employ additional workers and have not applied for the RDP in the last three years. The background characteristics are comparably well balanced for this group. A binary indicator for whether farmers have read the brochure or not suggests that only 5.8 percent of those who had received the information brochure did not read it, so that treatment noncompliance is low.
Main Results
Table 5 presents the effects for the outcomes of interest. Column 2 reports the mean differences in outcomes across the treatment and control groups. The estimates based on OLS, kernel matching, and entropy balancing are provided in columns 3, 4, and 5.
Treatment Effects for the Outcomes of Interest
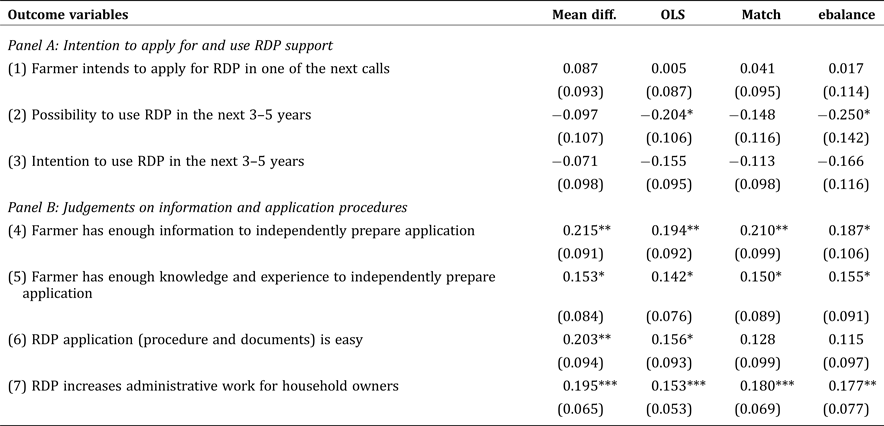
Notes: Asymptotic standard errors in parentheses are robust to heteroscedasticity for the mean differences, OLS, and entropy balancing. Standard errors are based on 1999 bootstrap replications for the kernel matching estimation. Significance levels: *** 1%, ** 5%, * 10%. ebalance: means are balanced. Sample sizes: for outcome variables 1–6 is 257 obs., for outcome variable 7 is 256 obs. All the outcome variables (except for Possibility to use RDP…, and Intention to use RDP …) are measured on a five-point scale: 1 = “strongly disagree;” 2 = “disagree;” 3 = “don't know;” 4 = “agree;” 5 = “strongly agree.” Possibility to use RDP… and Intention to use RDP… are measured as: 1 = “very low,” 2 = “low,” 3 = “average,” 4 = “strong,” 5 = “very strong.”
We find no statistical evidence that the brochure affected the farmers’ intended uptake in the near future. For the outcome “Farmer intends to apply for the RDP in one of the next calls,” the point estimates are close to zero and nonsignificant. Regarding the “Possibility to use the RDP in the next 3–5 years,” the OLS and entropy balancing estimates are negative and statistically significant at the 10-percent level. Finally, the effect on the “Intention to use the RDP in the next 3–5 years” is not statistically significant.
The treatment effects for the outcome variables presented in Panel B of Table 5 might shed some light on why the brochure had mostly insignificant effects on the main outcomes of interest. We notice that the intervention had a positive and statistically significant effect on claiming to have sufficient information, as well as sufficient knowledge and experience to independently prepare the RDP application. Similarly, although with lower statistical significance, we find a positive treatment effect on the assessment of the application procedure as easy. The effect on associating the RDP with increasing administrative work for household owners is positive, relatively strong, and highly statically significant. This could be one reason why the intervention did not boost farmers’ intention to use RDP support.
The brochure contained a brief description of bureaucratic procedures related to the application and the selection process. From this, treated farmers could have inferred high administrative costs of being involved in RDP projects. Local experts (namely National Extension Agency advisors) explained that farmers had often believed RDP participation required substantial administrative work, and only those farmers who had no other opportunities to finance their investments would turn to governmental aid. Similarly, a recent study by Dwyer and Powell (Reference Dwyer and Powell2016) reports that potential RDP applicants, especially in new EU member states, are often discouraged by “what they perceive as costly application, negotiation or management processes” (Dwyer and Powell, Reference Dwyer and Powell2016, 551). Taken together, this evidence suggests that information in the brochure might have reaffirmed pre-existing beliefs among farmers about the high administrative cost of RDP projects, and thus possibly discouraged their intention to participate.
Heterogeneity of Treatment Effects by Farm Profitability
In the next step, we consider the heterogeneity of treatment effects by farm profitability. As mentioned in the “Study design” section, most measures presented in the information brochure require cofinancing. Given that farmers must initially cofinance the project investment from their own means, and RDP support happens only after the costs are realized, it is likely that cofinancing is more feasible for profitable farmers compared to unprofitable ones. Profitable farmers have the opportunity to cofinance an RDP project, either from their own profits and savings or have an easier access to bank loans than unprofitable farmers. Figure 1A in Appendix A shows that although the majority of farmers in both groups find getting a loan difficult, a greater number of profitable farmers think obtaining a loan is easy compared to unprofitable ones. Thus, we would expect the brochure might have had differential effects by farm profitability.
The heterogeneity analysis is based on the evaluation sample, which contains 106 unprofitable and 151 profitable farmsFootnote 5. Table 6 presents the effects by farm profitability. Concerning Panel A, for unprofitable farmers, the effects on the reported possibility and intention to use the RDP in the household are negative and statistically significant in several cases, despite the small sample size. For profitable farmers, the impacts are never statistically significant. Turning to Panel B, we find that the brochure increased the profitable farmers’ judgment about having enough information, as well as knowledge and experience to independently prepare the application. Both effects are highly significant and relatively strong. At the same time, the brochure had no statically significant effect on these outcome variables for unprofitable farmers. Another finding is that among unprofitable farmers, the intervention (statistically significantly) increased the perception that the RDP brings additional administrative work for the household; at the same time the impact is close to zero among profitable farmers.
Heterogeneity of Treatment Effects by Farm Profitability
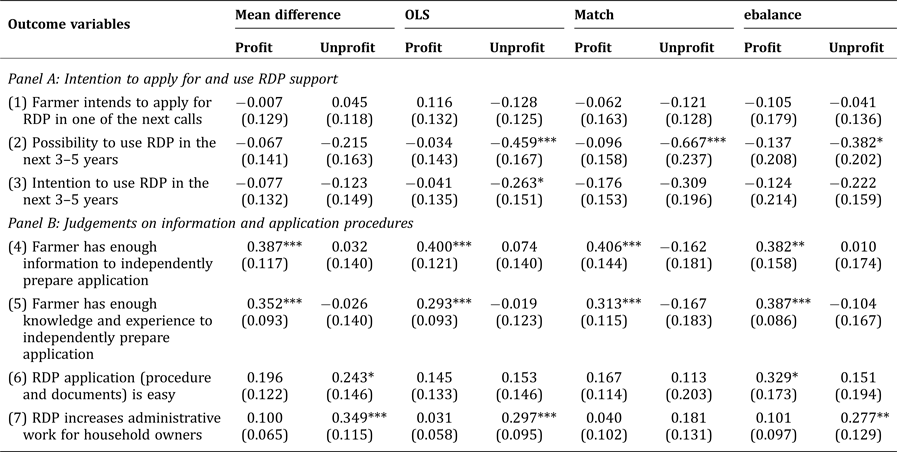
Notes: Asymptotic standard errors in parentheses are robust to heteroscedasticity. Standard errors are based on 1999 bootstrap replications for the kernel matching estimation. Significance levels: *** 1%, ** 5%, * 10%. ebalance: means are balanced. All the outcome variables (except for Possibility to use RDP…, and Intention to use RDP …) are measured on a five-point scale: 1 = “strongly disagree;” 2 = “disagree;” 3 = “don't know;” 4 = “agree;” 5 = “strongly agree.” Possibility to use RDP…, and Intention to use RDP … are measured as: 1 = “very low,” 2 = “low,” 3 = “average,” 4 = “strong,” 5 = “very strong.”
In summary, unprofitable farmers seem to be less willing to make use of the RDP and associate it to a larger extent with increased administrative work when receiving the brochure. For profitable farmers, the intervention increased claiming to possess enough information, knowledge, and experience to prepare the application but did not significantly affect any other outcomes. The differential effects may be driven by the access to means of cofinancing.
Conclusion
The present study was designed to determine the effects of a randomized information campaign on farmers’ knowledge and intention to participate in the RDP in FYR Macedonia. Based on several reports and prior studies, the hypothesis was that a paucity of comprehensible information contributed to low application rates. We examined if by providing in-person information to farmers, thus lowering farmers’ cost of information search, their interest in program participation could be piqued.
The results of our investigation indicate that although the information campaign raised farmers’ knowledge about the Macedonian RDP, it did not increase their intention to participate in the program. Instead, it enhanced the perception that the RDP involvement required substantial administrative work from household owners. Furthermore, we found some heterogeneity in the effects by farm profitability. Whereas the information campaign appeared to increase knowledge among profitable farmers, it negatively affected the intention to use RDP support and increased perceived administrative burden among unprofitable farmers.
A caveat of the current study is that the intended randomization of the information brochure could not be properly implemented by the interviewers. We tackled this issue by controlling for observed covariates both in linear regression and nonparametric estimation. Notwithstanding potential limitations, the study's results suggest that the government should consider ways to improve RDP implementation and make it more accessible for Macedonian farmers, possibly by easing the administrative hurdle associated with program participation. Future research could investigate costs and benefits of modifying the financing mode of RDP measures to make them more affordable for break-even and unprofitable farmers.
Supplementary material
The supplementary material for this article can be found at https://doi.org/10.1017/age.2018.4


 Open access