

Introduction
The literature on suicide has identified consistent relationships between occupation and suicide. The following occupations have all been identified with high risks: farmers (Hawton et al. Reference Hawton, Fagg, Simkin, Harriss and Malmberg1998; Stark et al. Reference Stark, Gibbs, Hopkins, Belbin, Hay and Selvaraj2006; Andersen et al. Reference Andersen, Hawgood, Klieve, Kõlves and De Leo2010), doctors (Steppacher & Mausner, Reference Steppacher and Mausner1974; Charlton, Reference Charlton1995; Hawton et al. Reference Hawton, Clements, Simkin and Malmberg2000, Reference Hawton, Clements, Sakarovitch, Simkin and Deeks2001, Reference Hawton, Agerbo, Simkin, Platt and Mellanby2011; Meltzer et al. Reference Meltzer, Griffiths, Brock, Rooney and Jenkins2008), nurses (Charlton, Reference Charlton1995; Meltzer et al. Reference Meltzer, Griffiths, Brock, Rooney and Jenkins2008; Andersen et al. Reference Andersen, Hawgood, Klieve, Kõlves and De Leo2010; Hawton et al. Reference Hawton, Agerbo, Simkin, Platt and Mellanby2011), dentists (Meltzer et al. Reference Meltzer, Griffiths, Brock, Rooney and Jenkins2008; Hawton et al. Reference Hawton, Agerbo, Simkin, Platt and Mellanby2011), veterinarians (Charlton, Reference Charlton1995; Platt et al. Reference Platt, Hawton, Simkin and Mellanby2010), pharmacists (Charlton, Reference Charlton1995; Hawton et al. Reference Hawton, Agerbo, Simkin, Platt and Mellanby2011), police (Cantor et al. Reference Cantor, Tyman and Slater1995; Marzuk et al. Reference Marzuk, Nock, Leon, Portera and Tardiff2002), the military (Thoresen et al. Reference Thoresen, Mehlum and Moller2003; Mahon et al. Reference Mahon, Tobin, Cusack, Kelleher and Malone2005), seafarers (Wickstrom & Leivonniemi, Reference Wickstrom and Leivonniemi1985) and artists (Stack, Reference Stack1996; Andersen et al. Reference Andersen, Hawgood, Klieve, Kõlves and De Leo2010). Easy access to a means of committing suicide (pharmaceuticals, guns or drowning) has become regarded widely as a major determinant of high suicide rates in most of these occupations (Charlton, Reference Charlton1995; Hawton et al. Reference Hawton, Fagg, Simkin, Harriss and Malmberg1998, Reference Hawton, Clements, Simkin and Malmberg2000; Marzuk et al. Reference Marzuk, Nock, Leon, Portera and Tardiff2002; Thoresen et al. Reference Thoresen, Mehlum and Moller2003; Mahon et al. Reference Mahon, Tobin, Cusack, Kelleher and Malone2005; Mann et al. Reference Mann, Apter, Bertolote, Beautrais, Currier, Haas, Hegerl, Lonnqvist, Malone, Marusic, Mehlum, Patton, Phillips, Rutz, Rihmer, Schmidtke, Shaffer, Silverman, Takahashi, Varnik, Wasserman, Yip and Hendin2005; Meltzer et al. Reference Meltzer, Griffiths, Brock, Rooney and Jenkins2008; Platt et al. Reference Platt, Hawton, Simkin and Mellanby2010).
This evidence has been compiled largely from two main types of study: first, studies that have used national mortality statistics to investigate suicide rates, across occupations or occupational groups, usually measured in terms of standardized mortality ratios (SMRs) or proportional mortality ratios (PMRs); and second, from autopsy or cohort studies of individual high-risk occupation(s), which have usually measured suicide rates per 100 000 population at risk. No previous studies have compared suicide rates per 100 000 for every occupation on a national basis, how they have changed over time and how they compare with SMRs and PMRs.
The main objectives of this study were to compare suicide rates across all occupations in Britain, to establish how they have changed over the past 30 years, how they compare with SMRs and PMRs, and how they vary by occupational socio-economic group.
Method
We collected information on the numbers of suicides and the numbers of people employed in every occupation in England and Wales from 2001 to 2005 through a commissioned request to the Office for National Statistics (ONS), the official government organization that records mortality (www.ons.gov.uk/ons/index.html). The 2000 Standard Occupational Classification (SOC 2000) was used by the ONS to categorize every occupation (ONS, 2012).
To assess changes over time in occupational suicide rates, similar information on the numbers of suicides during the four years 1979–1980 and 1982–1983 and occupational populations (during 1981) were obtained from the Office of Population Censuses and Surveys (OPCS) 1981 occupational mortality decennial supplement. The OPCS preceded the ONS and used the 1980 International Standard Classification of Occupations (ISCO-1980) to classify every occupation (OPCS, 1986). Information on suicides that occurred during the 1981 census year were not available because of industrial action by death registration officers that year.
We included deaths from injuries and poisoning that were of undetermined intent, and are equivalent to coroners' ‘open verdicts’ (ICD-9 codes for 1979–1980 and 1982–1983: E980–E989; ICD-10 codes for 2001–2005: Y10–Y33.8, Y34) along with the suicides (ICD-9 and ICD-10 codes E950–E959 and X60–X84 respectively).
Unlike suicides in all other occupations, suicides among the maritime occupations (including merchant seafarers, sea fishermen and offshore workers) that occur at sea are not usually registered with local registrars of deaths in Britain, and are not included in national mortality statistics and decennial supplements, but are registered instead by the Registry of Shipping and Seamen (RSS). We therefore also identified all suicides, disappearances at sea and drowning of undetermined intent (equivalent to open verdicts) in the maritime occupations from death inquiry files and death registers held at the RSS.
The main study outcome measures were suicide rates per 100 000 population, SMRs and PMRs. Suicide rates per 100 000 population were calculated with the numbers of deaths from suicide and open verdicts in each occupation as numerators and the census-based population counts for each occupation as denominators. SMRs and PMRs were obtained from the OPCS publication for 1979–1980 and 1982–1983 (OPCS, 1986). SMRs for suicide provide a comparison of suicide mortality for a specific occupation compared with the corresponding age-matched general British population, by applying the age-specific suicide (and open verdict) rates in the general population to the age structure of the study occupation to calculate the expected deaths, and then dividing the observed deaths by the expected deaths. This ratio is multiplied by 100, so that SMRs >100 indicate increased suicide mortality. PMRs also provide a ratio of observed and expected deaths, but where the expected deaths are based on the age-specific proportions of deaths from suicide (and open verdicts) in the general population. PMRs >100 also indicate increased suicide mortality. Occupational socio-economic group was measured using the nine-level SOC 2000 classification (1 = managers and senior officials, 2 = professional occupations, 3 = associate professional and technical occupations, 4 = administrative and secretarial occupations, 5 = skilled trades occupations, 6 = personal service occupations, 7 = sales and customer service occupations, 8 = process, plant and machine operatives, 9 = elementary occupations (ONS, 2012).
Suicide rates per 100 000 population were compared across occupations, between the two study time periods and between men and women, using 95% confidence intervals and percentage changes over time in suicide rates. Simple ordinary least squares linear regression was used to assess socio-economic variation in suicide rates across occupations, with the suicide rate per 100 000 as the outcome measure and the nine-category socio-economic classification as the categorical explanatory factor, and by assessing the percentage variation explained (the R 2 statistic) by the explanatory factor. Fisher's exact test was used, first, to compare the proportions of occupations with suicide rates that increased or decreased over time that were manual occupations and, second, to compare the proportions of occupations among men and women that were manual (2 × 2 contingency tables). Fisher's exact test was used as some of the expected values in the contingency tables were less than five. Other statistical methods used include Pearson's correlation coefficients to assess correlations between SMRs, PMRs and suicide rates per 100 000 population. Statistical significance was measured at the conventional 5% level.
Results
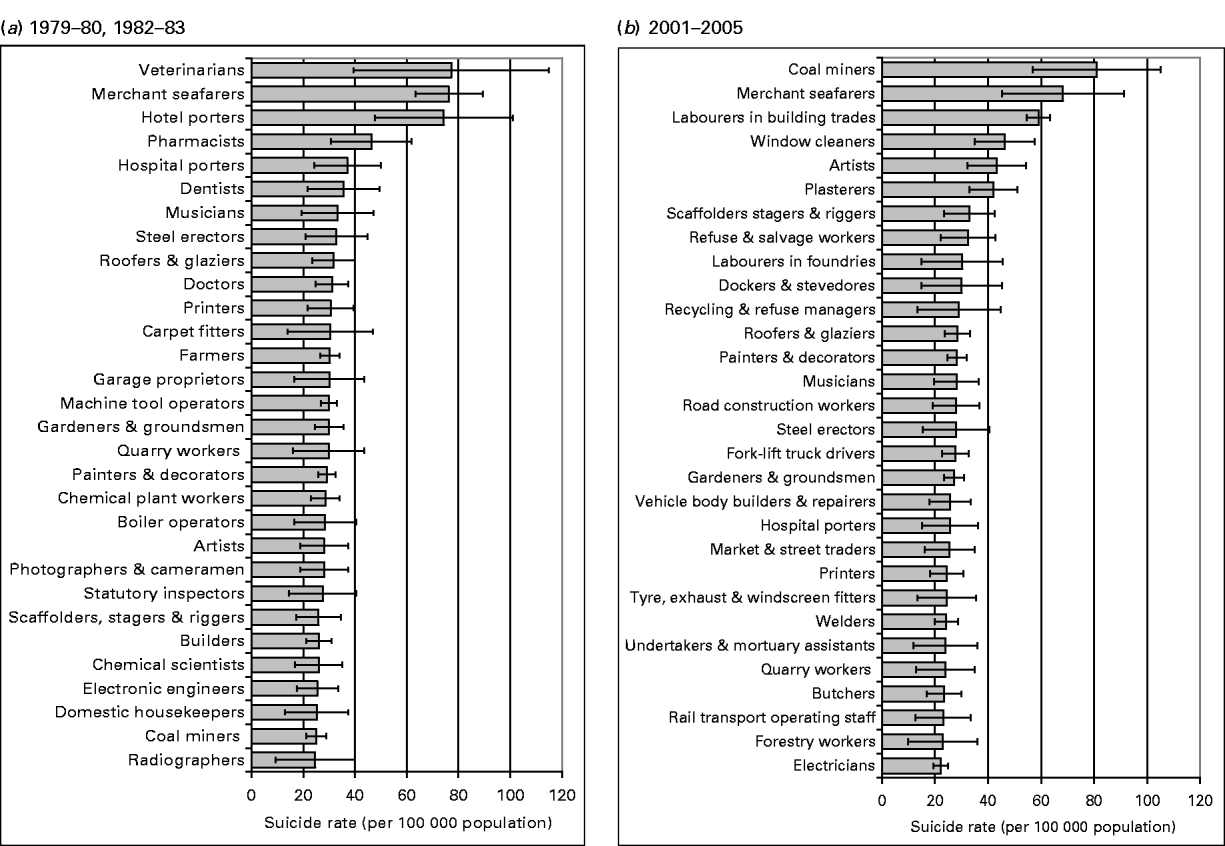
The 30 occupations with the highest suicide rates are shown for the two study time periods 1979–1980, 1982–1983 (Fig. 1a) and 2001–2005 (Fig. 1b). During the earlier time period, the highest suicide rates were among veterinarians (77 per 100 000 worker-years), followed by merchant seafarers (76), hotel porters (74), pharmacists (46), hospital porters (37) and dentists (36). During the more recent time period 2001–2005, coal miners had the highest suicide rate (81 per 100 000 worker-years), followed by other manual occupations: merchant seafarers (68), labourers in building trades (59) and window cleaners (46).

Fig. 1. Suicide rates for the 30 occupations with the highest suicide rates in (a) 1979–1980, 1982–1983 and (b) 2001–2005. Horizontal bars represent 95% confidence intervals. This figure includes only those occupations with at least 10 suicides. Occupations with high suicide rates (>20 per 100 000) that have been excluded because of low suicide numbers (<10 cases) are as follows: clothes designers (suicide rate = 51.6 per 100 000 in 1979–1980, 1982–1983); chemical engineers (46.2 in 2001–2005) and traffic wardens (26.8 in 2001–2005).
Occupational suicide rates for men and women
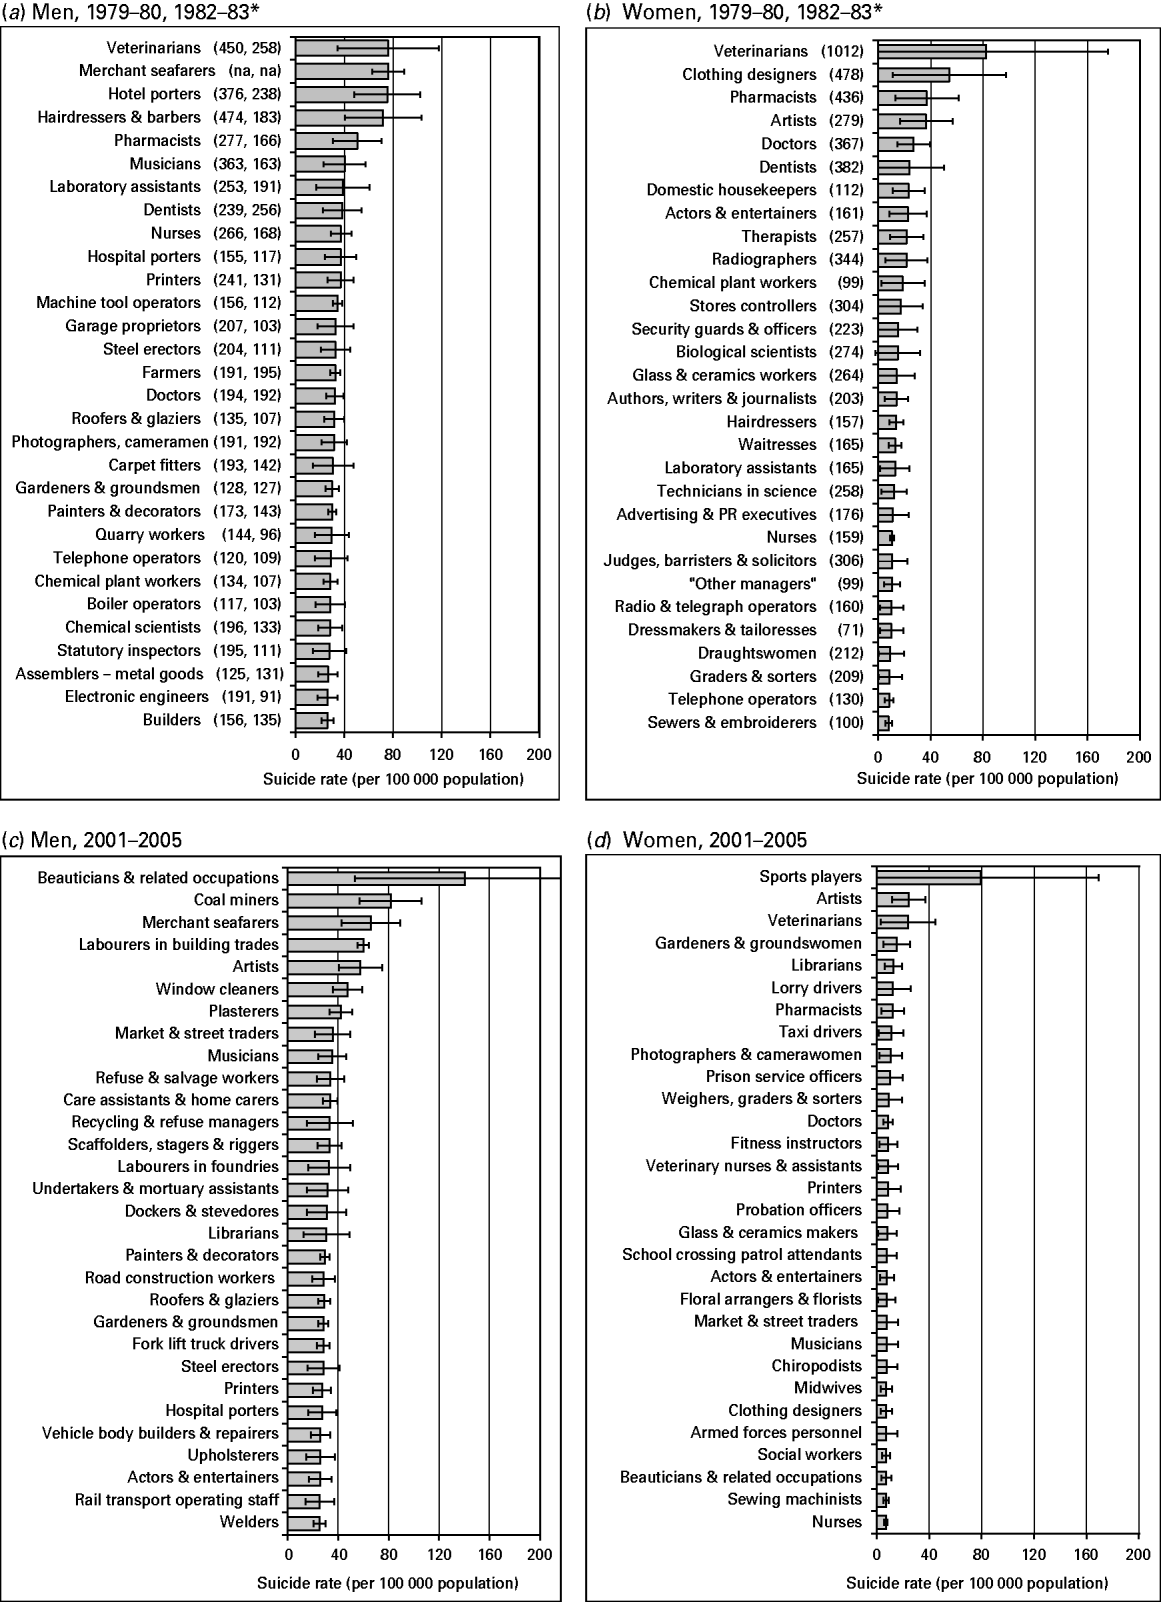
Suicide rates for the 30 occupations with the highest suicide rates are shown separately for men and women in the earlier period 1979–1980, 1982–1983 (Fig. 2a, b, respectively) and in the later period 2001–2005 (Fig. 2c, d). In both time periods, occupational suicide rates were much higher among men than women. More of the high-risk occupations among men than women were manual occupations (15/30 v. 8/30 in 1979–1980 and 1982–1983 and 17/30 v. 7/30 in 2001–2005), although, using Fisher's exact test, this finding was of marginal significance in 2001–2005 (p = 0.017) and in the earlier period (p = 0.11). Reflecting the lower suicide rates among women, significant differences in suicide rates between individual occupations were less frequent among women than men.
Fig. 2. Suicide rates for the 30 occupations with the highest suicide rates in (a) men, 1979–1980, 1982–1983, (b) women, 1979–1980, 1982–1983, (c) men, 2001–2005, and (d) women, 2001–2005. Values in parentheses are standardized mortality ratios (SMRs) and proportional mortality ratios (PMRs) for men and PMRs for women. Horizontal bars represent 95% confidence intervals. This figure includes only those occupations with at least 10 suicides among men, and three among women, in either time period, 1979–1980 and 1982–1983 or 2001–2005 (suicide rates were about three times higher among men than among women). n.a., Not available.
Both SMRs and PMRs were available for men during the earlier period (see Fig. 2a). There was a correlation of 0.90 between the SMR and the suicide rate per 100 000 population and a correlation of 0.68 between the SMR and the PMR.
Changes over time in occupational suicide rates
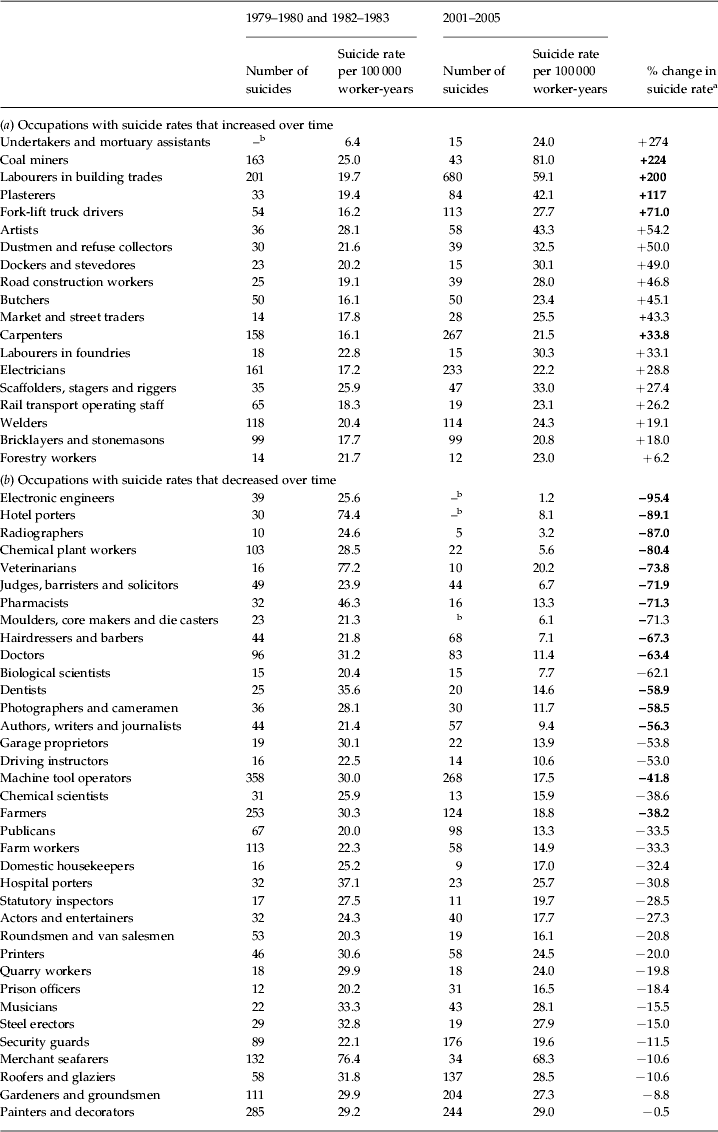
Of 55 ‘high-risk’ occupations with suicide rates of >20 per 100 000 in either of the two study time periods, there were significant reductions (p < 0.05) over time in suicide rates for 14 of these 55 occupations (Table 1): electronic engineers (95%), hotel porters (89%), radiographers (87%), chemical plant workers (80%), veterinarians (74%), judges, barristers and solicitors (72%), pharmacists (71%), hairdressers and barbers (67%), doctors (63%), dentists (59%), photographers and cameramen (59%), authors, writers and journalists (56%), machine tool operators (42%) and farmers (38%). Conversely, there were significant increases over time in suicide rates for five of the 55 occupations (Table 1): coal miners (224%), labourers in building trades (200%), plasterers (117%), fork-lift drivers (71%) and carpenters (34%).
Table 1. Suicide rates for high-risk occupations (>20 suicides per 100 000 in either time period) that (a) increased and (b) decreased over time from 1979–1980 and 1982–1983 to 2001–2005: occupations are ranked by the size of the percentage increase or decrease in suicide rates
This table includes only those occupations with a suicide rate of >20 per 100 000, and at least 10 suicides, in either time period, 1979–1980 and 1982–1983 or 2001–2005.
a Percentage increases (+) or reductions (–) in the suicide rate that are significant are shown in bold (p < 0.05).
b Because of the small numbers of suicide cases (<5), we have not included the actual numbers of suicides for these occupations.
Occupations with high suicide rates (>20 per 100 000 worker-years in either of the two time periods, 1979–1980, 1982–1983 and 2001–2005) that could not be compared over time because of incompatibility across the ISCO-1980 and SOC 2000 occupational classifications are as follows: for 1979–1980, 1982–1983: carpet fitters (14, 32.7); boiler operators (22, 28.5); builders (109, 26.0); laboratory assistants (17, 24.5); metal polishers (10, 20.4); radio and TV mechanics (26, 20.7); for 2001–2005: window cleaners (65 suicides, 46.2 per 100 000); recycling and refuse disposal managers (13, 29.0); vehicle body builders and repairers (42, 25.8); tyre, exhaust and windscreen fitters (19, 24.5).
Variation in suicide rates according to socio-economic group
Of the 55 high-risk occupations, all five of the occupations with significant increases over time in suicide rates were manual occupations, whereas only three out of 13 occupations that had significant reductions were manual (p = 0.007 using Fisher's exact test). Similarly, 16 of the 18 occupations (89%) in Table 1 with an increase in suicide rate (significant or not), but only 15 of the 37 (41%) with any form of reduction, were manual occupations (p < 0.001). The percentage variation in suicide rates that was explained by (occupational) socio-economic group increased significantly from 11.4% in 1979–1980 and 1982–1983 to 20.7% in 2001–2005.
Discussion
We found that several of the occupations with the highest suicide rates in Britain during the late 1970s and the early 1980s were veterinarians (ranked first), pharmacists (fourth), dentists (sixth), doctors (tenth) and farmers (thirteenth). These mainly professional occupations were considered to have high suicide risks because of an easy occupational access to a method of suicide, pharmaceuticals or guns (Charlton, Reference Charlton1995; Hawton et al. Reference Hawton, Fagg, Simkin, Harriss and Malmberg1998, Reference Hawton, Clements, Simkin and Malmberg2000; Marzuk et al. Reference Marzuk, Nock, Leon, Portera and Tardiff2002; Thoresen et al. Reference Thoresen, Mehlum and Moller2003; Mahon et al. Reference Mahon, Tobin, Cusack, Kelleher and Malone2005; Mann et al. Reference Mann, Apter, Bertolote, Beautrais, Currier, Haas, Hegerl, Lonnqvist, Malone, Marusic, Mehlum, Patton, Phillips, Rutz, Rihmer, Schmidtke, Shaffer, Silverman, Takahashi, Varnik, Wasserman, Yip and Hendin2005; Meltzer et al. Reference Meltzer, Griffiths, Brock, Rooney and Jenkins2008; Platt et al. Reference Platt, Hawton, Simkin and Mellanby2010). Suicide rates for these occupations fell sharply over time whereas occupations that had significant increases over time in suicide rates were manual occupations. Variation in suicide rates that was explained by socio-economic group almost doubled from 11.4% in 1979–1980 and 1982–1983 to 20.7% in 2001–2005.
The mortality information sources for establishing suicides in this study are well established (Charlton et al. Reference Charlton, Kelly, Dunnell, Evans, Jenkins and Wallis1992, Reference Charlton, Kelly, Dunnell, Evans and Jenkins1993; Charlton, Reference Charlton1995; Kelly et al. Reference Kelly, Charlton and Jenkins1995; Kelly & Bunton, Reference Kelly and Bunting1998; Roberts, Reference Roberts2002; Meltzer et al. Reference Meltzer, Griffiths, Brock, Rooney and Jenkins2008), so that case ascertainment is very good. Our study reports on suicide rates per 100 000 population across all occupations nationally, how these suicide rates have changed across two time periods in the past 30 years and how they compare with SMRs and PMRs. PMRs are used widely to measure occupational suicide rates, often in the absence of age-specific occupational population counts to calculate SMRs. However, as they compare suicide mortality with mortality from all other causes, they can be affected by the age or socio-economic composition of a given occupation and its predisposition to mortality from natural causes. For example, in the earlier time period, male dentists and printers had very similar SMRs (239 and 241 respectively) and very similar suicide rates per 100 000 (38.3 and 37.1 respectively) but dentists had a much higher PMR than printers (256 v. 131), which reflects the much lower mortality (socio-economic related) from other (mainly natural) causes among dentists. Thus a high PMR can reflect low mortality from natural causes rather than a high suicide rate. However, as PMRs (unlike SMRs) do not require census-based (or age-specific) occupational populations, they can be readily calculated in all years between censuses. They are also based solely on death certificate data and are therefore not subject to discrepancies between census occupations and occupations recorded on death certificates that can affect SMRs. Advantages of SMRs over PMRs are that they provide an actual suicide rate compared with the general population, that is unaffected by other causes of mortality that vary across occupations. It is also important to note that both SMRs and PMRs are measures of mortality at a particular point in time that are relative to a general population and mortality from all other causes respectively. As these reference measures change over time, SMRs and PMRs are not appropriate for establishing changes over time in mortality.
As we found that actual suicide rates per 100 000 were correlated very strongly with SMRs (0.90) and more strongly than between SMRs and PMRs (0.68), this suggests that suicide rates per 100 000 are a useful additional measure. Our comparison of all occupations using actual rates is also useful in helping to identify the highest risk occupations for preventative purposes, and to assess changes over time in suicide rates, and it adds new evidence to the existing literature on occupation and suicide.
Study limitations include a necessary reliance on time periods around decennial censuses (1981 and 2001) to estimate populations at risk in each occupation. 1979–1980 and 1982–1983 coincided with an economic trough whereas economic expansion occurred from 2001 to 2005. The earlier time period, unlike the latter, included Scotland with England and Wales. Because Scotland adds 12% to the population of England and Wales, and because suicide rates in England, Wales and Scotland are broadly comparable, this should not affect the study findings substantially. If anything, suicide rates in Scotland are slightly higher than in the rest of the UK (La Vecchia et al. Reference La Vecchia, Lucchini and Levi1994), which may slightly underestimate our observed increases over time in occupational suicide rates that mainly affected manual occupations. Unlike the earlier time period, SMRs and PMRs were not published for 2001–2005, and SMRs were available only for men. There were also some changes over time in the national occupational classifications from ISCO-1980 to SOC 2000 so that it was not possible to assess changes over time in suicides rates for every occupation: details for these occupations are provided in the footnotes to Table 1. There have also been changes over time in the patterns of attributing suicide verdicts, open verdicts (included in this study as per convention) and accident verdicts (excluded) at coroners' inquisitions (Gunnell et al. Reference Gunnell, Hawton and Kapur2011), although these changes would be insufficient to affect the study suicide rates substantially.
Our study shows highest occupational suicide rates in coal mining and other mainly manual occupations such as merchant seafaring, labouring in building trades, and window cleaning. Like coal mining, the British merchant shipping industry has undergone major contraction and reconfiguration, particularly during the 1980s, resulting in the loss of traditional patterns of employment in some communities, which may have affected suicide rates for these occupations. Other occupations with suicide rates that increased significantly or sharply (>40%) over time were also mainly manual trades and occupations; including plasterers, fork-lift truck drivers, dustmen and refuse collectors, dockers and stevedores, road construction workers and butchers. Many of these occupations have undergone major changes over time in socio-economic conditions that, when interacted with other factors such as re-employment prospects, the ability to adjust to change and to manage stress, may have affected suicide rates for these occupations.
We also found that the variation in suicide rates that was explained by socio-economic group almost doubled over time. This further suggests that, although access to a means of suicide contributes to high suicide risks in some occupations, socio-economic forces now seem to have become a major determinant of high occupational suicide rates in Britain. Suicide rates were much higher among men than among women, and more of the high-risk occupations among women than men were professional or non-manual rather than manual, which suggests that socio-economic forces are a stronger determinant of occupational suicide rates among men than among women.
In addition to socio-economic forces and easy access to a means of suicide, social isolation at work (Trout, Reference Trout1980; Berkman et al. Reference Berkman, Melchior, Chastang, Niedhammer, Leclerc and Goldberg2004) and the natural selection of high-risk people to certain occupations (Sundby, Reference Sundby1956; Hemmingsson et al. Reference Hemmingsson, Lundberg, Nilsson and Allebeck1997) are regarded as two other important factors in the relationship between occupation and suicide. This may partly explain the high suicide rates witnessed for occupations such as artists, actors and entertainers, musicians and merchant seafarers. Nurses have previously been identified with high suicide rates (Charlton, Reference Charlton1995; Meltzer et al. Reference Meltzer, Griffiths, Brock, Rooney and Jenkins2008; Andersen et al. Reference Andersen, Hawgood, Klieve, Kõlves and De Leo2010; Hawton et al. Reference Hawton, Agerbo, Simkin, Platt and Mellanby2011), and featured in the 30 highest risk occupations among women in our study. Other health care- or mortality-related occupations that also had fairly high suicide rates in our study were undertakers and mortuary assistants, hospital porters, radiographers and midwives, although it is unclear whether the high risks more strongly reflect some form of occupational exposure or selection effects towards these occupations.
The increases in suicide rates in our study for many manual occupations occurred during a period of relative economic prosperity. It is generally assumed that suicide rates rise during economic downturns with increases in unemployment (Lewis & Sloggett, Reference Lewis and Sloggett1998; Gunnell & Lewis, Reference Gunnell and Lewis2005; Schneider et al. Reference Schneider, Grebner, Schnabel, Hampel, Georgi and Seidler2011), and are higher in more deprived areas (Rezaeian et al. Reference Rezaeian, Dunn, St Leger and Appleby2007), especially as wider social inequalities have also been linked to poorer health, mental illness and increases in suicide (Wilkinson & Pickett, Reference Wilkinson and Pickett2007).
A suicide reduction target was first set in Britain in 1992 (Department of Health, 1992) and further refined in subsequent initiatives (Department of Health, 1999, 2002). Much has been made of the importance of access to a means as a major risk factor for suicide in certain occupational groups. Access to the means of prevention may also be very important. These would include mental health promotion and suicide prevention initiatives, with improvements aimed at the availability, access and use of specialist health and social care services in contact with occupational groups. For example, following targeting of community-wide preventative initiatives and increased awareness (Shaw, Reference Shaw2004), high suicide rates among farmers in Britain have fallen (Hawton et al. Reference Hawton, Fagg, Simkin, Harriss and Malmberg1998; Booth & Lloyd, Reference Booth and Lloyd2000; Stark et al. Reference Stark, Gibbs, Hopkins, Belbin, Hay and Selvaraj2006). This indicates that carefully targeted suicide prevention initiatives for other occupations could be important.
Suicide is an important public health problem worldwide, causing almost one million deaths each year, which are rising in many regions and countries (Yip, Reference Yip2011). Suicide prevention is typically addressed by a combination of interventions targeted at population level or at specific high-risk groups. Population-level interventions often involve education, promoting help seeking or by restricting access to means (Yip, Reference Yip2011; Yip et al. Reference Yip, Caine, Yousuf, Chang, Wu and Chen2012). Target groups have frequently been defined by age group or health-care setting (Jenkins, Reference Jenkins2002). Both the World Health Organization (WHO) and the European Union (EU) have helped to develop and monitor national suicide prevention strategies in member states that are linked, where possible, to other public health policies (WHO, 2002). However, the evidence about the effectiveness of individual interventions is still fairly weak and unclear (Guo & Harstall, Reference Guo and Harstall2004; Mann et al. Reference Mann, Apter, Bertolote, Beautrais, Currier, Haas, Hegerl, Lonnqvist, Malone, Marusic, Mehlum, Patton, Phillips, Rutz, Rihmer, Schmidtke, Shaffer, Silverman, Takahashi, Varnik, Wasserman, Yip and Hendin2005; Hegerl et al. Reference Hegerl, Wittenburg, Arensman, Van Audenhove, Coyne, McDaid, van der Feltz-Cornelis, Gusmão, Kopp, Maxwell, Meise, Roskar, Sarchiapone, Schmidtke, Värnik and Bramesfeld2009). Systematic reviews to date on suicide prevention targeted at specific occupational groups, for example veterans, have highlighted the methodological heterogeneity and small size of trials to date (O'Neill et al. 2012). Our study shows an increased impact of occupational socio-economic risk factors on suicide rates. If similar findings are confirmed for occupations in other European and western countries, which have undergone similar socio-economic changes, this could help in developing new suicide prevention interventions that can be targeted at specific occupational groups.
Acknowledgements
We are grateful to B. Johnson and the Office for National Statistics for providing information and advice on occupational suicides (and open verdicts) and occupational populations at risk, and for advice on matching occupations across occupational classifications; and to the Registry of Shipping and Seamen for providing access to death inquiry files and death registers to identify suicides in the maritime occupations.
Declaration of Interest
None.

 Open access