


1. Introduction
In Spring 2021, ProBogotá—a business organization including important private companies in Colombia—publicly urged the right-wing government of Iván Duque to pass more progressive tax reform to raise social spending and alleviate the economic hardships faced by low-income citizens during the COVID-19 pandemic (El Espectador, 2021). Similarly, the president of the National Business Association of Colombia (ANDI)—the country’s most important private sector association—recommended to the Duque government that the tax reform be designed to make the wealthy pay more, without affecting other social classes (El Tiempo, 2021). However, a year later these same representatives of business and high-income sectors were quick to oppose a progressive tax reform under newly elected left-wing president Gustavo Petro. Surprisingly, Petro’s reform was largely in line with what business organizations had advocated for a year before. What explains these different postures in the face of similar policy proposals? When and why do the wealthy support redistribution?
In this paper, we examine the effect of who is in power on the wealthy’s preferences for redistribution. Two bodies of scholarship provide leads for answering this question. On the one hand, canonical political economy models assume that individuals are self-interested and aim to maximize their wealth (see Meltzer and Richard, Reference Meltzer and Richard1981; Alesina and Rodrik, Reference Alesina and Rodrik1994): redistributive preferences are a function of material self-interest and decrease with income. On the other hand, partisan-motivated reasoning theory suggests that partisanship is a crucial factor shaping preferences over redistribution (Bartels, Reference Bartels2008; Bafumi and Shapiro, Reference Bafumi and Shapiro2009), especially when increased taxation targets the affluent (Ballard-Rosa et al., Reference Ballard-Rosa, Martin and Scheve2017). These effects have been detected even in weak partisan contexts (Samuels and Zucco, Reference Samuels and Zucco2014).
We lean on the literature that shows that the wealthy support redistribution under the Right (Fairfield and Garay, Reference Fairfield and Garay2017; Flores-Macías, Reference Flores-Macías2022) to bridge the two bodies of scholarship.Footnote 1 Consistent with a material self-interest explanation, we posit that, in contexts of high and increasing inequality, the wealthy might be in favor of some form of controlled redistribution to avoid potentially bigger losses in the future, such as more radical forms of redistribution. Drawing on the partisan effects literature, we further argue that the wealthy expect redistribution to be controlled (i.e., less costly, more reliable, and more predictable) when a right-wing government is in power, and they are thus more likely to support redistribution under the Right than under the Left. We theorize three possible considerations that might explain why the wealthy see redistribution under the Right as a more “controlled” form of redistribution (vis-à-vis when the Left enacts it) and thus might motivate them to support it: (1) uncertainty—i.e., the wealthy are less uncertain about the upper bound of redistributive policies when the Right is in power vis-à-vis the Left; (2) efficiency—i.e., the wealthy believe that a right-wing government is more likely than a left-wing one to actually redistribute to the poor the taxes collected from the rich; and (3) instability—i.e., the wealthy consider the Right less likely than the Left to generate macroeconomic instability while implementing redistributive policies.
To test our theory, we conducted pre-registered online vignette survey experiments with wealthy individuals in Colombia during the 2022 presidential election. This case study is an ideal setting to test our argument for four reasons. First, inequality in Colombia has been increasing over the last five years and it has been a central issue in the political debate since the 2021 protests.Footnote 2 Second, the electoral campaign made the Left-Right cleavage more salient, which makes the ideological positioning of the prospective government a key consideration in respondents’ minds. Third, Colombia has a socioeconomic stratification system that allows us to sample wealthy individuals. Fourth, Colombia is an extremely low partisan identification context, which allows us to test the limits of the partisan effects theory.
Results are consistent with our theory and undermine the material self-interest assumption of seminal political economy models. We find that who is in power (i.e., the Right or the Left) affects preferences for redistribution among the wealthy, even in low partisan identification contexts. In particular, we show that the affluent are more likely to support redistribution under the Right than the Left. We find that expectations of efficiency and economic instability are higher and lower, respectively, with a prospective right-wing government compared to a left-wing one. We find similar effects for non-redistributive policies: wealthy individuals are more likely to support restrictive migration policies and the expansion of the police force when these policies are proposed by a right-wing government. The ideologically diversified composition of our sample also allows us to test our argument on the left-wing wealthy as well. We find heterogeneous treatment effects for preferences and expectations of efficiency across the Left-Right cleavage: respondents are much more likely to support policies promoted by the candidate closer to their ideological position and expect him/her to be much more efficient in redistributing to the poor the taxes collected from the rich. We find similar effects for non-redistributive policies. Expectations of economic instability constitute an exception, as we find that left-wing wealthy do not expect a right-wing government to create macroeconomic instability when enacting redistribution.
While our findings are largely consistent with a standard party/leader cueing argument, what distinguishes our work from previous cueing experimental studies on policy preferences (see, e.g., Samuels and Zucco Reference Samuels and Zucco2014; Barber and Pope, Reference Barber and Pope2019) is the fact that the redistributive policies we use in our experiments are explicitly and directly financially costly for all of our respondents. Redistribution (and particularly increasing taxation on the rich) is a policy area where partisan/leader-motivated reasoning and protection of one’s own self-interest might clash in the minds of wealthy respondents. Thus, our experimental design allows us to determine whether partisan/leader motivated reasoning can lead respondents to accept bearing the cost of a policy promoted by their preferred candidate, hence setting aside their immediate material self-interest. In a way, we are testing the limits of party/leader cueing effects: will respondents be willing to support a policy that is costly for them if their preferred candidate is the one enacting it? This is something that other cueing studies cannot do, either because they simply do not include raising taxes on the rich as a policy in their experimental items (Samuels and Zucco Reference Samuels and Zucco2014) or because their sample includes respondents from social strata that would not be financially harmed by a tax increase on the rich (Barber and Pope, Reference Barber and Pope2019).
This article makes two important contributions. First, it contributes to the literature on policy preferences of wealthy individuals. We add to that body of scholarship by showing that affluent people might support redistribution depending on the ideological orientation of the government in charge of implementing it. In particular, we find that the wealthy tend to be more willing to go against their immediate self-interest and support redistribution if the Right is enacting it. This article also provides evidence suggesting that the wealthy have no fixed policy preferences in the realm of taxation and redistribution, which has a direct bearing on their immediate self-interest. Second, this article joins a recent body of scholarship on taxation in Latin America that explores the political factors behind different levels of taxation (Flores-Macías, Reference Flores-Macías2019, Reference Flores-Macías2022). As we show, political preferences and expectations of efficiency and instability affect support for tax increases among the wealthy.
2. Preferences for redistribution in wealthy individuals
Despite the abundance of research examining the redistributive preferences of the general public, there is a scarcity of empirical studies that focus on the preferences of affluent individuals. Limited data availability and survey underreporting have prevented scholars from investigating the policy preferences of this group. We consider the lack of studies on the policy preferences of the wealthy—and particularly on redistribution—to be problematic for two main reasons. First, we know that policy usually reflects the preferences of the wealthy (Gilens, Reference Gilens2012; Page et al., Reference Page, Bartels and Seawright2013; Persson and Sundell, Reference Persson and Sundell2024), yet we rarely know what these preferences are, given the dearth of studies sampling the rich beyond the US. Second, we know that in the current historical context of great and increasing wealth inequality (Piketty, Reference Piketty2014; Zucman, Reference Zucman2019; Hoffmann et al., Reference Hoffmann, Lee and Lemieux2020), the political clout of the wealthy is only likely to grow, making it even more necessary to inquire into their preferences. In particular, what behooves us is to discover under what conditions they are more likely to accept and even support redistribution, given that their opposition is often enough to prevent the adoption of such policies (Page and Seawright, Reference Page and Seawright2023).
Two strands of literature provide insights into the redistributive preferences of the wealthy, generating opposite theoretical predictions. On the one hand, the class-based explanation grounded in the political economy literature predicts that the wealthy oppose redistribution because it goes against their material interests. On the other hand, the partisanship explanation predicts that individuals’ partisanship determines their policy preferences, with left-wing individuals supporting redistribution and right-wing individuals opposing it. The wealthy are interesting to study because it is the group where the two perspectives might collide: do the wealthy reject redistribution no matter what or does their partisanship play a role in shaping their preferences in such a sensitive policy area? In this section, we review the two dominant explanations and present our theory as an alternative.
2.1. Class-based explanation
The very common assumption in political economy models is that the wealthy oppose redistribution because it negatively affects them materially (Boix, Reference Boix2003; Acemoglu and Robinson, Reference Acemoglu and Robinson2006). A recent body of scholarship provides support for this assumption. Page et al. Reference Page, Bartels and Seawright(2013) find that affluent respondents prefer less regulation, fewer social welfare programs, and oppose government redistribution. Using a larger sample of affluent Americans, Suhay et al. Reference Suhay, Klašnja and Rivero(2021) present descriptive information pointing in the same direction: the rich are more economically conservative than the have-nots. Lopez et al. Reference Lopez, Silva, Teeger and Marques2022 focus on the Global South and conduct interviews with political and economic elites in Brazil, South Africa, and Uruguay. They find that the wealthy oppose redistribution because they see the poor as irrational and manipulable and redistribution toward them as a waste of money.
Although the abovementioned findings suggest that the wealthy prefer less redistribution, another set of studies shows that the rich do not always oppose it. Dimick et al. Reference Dimick, Rueda and Stegmueller(2016) show that increases in inequality boost support for redistribution among the rich. Rueda and Stegmueller Reference Rueda and Stegmueller(2016) zoom in on this association and demonstrate that high levels of inequality trigger fear of crime among the rich, who then support redistribution to curb inequality. Berens and von Schiller Reference Berens and von Schiller(2017) find that when trust in institutions increases, affluent people are more likely to favor progressive income taxes. Despite these important findings, we still know relatively little about the effect of incumbents’ ideological orientation on support for redistribution among the rich. This paper seeks to fill this gap.
2.2. Partisanship explanation
The literature on partisan-motivated reasoning provides another promising lead to answer our question. We know that the wealthy have heterogeneous partisanship preferences (Gilens, Reference Gilens2012; Gilens and Thal, Reference Gilens and Thal2018; Broockman et al., Reference Broockman, Ferenstein and Malhotra2019) and that partisanship can influence economic behavior (McConnell et al., Reference McConnell, Margalit, Malhotra and Levendusky2018) and individual preferences in many policy areas, including redistribution (Bartels, Reference Bartels2008; Gilens, Reference Gilens2012). Scholarly work has shown that partisanship can even trump ideological commitments to policy preferences (Barber and Pope, Reference Barber and Pope2019). However, our knowledge of the effects of partisanship on policy preferences is built mostly on insights from the United States, a context with traditionally strong partisanship identification. Samuels and Zucco Reference Samuels and Zucco(2014) found partisan effects also in the case of Brazil, a country with comparatively lower levels of partisan identification. What happens in the quite common case of even lower party identification, such as Colombia?Footnote 3 This paper seeks to answer this question as well.
2.3. Toward a theory of wealthy’s support for redistribution
The theory we put forward lies at the intersection between the two explanations just discussed. Our goal is, indeed, to bridge them. First, we argue that class matters and that the material conditions of the wealthy affect their calculations about whether to support redistribution. As the political economy literature shows, self-interested calculation can lead the wealthy to support redistribution in order to avoid potentially bigger losses. This logic applies to contexts of high and increasing inequality, where the wealthy are more open to conceding to redistribution to avoid social unrest or the election of radical governments less prone to protect their interests (Acemoglu and Robinson, Reference Acemoglu and Robinson2006).Footnote 4 We posit that, to prevent these scenarios, the wealthy support controlled redistribution, i.e., redistribution with well-established limits that they believe would not put individual and national economic stability at risk.
Second, we argue the wealthy hold different expectations about the material costs that they will pay from redistribution depending on the ideological orientation of the government enacting the redistributive process. These expectations constitute the wealthy’s conception of “controlled” redistribution. We build on recent work by Flores-Macías Reference Flores-Macías(2022), who argues that government ideology matters for the willingness of the wealthy to support redistribution. Right-wing governments, he argues, enjoy greater credibility among economic elites, which contributes to overcoming the usual mistrust between the affluent and the government and provides guarantees that the interests of the wealthy will be protected during the redistributive process. Specifically, we argue that the wealthy are more likely to support redistribution under the Right rather than the Left because they see the former as a more reliable option to address socioeconomic disparities.
Indeed, there are several examples of redistribution under the Right in Latin America. In Colombia, right-wing president Álvaro Uribe (2002–2010) implemented a wealth tax in 2002 to enlarge the military and increase the provision of social services. During his inaugural speech, Uribe declared that the wealthiest and the businessmen would need to take on their shoulders new tax responsibilities. In fact, the wealth tax was renewed in 2003, 2006, and 2009 and affected 7000 individuals and some corporations (Rodríguez-Franco, Reference Rodríguez-Franco2016). In Mexico, right-wing presidents Vicente Fox (2000–2006) and Felipe Calderón (2006–2012) extended health care, income support, and pension programs to the low-income population. Importantly, Calderón enacted tax reform in 2007 targeting business elites. In Chile, former president Sebastián Piñera (2010–2014 and 2018–2022) increased a corporate tax from 17% to 20% despite business’ opposition; it was the largest tax increase in three decades (Fairfield and Garay, Reference Fairfield and Garay2017). In Argentina, Mauricio Macri (2015–2019) expanded the coverage of the conditional cash transfer program Asignación Universal por Hijo (Universal Family Allowance) to curb poverty increase (Niedzwiecki and Pribble, Reference Niedzwiecki and Pribble2017).
There are three reasons behind our argument. First, we claim that the rich are less uncertain about the upper limit of the redistributive policy under the Right relative to the Left. Although some left-wing governments have kept their redistributive promises, others have exceeded them and even threatened property rights. As a consequence, the rich might be uncertain about the scope of the redistributive policy once a left-wing politician is elected. Imagine that both the left- and right-wing candidates make the campaign promise of increasing a progressive tax rate now standing at C by r percentage points (PP), where C is the existing rate and r is the proposed raise. We posit the different levels of support for the same policy proposal across candidates may be explained by the value the wealthy assign to r under the right-wing government vis-à-vis the left-wing government. While the wealthy expect r to be a positive number in both cases, they do not know how much higher r could actually be under a left-wing government compared to a right-wing one. In other words, we expect the wealthy to be less uncertain about the upper bound of a redistributive policy when advanced by a right-wing politician vis-à-vis a left-wing one.
Second, as recent research suggests, the wealthy value government efficiency in delivering social policies (Holland, Reference Holland2018). At the same time, the Right is usually associated with efficiency given its market-oriented approach to social policies (De La O, Reference De La O2015). Therefore, we argue that the wealthy are more likely to support redistribution under the Right because a right-wing government increases expectations of state efficiency in delivering social policies.
Third, the rich value macroeconomic stability (Page et al., Reference Page, Bartels and Seawright2013) because a stable macroeconomic environment allows them to grow their wealth without major risks. Given that the Right prioritizes economic stability more than the Left (Sattler, Reference Sattler2013), we argue that the rich support redistribution under the Right because its commitment to stability limits potential costs associated with redistributive policies (e.g., inflation and increase in public debt). Specifically, we argue that the affluent believe it is less likely that the Right put economic stability at risk when advancing redistributive policies.
On the basis of these three theoretical logics, we propose the following hypotheses:
H1 (Progressive taxation): Right-wing governments increase the wealthy’s support for raising progressive taxes relative to left-wing governments.
H2 (Subsidies): Right-wing governments increase the wealthy’s support for social assistance relative to left-wing governments.
H3 (Uncertainty): Right-wing governments decrease the wealthy’s level of uncertainty about the upper bound of a capital tax relative to left-wing governments.
H4 (Efficiency): Right-wing governments increase the wealthy’s expectation of state efficiency in delivering social policies relative to left-wing governments.
H5 (Instability): Right-wing governments decrease the wealthy’s expectation that social policies will produce economic instability relative to left-wing governments.
3. Research design and data
3.1. Cross-country evidence
We start testing our theory using data from LAPOP 2018/9. We analyze whether differences in government ideology affect preferences for redistribution in Latin American countries.Footnote 5 This survey wave asks respondents whether they agree or disagree that it is fine for the rich to pay a lot in taxes but receive little in state services. As opposed to the common question about redistributive demand,Footnote 6 this question highlights the redistributive dimension of taxation. Responses are measured on a scale from “strongly disagree” (1) to “strongly agree” (7). We follow the standard practice and dichotomize the question to indicate if a respondent strongly supports redistribution (6 or above) or does not. We collect these data along with data on demographics and asset ownership. We use the latter to build income deciles. In addition, we collect data from the Database of Political Institutions to classify governments’ ideologies.
If our theory is correct, we should observe that the wealthy are more likely to support redistribution when there is a right-wing government in charge. While we cannot experimentally manipulate the ideology of the government advancing the redistributive policy, we can compare preferences for redistribution between individuals in countries governed by the Right vis-à-vis the Left while keeping several confounding factors constant.
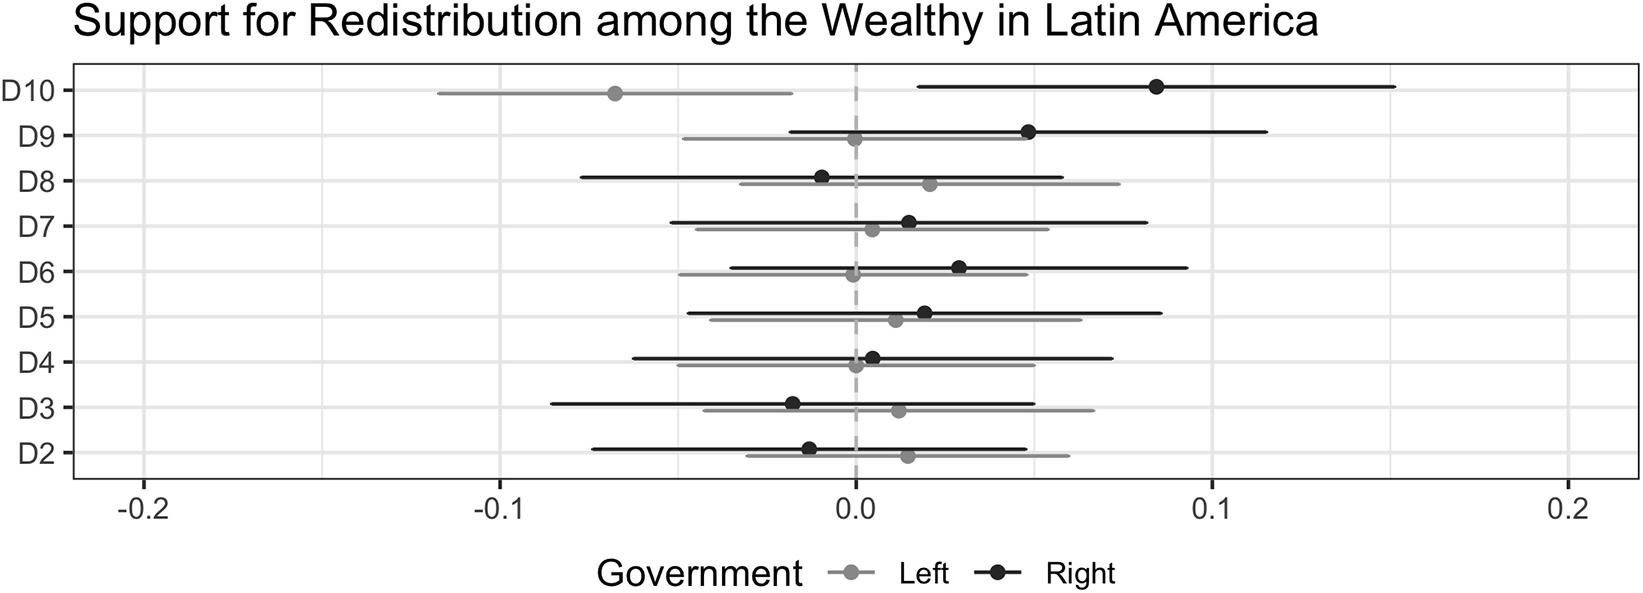
Results are consistent with our theory. Figure 1 shows that the rich (i.e., people in the 10th decile of the income distribution) oppose redistribution under left-wing governments. However, their support for redistribution under right-wing governments is positive and statistically significant. This difference in preference only applies to the wealthy, as we found no significant results for the other nine deciles.
While consistent with our theory, results reported in Figure 1 do not identify causal relations, as several confounding variables might affect the observed associations. The next section presents an experimental design to identify the causal effect of the government’s ideological position on preferences for redistribution.
Support for redistribution among the wealthy in Latin America.
3.2. Survey experiment
To test our hypotheses, we conducted online survey experiments with wealthy Colombians in April 2022, right before the presidential election. Colombia is a presidential republic, where the President and Congress are elected in the same year, but elections are independent of each other, with legislative elections happening before the presidential ones. By the time we conducted the survey, Congress had been already elected, with no party reaching an absolute majority in either house. However, the left-wing obtained the highest proportion of seats in recent history (17% in the Senate and 18% in the House of Representatives).Footnote 7
Colombia offers several advantages for the purpose of our study. First, inequality has been increasing since 2016 (Solt, Reference Solt2020), placing the country among the most unequal in Latin America—the most unequal region in the world. Indeed, redistributive issues became a salient topic among Colombians after the wave of social protests during the summer of 2021, which put inequality at the center of the national agenda.Footnote 8 Second, presidential elections heightened the existing Left-Right cleavage in Colombian politics. By the time we started fielding the surveys (April 11, five weeks before Election Day), Gustavo Petro and Federico Gutiérrez, the left- and right-wing candidates, respectively, had the highest vote intention, which made the Left-Right cleavage particularly salient.Footnote 9 In addition, running the study during a presidential campaign increased the validity of our experiment, as the issues we asked about were at that moment very much present in the public debate and likely in the minds of respondents, making the scenario we constructed in our vignettes particularly realistic. Third, the Colombian government has a stratification system that allows straightforward identification of wealthy individuals. The population is divided into six socioeconomic strata (SEL) based on household features and real estate value: 1 is the lowest and 6 is the highest. Affluent people live in SEL 5 and 6 and correspond to 2% of the Colombian population. SEL determine service prices and access to utility subsidies; people living in SEL 1 pay lower utilities than those in SEL 6. While households with low SEL have poor infrastructure and high levels of poverty, households with high SEL are usually in gated communities and enjoy private services. Fourth, Colombia is a country where partisan identification is currently extremely low, much lower than in other contexts where partisan effects have been tested.Footnote 10 This particular feature of the Colombian case allows us to test for partisan effects in the least likely scenario.
Affluent people are, by definition, a small population. They are also hard to reach in face-to-face surveys because many live in gated condominiums. To overcome these difficulties, we used NetQuest opt-in online panel to survey wealthy Colombians. NetQuest recruits panelists through online ads posted on websites like Facebook. Panelists participation in surveys is paid and no panelist can take more than three surveys per month. To recruit wealthy respondents, we leaned on the stratification system explained above and sampled respondents who reported living in SEL 5 or 6. Although the survey firm had respondents’ SEL beforehand, we included a screening question to control the authenticity of the sample. Of note is that there was no incentive to report living in SEL 5 or 6. In order to have enough statistical power, we did not employ quotas but invited all panelists in SEL 5 or 6 to take the survey. Given the short length of the survey (an average completion time of six minutes), we only employed one attention check. We collected 799 quality responses between April 11 and 22. Our survey seems to have successfully captured affluent respondents. Descriptive statistics indicate that 56.5% respondents have at least a university degree, 75% respondents are business owners, formal salaried employees, or self-employed, and the modal respondent is 55 years old or older (see Figure S1 in the online SI).
We employ data from a recent nationally representative survey to check how our sample compares to the population in SEL 5 or 6. Specifically, we use data from the 2021 Political Culture Survey (ECP) by the National Administrative Department of Statistics (DANE, 2021). Figure S3 shows that our respondents are similar to the broad upper-class population in terms of gender (p > 0.55), modal age (p > 0.64), and marital status (p > 0.07). However, our sample is more educated (p < 0.01) and less catholic (p < 0.01). Importantly, the ECP measures self-reported ideology using a 10-point scale, where 1 represents left-wing and 10 represents right-wing. We recode the ECP ideology variable to compare it with the 5-point scale ideology variable used in our survey. Specifically, for the ECP variable, we collapse pairs of subsequent values into a single value (e.g., values 1 and 2 are coded as 1). In the ECP, as in our sample, we classify respondents with ideological scores of 4 or 5 as right-wing.Footnote 11 As Figure S3 illustrates, our sample is more right-leaning (p < 0.01).
The literature shows that education correlates negatively with support for redistribution; people invest in education with prospects of upward mobility, thus becoming averse to redistribution (Alesina and Giuliano, Reference Alesina and Giuliano2011). Scheve et al. Reference Scheve and Stasavage(2006) argue that religion works as a substitute mechanism of insurance, and as a result, religiosity is negatively correlated with support for redistribution. However, the authors find no significant association between Catholicism and redistributive preferences. Also, it is well known that political ideology is associated with redistributive preferences, with right-leaning people having less progressive ones (Ballard-Rosa et al., Reference Ballard-Rosa, Martin and Scheve2017). Provided the evidence about the effect of these three variables on support for redistribution, our sample might tend to prefer more redistribution than the general population. However, we show that our results are virtually the same with covariate adjustment. Therefore, we believe our sample is a good approximation of the affluent class in Colombia, and we lack reasons to think our respondents are unique in ways that undermine our ability to draw conclusions about preferences in wealthy individuals.
3.3. Experimental design
In the survey experiment, we asked respondents about their level of support for two different redistributive policies, randomly assigning the candidate proposing each one. Then, we tested three possible reasons behind respondents’ preferences. We used vignettes where we clearly indicated who stood to lose or gain from the proposed policies. The information we used in the vignettes was realistic, as we confirmed in a pilot survey where we checked how credible the policy proposals were. We also provided essential information about policy content to correct for potential misperceptions or lack of knowledge among respondents. The policies we asked about, such as fiscal reform, were salient in the existing context.
The first policy proposed to increase taxes on the rich and thus focused on the “taking from the rich” side of redistribution. The second policy proposed to subsidize the utility spending of low-income strata and thus focused on the “giving to the poor” side of redistribution. We randomized the candidate proposing each policy and measured respondents’ level of support on a scale from 1 to 5, where 1 indicated strong disagreement and 5 indicated strong agreement. The control group read the policy as advanced by the left-wing candidate (T0 = Gustavo Petro), and the treatment group read the same policy but advanced by the right-wing candidate (T1 = Federico Gutiérrez). The wording of the vignettes implied temporality: the implementation of a policy occurs after the election of the candidate. With this wording, we aimed to alleviate concerns about reverse causality (e.g., respondents support an existing policy, and therefore they prefer a candidate). Since both candidates were widely known and clearly linked to specific ideologies, the expectation was that their names would make a strong treatment. Our outcome variables are Progressive Taxation and Subsidies.Footnote 12 The value 1 of these variables indicates that respondents either “somewhat agree” or “totally agree” with the policy, and 0 indicates otherwise.
Progressive Taxation: In Colombia, income tax is progressive: people with higher incomes pay more taxes. For example, a person earning 2.5 million per month pays an income tax of 10%, while a person earning 15 million per month pays an income tax of 24.5%. To what extent do you agree or disagree with the income tax for this second group going from 24.5 to 29.5 under a [T0/T1] government, i.e., that those earning 15 million would go from paying 3.7 to 4.4 million in taxes?
Subsidies: To what extent do you agree or disagree with implementing a tax for people living in strata 5 and 6 to subsidize 10% of the utility spending of people living in strata 1 and 2 under a government of [T0/T1]?
To explore the reasons behind the level of support for redistribution we measured respondents’ expectations around specific redistributive policies. To test for our ‘uncertainty’ hypothesis (H3), we asked respondents about their level of uncertainty regarding the upper bound of a progressive wealth tax. The tax rate proposed by the candidate was 13%, three PP higher than the existing wealth tax at the time of the survey. Respondents used a slider to indicate whether they expected the actual tax rate after the reform to be lower or higher than 13%. The range of the tax rate in the slider we utilized to measure uncertainty went from 3% to 23%, so 10 PP lower and higher than the proposed new tax rate. Again, we randomly varied the candidate proposing the tax adjustment. In the analysis, our outcome variable Uncertainty is rescaled and takes on values from −10 to +10.
Uncertainty: Several candidates have considered implementing taxes to solve the State’s fiscal deficit. One of the proposals is to increase the tax on income received by corporate shareholders. Currently, this tax is 10%. Imagine that [T0/T1] proposes to increase this tax to 13%, if [T0/T1] is elected president, do you expect him to implement exactly the tax he proposes, or do you expect the tax implemented to be lower or higher than the one proposed?
To test H4 and H5, we asked respondents two separate questions about the expected efficiency in delivering social policies and the impact of such policies on macroeconomic stability. Specifically, we asked respondents how likely it was that the money to help the poor would actually be spent on the poor under the (Left or Right) candidate and how likely it was that the social policies of the (Left or Right) government would put Colombia’s economic stability at risk. In both questions, response options ranged from “not at all likely” (1) to “very likely” (3). The outcome variables Efficiency and Instability are dichotomized measures, where 1 indicates that respondents consider the outcome to be very likely, and 0 indicates otherwise.
Efficiency: How likely do you think it is that the money to help the poor will actually be spent on the poor under [T0/T1]’s government?
Instability: How likely do you think it is that the social policies of [T0/T1]’s government will put Colombia’s economic stability at risk?
Before collecting the experimental evidence, we measured a set of pretreatment variables to control for potential sources of varied preferences: demographics, exposure to crime, guerrilla-threat perception, perception of social resentment, intention to migrate, trust in institutions, ideological self-placement, and vote intention.
To identify our treatment effects, we estimate the following OLS model:
 \begin{equation}
y_{i} \ = \ \alpha \ + \ \beta_{1} D_{i} \ + \ \lambda_{1} X_{i} + \ \epsilon_{i},
\end{equation}
\begin{equation}
y_{i} \ = \ \alpha \ + \ \beta_{1} D_{i} \ + \ \lambda_{1} X_{i} + \ \epsilon_{i},
\end{equation}where yi is the given outcome, Di is the treatment variable (0 for the left-wing candidate, 1 for the right-wing candidate), and Xi is the vector of pre-treatment variables.Footnote 13
4. Results
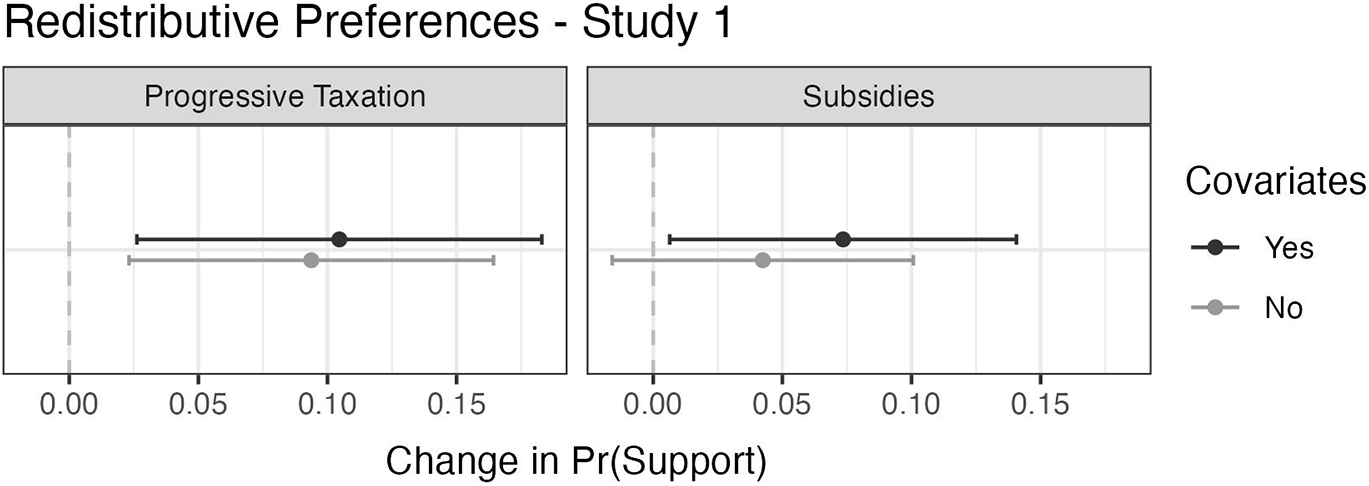
Overall, we find that who is in power affects the redistributive preferences of the wealthy. We begin by reporting results for H1 and H2. Figure 2 shows the difference between the probability of supporting redistributive policies advanced by the right-wing candidate (T1 = Federico Gutiérrez) and the probability of supporting the same policies but advanced by the left-wing candidate (T0 = Gustavo Petro). Consistent with H1, we find wealthy respondents are 9.4 pp significantly more likely to support an increase in a progressive tax rate if proposed by the right-wing candidate (β = 0.489, SE = 0.026) relative to the left-wing candidate (β = 0.395, SE = 0.025). We also find the hypothesized treatment effect with subsidies (H2): respondents are 4.2 pp more likely to support a tax on them to subsidize utility spending in low-income households (T0: β = 0.196, SE = 0.02; T1: β = 0.239, SE = 0.022). However, this result does not reach statistical significance. Importantly, results hold even when we control for respondents’ ideologyFootnote 14 and vote intention. In the SI, we show that results have the hypothesized direction and reach statistical significance also when we use the 5-point scale dependent variables (Figure S4).
Preferences for redistribution in wealthy colombians—study 1.
Why are the rich more likely to support redistribution under the Right? When we analyze the logic behind the different levels of support for redistributive policies, we find two of the three theorized reasons at work. Table 1 shows that expectations of efficiency and instability explain support for redistribution among the affluent under a prospective right-wing government. We also find the hypothesized negative treatment effect on expectations of uncertainty. However, the coefficients are imprecisely estimated (p < 0.1).Footnote 15 Specifically, consistent with H4, we find that respondents are 16.9 pp significantly more likely to expect social policies to be actually spent on the poor under a right-wing government, as the third column in Table 1 reports.Footnote 16 In the fifth column of the same table, we show that the wealthy are 25.9 pp less likely to expect that social policies under a right-wing government will put the stability of the national economy at risk. This result is statistically significant and confirms our theoretical expectation (H5). In the SI, we show that the results have the hypothesized direction and are statistically significant also when we use the dependent variables in their point scale.
Testing theoretical explanations—study 1
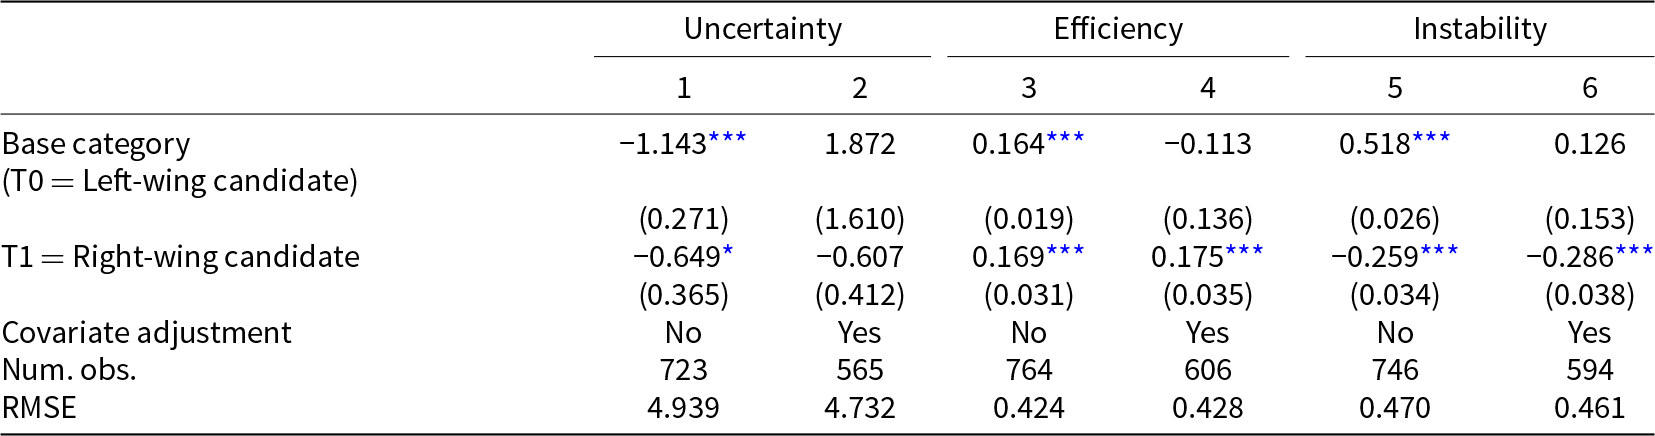
*** Significance levels: p < 0.01; **p < 0.05; *p < 0.1. OLS models with robust standard errors.
4.1. Study 2
In the first round, no candidate reached 51% of votes. As opposed to what opinion polls suggested when we fielded the survey, the right-wing candidate Gutiérrez was not among the two most-voted candidates. Instead, the left-wing candidate Gustavo Petro advanced to the second round along with businessman Rodolfo Hernández, an independent candidate. Although unknown to the political establishment, Hernández, a former mayor of a small city in north-central Colombia, cultivated wide popular support on social media running on an anti-establishment and anti-corruption platform. After Gutiérrez did not make it to the run-off, the Right decided to support Hernández, who promised to manage the state as a private firm and create a parallel cabinet of business elites to advise the president. His pledges placed him to the right of the left-wing candidate in the economic dimension.
We exploit the unexpected electoral outcome to do a follow-up survey. In the questionnaire, we replaced the defeated right-wing candidate’s name with Rodolfo Hernández. Then we fielded the same survey between May 30 and June 7, 2022. We collected 833 responses.Footnote 17 Given Hernández’s conservative position on redistributive policies, our theoretical expectations did not change.
Figure 3 shows that the results in our second study hold. Wealthy respondents are 8.9 pp significantly more likely to support an increase in a progressive tax rate if proposed by the right-wing candidate (T0: β = 0.38, SE = 0.024; T1: β = 0.469, SE = 0.025). Support for subsidies has the expected positive direction but does not reach statistical significance (T0: β = 0.181, SE = 0.019; T1: β = 0.229, SE = 0.021). Yet, the effects are significant and follow the expected direction when we use the dependent variables in their original point scales rather than their binary versions, as shown in the SI (Figure S5).
Preferences for redistribution in wealthy colombians—study 2.
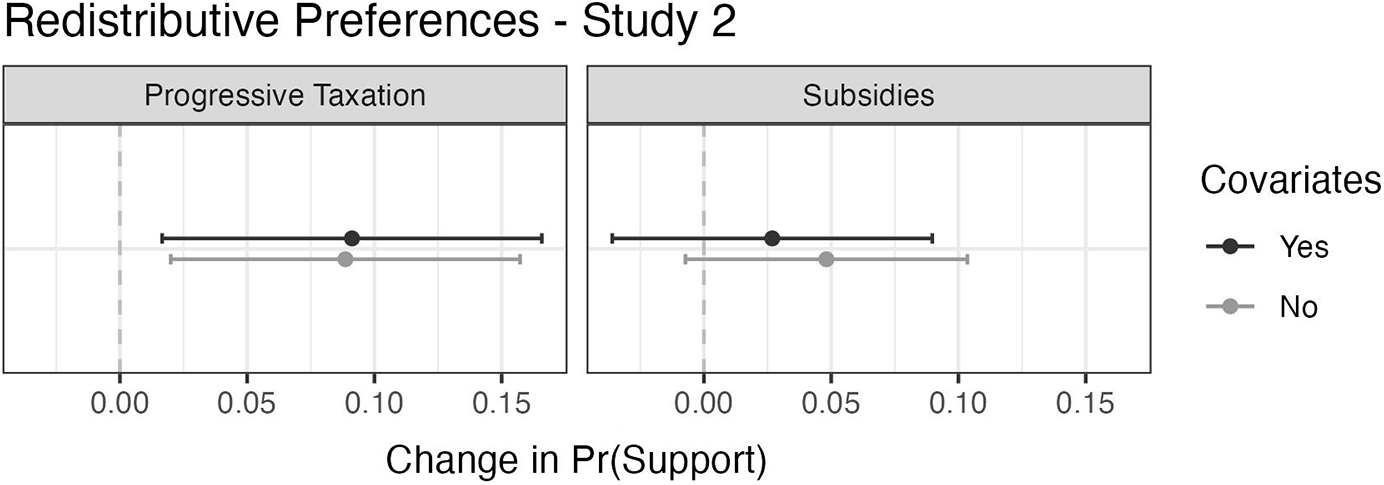
Table 2 indicates that the reasons to support redistribution also move in the same theorized direction: expectations of efficiency increase and expectations of an unstable economy decrease under the right-wing candidate. Although the level of uncertainty is in the expected negative direction, it is not statistically significant.
Testing theoretical explanations—study 2

*** Significance levels: p < 0.01; **p < 0.05; *p < 0.1. OLS models with robust standard errors.
4.2. Heterogeneous treatment effects
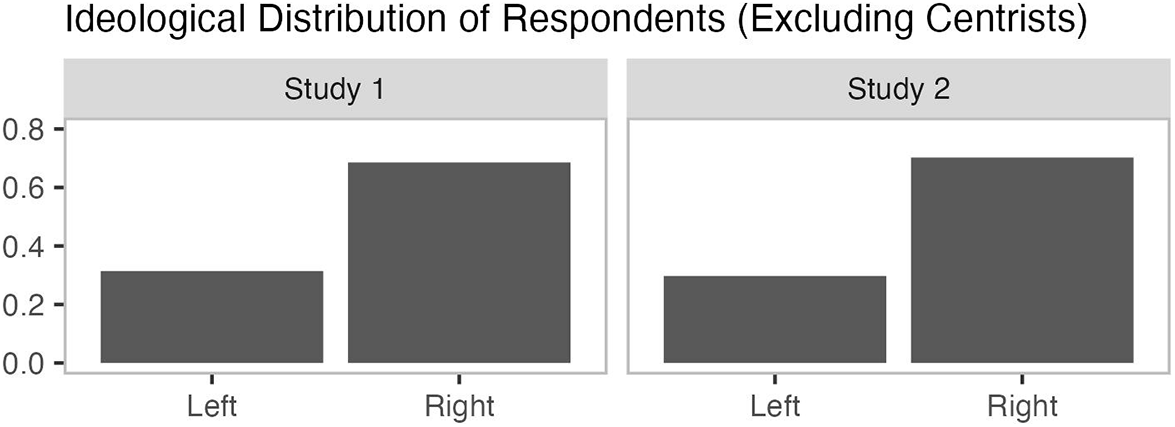
Conventional wisdom assumes that the wealthy are predominantly right-wing. However, in Colombia, we observe a sizeable proportion of left-wing wealthy (see Figure 4). This feature of our sample allows us to test our argument among the left-wing affluent as well. Specifically, we conduct heterogeneous treatment effect analyses to examine how government ideology affects preferences and expectations across left- and right-wing ideological groups.Footnote 18
Ideological distribution of respondents.
To conduct heterogeneous effects analyses, we use respondents’ self-ideological placement and classify respondents as left-wing if they are below the median value of the ideological scale and right-wing if they are above, thus excluding respondents who self-place in the center.Footnote 19 Figure 5 shows that the effect of right-wing government ideology varies across ideological subgroups: it increases support for redistributive policies among the right-wing wealthy and decreases it among the left-wing wealthy.
Heterogeneous treatment effects (preferences).

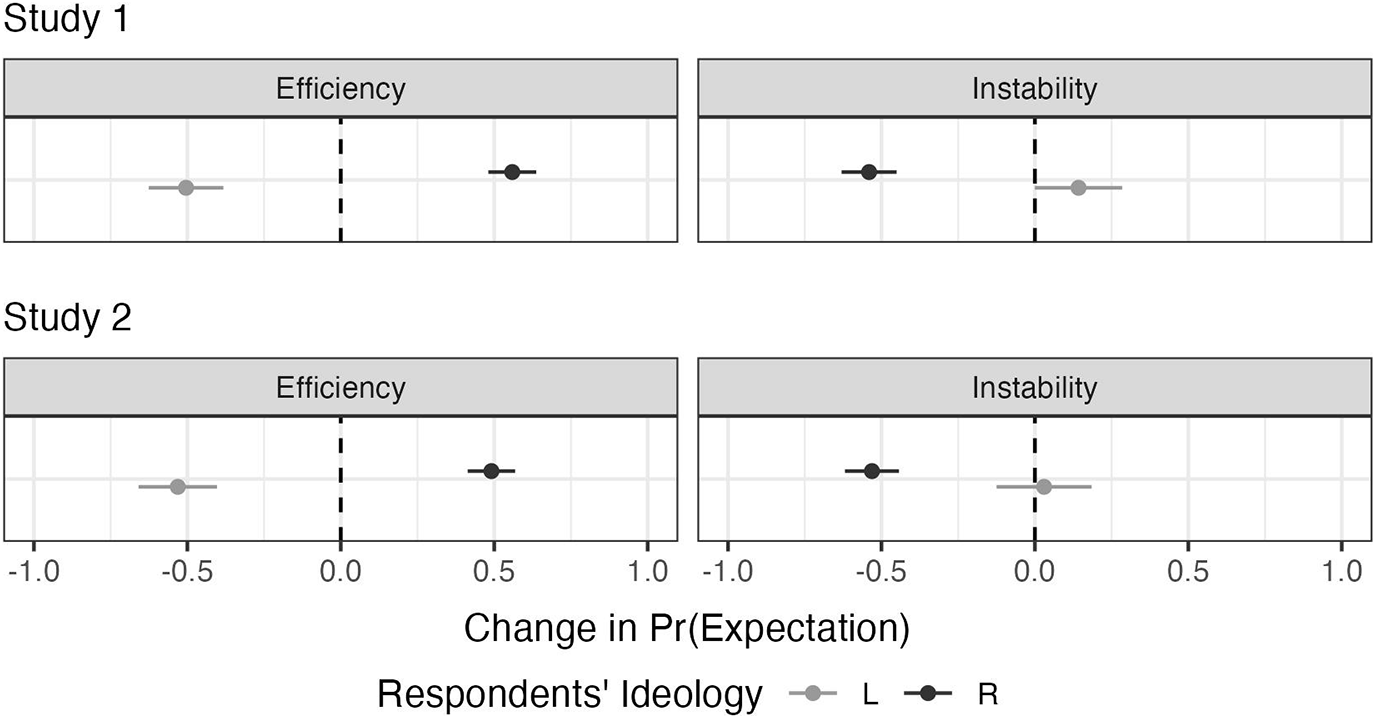
We turn to our theorized mechanisms to further explore these heterogeneous treatment effects. Figure 6 shows that a right-wing government leads to contrasting expectations regarding the efficiency of social policies across ideological subgroups.Footnote 20 However, it does not trigger expectations of macroeconomic instability among the left-wing wealthy (Figure 6). Results are similar when we use vote intention rather than ideological self-placement to classify respondents, as we report in Tables S13 and S14 in the online SI.
Heterogeneous treatment effects (expectations).
4.3. Non-redistributive policies
Does the ideology of the prospective government have an effect on the wealthy’s preferences in other policy areas as well? Results from two pre-registered hypotheses suggest that this theory may even apply to non-redistributive policies. Specifically, we tested whether who is in power (i.e., the Left or Right) affects support for increasing police force in urban areas and implementing a restrictive migration policy. As we explained in the SI (Section S7), we were agnostic about the effect of who is in power on non-redistributive policies and expected null effects. However, we found that the right-wing treatment increases the wealthy’s support for these policies (Figure S13). We also find heterogeneous treatment effects in line with the ones we uncover in the redistributive policies (Figure S14). These results contradict the assumption that the effect of who is in power is limited to redistributive policies and they might indicate that our theorized expectations operate in other domains. Future research can examine the mechanisms behind the wealthy’s support for non-redistributive policies.
5. Alternative explanations
We address three possible alternative explanations for our results. First, the fact that the left-wing candidate is a polarizing figure and could be driving the effect of our treatments. Second, the argument that the truncated nature of welfare states diminishes expectations of redistribution (Holland, Reference Holland2018). Third, the possibility that respondents consider the redistributive proposals cheap talk. A full discussion of the three explanations is in the SI (Section S5.1).
6. Conclusion
Research on wealthy individuals has become more relevant in a period of rising economic inequality and redistributive pressures on governments. We know that the rich have outsized political influence, but we know little about their attitudes toward redistribution, especially in Latin America. In this article, we hypothesized that the rich are more likely to support redistributive policies under the Right rather than the Left. We theorized three reasons that explain such support: uncertainty about the upper bound of the redistributive policy, government efficiency in delivering policies, and concerns about the effect of social policies on macroeconomic instability.
We conducted pre-registered online survey experiments with wealthy individuals during the 2022 presidential election in Colombia. This setting allowed us to leverage the existing Left-Right cleavage in the country. Our findings, supported by a second study conducted in the run-off election, show that the wealthy are more likely to support redistribution under the Right because they expect greater efficiency in delivering policies and less economic instability when a right-wing government enacts redistributive policies. In addition, since our sample had a sizable share of left-wing individuals, we explored whether our theorized mechanisms work for them too. Overall, we find that the left-wing wealthy oppose redistribution under the Right. However, they do not expect more macroeconomic instability as a consequence of right-wing redistribution.
Our findings challenge standard political economy models, which assume that redistributive preferences are a function of objective material conditions. We have provided causal evidence showing that the government’s ideology has an important effect on preferences for redistribution among the wealthy. In particular, we have shown when and why the government’s ideology affects preferences for redistribution among the wealthy and demonstrated that ideologically driven expectations, rather than income position, explain redistributive preferences in the affluent. The fact that left-wing wealthy do not exclude the possibility of macroeconomic instability under the Left yet still support the redistributive policies that they think might cause it constitutes even stronger evidence of the limitations of the material self-interest assumption. As a matter of fact, our results show that the wealthy are willing to pay the cost of redistribution for ideological reasons, even if that entails not only an immediate, direct cost (i.e., the increased tax burden on them) but also a more diffused, generalized one (i.e., macroeconomic instability for everyone).
With respect to partisan-motivated reasoning theory, results from studies 1 and 2 are largely consistent with it. Indeed, results are similar across both studies, even when the right-wing/treatment candidate varied. Despite this change, treated respondents supported redistributive policies and had similar expectations. This consistency provides strong evidence that elite cues trump material interests, even in challenging contexts where the wealthy have vested interests.
Our results have several implications for the political economy literature and current efforts to increase taxation in developing countries. First, the rich seem to have no fixed policy preferences in the realm of redistribution and taxation, as who is implementing the policy is a predictor of their preferences rather than the policy content itself. Second, right-wing governments might have a political advantage when implementing redistributive policies since the wealthy are more open to supporting right-wing redistribution in contexts of increasing inequality.
Cross-country experimental evidence on the effect of government ideology on the wealthy’s redistributive preferences was beyond the scope of our study. We believe that future research could examine whether our findings hold in countries where the wealthy have been more frequently exposed to left-wing governments. Likewise, future scholarship could investigate whether the policy preferences of other social strata (e.g., middle class, popular sectors, etc.) are as susceptible to ideological expectations related to general beliefs about the Left and the Right in government.
Supplementary material
The supplementary material for this article can be found at https://doi.org/10.1017/psrm.2025.10029. To obtain replication material for this article https://doi.org/10.7910/DVN/0TMLTI.
Funding
Funding was provided by the Center for Inter-American Policy and Research (CIPR). This research received Institutional Review Board (IRB) approval from The University of British Columbia (H21-03702).
Acknowledgments
We thank Alisha Holland, José Incio, Alan Jacobs, Matias López, Yang-Yang Zhou, reviewers, and participants of the CIPR seminar, MPSA 2023, REPAL 2023, and APSA 2023 for helpful comments.


 Open access