

INTRODUCTION
The control of infectious diseases is often a compromise between the desire for large-scale implementation of control measures and what is logically or economically feasible. Therefore, it is important that control measures are optimally prioritized in order to minimize the adverse population-level impact of a disease. An integrated-scale mathematical model of infectious disease spread is therefore a necessary tool for determining optimal control strategies, because a vast range of policies can be rapidly tested by simulation. Recently developed control-measure modelling approaches concerning the containment of airborne infections, including engineering controls with respiratory protection and public health interventions, can be derived from an integrated-scale analysis generated from three different types of functional relationship: the Wells–Riley mathematical model, competing-risks model, and Von Foerster equation, both the key epidemiological determinants involved and the functional connections between them, often exhibit properties not apparent in any single model alone.
Fraser et al. [Reference Fraser1] derived a Von Foerster equation-based criteria for outbreak control in which they adopted two key properties of transmission of the basic reproduction number (R 0) and the proportion of asymptomatic infectious that arise prior to the onset of symptoms (θ) to analyse the general properties of directly transmitted agents that determine the likely success of certain public health measures for containing early-stage outbreaks. They indicated that R 0 and θ are both strong predictors for successfully describing the impact of the simple public health control measures against the infectious diseases. Therefore, a valuable added dimension to public health inventions could be provided by systematically quantifying transmissibility and the proportion of asymptomatic infection of infectious diseases. Fraser et al. [Reference Fraser1] and Anderson et al. [Reference Anderson2] have also given some insights that with a combination of certain efficacious control measures, we could decide whether such public health measures would work effectively if applied with a given efficacy to control the spread of specific pathogens with defined biological and epidemiological properties.
Here a competing-risks theory [Reference Brookmeyer, Johnson and Bollinger3–Reference Brookmeyer, Johnson and Barry5] is employed to account for the impact of different enhanced measure efficacies from both engineering controls and respiratory protection on the airborne infection risk. The competing-risks model is a probabilistic model by which the dynamics of interplay among different enhanced engineering control-measure strategies can be described. The basic assumption of the probabilistic calculations on the competing-risks model was based on an underlying Poisson model, i.e. different control efficacies act independently of each other. The selected optimal control measures include environmental controls by ventilation and air filtration, as well as respiratory protection. The inclusion of competing risks in the model recognized the fact that an individual might gain substantial benefits in risk reduction of airborne infection from many different control measures including technological controls at the source (by surgical masking and treatment booths), environmental controls (by ventilation, air filtration and ultraviolet germicidal irradiation), and receptor controls (by respiratory protection via respirators) [Reference Nardell6–Reference Chow and Yang11].
We employ the Wells–Riley mathematical model of airborne infection [Reference Rudnick and Milton9, Reference Fennelly12] to estimate the exposure concentrations in indoor environments where cases of inhalation of airborne infection occurred based on reported epidemiological data and epidemic curves, and R 0 and its variability in a shared indoor air space.
The aim of this paper is to present an integrated-scale model that can help predict whether simple control measures, including engineering controls and public health interventions or some specific combinations, can succeed in containing epidemic growth of airborne infections if applied efficaciously for an early-stage outbreak. To focus the analysis, simulations are based on the highly disseminated epidemic of airborne infections in Taiwan including SARS in a nosocomial setting, and influenza, chickenpox, and measles in an aircraft cabin setting.
MATERIALS AND METHODS
Epidemic data
Owing to well-recorded epidemiological data from reported cases among influenza, chickenpox, measles, and SARS associated with epidemic curves (numbers of cases by date/week of symptom onset) (Fig. 1a–d), we could estimate the quantum generation rate for respiratory infections in the absence of interventions and control efforts based on infected probability estimated from the Wells–Riley equation. Infectivity data of influenza and chickenpox were adopted from the Center for Disease Control of Taiwan based on a weekly case numbers from January 2003 to December 2005. Infectivity data of measles were adopted from Lee et al. [Reference Lee13] based on weekly case numbers at Li-Tse in an elementary school setting during the 1988–1989 measles epidemic in Taiwan. Epidemiology of SARS reported from Taipei Municipal Ho-Ping Hospital during 29 April–8 May 2003 was adopted in this study.
Quantitative epidemic curves for reported case numbers and the probability density functions of basic reproduction number (R 0) derived from the Wells–Riley equation based on the estimated probability of infection (P) and the adopted input parameters (see Table) for influenza (a, e), measles (b, f), chickenpox (c, g), and SARS (d, h).

We used a real ventilation scenario to simulate the control efforts. We used a Monte Carlo simulation to quantify our uncertainty concerning infection probability and quantum generation rate. We used the Kolmogorov–Smirnov (KS) statistics to optimize the goodness-of-fit distributions. We employed Crystal Ball software (version 2000.2; Decisioneering Inc., Denver, CO, USA) to analyse data and to estimate distribution parameters.
Quantitative respiratory infections
Based on the epidemic curves for cases reported among influenza, measles, chickenpox, and SARS (Fig. 1a–d), the probabilities of infection (P) for influenza, measles, chickenpox, and SARS could be estimated based on statistical criteria, comparisons of distribution parameters, and visual interpretation of histograms and resulted in the log-normal (LN) distribution optimizing the KS statistics. Results give P=LN(0·0063, 1·23), LN(0·0002, 2·66), LN(0·00043, 1·22), and LN(0·0089, 1·92), respectively, for influenza, SARS, chickenpox, and measles.
The probability distribution of quantum generation rates (q, quanta h−1) could be calculated from the Wells–Riley equation [Reference Rudnick and Milton9, Reference Liao, Chang and Liang14] based on the source data (see Table for the detailed symbol definitions) with estimated P distributions: (i) influenza at an elementary school setting: n=50, V=600 m3, t=6 h, p=0·38 m3 h−1, and f=0·00076 (based on Q=20 m3 h−1 m−2 and floor area=200 m2, as given by the Construction and Planning Agency, Ministry of Interior, ROC); (ii) SARS at Taipei Municipal Ho-Ping Hospital: n=20832, V=145602 m3, t=6 h, p=1·375 m3 h−1, and f=0·0247 (based on Q=5 ACH, a standard regulation level of hospital emergency room given by the Construction and Planning Agency, Ministry of Interior, ROC); (iii) chickenpox at a kindergarten setting: n=360, V=1656 m3, t=5 h, p=0·32 m3 h−1, and f=0·00076; and (iv) measles at an elementary school setting: n=50, V=600 m3, t=6 h, p=0·38 m3 h−1, and f=0·00076. After optimizing the KS statistics, LN distribution was the best fit for quantum generation rates, demonstrating that measles has the highest quantum generation rate [LN(108·16 quanta h−1, 1·94)] followed by influenza [LN(76·18, 1·23)], chickenpox [LN(36·44, 1·39)], and SARS [LN(28·94, 2·66)].
Input parameters used in the Wells–Riley mathematical model to estimate the basic reproduction number (R0) in a hospital setting for SARS and an aircraft setting for influenza, measles, and chickenpox
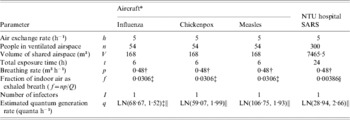
* Adopted from Rudnick & Milton [Reference Rudnick and Milton9].
† Adopted from ICRP [22].
‡ Based on Q=0·3 ACH, a mean value adopted from Rudnick & Milton [Reference Rudnick and Milton9].
§ Based on Q=5 ACH (Construction and Planning Agency, Ministry of Interior, ROC).
‖ Log-normal (LN) distribution with a geometric mean and a geometric standard deviation that is calculated by ![]() at I=1 [Reference Liao, Chang and Liang14].
at I=1 [Reference Liao, Chang and Liang14].
We consider two highly infectious environmental settings (i) nosocomial: National Taiwan University (NTU) Hospital for SARS and (ii) aircraft cabin: Boeing 737, for influenza, chickenpox, and measles (Table), to assess the public health impact of control measures against airborne infections. We used reported epidemic curves (Fig. 1a–d) together with the Wells–Riley equation-based R 0 model [Reference Rudnick and Milton9, Reference Liao, Chang and Liang14] to quantify the uncertainty of R 0 attributable to the large variance of infected probabilities and estimated quantum generation rates of selected airborne infection (Table). Figure 1(e–h) illustrates the probability density functions of the optimized LN distributions of R 0, i.e. Monte Carlo simulation results show LN(11·70, 1·20), LN(15·14, 1·71), LN(5·97, 1·76), and LN(2·65, 2·55) for influenza, measles, chickenpox, and SARS, respectively, indicating that measles has the highest R 0 value (geometric mean=15·14) followed by influenza (11·70), chickenpox (5·97), and SARS (2·65).
Integrated-scale analysis
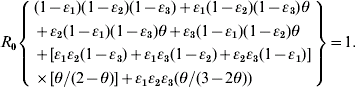
We adopted the Von Foerster equation-based control model [Reference Fraser1] to analyse the impact of the combination of public health interventions such as isolation, contact tracing, vaccination, and hand washing. Fraser et al. [Reference Fraser1] demonstrated how the two key parameters R 0 and θ can be used to predict whether control policies involving isolation and contact tracing will lead to outbreak containment. Accordingly, following the parameter estimates for R 0 and θ, we can construct the R 0–θ critical-control line from the control-measure efficacy and R 0 estimates determined from the Wells–Riley equation. Based on the R 0–θ critical-control line, for each scenario, if a given infectious agent is below the R 0–θ curve, the outbreak is always controlled eventually, whereas above the curve, additional control measures would be required to control the spread. Here we derive three control efficacies (ε1, ε2, and ε3) of public health intervention-based R 0–θ critical-control line from the methodology that originally appeared in Fraser et al. [Reference Fraser1]. The resulting equation is given as (see Appendix 1 for details):
Parameter estimates for θ are determined by the specific biological characteristics of the aetiological agents, defined as θ=(incubation period−latent period)/infectious period. We can calculate the distribution of θ using the Monte Carlo simulation to quantify the uncertainty concerning θ attributable to a large variance of incubation period, latent period, and infectious period for a specific airborne infection. Owing to the previous excellent research work, we could obtain the ranged values of incubation, latent, and infectious periods, respectively, as 1–4, 1–3, and 4–8 days for influenza, 8–13, 6–9, and 6–7 days for measles, 13–17, 8–12, and 10–11 days for chickenpox [Reference Anderson and May15], and 2–12, 12–14, and 12–14 days for SARS [Reference Anderson2].
We adopted the concept of a competing-risks model [Reference Brookmeyer, Johnson and Bollinger3–Reference Brookmeyer, Johnson and Barry5] to account for prioritizing the impact of different enhanced engineering control measures against respiratory infections. We link the competing-risks model and Wells–Riley equation to estimate the reduction of potential infectious force of R 0. Based on the competing-risks model, we derive an optimal R 0 by incorporating the effectiveness of engineering control measures such as ultraviolet germicidal irradiation (UVGI) [Reference Menzies16], recirculated high-efficiency particulate air (HEPA) filter, air exchange rate, and respiratory protection into a Wells–Riley-based R 0 model [Reference Rudnick and Milton9, Reference Liao, Chang and Liang14]. The optimal R 0 could be calculated by (see Appendix 2 for details):
![\openup2\eqalign{ R_{\setnum{0}} \equals \tab \lpar n \minus 1\rpar \bigg\{ {1 \minus \exp \left[ { \minus \left( {{{Iqtp\lpar 1 \minus \eta _{\rm s} \rpar } \over {Q \plus Q_{\rm r} \eta _{\rm r} \plus h_{\rm u} V}}} \right)} \right.} \cr \tab \times \left. {\left. {\lpar 1 \minus \exp \lpar \minus \lpar h \plus h_{\rm r} \eta _{\rm r} \plus h_{\rm u} \rpar \rpar t\rpar } \bigg]} \bigg\}\comma \cr} \hfill](https://static.cambridge.org/binary/version/id/urn:cambridge.org:id:binary:20151007135532075-0475:S0950268807008631_eqn2.gif?pub-status=live)
Where Q r is the air-flow rate through a recirculated HEPA filter (m3 h−1), ηs is the efficiency of a respiratory protection device used by a susceptible person (dimensionless), ηr is the single-pass removal efficiency for infectious droplet nuclei passing through the recirculated HEPA filter (dimensionless), h is the air exchange rate (h−1), h r is the air exchange rate through a recirculated HEPA filter (h−1), and h u is the inactivation rate of infectious droplet nuclei due to UVGI (h−1).
RESULTS
R 0−θ control model
We incorporate probability distribution into Monte Carlo simulation to obtain 5th–95th percentiles as 90% confidence intervals (CI) for R 0−θ distributions. The resulting 90% CIs of θ and R 0 indicate that SARS has the relatively smallest range of θ and R 0 (0·0001<θ<0·11 and 0·57<R 0<12·45) compared to the other three airborne infections: influenza (0·19<θ<0·44, 7·35<R 0<14·93); measles (0·15<θ<0·44, 5·58<R 0<34·52); chickenpox (0·26<θ<0·64, 4·45<R 0<11·79), respectively (solid line rectangles in Figure 2). We considered 100% effective isolation of symptomatic patients (εI=1), 45% effectiveness of hand washing (εW=0·45) [Reference Ryan, Christian and Wohlrabe17], and ranged values of effective vaccination (εV) adopted from published empirical data for influenza (εV=70–90%) [Reference Couch18], chickenpox (εV=73–95%) [Reference Vazquez19], and measles (εV=32–89%) [Reference De Serres20]. For SARS, we considered 100% effective isolation along with ranged values of effective contact tracing (εV=30–80%).
Criteria for outbreak control of the R 0–θ control line that separates epidemic growth (above the line) from outbreak control (below the line) for (a) chickenpox, (b) measles, (c) influenza, and (d) SARS. The dotted and solid-line rectangles (a–d) represent the initial and engineering control measures applied 90% CIs of R 0−θ values, respectively. We further examine combination control efforts of the effectiveness of three public health interventions including isolation, vaccination and hand washing for (a) chickenpox, (b) measles, (c) influenza; and isolation, contact tracing, and hand washing for (d) SARS.

We calculated the percentage of the uncontrollable ratio which varied with the control efficacies, demonstrating 93·5–97·9%, 0–1·2%, 96·7–98·7%, and 96·5–98·9% for influenza, SARS, chickenpox, and measles, respectively. Comparing R 0−θ control lines for influenza, measles, chickenpox, and SARS (solid line rectangles in Fig. 2), it is clear that SARS is the easiest of the four airborne infections to control because of its low R 0 and θ values. Our analysis indicates that effective isolation of symptomatic patients with low-efficacy contact tracing is sufficient to control a SARS outbreak (Fig. 2d). On the other hand, influenza, measles, and chickenpox are predicted to be very difficult to control even with 100% effective isolation along with 89–95% effective vaccination. Therefore, additional control measures have to be incorporated into public health interventions.
Control measure effects
We could reduce the R 0 value from no control scenario by incorporating the engineering control measures such as enhancing the efficiencies of recirculation air filter capacity and air exchange rate as well as the respiratory protection by using personal masks. We employed the present optimal R 0 equation together with the adopted engineering control measures of enhancing air exchange rate (h=15 h−1 for influenza, chickenpox, measles, and for SARS [Reference Mangili and Gendreau21, 22]), HEPA filtration capacity (Q rηr=10·92 m3 h−1) [Reference Lee23], personal masking (ηs=0·58) [Reference Nazaroff, Nicas and Miller8], and UVGI system (average inactivation rate h u=12±1·3 h−1) [Reference Xu24] to estimate the optimal R 0. Our results demonstrate that for airborne infections like influenza, chickenpox, and measles spread in an aircraft setting, engineering controls guarantee the provision of a reliable control strategy to decrease the transmission potential and spread rate of an epidemic in that the efficacies range from 60% to 80%. SARS, on the other hand, is predicted to have 60% efficacy with enhanced ACH and personal masking in a hospital setting.
We further investigated the control efforts of some combinations of engineering control measures with public health interventions in containing the epidemic growth of influenza, chickenpox, and measles. For chickenpox and measles, the 100% effective isolation and two different vaccine efficacies of 73% and 32% with additional engineering control measures, the uncontrollable ratios are dramatically decreased from 97% to 99% with no engineering control implemented to 0–6% and 6–15%, respectively (dotted rectangles in Fig. 2a, b). For influenza, on the other hand, if we apply 100% effective isolation with two different vaccine efficacies of 70% and 90% combined with four engineering control measures of enhanced ACH, HEPA filtration capacity, UVGI system, and personal masking, the resulting predicted uncontrollable ratios range from 0% to 6% and are much lower than that of 94–98% with no engineering control measures involved (dotted rectangles in Fig. 2c).
Taking influenza as an example (Fig. 2c), the estimated uncontrollable ratios range from 28% to 31% compared with 40–51% with no hand washing involved based on the effectiveness of hand washing εW=45%. The result indicates that the percentage reduction in incidence of influenza would be relatively modest. Even if we incorporated additional public health interventions we would still be unable to fully control influenza.
Sensitivity analysis
We conducted a number of sensitivity analyses in terms of uncontrollable ratio of the effectiveness of the interventions combined with different control measures of implementation (Fig. 3). The engineering control measures include HEPA filter, surgical masking, enhanced ACH (15 ACH), and an unevenly distributed UVGI. We found that among different engineering control measures, UVGI singly is the optimal strategy combined with effective isolation and vaccination interventions for containing influenza, measles, and chickenpox. Compliance with wearing a surgical mask with 100% isolation and low-efficacy contact tracing could totally contain a SARS outbreak. A combination of 100% isolation plus all control measures of implementation of HEPA filter, surgical masking, and enhanced air exchange rate greatly enhances the control efforts. We also discovered that public health interventions have no significant effect when R 0>10.
Sensitivity analyses of the effectiveness of the interventions combined with different control measures based on the uncontrollable ratio. The numbers show the uncontrollable ratio of using various engineering control measures (i.e. HEPA filter, surgical mask, enhanced ACH (15 ACH), and UVGI) for (a) influenza (εI=100% for isolation, εV=80% for vaccine, εW=45% for hand washing), (b) measles (εI=100%, εV=73%, εW=45%), and (c) chickenpox (εI=100%, εV=84·3%, εW=45%). Top rows are εI+engineering measures, middle rows are εI+εV+engineering measures, and bottom rows are εI+εV+εw+engineering measures.

DISCUSSION
In this paper we present an integrated-scale analysis framework that describes and quantifies the impact of various airborne infection control-measure efforts in nosocomial and aircraft cabin environment settings. This integrated-scale analysis facilitates three different types of models, the Von Foerster equation-based model, competing-risks model, and Wells–Riley mathematical model, to quantitatively define the relative impact of different control practices and determine optimal criteria for control and eradication for four priority airborne infections of SARS in hospital, and measles, influenza, and chickenpox during commercial air travel. This approach allows rapid mathematical prediction and comparison of the effective control measures by combining engineering control and non-engineering public health intervention policies followed by easy-to-use and easy-to-interpret critical-control lines avoiding cumbersome and intensive computational simulations.
A substantial increase in effectiveness of the combined control strategies depends not only on clinical epidemiological information of pathogen load and symptoms but also on reliable estimates of disease transmission. As an emerging/re-remerging respiratory infection begins to spread in an indoor environment setting, epidemiologists can rapidly identify the mode and disease transmission rate, providing crucial input for containment strategies. We could estimate the optimal R 0 representing disease transmission rate based on a Wells–Riley mathematical model in terms of prioritization of enhanced engineering control measures determined by a competing-risks model associated with θ estimate that determined from historical clinical symptoms information to construct an optimal critical-control criteria. By using this approach, we found that if enhanced engineering controls could reduce R 0 to <0·71 for chickenpox and <1·17 for influenza in an aircraft setting, public health interventions such as isolation, vaccination, and hand hygiene with such a prepared engineering control measure would have a high probability of containing the respiratory infections. Effective isolation of symptomatic patients with low-efficacy contact tracing is sufficient for combating SARS transmission in a nosocomial setting based on a geometric mean R 0 of 2·65.
Infectious diseases will continue to emerge and re-emerge, leading to unpredictable epidemics and difficult challenges to public health. Although new antibiotics that inhibit different bacterial targets and enormous technological resources are urgently needed to develop vaccines and diagnostic tools to ensure effective management of emerging infectious diseases, useful insight can also be gained from the powerful quantitative mathematical models that help optimally determine the intervention strategies. The key benefit of the models such as those presented here is the logical straightforward and relative simplicity of the results. We suggest that even simplified models are useful in assessing alternate strategies to provide scientifically grounded decisions on clinical diagnosis and detection, and containment in populations and the environment.
In conclusion, our results highlight the fact that that recently developed control-measure modelling approaches are readily amenable to an integrated-scale analysis to provide a practical template that describes the impact of respiratory infection-control measures. This integration is of particular importance to manage emerging diseases in situations where empirical data are not yet available to explore a variety of alternative control measures.
Appendix 1
Von Foerster equation-based three-efficacy R 0−θ control model
We deliberately manipulate the mathematical derivations to arrive at the critical-control line that originally appeared in Fraser et al. [Reference Fraser1], expressed by the following algebraic equation
We extend equation (A1) to a three-efficacy-based equation as
We incorporate the definitions of β(τ)=R 0e−τ, S(τ)=e−ντ, θ=1/(ν+1) into equation (A2), resulting in
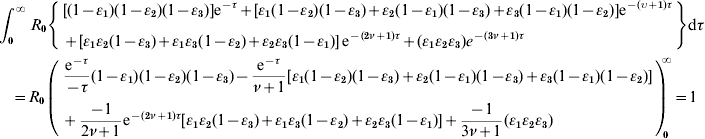
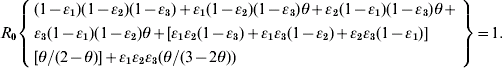
We rearrange the definitions between ν and θ as: ν=(1/θ)−1 and incorporate it into equation (A3) to arrive at equation (1) as
APPENDIX 2
Competing-risks model links the Wells–Riley equation
Based on the competing-risks model [Reference Brookmeyer, Johnson and Bollinger3–Reference Brookmeyer, Johnson and Barry5], the generation probability of infectious agent within t hours will be
where C is the cleared rate combined with air-exchange rate (i.e. C=h+h rηr+h u) of decreasing the risk of infectious agents, λ is the generation rate of increasing the risk of infectious agents: λ=p(1 – ηs)/V, and the infectious agent dose D is: D=Iqt.
Thus, the probability that at least one of D infectious agent generation with a Poisson distribution will be
We simplify equation (A5) for λ≪C,
We incorporate the definitions of C, λ, and D associated with the definitions of Q=V×h and Q r=V×h r into equation (A6) as
Equation (2) therefore could be derived by incorporating equation (A7) into the relationships between the infection probability P=D n/S and R 0=S×P=(n−1)×P as
where D n is the number of cases and S is the number of susceptibles.
DECLARATION OF INTEREST
None.


