


Nomenclature
- 3D
-
three-dimensional
- $a$
,
$b$
,
$c$
,
$f$
,
$v$
$a$
,
$b$
,
$c$
,
$f$
,
$v$
-
waveform fitting parameters
-
$A$
,
$C$
-
root radius fitting parameters
- B-K
-
Benzeggagh-Kenane
-
$C_{ij}^{\textrm{*}}$
-
effective stiffness tensor
-
${C_p}$
-
heat capacity
- CFD
-
computational fluid dynamics
- CFRP
-
carbon fibre-reinforced polymer
- CPU
-
central processing unit
-
$d$
-
interlaminar damage variable
-
${d_i}$
-
intralaminar damage variables
-
${E_0}$
-
initial channel energy density
-
${E_i}$
-
Young’s moduli
-
${{\bf{E}}_j}$
-
macroscopic strains
- ECF
-
expanded copper foil
- EOS
-
equation of state
-
$f\left( \eta \right)$
-
dimensionless supersonic shock wave pressure function
-
${f_{fxc}}$
-
longitudinal compressive strength ratio scaling parameter
-
${f_{{\mathcal G}1 + }}$
-
fraction of the fracture toughness dissipated due to fibre pull-out
-
${f_{XC}}$
-
crushing longitudinal compressive strength ratio
-
${f_{XT}}$
-
pull-out longitudinal tensile strength ratio
-
${{\mathcal G}_{1 + }}$
-
longitudinal tensile fracture toughness
-
${{\mathcal G}_{1 - }}$
-
longitudinal compressive fracture toughness
-
${{\mathcal G}_{2 + }}$
-
transverse tensile fracture toughness
-
${{\mathcal G}_6}$
-
in-plane shear fracture toughness
-
${{\mathcal G}_{Ic}}$
-
mode I interlaminar fracture toughness
-
${{\mathcal G}_{IIc}}$
-
mode II interlaminar fracture toughness
-
${G_{ij}}$
-
shear moduli
-
$I\left( t \right)$
-
transient lightning current
-
${I_{{\textrm{max}}}}$
-
peak current
-
$k$
-
spatial distribution parameter of the transient plasma pressure
-
$K$
-
cohesive surface stiffness
-
${K_P}$
-
shear modulus degradation factor
- LSP
-
lightning strike protection
-
$p\left( {\eta ,t} \right)$
-
transient supersonic shock wave pressure
-
${p_{\textrm{e}}}\left( {r,t} \right)$
-
spatial distribution of the transient plasma pressure
-
${p_{\textrm{e}}}\left( t \right)$
-
transient effective plasma pressure
-
${p_{\textrm{m}}}\left( {r,t} \right)$
-
effective magnetic surface pressure
-
$r$
-
radial coordinate from the lightning attachment point
-
$R$
-
specific gas constant
-
$R\left( t \right)$
-
transient shock wave radius
-
${R_R}\left( t \right)$
-
transient arc root radius
-
${R_{{R_0}}}$
-
initial arc root radius
- RVE
-
representative volume element
-
${S_L}$
-
in-plane shear strength
-
${S_{LP}}$
-
in-plane shear yield stress
-
$t$
-
time variable
-
${t_{{\textrm{max}}}}$
-
time at the peak current
-
${t_s}$
-
root radius fitting parameter
- UD
-
unidirectional
- VISAR
-
velocity interferometer system for any reflector
-
$x$
,
$y$
, X, Y, Z
-
coordinate axes
-
${x_0}$
,
${y_0}$
-
lightning attachment (offset) coordinates
-
${X_C}$
-
longitudinal compressive strength
-
${X_T}$
-
longitudinal tensile strength
-
${Y_C}$
-
transverse compressive strength
-
${Y_T}$
-
transverse tensile strength


Greek symbol
-
$\alpha $
,
$\beta $
-
root radius fitting parameters
-
${\alpha _0}$
-
fracture angle under uniaxial transverse compression
-
$\beta $
-
supersonic shock wave pressure parameter for
$t \lt 0.5 \mu {\textrm{s}}$
-
$\gamma $
-
heat capacity ratio
-
$\eta $
-
dimensionless radius
-
${\eta _{{\textrm{B}} - {\textrm{K}}}}$
-
interlaminar fracture toughness mixed-mode parameter
-
${\eta _G}$
-
in-plane shear fracture toughness scaling parameter
-
${\mu _0}$
-
permeability of the free space
-
${\mu _r}$
-
relative permeability
-
${\nu _{ij}}$
-
Poisson’s ratios
-
${\rho _0}$
-
initial mass (air) density
-
${{\bf{\Sigma }}_i}$
-
macroscopic stresses
-
${\tau _1}$
,
${\tau _2}$
-
interlaminar shear strengths
-
${\tau _3}$
-
interlaminar normal strength


1.0 Introduction
Due to its complex phenomenology, research in the field of lightning strikes may involve multiple disciplines [1–Reference Millmore and Nikiforakis3], including electrical, thermal, mechanical, shock waves and plasma physics. In particular, to assess the damage to metallic and composite materials used in airframe structures it is fundamental to understand and to model the intense pressure pulses in the vicinity of the lightning discharge [Reference Karch, Schreiner, Honke and Wolfrum4].
The continuous current components (e.g., C in Fig. 1) are responsible for the main thermal effects, while the transient lightning strike current components (A and D in Fig. 1) induce the most severe mechanical damage at and around the lightning attachment area. Therefore, when assessing mechanical damage induced by the transient current components (A and D), in a first approximation, thermal and thermal-mechanical effects can be neglected, provided that reliable models for the mechanical lightning loads exist to accurately predict non-thermal effects on protected carbon fibre-reinforced polymer (CFRP) structures.
The mechanical loads induced by lightning strikes in protected CFRP structures have three main origins: (i) overpressure due to the near-surface explosion of the lightning protection layer, (ii) shock waves caused by the supersonic expansion of the hot plasma channel, and (iii) magnetic forces induced by the current flow in the electrically conducting structures. In painted composite structures with lightning protection, the near-surface explosion is the highest contribution to the mechanical loads of a lightning strike [Reference Karch, Arteiro and Camanho5]. However, the contributions of the supersonic expansion of the hot plasma channel and of the magnetic pressures cannot be neglected [Reference Karch, Arteiro and Camanho5–Reference Karch and Wulbrand7] — see the generated mechanical impulses in Section 2.0.
Previous studies in literature [Reference Lee, Lacy and Pittman8–Reference Yao, Junjie, Shulin, Xueling and Fei13] focused on the response of unprotected CFRPs, including the contributions of the magnetic forces and/or plasma expansion shock waves. Alternatively, Li et al. [Reference Li, Sun, Guo, Li, Wang, Zhu, Li and Yao14] employed mechanical pressure distributions obtained from direct measurements [Reference Li, Sun, Li, Tian, Yao, Wang and Chen15, Reference Li, Sun, Li, Tian, Yao, Wang, Zhu and Chen16] assuming a fixed impact effective area for the pressure distribution. In another alternative approach, Lee et al. [Reference Lee, Lacy, Pittman and Reddy9, Reference Lee, Lacy and Pittman17] considered equivalent air blast overpressure.
The temporal and spatial propagation of the shock waves and magnetic pressures required for the simulation of lightning-induced mechanical damage to composite structures can be derived from semi-analytical or numerical computational fluid dynamics (CFD). In previous mechanical simulations of the direct effects of lightning strikes [Reference Karch, Arteiro and Camanho5], the shock waves generated by the rapid temperature rise of the lightning plasma channel has been accounted for using an analytical approach based on a strong shock wave approximation. To assess whether the strong shock wave approximation provides a sufficiently accurate representation of the pressure distribution induced by the supersonic plasma expansion, this work revisits the physically based models proposed by Karch et al. [Reference Karch, Arteiro and Camanho5] for the mechanical loads induced by lightning strike. In particular, it compares the mechanical deformation and damage caused when the shock waves of the plasma expansion are computed from the strong shock wave approximation and from numerical data obtained from CFD.
Illustration of the waveform for return current. This work concerns the current waveform D that corresponds to the restrike current [Reference Karch, Pedro and Arteiro18], according to the SAE Aerospace Recommended Practice for aircraft lightning environment and related test waveforms [1]. It should be noted that the duration of the continuing current (C) can be more than 1,000 times longer than the duration of the transient return stroke components (A or D) but its amplitude can be more than 1,000 times smaller than the peak value of the transient current components.

On the other hand, most of the works in literature dealing with modelling of damage induced by lightning strikes on CFRP, either based on thermal(-electrical) [Reference Alexandros and Konstantinos19–Reference Zhang, Zhang, Cheng and Huang37] or (thermal-)mechanical [Reference Lee, Lacy and Pittman8, Reference Lee, Lacy, Pittman and Reddy9, Reference Millen, Murphy, Catalanotti and Abdelal11–Reference Yao, Junjie, Shulin, Xueling and Fei13, Reference Lee, Lacy and Pittman17, Reference Dong, Wan, Ping, Guo, Yi and Jia38–Reference Millen and Murphy41] models, have been validated solely in terms of the size and/or shape of the lightning-induced damage detected visually from the surface of the coupons or obtained by non-destructive inspection techniques (e.g., C-scan); very few models validated the implementation of mechanical lightning loads and damage by corroboration with experimental velocity and deflection fields [Reference Karch, Arteiro and Camanho5, Reference Bigand, Espinosa and Bauchire42, Reference Fu and Ye43]. For instance, Bigand et al. [Reference Bigand, Espinosa and Bauchire42] combined an empirical explosion overpressure model with a strong shock wave approximation of the supersonic plasma expansion, and compared predictions of the deflections generated by these equivalent mechanical pressure models with the displacement fields obtained from digital image correlation on protected composite laminates subjected to simulated lightning strike. Earlier, Fu and Ye [Reference Fu and Ye43] proposed a surface plasma expansion model based on a laser-shock peening process to account for the confining effect of the dielectric coating/primer on the surface of the CFRP laminate. The finite element model consisted of stacked shells with intralaminar damage and cohesive interactions to model delamination. The predictions were compared with some of the deflection measurements performed by Lepetit et al. [Reference Lepetit, Escure, Guinard, Revel, Peres and Duval44], leading to reasonably good predictions for the initial stages of deformation. In parallel, Karch et al. [Reference Karch, Arteiro and Camanho5] employed physically based models for the overpressure generated by the explosion of the lightning strike protection (LSP) layer, supersonic plasma expansion and magnetic forces on shell finite element models. The physically based models of the mechanical loads proposed by Karch et al. [Reference Karch, Arteiro and Camanho5] enable continuous time representations of the mechanical overpressure induced on protected CFRP panels based on the thermal and electrical properties of the LSP layer and the paint thickness. But, despite the demonstration of the importance of accounting for mechanical intralaminar damage to properly capture the velocity and displacement fields measured experimentally, due to the inherent assumptions of structural shell elements, through-thickness effects, including prediction of delamination, were neglected by Karch et al. [Reference Karch, Arteiro and Camanho5].
In this work, the mechanical lightning loads are implemented in a three-dimensional (3D) modelling framework, including volumetric elements, a 3D constitutive model for intralaminar damage of fibre-reinforced polymer composites and a cohesive zone model for delamination. The mechanical response of a composite laminate subjected to a lightning strike is affected by many parameters, including the constituent materials and stacking sequence, the thickness and boundary conditions of the laminate, the high current waveform, the presence of lightning protection and paint on the surface of the laminate, among other. To validate the proposed models, the experiments from Lepetit et al. [Reference Lepetit, Escure, Guinard, Revel, Peres and Duval44] are reproduced. They consist of CFRP samples made from eight unidirectional (UD) T700/M21 plies with a quasi-isotropic lay-up. Two LSP layers, consisting of expanded copper foils (ECFs) with diamond mesh shape, are considered: (i) an ECF with a surface weight of 73.3 g/m2, 2Cu4-100FA (ECF 73), and (ii) an ECF with a surface weight of 195.3 g/m2, 3Cu7-100FA (ECF 195). Due to the different surface weights of the ECFs, and, consequently, different equivalent electrical conductivities of the two LSP layers, ECF 73 and ECF 195 are both considered because they lead to different contributions of the near-surface explosion and magnetic forces when compared with the contribution of the supersonic expansion of the hot plasma channel (which is independent of the LSP layer used, see Section 2.2). This different combination of mechanical lightning loads supports the validation and robustness of the proposed models. In both cases, the samples were painted with polyurethane paint and surfacing film, with a thickness of approximately 300 $\mu $
m.
$\mu $
m.
2.0 Mechanical lightning loads
According to the SAE Aerospace Recommended Practice for aircraft lightning environment and related test waveforms [1], the standard equation to describe the lightning transient current waveform D (Fig. 1) is:
 \begin{align}I\left( t \right) = c\left( {{e^{ - at}} - {e^{ - bt}}} \right) \end{align}
where $a$
,
$a$
, $b$
and
$b$
and $c$
are fitting parameters. However, Karch et al. [Reference Karch, Arteiro and Camanho5] showed that this equation cannot describe accurately the measured current waveforms tested by Lepetit et al. [Reference Lepetit, Escure, Guinard, Revel, Peres and Duval44]. Hence, a modified double exponential was employed [Reference Karch, Arteiro and Camanho5] to accurately fit the measured current waveforms tested by Lepetit et al. [Reference Lepetit, Escure, Guinard, Revel, Peres and Duval44]:
$c$
are fitting parameters. However, Karch et al. [Reference Karch, Arteiro and Camanho5] showed that this equation cannot describe accurately the measured current waveforms tested by Lepetit et al. [Reference Lepetit, Escure, Guinard, Revel, Peres and Duval44]. Hence, a modified double exponential was employed [Reference Karch, Arteiro and Camanho5] to accurately fit the measured current waveforms tested by Lepetit et al. [Reference Lepetit, Escure, Guinard, Revel, Peres and Duval44]:
 \begin{align}I\left( t \right) = \left\{ {\begin{array}{*{20}{l}}{c\left( {{e^{ - at}} - {e^{ - bt}}} \right)} {}, {}{t \lt {t_{{\textrm{max}}}}} \\[6pt]{c\left( {{e^{ - af\left( {t - v} \right)}} - {e^{ - bf\left( {t - v} \right)}}} \right)} {}, {}{t \ge {t_{{\textrm{max}}}}}\end{array}} \right.\end{align}
where $a$
,
$a$
, $b$
,
$b$
, $c$
,
$c$
, $f$
and
$f$
and $v$
are fitting parameters and
$v$
are fitting parameters and ${t_{{\textrm{max}}}}$
is the time at the current peak. Figure 2 shows a comparison between the two fitting equations. The parameters for the current waveform D with a time to peak of 26.8
${t_{{\textrm{max}}}}$
is the time at the current peak. Figure 2 shows a comparison between the two fitting equations. The parameters for the current waveform D with a time to peak of 26.8 $\mu $
s, a decay time of 48.5
$\mu $
s, a decay time of 48.5 $\mu $
s and a peak current of 96.4 kA [Reference Lepetit, Escure, Guinard, Revel, Peres and Duval44] are summarised in Table 1.
$\mu $
s and a peak current of 96.4 kA [Reference Lepetit, Escure, Guinard, Revel, Peres and Duval44] are summarised in Table 1.
Double exponential waveform fittings for a time to peak of 26.8 ${{\mu }}$
s, a decay time of 48.5
${{\mu }}$
s, a decay time of 48.5 ${{\mu }}$
s and a peak current of 96.4 kA using the fitting equation proposed by Karch et al. [Reference Karch, Arteiro and Camanho5] in Equation (2) (Waveform fit) and the SAE [1] recommended fit in Equation (1) (Waveform SAE).
${{\mu }}$
s and a peak current of 96.4 kA using the fitting equation proposed by Karch et al. [Reference Karch, Arteiro and Camanho5] in Equation (2) (Waveform fit) and the SAE [1] recommended fit in Equation (1) (Waveform SAE).

Waveform parameters for the 26.8/48.5 ${{\mu }}$
s, 96.4 kA modified double exponential function
${{\mu }}$
s, 96.4 kA modified double exponential function

The root radius expansion ${R_R}\left( t \right)$
of the plasma channel is calculated using the finite volume degradation approach [Reference Karch, Arteiro and Camanho5]. The root radius data computed by Karch et al. [Reference Karch, Arteiro and Camanho5] for the ECFs 2Cu4-100FA (ECF 73) and 3Cu7-100FA (ECF 195) are fitted using a double exponential function:
${R_R}\left( t \right)$
of the plasma channel is calculated using the finite volume degradation approach [Reference Karch, Arteiro and Camanho5]. The root radius data computed by Karch et al. [Reference Karch, Arteiro and Camanho5] for the ECFs 2Cu4-100FA (ECF 73) and 3Cu7-100FA (ECF 195) are fitted using a double exponential function:
 \begin{align}{R_R}\left( t \right) = \left\{ {\begin{array}{*{20}{l}}{{R_{{R_0}}} + A\left( {{e^{\alpha t}} - {e^{\beta t}}} \right),} {}{{\textrm{ }}t \le {t_s}} \\[5pt]{C,} {}{ \quad \quad \quad \quad \quad \quad \quad { \, t \gt {t_s}}}\end{array}} \right.\end{align}
with ${R_{{R_0}}} = $
0.5 mm ensuring an initial arc root radius of 0.5 mm independently of the parameters
${R_{{R_0}}} = $
0.5 mm ensuring an initial arc root radius of 0.5 mm independently of the parameters $A$
,
$A$
, $C$
,
$C$
, $\alpha $
and
$\alpha $
and $\beta $
obtained during curve fitting. The fitting parameters are shown in Table 2. The fitted root radii as a function of time are plotted in Fig. 3.
$\beta $
obtained during curve fitting. The fitting parameters are shown in Table 2. The fitted root radii as a function of time are plotted in Fig. 3.
Parameters for root radius fit

Root radii fitting of Equation (3) to the numerical values calculated using the finite volume degradation approach proposed by Karch et al. [Reference Karch, Arteiro and Camanho5] for two LSP layers (ECF 73 and ECF 195) as a function of time for the transient current waveform D with a time to peak of 26.8 ${{\mu }}$
s, a decay time of 48.5
${{\mu }}$
s, a decay time of 48.5 ${{\mu }}$
s and a peak current of 96.4 kA.
${{\mu }}$
s and a peak current of 96.4 kA.

2.1 Near-surface explosion of the lightning protection layer
The explosion of the LSP layer is assumed to be caused mainly by the rapid vaporisation of the metallic mesh of the LSP layer due to Joule resistive heating. It is assumed that the spatial distribution of the expanding plasma pressure can be approximated by a Gaussian bell-shaped curve:
 \begin{align}{p_{\textrm{e}}}\left( {r,t} \right) = {p_{\textrm{e}}}\left( t \right){\textrm{ }}{k^{ - 2}}{\textrm{ exp}}\left[ { - \frac{{{r^2}}}{{{{\left( {k{\textrm{ }}{R_R}\left( t \right)} \right)}^2}}}} \right]\end{align}
where the effective plasma overpressure ${p_{\textrm{e}}}\left( t \right)$
is numerically determined separately for the two ECFs considering the corresponding root radii and the transient current waveform D with a time to peak of 26.8
${p_{\textrm{e}}}\left( t \right)$
is numerically determined separately for the two ECFs considering the corresponding root radii and the transient current waveform D with a time to peak of 26.8 $\mu $
s, a decay time of 48.5
$\mu $
s, a decay time of 48.5 $\mu $
s and a peak current of 96.4 kA [Reference Lepetit, Escure, Guinard, Revel, Peres and Duval44], as described by Karch et al. [Reference Karch, Arteiro and Camanho5]. The parameter
$\mu $
s and a peak current of 96.4 kA [Reference Lepetit, Escure, Guinard, Revel, Peres and Duval44], as described by Karch et al. [Reference Karch, Arteiro and Camanho5]. The parameter $k \lt 1$
in Equation (4) is used to limit the pressure distribution mainly to the arc root area
$k \lt 1$
in Equation (4) is used to limit the pressure distribution mainly to the arc root area $\pi R_R^2\left( t \right)$
. A sensitivity study on the influence of this parameter shows that it affects the predicted velocity and displacement fields in the first 80
$\pi R_R^2\left( t \right)$
. A sensitivity study on the influence of this parameter shows that it affects the predicted velocity and displacement fields in the first 80 $\mu $
s, but the displacements after that point, including their peak values, depend mostly on the effective overpressure
$\mu $
s, but the displacements after that point, including their peak values, depend mostly on the effective overpressure ${p_{\textrm{e}}}\left( t \right)$
numerically determined using the one-dimensional shock peening model [Reference Karch, Arteiro and Camanho5], namely when
${p_{\textrm{e}}}\left( t \right)$
numerically determined using the one-dimensional shock peening model [Reference Karch, Arteiro and Camanho5], namely when $k$
is not too small (i.e.,
$k$
is not too small (i.e., $k\ge 0.1$
). Based on the available experimental data [Reference Karch, Arteiro and Camanho5, Reference Lepetit, Escure, Guinard, Revel, Peres and Duval44] and the sensitivity analysis, this parameter is set to 0.4 and to 0.1 for ECF 73 and ECF 195, respectively, suggesting differences on the spatial pressure distribution, within the arc root area, caused by the explosion of the LSP layers with 73.3 g/m2 and 195.3 g/m2 surface weight. This is a limitation of the one-dimensional shock peening model of the overpressure caused by the explosion of the LSP layers [Reference Karch, Arteiro and Camanho5, Reference Lepetit, Escure, Guinard, Revel, Peres and Duval44], highlighting the need to develop a hemispherical shock peening model, currently not available, to account not only for the time evolution of the overpressure, but also for its spatial distribution.
$k\ge 0.1$
). Based on the available experimental data [Reference Karch, Arteiro and Camanho5, Reference Lepetit, Escure, Guinard, Revel, Peres and Duval44] and the sensitivity analysis, this parameter is set to 0.4 and to 0.1 for ECF 73 and ECF 195, respectively, suggesting differences on the spatial pressure distribution, within the arc root area, caused by the explosion of the LSP layers with 73.3 g/m2 and 195.3 g/m2 surface weight. This is a limitation of the one-dimensional shock peening model of the overpressure caused by the explosion of the LSP layers [Reference Karch, Arteiro and Camanho5, Reference Lepetit, Escure, Guinard, Revel, Peres and Duval44], highlighting the need to develop a hemispherical shock peening model, currently not available, to account not only for the time evolution of the overpressure, but also for its spatial distribution.
The generated effective plasma overpressure considering protected CFRP with a paint thickness of 300 $\mu $
m (covering the LSP layer) is shown in Fig. 4. The resulting mechanical impulses due to the near-surface explosion of the LSP layer are shown in Fig. 5 for CFRP protected with ECF 73 and in Fig. 6 for CFRP protected with ECF 195. As can be observed, for both LSP layers, the near-surface explosion is the transient mechanical load with the highest contribution.
$\mu $
m (covering the LSP layer) is shown in Fig. 4. The resulting mechanical impulses due to the near-surface explosion of the LSP layer are shown in Fig. 5 for CFRP protected with ECF 73 and in Fig. 6 for CFRP protected with ECF 195. As can be observed, for both LSP layers, the near-surface explosion is the transient mechanical load with the highest contribution.
Calculated overpressure caused by explosion of the LSP layers (ECF 73 and ECF 195) as a function of time considering a transient current waveform D with a time to peak of 26.8 ${{\mu }}$
s, a decay time of 48.5
${{\mu }}$
s, a decay time of 48.5 ${{\mu }}$
s and a peak current of 96.4 kA.
${{\mu }}$
s and a peak current of 96.4 kA.

Calculated mechanical impulses for the three main contributions to lightning-induced mechanical loads on CFRP protected with ECF 73 as a function of time considering a transient current waveform D with a time to peak of 26.8 ${{\mu }}$
s, a decay time of 48.5
${{\mu }}$
s, a decay time of 48.5 ${{\mu }}$
s and a peak current of 96.4 kA.
${{\mu }}$
s and a peak current of 96.4 kA.

Calculated mechanical impulses for the three main contributions to lightning-induced mechanical loads on CFRP protected with ECF 195 as a function of time considering a transient current waveform D with a time to peak of 26.8 ${{\mu }}$
s, a decay time of 48.5
${{\mu }}$
s, a decay time of 48.5 ${{\mu }}$
s and a peak current of 96.4 kA.
${{\mu }}$
s and a peak current of 96.4 kA.

2.2 Supersonic plasma expansion
2.2.1 Strong shock wave approximation
A supersonic shock wave is created by the overpressure caused by the rapid temperature rise of the plasma channel. Following Lin [Reference Lin45], the cylindrical shock wave expands radially according to the following time varying shock wave radius [Reference Karch, Arteiro and Camanho5]:
 \begin{align}R\left( t \right) \cong \left\{ {\begin{array}{*{20}{l}}{1.004{{\left( {\frac{{{E_0}}}{{{\rho _0}}}} \right)}^{0.25}}\sqrt {0.5} } {}{,{\textrm{ }}t \lt 0.5 \mu s} \\[8pt]{1.004{{\left( {\frac{{{E_0}}}{{{\rho _0}}}} \right)}^{0.25}}\sqrt t } {}{,{\textrm{ }}t \ge 0.5 \mu s} {}{}\end{array}} \right.\end{align}
where ${E_0}$
is the initial channel energy density and
${E_0}$
is the initial channel energy density and ${\rho _0}$
the initial mass (air) density. The following relationship between the initial channel energy density
${\rho _0}$
the initial mass (air) density. The following relationship between the initial channel energy density ${E_0}$
(J/m) and the lightning current peak
${E_0}$
(J/m) and the lightning current peak ${I_{{\textrm{max}}}}$
(A) can be established [Reference Karch, Schreiner, Honke and Wolfrum4, Reference Karch, Wulbrand and Müller46]:
${I_{{\textrm{max}}}}$
(A) can be established [Reference Karch, Schreiner, Honke and Wolfrum4, Reference Karch, Wulbrand and Müller46]:
 \begin{align}{E_0} \cong 0.45 \times {10^{ - 2}}{\textrm{ }}{\left( {{I_{{\textrm{max}}}}} \right)^{1.25}}\end{align}
Finally, the shock wave overpressure, which only depends on the peak current ${I_{{\textrm{max}}}}$
of the waveform, is described by:
${I_{{\textrm{max}}}}$
of the waveform, is described by:
 \begin{align}p\left( {\eta ,t} \right) \cong \left\{ {\begin{array}{*{20}{l}}{\beta \cdot t} {}{,{\textrm{ }}t \lt 0.5 \mu s} \\[5pt]{0.180{{\left( {{\rho _0}{E_0}} \right)}^{0.5}}f\left( \eta \right){\textrm{ }}{t^{ - 1}} - 1} {}{,{\textrm{ }}t \ge 0.5 \mu s} \\[5pt]0 {}{,{\textrm{ }}t \gt 100 \, \mu s} {}{}\end{array}} \right.\end{align}
where $\beta = 392.2952$
bar/
$\beta = 392.2952$
bar/ $\mu $
s is determined to approximately match the spatially uniform pressure distribution given by the strong shock wave approximation when
$\mu $
s is determined to approximately match the spatially uniform pressure distribution given by the strong shock wave approximation when $t = 0.5$ $\mu $
s for a current waveform with a peak current (
$\mu $
s for a current waveform with a peak current ( ${I_{{\textrm{max}}}}$
) of 96.4 kA,
${I_{{\textrm{max}}}}$
) of 96.4 kA, $f\left( \eta \right)$
is a dimensionless pressure function and
$f\left( \eta \right)$
is a dimensionless pressure function and $\eta = r/R\left( t \right)$
is the dimensionless radius [Reference Karch, Wulbrand and Müller46]. Figures 7 and 8 show, respectively, the computed shock radius and the pressure profile evolution with time. The resulting mechanical impulse due to the supersonic plasma expansion is shown in Figs. 5 and 6 (noting that the supersonic plasma expansion overpressure is independent of the LSP layer used). As can be observed, although, in this case, the contribution of the supersonic plasma expansion is lower than the contribution of the near-surface explosion, it cannot be neglected.
$\eta = r/R\left( t \right)$
is the dimensionless radius [Reference Karch, Wulbrand and Müller46]. Figures 7 and 8 show, respectively, the computed shock radius and the pressure profile evolution with time. The resulting mechanical impulse due to the supersonic plasma expansion is shown in Figs. 5 and 6 (noting that the supersonic plasma expansion overpressure is independent of the LSP layer used). As can be observed, although, in this case, the contribution of the supersonic plasma expansion is lower than the contribution of the near-surface explosion, it cannot be neglected.
Supersonic plasma expansion shock radius considering a transient current waveform D with a peak current of 96.4 kA.

Supersonic plasma expansion pressure profile evolution of the strong shock wave approximation and comparison with the ideal gas, Doan-Nickel and Plooster EOS, at 5 ${{\mu }}$
s, 10
${{\mu }}$
s, 10 ${{\mu }}$
s, 20
${{\mu }}$
s, 20 ${{\mu }}$
s, 50
${{\mu }}$
s, 50 ${{\mu }}$
s and 100
${{\mu }}$
s and 100 ${{\mu }}$
s from the highest (top left) to the lowest (bottom) pressure profiles, respectively.
${{\mu }}$
s from the highest (top left) to the lowest (bottom) pressure profiles, respectively.

2.2.2 Computational fluid dynamics (CFD) analysis
To evaluate the use of the strong shock wave approximation as an adequate and reliable approach to accurately describe the mechanical damage on composite structures, CFD analyses were performed in previous studies [Reference Honke and Karch47] and the corresponding shock pressures compared with the strong shock wave approximation. In this work, the effects on the mechanical response of protected CFRP is also assessed.
The theoretical foundation of this study is the Riemann problem, so the software used for CFD analysis must provide the user with the possibility to implement an appropriate equation of state (EOS). For the CFD analyses [Reference Honke and Karch47], the blastFoam [48] solver from the open-source toolbox blastFoam Version 5.0, which is based on the OpenFOAM® framework [Reference Greenshields49], was used. The numerical method is dependent on full finite volume discretisation and, for the present work, takes advantage of the modified Harten-Lax-van Leer Riemann solver flux discretisation introduced by Toro et al. [Reference Toro, Spruce and Speares50].
The solver blastFoam solves generally the compressible Navier-Stokes equations for a large variety of fluid and explosion models in three dimensions. Note that the Navier-Stokes equations with zero viscosity and zero thermal conductivity lead to Euler equations [Reference Toro51]. This is important because the propagation of shock waves generated by lightning discharges can be derived from Eulerian equations of mass, momentum and energy conservation [Reference Plooster52].
For the sake of completeness, three different EOS were compared using finite volume CFD calculations:
-
• Ideal gas assumption: Perfect gas with constant heat capacity
${C_p} = 1004$
J/(kg K), specific gas constant
$R = 287$
J/(kg K), and heat capacity ratio
$\gamma = 1.4$
. -
• Doan-Nickel: The EOS of Doan and Nickel [Reference Doan and Nickel53] includes changes in the composition of air at high temperatures and the variation of the specific heat ratio due to dissociation of molecules.
-
• Plooster: The ‘air2’ EOS of Plooster [Reference Plooster54, Reference Plooster55] also accounts for molecular changes by means of two equations: (i) expressing the specific internal energy as a function of temperature, and (ii) expressing the pressure as a function of temperature and density. However, to use the equations in the blastFoam solver, the equations must be numerically solved for temperature and pressure as a function of the specific internal energy and density with high accuracy [Reference Honke and Karch47].


To impose a cylindrical symmetry, the numerical domain in the CFD computations is modelled as a wedge with a 2 m radius. Thus, only one cell layer is necessary for the axial direction. The radial direction used a graded mesh with 2,500 cells and an expansion ratio of 40 from the innermost to the outermost cell length, ensuring mesh independence of the numerical results [Reference Honke and Karch47].
Symmetry and zero gradient boundary conditions for pressure, temperature and velocity are applied at the domain boundaries and at the centre axis so the pressure wave leaves the domain without reflection. The initial conditions are chosen so that the strong shock wave solution is calculated for a very short time (approx. $3 \times {10^{ - 6}}$
s) and the resulting fields are interpolated to the cell centres within the shock front. For the remaining range, atmospheric pressure and the ambient temperature of 300 K are used. For more details about the finite volume CFD models, the reader is referred to Honke and Karch [Reference Honke and Karch47].
$3 \times {10^{ - 6}}$
s) and the resulting fields are interpolated to the cell centres within the shock front. For the remaining range, atmospheric pressure and the ambient temperature of 300 K are used. For more details about the finite volume CFD models, the reader is referred to Honke and Karch [Reference Honke and Karch47].
For further use of the CFD results, the profiles of the fields in the cell centres are stored for different times as columns of a matrix. With a time step of 0.5 $\mu $
s and a time span of 3.5 ms, this results in a 2,500
$\mu $
s and a time span of 3.5 ms, this results in a 2,500 $ \times $
701 matrix for each field, which is used as an interpolation table in the subsequent analyses.
$ \times $
701 matrix for each field, which is used as an interpolation table in the subsequent analyses.
To understand the difference between the strong shock wave and the three cases obtained from the CFD calculations, graphical representations of the pressure profile evolutions, assuming that the initial value is at the attachment point, were compared at 5 $\mu $
s, 10
$\mu $
s, 10 $\mu $
s, 20
$\mu $
s, 20 $\mu $
s, 50
$\mu $
s, 50 $\mu $
s and 100
$\mu $
s and 100 $\mu $
s in Fig. 8. It includes the pressure profiles of ideal gas, Doan-Nickel and Plooster EOS and the solution of the strong shock wave approximation (Section 2.2.1). As it can be observed, after 20
$\mu $
s in Fig. 8. It includes the pressure profiles of ideal gas, Doan-Nickel and Plooster EOS and the solution of the strong shock wave approximation (Section 2.2.1). As it can be observed, after 20 $\mu $
s, the strong shock wave approximation does not predict well the shock front velocity.
$\mu $
s, the strong shock wave approximation does not predict well the shock front velocity.
2.3 Magnetic forces
As explained by Karch et al. [Reference Karch, Arteiro and Camanho5], the lightning current flows from the plasma channel into the LSP layer through the arc root surface. Therefore, the current flow in the LSP layer creates a magnetic pressure that depends on the region of the sample under ( $0 \lt r \lt {R_R}\left( t \right)$
) or beyond the arc root radius (
$0 \lt r \lt {R_R}\left( t \right)$
) or beyond the arc root radius ( $r \gt {R_R}\left( t \right)$
). Taking this into account, the effective magnetic surface pressure acting on the upper side of the LSP layer is given as:
$r \gt {R_R}\left( t \right)$
). Taking this into account, the effective magnetic surface pressure acting on the upper side of the LSP layer is given as:
 \begin{align}{p_{\textrm{m}}}\left( {r,t} \right) = \left\{ {\begin{array}{*{20}{l}}{\frac{{{\mu _r}{\textrm{ }}{\mu _0}{\textrm{ }}I{{(t)}^2}}}{{8{\pi ^2}}}\frac{{{r^2}}}{{R_R^4\left( t \right)}}} {}, {}{{\textrm{ }}0 \lt r \lt {R_R}\left( t \right)} \\[5pt]{\frac{{{\mu _r}{\textrm{ }}{\mu _0}{\textrm{ }}I{{(t)}^2}}}{{8{\pi ^2}{r^2}}}} {}, {}{{\textrm{ }}r \gt {R_R}\left( t \right)}\end{array}} \right.\end{align}
where ${\mu _0} = 4\pi \times {10^{ - 7}}$
H
${\mu _0} = 4\pi \times {10^{ - 7}}$
H $ \cdot $
m
$ \cdot $
m ${{\textrm{ }}^{ - 1}}$
is the permeability of the free space,
${{\textrm{ }}^{ - 1}}$
is the permeability of the free space, ${\mu _r} = 1$
is the relative permeability of the non-magnetic LSP layer, and
${\mu _r} = 1$
is the relative permeability of the non-magnetic LSP layer, and $I\left( t \right)$
is the total lightning current amplitude, here approximated by the modified double exponential function in Equation (2) [Reference Karch, Arteiro and Camanho5]. The magnetic pressure distribution is shown in Fig. 9. The resulting mechanical impulses due to the magnetic forces are shown in Fig. 5 for CFRP protected with ECF 73 and in Fig. 6 for CFRP protected with ECF 195. As can be observed, although, in this case, for both LSP layers the contribution of the magnetic forces is the lowest, it cannot be neglected.
$I\left( t \right)$
is the total lightning current amplitude, here approximated by the modified double exponential function in Equation (2) [Reference Karch, Arteiro and Camanho5]. The magnetic pressure distribution is shown in Fig. 9. The resulting mechanical impulses due to the magnetic forces are shown in Fig. 5 for CFRP protected with ECF 73 and in Fig. 6 for CFRP protected with ECF 195. As can be observed, although, in this case, for both LSP layers the contribution of the magnetic forces is the lowest, it cannot be neglected.
Maximum magnetic pressure evolution with time for two LSP layers (ECF 73 and ECF 195) considering a transient current waveform D with a time to peak of 26.8 ${{\mu }}$
s, a decay time of 48.5
${{\mu }}$
s, a decay time of 48.5 ${{\mu }}$
s and a peak current of 96.4 kA.
${{\mu }}$
s and a peak current of 96.4 kA.

3.0 Finite element analysis and validation
3.1 Finite element model
Following Lepetit et al. [Reference Lepetit, Escure, Guinard, Revel, Peres and Duval44], CFRP samples made from 8 T700/M21 UD plies with a quasi-isotropic [45/0/–45/90]S lay-up are considered in this study. Each T700/M21 UD ply is 0.262 mm thick. Samples protected using ECF 73 and ECF 195 were tested, and each sample had a polyurethane paint layer with a thickness of 300 $\mu $
m (including surfacing film).
$\mu $
m (including surfacing film).
Square laminated plates, 450 mm $ \times $
450 mm, were tested, supported on a fixed plate with a circular opening of 340 mm diameter, and fixed using screws placed along a circumference of 370 mm diameter concentric with the central opening of the support plate (Fig. 10a). Here, the full CFRP sample is modelled, fixing the out-of-plane displacement on the supported area outside the circular opening and fixing the nodes along the circumference where the screws are placed (Fig. 10b).
$ \times $
450 mm, were tested, supported on a fixed plate with a circular opening of 340 mm diameter, and fixed using screws placed along a circumference of 370 mm diameter concentric with the central opening of the support plate (Fig. 10a). Here, the full CFRP sample is modelled, fixing the out-of-plane displacement on the supported area outside the circular opening and fixing the nodes along the circumference where the screws are placed (Fig. 10b).
A fine mesh is used at the lightning strike location (Fig. 10b). Due to the sample size, a progressively coarser mesh was used as the distance to the centre of the sample increased. However, due to the small characteristic size (approximately 0.3 mm) of the finite elements in the refined region of the finite element model, the stable time increment of the explicit integration scheme is very small, and it tends to decrease with the simulation due to the collapse of a small number of volumetric elements below the attachment point of the lightning strike. To keep the computational cost of the explicit simulations reasonable, the selective mass scaling procedure available in Abaqus/Explicit [56] is used to limit the stable time increment. Because this procedure applies mass scaling just to the elements whose stable time increment is below a specified value, it was possible to limit the relative mass change to just 2 $ \times $
10
$ \times $
10 ${{\textrm{ }}^{ - 9}}$
, while achieving a reasonable computational cost, with negligible changes in the mechanical response of the plates subjected to lightning strike.
${{\textrm{ }}^{ - 9}}$
, while achieving a reasonable computational cost, with negligible changes in the mechanical response of the plates subjected to lightning strike.
A modification [Reference Furtado, Catalanotti, Arteiro, Gray, Wardle and Camanho57] to the continuum damage mechanics model proposed by Maimí et al. [Reference Maimí, Camanho, Mayugo and Dávila58, Reference Maimí, Camanho, Mayugo and Dávila59] is used to represent failure of the composite plies. This modified version of the continuum damage mechanics model has a decoupled longitudinal tensile and compressive elastic behaviour that accounts for different stiffness in tension and in compression parallel to the fibre direction, and it uses bilinear softening laws to model longitudinal damage growth in tension and in compression, including a residual stress plateau in compression to more accurately capture crushing effects [Reference Furtado, Catalanotti, Arteiro, Gray, Wardle and Camanho57]. Tables 3 and 4 show, respectively, the UD ply elastic properties and the strength and material degradation properties used in the simulations. ${S_{LP}}$
and
${S_{LP}}$
and ${K_P}$
are the in-plane shear yield stress and shear modulus degradation factor,
${K_P}$
are the in-plane shear yield stress and shear modulus degradation factor, ${X_T}$
,
${X_T}$
, ${X_C}$
,
${X_C}$
, ${f_{XT}}$
and
${f_{XT}}$
and ${f_{XC}}$
are the longitudinal tensile and compressive plain strengths and the pull-out (tension) and crushing (compression) strength factors,
${f_{XC}}$
are the longitudinal tensile and compressive plain strengths and the pull-out (tension) and crushing (compression) strength factors, ${Y_T}$
and
${Y_T}$
and ${Y_C}$
are the UD transverse tensile and compressive strengths,
${Y_C}$
are the UD transverse tensile and compressive strengths, ${\alpha _0}$
is the composite fracture angle in uniaxial transverse compression,
${\alpha _0}$
is the composite fracture angle in uniaxial transverse compression, ${S_L}$
is the UD in-plane shear strength,
${S_L}$
is the UD in-plane shear strength, ${{\mathcal G}_{1 + }}$
and
${{\mathcal G}_{1 + }}$
and ${f_{{\mathcal G}1 + }}$
are the longitudinal tensile fracture toughness and the fraction of the fracture toughness dissipated due to fibre pull-out,
${f_{{\mathcal G}1 + }}$
are the longitudinal tensile fracture toughness and the fraction of the fracture toughness dissipated due to fibre pull-out, ${{\mathcal G}_{1 - }}$
,
${{\mathcal G}_{1 - }}$
, ${{\mathcal G}_{2 + }}$
and
${{\mathcal G}_{2 + }}$
and ${{\mathcal G}_6}$
are the longitudinal compressive, transverse tensile and in-plane shear fracture toughness,
${{\mathcal G}_6}$
are the longitudinal compressive, transverse tensile and in-plane shear fracture toughness, ${f_{fxc}}$
is a frictional parameter used to scale
${f_{fxc}}$
is a frictional parameter used to scale ${f_{XC}}$
as a function of the hydrostatic pressure, and
${f_{XC}}$
as a function of the hydrostatic pressure, and ${\eta _G}$
is a material dependent empirically derived enhancement factor used in the definition of an effective fracture toughness for in-plane shear in the presence of transverse compressive stresses [Reference Furtado, Catalanotti, Arteiro, Gray, Wardle and Camanho57]. All material properties are independently determined; the elastic and strength properties follow standard test methods [Reference Charrier60–Reference Vandellos63], while the material degradation properties follow the approaches detailed by Furtado et al. [Reference Furtado, Catalanotti, Arteiro, Gray, Wardle and Camanho57].
${\eta _G}$
is a material dependent empirically derived enhancement factor used in the definition of an effective fracture toughness for in-plane shear in the presence of transverse compressive stresses [Reference Furtado, Catalanotti, Arteiro, Gray, Wardle and Camanho57]. All material properties are independently determined; the elastic and strength properties follow standard test methods [Reference Charrier60–Reference Vandellos63], while the material degradation properties follow the approaches detailed by Furtado et al. [Reference Furtado, Catalanotti, Arteiro, Gray, Wardle and Camanho57].
T700/M21 UD ply density, Young’s moduli, shear moduli and Poisson’s ratios

(a) Configuration of the lightning strike test support and sample. (b) Composite plate finite element mesh.

T700/M21 strengths and material degradation properties [Reference Charrier60–Reference Vandellos63] used in the modified continuum damage mechanics model [Reference Furtado, Catalanotti, Arteiro, Gray, Wardle and Camanho57]

The interaction properties with cohesive behaviour available in Abaqus [56] are used to model delamination, considering a bilinear traction-separation damage law. Mode-dependent strengths and fracture energies are considered. The onset of interlaminar damage is predicted by a quadratic stress-based criterion. Table 5 shows the interlaminar properties used in the simulations, where $K$
is the stiffness of the cohesive surfaces before damage onset,
$K$
is the stiffness of the cohesive surfaces before damage onset, ${{\mathcal G}_{Ic}}$
and
${{\mathcal G}_{Ic}}$
and ${{\mathcal G}_{IIc}}$
are respectively the mode I and mode II fracture toughness,
${{\mathcal G}_{IIc}}$
are respectively the mode I and mode II fracture toughness, ${\eta _{{\textrm{B}} - {\textrm{K}}}}$
is the mixed-mode parameter of the B-K law [Reference Benzeggagh and Kenane64], and
${\eta _{{\textrm{B}} - {\textrm{K}}}}$
is the mixed-mode parameter of the B-K law [Reference Benzeggagh and Kenane64], and ${\tau _3}$
the normal strength. The shear strengths
${\tau _3}$
the normal strength. The shear strengths ${\tau _1} = {\tau _2}$
are determined as a function of the mode I and mode II fracture toughness and the normal strength
${\tau _1} = {\tau _2}$
are determined as a function of the mode I and mode II fracture toughness and the normal strength ${\tau _3}$
as [Reference Turon, Camanho, Costa and Renart65]:
${\tau _3}$
as [Reference Turon, Camanho, Costa and Renart65]:
 \begin{align}{\tau _1} = {\tau _2} = {\tau _3}\sqrt {\frac{{{{\mathcal G}_{IIc}}}}{{{{\mathcal G}_{Ic}}}}} \end{align}
T700/M21 interlaminar properties

To account for friction between delaminating interfaces subjected to sliding movements, tangential friction is assigned to the cohesive surface interactions. Following previous work with a similar modelling strategy [Reference Arteiro, Gray and Camanho66], a friction coefficient of 0.3 is assumed.
The LSP layers are assumed homogeneous orthotropic linear-elastic solids. Following Karch et al. [Reference Karch, Arteiro and Camanho5], the effective properties of ECF 73 and ECF 195 filled with epoxy resin M21 were determined from a micro-mechanical finite element homogenisation approach using the commercial finite element package ANSYS. Periodic boundary conditions were applied to a representative volume element (RVE) of a unit cell of the metallic mesh filled with resin by coupling nodes of the finite elements on the opposite boundary surfaces of the unit cell. Three uniaxial tensile strain loads and three shear strain loads ( ${{\bf{E}}_j}$
) are solved to obtain the full stiffness matrix. The macroscopic stresses (
${{\bf{E}}_j}$
) are solved to obtain the full stiffness matrix. The macroscopic stresses ( ${{\bf{\Sigma }}_i}$
) are obtained by averaging the microscopic stress within the RVE, and the
${{\bf{\Sigma }}_i}$
) are obtained by averaging the microscopic stress within the RVE, and the $j$
th column of the effective stiffness tensor is obtained from:
$j$
th column of the effective stiffness tensor is obtained from:
 \begin{align}C_{ij}^{\textrm{*}} = \frac{{{{\bf{\Sigma }}_i}}}{{{{\bf{E}}_j}}}\end{align}
The properties obtained for both LSP layers are given in Table 6. A similar numerical finite element approach can be used to determine the effective electrical and thermal conductivities of orthotropic hybrid ECF/epoxy resin structures. For more details about the homogenisation approach, the reader is referred to Karch et al. [Reference Karch, Arteiro and Camanho5].
Effective properties of ECF 73 and ECF 195 filled with epoxy resin M21

Following Karch et al. [Reference Karch, Arteiro and Camanho5], the mechanical forces resulting (i) from the near-surface explosion of the LSP layer, (ii) from the supersonic plasma expansion and (iii) from the magnetic field caused by the impressed current flow in the electrically conducting structures for a transient current waveform D with a time to peak of 26.8 $\mu $
s, a decay time of 48.5
$\mu $
s, a decay time of 48.5 $\mu $
s and a peak current of 96.4 kA [Reference Lepetit, Escure, Guinard, Revel, Peres and Duval44], presented in Section 2, are implemented in the finite element software Abaqus/Explicit [56] using the user-defined subroutine VDLOAD. The use of the explicit solver Abaqus/Explicit [56], on one hand, facilitates the solution of the continuum damage mechanics model [Reference Furtado, Catalanotti, Arteiro, Gray, Wardle and Camanho57], implemented in a user-defined subroutine VUMAT, circumventing convergence issues, typical in this type of models, without the need to implement viscous regularisation procedures. On the other hand, the adoption of an explicit dynamics solution is compatible with the highly transient and short time lightning strike problem considered in this study.
$\mu $
s and a peak current of 96.4 kA [Reference Lepetit, Escure, Guinard, Revel, Peres and Duval44], presented in Section 2, are implemented in the finite element software Abaqus/Explicit [56] using the user-defined subroutine VDLOAD. The use of the explicit solver Abaqus/Explicit [56], on one hand, facilitates the solution of the continuum damage mechanics model [Reference Furtado, Catalanotti, Arteiro, Gray, Wardle and Camanho57], implemented in a user-defined subroutine VUMAT, circumventing convergence issues, typical in this type of models, without the need to implement viscous regularisation procedures. On the other hand, the adoption of an explicit dynamics solution is compatible with the highly transient and short time lightning strike problem considered in this study.
To implement the overpressure of the supersonic plasma expansion given by the CFD calculations (Fig. 8), the CFD results are exported to data files as described in Section 2.2.2. For each time increment of the finite element structural simulation of the lighting strike, on each node of the surface where the pressure is applied, the VDLOAD subroutine reads the 2,500 $ \times $
701 results data file (Section 2.2.2), and the overpressure of the supersonic plasma expansion at the current time and location is determined by bilinear interpolation between the available position and time data points extracted from the CFD analysis.
$ \times $
701 results data file (Section 2.2.2), and the overpressure of the supersonic plasma expansion at the current time and location is determined by bilinear interpolation between the available position and time data points extracted from the CFD analysis.
As discussed by Karch et al. [Reference Karch, Arteiro and Camanho5], the velocity interferometer system for any reflector (VISAR) deflection measurements conducted by Lepetit et al. [Reference Lepetit, Escure, Guinard, Revel, Peres and Duval44] strongly indicate that the lightning strike did not initiate from the middle of the CFRP samples. Therefore, Karch et al. [Reference Karch, Arteiro and Camanho5] used a 2D symmetric Gauss function to fit the deflection in the measurement points 1–5 (Fig. 10) for different times. Karch et al. [Reference Karch, Arteiro and Camanho5] then averaged the time dependent offset coordinates, obtaining the values given in Table 7. The mechanical pressures described in Section 2.0 are centred at these points.
Offset coordinates for ECF 73 and ECF 195

3.2 Finite element results
The results are presented for the two CFRP samples, protected with ECF 73 and with ECF 195. For each LSP layer, the displacement and velocity results at the five VISAR points (1–5 in Fig. 10) are presented, followed by layer-by-layer damage maps, to assess the damage induced by the simulated lightning strike through the thickness of the laminate.
3.2.1 ECF 73 LSP layer
Figure 11 shows the finite element prediction of the deformed shape obtained with the plasma expansion shock wave from the CFD calculations based on Plooster EOS. Figure 12 compares the predictions using the analytical strong shock wave approximation and the CFD data based on Plooster EOS. Similar results are obtained for the remaining EOS. In all cases, the displacements and velocities are very similar in the initial 100 $\mu $
s. Slightly larger displacements are then predicted for time periods above 100
$\mu $
s. Slightly larger displacements are then predicted for time periods above 100 $\mu $
s when considering the solutions based on CFD data to compute the plasma expansion shock wave.
$\mu $
s when considering the solutions based on CFD data to compute the plasma expansion shock wave.
Deformed shape of the bottom layer (‘Layer 1’) along a centre line of the laminated plate for ECF 73 within a time ${\textrm{t}} \le 500$ ${{\mu }}$
s (colour bar) obtained using the plasma expansion shock wave from the CFD calculations based on Plooster EOS.
${{\mu }}$
s (colour bar) obtained using the plasma expansion shock wave from the CFD calculations based on Plooster EOS.

Finite element predictions of the displacements and velocities at the five VISAR points (1–5 in Fig. 10) obtained using the plasma expansion shock waves from the analytical approximation (solid lines) and from the CFD calculations based on Plooster EOS (dashed lines) for ECF 73.

Figures 13–16 show the predicted layer-by-layer damage maps for ECF 73. Here, the onset and propagation of damage can be assessed, considering the intralaminar damage variables in the longitudinal direction ( ${d_1}$
), transverse direction (
${d_1}$
), transverse direction ( ${d_2}$
) and shear (
${d_2}$
) and shear ( ${d_6}$
), following Furtado et al. [Reference Furtado, Catalanotti, Arteiro, Gray, Wardle and Camanho57], and interlaminar damage (
${d_6}$
), following Furtado et al. [Reference Furtado, Catalanotti, Arteiro, Gray, Wardle and Camanho57], and interlaminar damage ( $d$
) [Reference Turon, Camanho, Costa and Renart65]. No major differences between the predictions obtained using the plasma expansion shock waves from the strong shock wave approximation and from the CFD data are observed, independently of the EOS used in the CFD calculations.
$d$
) [Reference Turon, Camanho, Costa and Renart65]. No major differences between the predictions obtained using the plasma expansion shock waves from the strong shock wave approximation and from the CFD data are observed, independently of the EOS used in the CFD calculations.
Longitudinal (fibre) damage maps ( ${{\textrm{d}}_1}$
) considering the plasma expansion shock waves from the strong shock wave approximation and from the CFD calculations for ECF 73. The 0
${{\textrm{d}}_1}$
) considering the plasma expansion shock waves from the strong shock wave approximation and from the CFD calculations for ECF 73. The 0 ${{\textrm{ }}^ \circ }$
direction is parallel to the (horizontal) X-axis. The layer count starts from the bottom of the laminate (‘Layer 1’) to the top of the laminate (‘Layer 8’). The latter is immediately below the LSP layer, where the VDLOAD pressure profiles are applied. The whole square layers (450 mm-long sides) are shown. All images are presented on the same scale to facilitate the comparison between the extent of the different damage mechanisms.
${{\textrm{ }}^ \circ }$
direction is parallel to the (horizontal) X-axis. The layer count starts from the bottom of the laminate (‘Layer 1’) to the top of the laminate (‘Layer 8’). The latter is immediately below the LSP layer, where the VDLOAD pressure profiles are applied. The whole square layers (450 mm-long sides) are shown. All images are presented on the same scale to facilitate the comparison between the extent of the different damage mechanisms.

Transverse (matrix) damage maps ( ${{\textrm{d}}_2}$
) considering the plasma expansion shock waves from the strong shock wave approximation and from the CFD calculations for ECF 73. The 0
${{\textrm{d}}_2}$
) considering the plasma expansion shock waves from the strong shock wave approximation and from the CFD calculations for ECF 73. The 0 ${{\textrm{ }}^ \circ }$
direction is parallel to the (horizontal) X-axis. The layer count starts from the bottom of the laminate (‘Layer 1’) to the top of the laminate (‘Layer 8’). The latter is immediately below the LSP layer, where the VDLOAD pressure profiles are applied. The whole square layers (450 mm-long sides) are shown. All images are presented on the same scale to facilitate the comparison between the extent of the different damage mechanisms.
${{\textrm{ }}^ \circ }$
direction is parallel to the (horizontal) X-axis. The layer count starts from the bottom of the laminate (‘Layer 1’) to the top of the laminate (‘Layer 8’). The latter is immediately below the LSP layer, where the VDLOAD pressure profiles are applied. The whole square layers (450 mm-long sides) are shown. All images are presented on the same scale to facilitate the comparison between the extent of the different damage mechanisms.

Shear (matrix) damage maps ( ${{\textrm{d}}_6}$
) considering the plasma expansion shock waves from the strong shock wave approximation and from the CFD calculations for ECF 73. The 0
${{\textrm{d}}_6}$
) considering the plasma expansion shock waves from the strong shock wave approximation and from the CFD calculations for ECF 73. The 0 ${{\textrm{ }}^ \circ }$
direction is parallel to the (horizontal) X-axis. The layer count starts from the bottom of the laminate (‘Layer 1’) to the top of the laminate (‘Layer 8’). The latter is immediately below the LSP layer, where the VDLOAD pressure profiles are applied. The whole square layers (450 mm-long sides) are shown. All images are presented on the same scale to facilitate the comparison between the extent of the different damage mechanisms.
${{\textrm{ }}^ \circ }$
direction is parallel to the (horizontal) X-axis. The layer count starts from the bottom of the laminate (‘Layer 1’) to the top of the laminate (‘Layer 8’). The latter is immediately below the LSP layer, where the VDLOAD pressure profiles are applied. The whole square layers (450 mm-long sides) are shown. All images are presented on the same scale to facilitate the comparison between the extent of the different damage mechanisms.

Interlaminar damage maps ( ${\textrm{d}}$
) considering the plasma expansion shock waves from the strong shock wave approximation and from the CFD calculations for ECF 73. The 0
${\textrm{d}}$
) considering the plasma expansion shock waves from the strong shock wave approximation and from the CFD calculations for ECF 73. The 0 ${{\textrm{ }}^ \circ }$
direction is parallel to the (horizontal) X-axis. The layer count starts from the bottom of the laminate (‘Layer 1’) to the top of the laminate (‘Layer 8’). The latter is immediately below the LSP layer, where the VDLOAD pressure profiles are applied. The whole square layers (450 mm-long sides) are shown. All images are presented on the same scale to facilitate the comparison between the extent of the different damage mechanisms.
${{\textrm{ }}^ \circ }$
direction is parallel to the (horizontal) X-axis. The layer count starts from the bottom of the laminate (‘Layer 1’) to the top of the laminate (‘Layer 8’). The latter is immediately below the LSP layer, where the VDLOAD pressure profiles are applied. The whole square layers (450 mm-long sides) are shown. All images are presented on the same scale to facilitate the comparison between the extent of the different damage mechanisms.

3.2.2 ECF 195 LSP layer
Figure 17 presents the finite element prediction of the deformed shape obtained with the plasma expansion shock wave from the CFD calculations based on Plooster EOS when the CFRP laminate is protected by ECF 195. Figures 18 and 19 compare the predictions using the analytical strong shock wave approximation and the CFD data based, respectively, on the EOS with the ideal gas assumption and on Plooster EOS. The results of the latter are similar to those obained using the CFD data based on Doan-Nickel EOS. While slightly lower displacements are obtained in the initial 300 $\mu $
s with the CFD data based on the EOS with the ideal gas assumption, slightly larger displacements are predicted for time periods above 100
$\mu $
s with the CFD data based on the EOS with the ideal gas assumption, slightly larger displacements are predicted for time periods above 100 $\mu $
s when employing the plasma expansion shock wave from the CFD calculations based on Doan-Nickel and Plooster EOS, compared with the solution from the analytical strong shock wave approximation. These differences, however, have just a mild impact on the predicted damage footprints (Figs. 20–23).
$\mu $
s when employing the plasma expansion shock wave from the CFD calculations based on Doan-Nickel and Plooster EOS, compared with the solution from the analytical strong shock wave approximation. These differences, however, have just a mild impact on the predicted damage footprints (Figs. 20–23).
Figures 20–23 show the predicted layer-by-layer damage maps for ECF 195, where the onset and propagation of damage can be assessed, considering the intralaminar damage variables in the longitudinal direction ( ${d_1}$
), transverse direction (
${d_1}$
), transverse direction ( ${d_2}$
) and shear (
${d_2}$
) and shear ( ${d_6}$
), following Furtado et al. [Reference Furtado, Catalanotti, Arteiro, Gray, Wardle and Camanho57], and interlaminar damage (
${d_6}$
), following Furtado et al. [Reference Furtado, Catalanotti, Arteiro, Gray, Wardle and Camanho57], and interlaminar damage ( $d$
) [Reference Turon, Camanho, Costa and Renart65]. As expected, the damage extent on the CFRP laminate protected by ECF 195 is lower than that protected by the lighter ECF 73 (Figs. 13–16). Yet, no major differences between the predictions obtained using the plasma expansion shock waves from the strong shock wave approximation and from the CFD data are observed, similarly to what was observed for ECF 73 (Figs. 13–16).
$d$
) [Reference Turon, Camanho, Costa and Renart65]. As expected, the damage extent on the CFRP laminate protected by ECF 195 is lower than that protected by the lighter ECF 73 (Figs. 13–16). Yet, no major differences between the predictions obtained using the plasma expansion shock waves from the strong shock wave approximation and from the CFD data are observed, similarly to what was observed for ECF 73 (Figs. 13–16).
Deformed shape of the bottom layer (‘Layer 1’) along a centre line of the laminated plate for ECF 195 within a time ${\textrm{t}} \le 500$ ${{\mu }}$
s (colour bar) obtained using the plasma expansion shock wave from the CFD calculations based on Plooster EOS.
${{\mu }}$
s (colour bar) obtained using the plasma expansion shock wave from the CFD calculations based on Plooster EOS.

Finite element predictions of the displacements and velocities at the five VISAR points (1–5 in Fig. 10) obtained using the plasma expansion shock waves from the analytical approximation (solid lines) and from the CFD calculations based on the EOS with the ideal gas assumption (dashed lines) for ECF 195.

Finite element predictions of the displacements and velocities at the five VISAR points (1–5 in Fig. 10) obtained using the plasma expansion shock waves from the analytical approximation (solid lines) and from the CFD calculations based on Plooster EOS (dashed lines) for ECF 195.

Longitudinal (fibre) damage maps ( ${{\textrm{d}}_1}$
) considering the plasma expansion shock waves from the strong shock wave approximation and from the CFD calculations for ECF 195. The 0
${{\textrm{d}}_1}$
) considering the plasma expansion shock waves from the strong shock wave approximation and from the CFD calculations for ECF 195. The 0 ${{\textrm{ }}^ \circ }$
direction is parallel to the (horizontal) X-axis. The layer count starts from the bottom of the laminate (‘Layer 1’) to the top of the laminate (‘Layer 8’). The latter is immediately below the LSP layer, where the VDLOAD pressure profiles are applied. The whole square layers (450 mm-long sides) are shown. All images are presented on the same scale to facilitate the comparison between the extent of the different damage mechanisms.
${{\textrm{ }}^ \circ }$
direction is parallel to the (horizontal) X-axis. The layer count starts from the bottom of the laminate (‘Layer 1’) to the top of the laminate (‘Layer 8’). The latter is immediately below the LSP layer, where the VDLOAD pressure profiles are applied. The whole square layers (450 mm-long sides) are shown. All images are presented on the same scale to facilitate the comparison between the extent of the different damage mechanisms.

Transverse (matrix) damage maps ( ${{\textrm{d}}_2}$
) considering the plasma expansion shock waves from the strong shock wave approximation and from the CFD calculations for ECF 195. The 0
${{\textrm{d}}_2}$
) considering the plasma expansion shock waves from the strong shock wave approximation and from the CFD calculations for ECF 195. The 0 ${{\textrm{ }}^ \circ }$
direction is parallel to the (horizontal) X-axis. The layer count starts from the bottom of the laminate (‘Layer 1’) to the top of the laminate (‘Layer 8’). The latter is immediately below the LSP layer, where the VDLOAD pressure profiles are applied. The whole square layers (450 mm-long sides) are shown. All images are presented on the same scale to facilitate the comparison between the extent of the different damage mechanisms.
${{\textrm{ }}^ \circ }$
direction is parallel to the (horizontal) X-axis. The layer count starts from the bottom of the laminate (‘Layer 1’) to the top of the laminate (‘Layer 8’). The latter is immediately below the LSP layer, where the VDLOAD pressure profiles are applied. The whole square layers (450 mm-long sides) are shown. All images are presented on the same scale to facilitate the comparison between the extent of the different damage mechanisms.

Shear (matrix) damage maps ( ${{\textrm{d}}_6}$
) considering the plasma expansion shock waves from the strong shock wave approximation and from the CFD calculations for ECF 195. The 0
${{\textrm{d}}_6}$
) considering the plasma expansion shock waves from the strong shock wave approximation and from the CFD calculations for ECF 195. The 0 ${{\textrm{ }}^ \circ }$
direction is parallel to the (horizontal) X-axis. The layer count starts from the bottom of the laminate (‘Layer 1’) to the top of the laminate (‘Layer 8’). The latter is immediately below the LSP layer, where the VDLOAD pressure profiles are applied. The whole square layers (450 mm-long sides) are shown. All images are presented on the same scale to facilitate the comparison between the extent of the different damage mechanisms.
${{\textrm{ }}^ \circ }$
direction is parallel to the (horizontal) X-axis. The layer count starts from the bottom of the laminate (‘Layer 1’) to the top of the laminate (‘Layer 8’). The latter is immediately below the LSP layer, where the VDLOAD pressure profiles are applied. The whole square layers (450 mm-long sides) are shown. All images are presented on the same scale to facilitate the comparison between the extent of the different damage mechanisms.

Interlaminar damage maps ( ${\textrm{d}}$
) considering the plasma expansion shock waves from the strong shock wave approximation and from the CFD calculations for ECF 195. The 0
${\textrm{d}}$
) considering the plasma expansion shock waves from the strong shock wave approximation and from the CFD calculations for ECF 195. The 0 ${{\textrm{ }}^ \circ }$
direction is parallel to the (horizontal) X-axis. The layer count starts from the bottom of the laminate (‘Layer 1’) to the top of the laminate (‘Layer 8’). The latter is immediately below the LSP layer, where the VDLOAD pressure profiles are applied. The whole square layers (450 mm-long sides) are shown. All images are presented on the same scale to facilitate the comparison between the extent of the different damage mechanisms.
${{\textrm{ }}^ \circ }$
direction is parallel to the (horizontal) X-axis. The layer count starts from the bottom of the laminate (‘Layer 1’) to the top of the laminate (‘Layer 8’). The latter is immediately below the LSP layer, where the VDLOAD pressure profiles are applied. The whole square layers (450 mm-long sides) are shown. All images are presented on the same scale to facilitate the comparison between the extent of the different damage mechanisms.

3.2.3 Discussion
Through a pressure profile analysis, some differences between the strong shock wave approximation, and the CFD data are notorious in the peak plasma expansion overpressure at the different instant times selected (Fig. 8). In spite of expecting improvements in the accuracy of the mechanical simulations, the need to read and interpolate external data during the mechanical finite element simulations leads to a significant increase of the runtime, in some cases reaching a factor of 7; running on 8 CPUs, the explicit finite element calculations of the mechanical response took between 5 hours, when employing the strong shock wave approximation, and 35 hours, when using the data obtained from CFD analysis (even though it is recognised that there is room to improve the access to and interpolation of the discrete CFD data, since optimisation of this process was out of scope of the current work).
The strong shock wave approximation is based on the theoretical approach of Karch et al. [Reference Karch, Honke, Steinwandel and Dittrich67] that uses the cylindrical blast shock wave model of a lightning return stroke developed by Lin [Reference Lin45] for an ideal problem. So, as expected, the EOS for a perfect gas achieves similar quantitative results for displacement and velocity. The discrepancy observed can be reduced by an optimisation of the input parameters in the equation of the strong shock wave approximation. For the cases considering Doan-Nickel and Plooster EOS, higher values of displacement are predicted. Nevertheless, a reasonable agreement between the analytical approximation and the CFD data is observed for the ECF 73 and the ECF 195. Finally, the evaluation of the damage induced on each layer of the laminate, considering the damage variables in the longitudinal direction ( ${d_1}$
), transverse direction (
${d_1}$
), transverse direction ( ${d_2}$
), shear (
${d_2}$
), shear ( ${d_6}$
) and delamination (
${d_6}$
) and delamination ( $d$
), shows very similar results in all cases. Therefore, in this case, it is concluded that, in the prediction of the mechanical damage induced by lightning strikes, the use of a strong shock wave approximation suffices. Moreover, the implementation of the strong shock wave approximation significantly improves the efficiency of the overall numerical implementation, especially by avoiding the need to compute the overpressure beforehand using CFD.
$d$
), shows very similar results in all cases. Therefore, in this case, it is concluded that, in the prediction of the mechanical damage induced by lightning strikes, the use of a strong shock wave approximation suffices. Moreover, the implementation of the strong shock wave approximation significantly improves the efficiency of the overall numerical implementation, especially by avoiding the need to compute the overpressure beforehand using CFD.
3.3 Model validation
The predictions of the mechanical response obtained with the model proposed in this work using the plasma expansion shock waves obtained from the strong shock wave approximation is validated against direct measurements of the out-of-plane displacement and velocity of coupons tested by Lepetit et al. [Reference Lepetit, Escure, Guinard, Revel, Peres and Duval44]. The comparison with the experimental VISAR measurements [Reference Lepetit, Escure, Guinard, Revel, Peres and Duval44] for ECF 73 and ECF 195 is shown in Figs. 24–25, respectively.
Finite element predictions of the displacements and velocities at the five VISAR points (1–5 in Fig. 10) obtained using the plasma expansion shock waves from the analytical approximation (solid lines) and corresponding experimental VISAR measurements (dashed lines) for ECF 73 [Reference Lepetit, Escure, Guinard, Revel, Peres and Duval44].

Finite element predictions of the displacements and velocities at the five VISAR points (1–5 in Fig. 10) obtained using the plasma expansion shock waves from the analytical approximation (solid lines) and corresponding experimental VISAR measurements (dashed lines) for ECF 195 [Reference Lepetit, Escure, Guinard, Revel, Peres and Duval44].

As can be observed, the predictions of the out-of-plane velocity represent very well the experimental results at the different measurement points, in particular the peak velocities. Regarding the predicted deflections, although they exceed the experimental results at the initial 50–300 $\mu $
s, the results then converge at around 500
$\mu $
s, the results then converge at around 500 $\mu $
s.
$\mu $
s.
Remarkable improvements can be observed with respect to what was previously obtained by Karch et al. [Reference Karch, Arteiro and Camanho5] with shell elements in terms of velocity and deflection predictions. On the other hand, the results in Figs. 24–25 also demonstrate that the models of the lightning loads proposed by Karch et al. [Reference Karch, Arteiro and Camanho5] can accurately represent the mechanical contributions from lightning strike, in particular when used together with detailed 3D damage models for CFRPs, as employed in this work.
Figures 13–16 and Figs. 20–23 show the contour plots of the damaged elements (intralaminar damage ${d_1}$
,
${d_1}$
, ${d_2}$
and
${d_2}$
and ${d_6}$
) and interfaces (interlaminar damage
${d_6}$
) and interfaces (interlaminar damage $d$
) corresponding to damage onset (partially damaged elements/interfaces, with
$d$
) corresponding to damage onset (partially damaged elements/interfaces, with $0\leqslant{d_i}\lt1, i = 1,2,6$
and
$0\leqslant{d_i}\lt1, i = 1,2,6$
and $0\leqslant{d}\lt1$
, in black) and failure (fully damaged elements, with
$0\leqslant{d}\lt1$
, in black) and failure (fully damaged elements, with ${d_i} \approx 1, i = 1,2,6$
and
${d_i} \approx 1, i = 1,2,6$
and $d \approx 1$
, in red) for the strong shock wave approximation. Due to the progressively coarser mesh from the centre of the sample, the damage onset maps are less accurate in the coarse regions. This can lead to extensive areas of damage onset, e.g., for ECF 73 (Figs. 14–15) closer to the supporting edge. Therefore, any quantitative measure of damage extent would be affected by some level of subjectivity. Nevertheless, the damage patterns are those usually observed on CFRP samples subjected to simulated lightning strikes and attributed to mechanical effects: damage tends to concentrate below the region of the initial attachment, mainly interlaminar and matrix damage at the middle and bottom plies, and to spread away from the initial attachment point predominantly at the top plies. Although the extent of interlaminar damage (
$d \approx 1$
, in red) for the strong shock wave approximation. Due to the progressively coarser mesh from the centre of the sample, the damage onset maps are less accurate in the coarse regions. This can lead to extensive areas of damage onset, e.g., for ECF 73 (Figs. 14–15) closer to the supporting edge. Therefore, any quantitative measure of damage extent would be affected by some level of subjectivity. Nevertheless, the damage patterns are those usually observed on CFRP samples subjected to simulated lightning strikes and attributed to mechanical effects: damage tends to concentrate below the region of the initial attachment, mainly interlaminar and matrix damage at the middle and bottom plies, and to spread away from the initial attachment point predominantly at the top plies. Although the extent of interlaminar damage ( $d$
) predicted by the models (which is almost negligible) is substantially lower than the total delaminated area identified by C-scan (whose pictures are not publicly available, but were considered for comparison and model validation), the combined extent of matrix-dominated damage (
$d$
) predicted by the models (which is almost negligible) is substantially lower than the total delaminated area identified by C-scan (whose pictures are not publicly available, but were considered for comparison and model validation), the combined extent of matrix-dominated damage ( ${d_2}$
,
${d_2}$
, ${d_6}$
and
${d_6}$
and $d$
) below the second ply follows the trends observed experimentally: damage extends until the few rear plies, and ECF 73 leads to a total damaged area below the second ply approximately three times larger than ECF 195. It is important to stress that it is often assumed that damage at the interface between the first and second plies in the tests is essentially surface damage, and thus, mostly affected by thermally induced effects. For that reason, it is common practice in industry to neglect the damaged area at the first interface when determining the damaged area by C-scan after testing, thus considering only the damaged area below the second ply.
$d$
) below the second ply follows the trends observed experimentally: damage extends until the few rear plies, and ECF 73 leads to a total damaged area below the second ply approximately three times larger than ECF 195. It is important to stress that it is often assumed that damage at the interface between the first and second plies in the tests is essentially surface damage, and thus, mostly affected by thermally induced effects. For that reason, it is common practice in industry to neglect the damaged area at the first interface when determining the damaged area by C-scan after testing, thus considering only the damaged area below the second ply.
4.0 Concluding remarks
The present work shows that the overall mechanical response of CFRP laminates subjected to lightning strike can be accurately captured combining appropriate models of the mechanical loads induced by this type of events with robust, 3D constitutive models for CFRPs. A significant improvement of the accuracy of the deflection and velocity fields (see Figs. 24–25) with respect to the shell models of Karch et al. [Reference Karch, Arteiro and Camanho5] is observed. This work also supports and validates the use of a strong shock wave approximation to model the supersonic expansion of the hot plasma channel when predicting mechanical damage on composite structures caused by lightning strikes. When compared with three different EOS implemented in CFD analyses (whose effects are comparable), the predictions obtained with the analytical strong shock wave approximation led to similar results at a fraction of the computational burden; the implementation of the strong shock wave approximation leads to a lower runtime, by a factor of 7 in this study, and avoids the need to compute the overpressure beforehand using CFD. The assessment of the pressure profiles, the numerical predictions of the displacement and velocity fields and the analysis of the predicted damage maps show that, for the two LSP layers under consideration, the strong shock wave approximation provides a reasonably good description of the effects of the supersonic plasma expansion loads.
Despite this step further in the development and validation of physically based models to represent the mechanical effects of lightning strikes on protected CFRP, here specially focused on the solutions for the shock waves resulting from the hot plasma supersonic expansion, some limitations persist, in particular with regards to modelling the overpressure caused by the explosion of the LSP layer. In particular, the need to develop a hemispherical shock peening model, currently not available, to account not only for the time evolution of the overpressure, but also for its spatial distribution, is highlighted.
It is also noted that the problem covered in this study was addressed as a deterministic problem. However, given the fact that lightning discharges are characterised by multiple uncertainties, including initial attachment point, channel movement during discharge, current amplitude and time variability, among other, the need to address this phenomenon from a stochastic point of view [Reference Minigher, Arteiro, Turon, Fatemi, Barrière and Camanho68, Reference Minigher, Arteiro, Turon, Fatemi, Guinard, Barrière and Camanho69] is also highlighted. But considering the transient mechanical response induced by lightning discharges, appropriate methods for the quantification and propagation of uncertainties under dynamic conditions must be considered [Reference Yang, Xu, Wang and Fan70, Reference Yang and Yu71]. Finally, the proposed methods could also open the avenue to structural health monitoring of aerostructures subjected to lightning strike by supporting appropriate placement of advanced sensing technologies [Reference Yang and Xia72].
Acknowledgements
The authors acknowledge the financial support provided by AIRBUS, under the contracts ‘Modelling and Simulation of Lightning Induced Damage of Composite Structures’, ‘Improved simulation of mechanical lightning loads on composite laminated structures’, ‘Lightning Protection’ and ‘Damage Mechanics for Lightning strike of protected CFRP structures’. A. Arteiro acknowledges the support of FCT – Fundação para a Ciência e a Tecnologia, I.P., in the scope of the project UIDB/50022/2020.
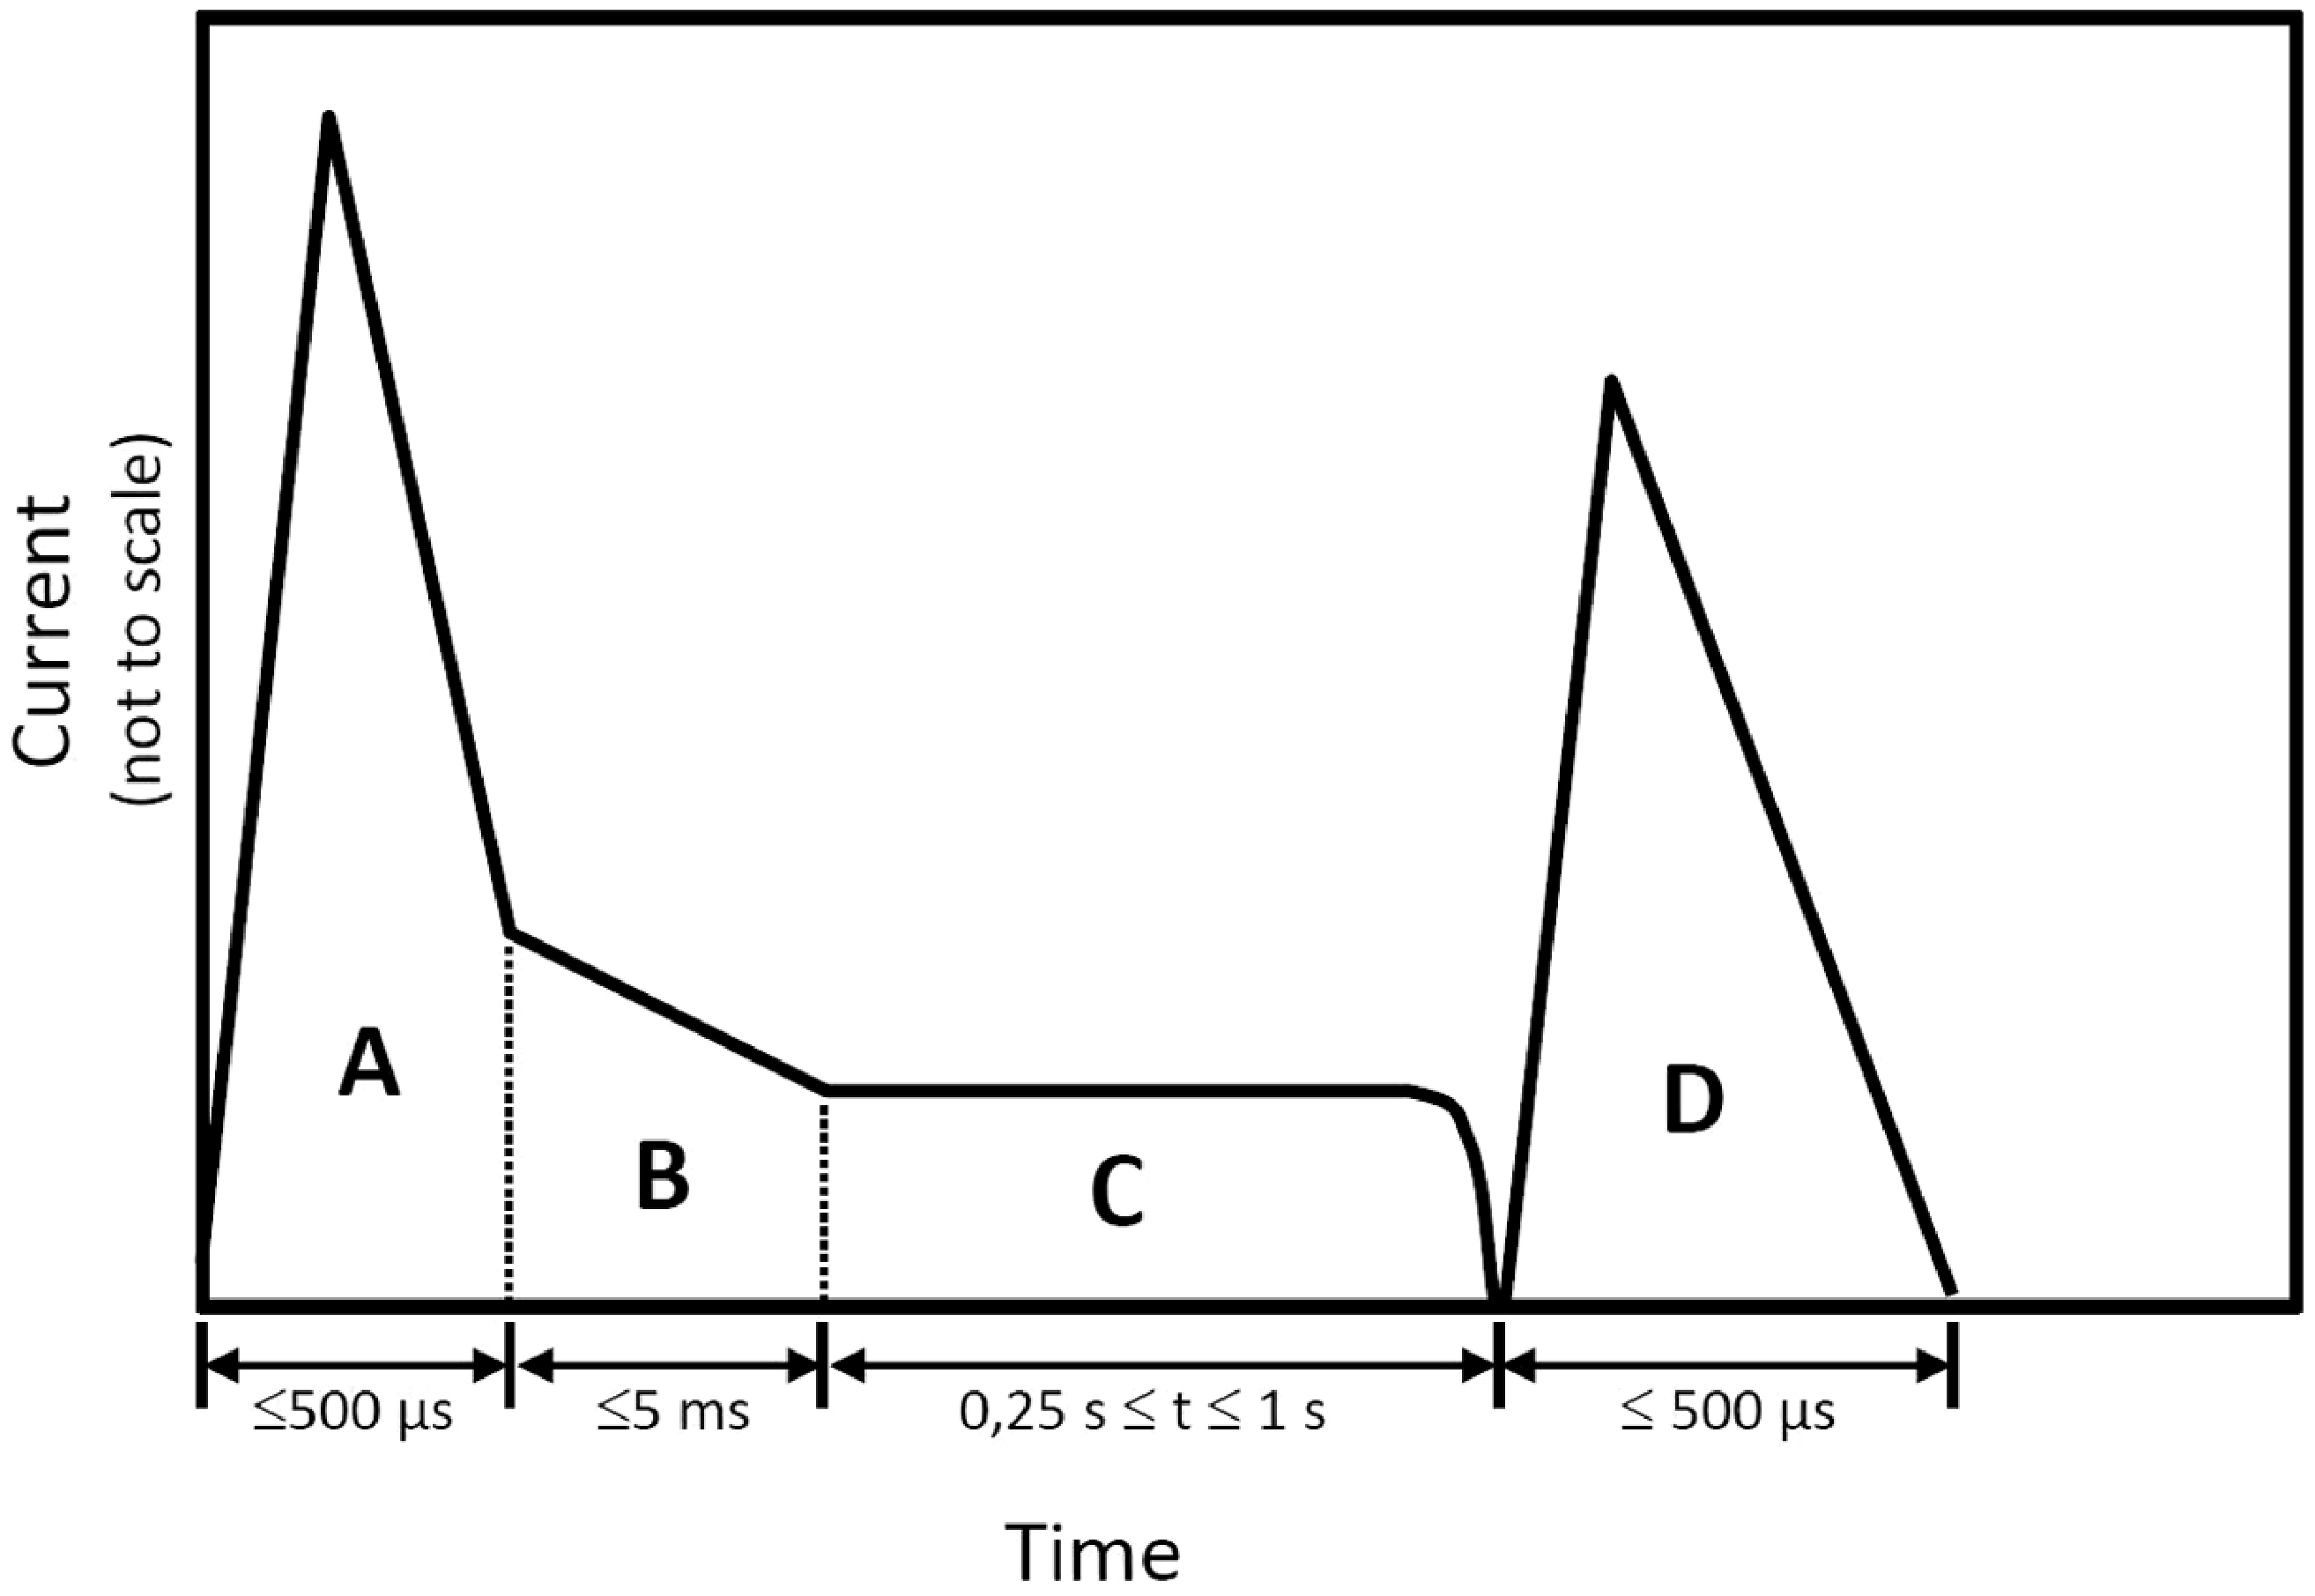


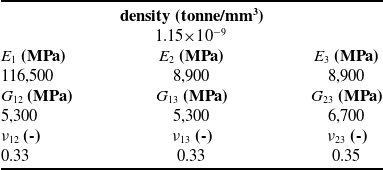

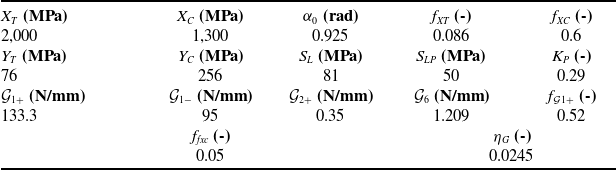

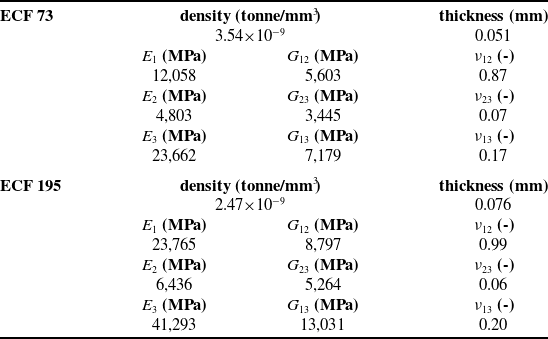
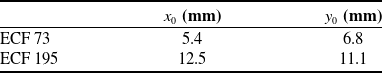


 Open access