


Introduction
Gaseous inclusions in ice cores offer the unique possibility of directly extracting and analysing the atmosphere of the past. Correct interpretation of the results requires a thorough understanding of the processes influencing the air content of the inclusions.
High-resolution gas measurements inside ice cores are of great importance for the accurate reconstruction of palaeoclimatic conditions, which in turn enable more accurate predictions of climate changes. Of special interest are the greenhouse gases (e.g. CH4, CO2), but the more easily measurable N2/O2 ratios may serve as a proxy for their behaviour and distribution (Reference BenderBender, 2002; Reference LüthiLüthi and others, 2010). The dynamics of air inclusions in ice and especially the transition from bubbles to crystalline air hydrates (clathrates) pose a challenge to the interpretation of gas measurements, as recent investigations have shown (Reference LüthiLüthi and others, 2010; Reference Schaefer, Lourantou, Chappellaz, Luthi, Bereiter and BarnolaSchaefer and others, 2011). More detailed data on the general processes affecting mixing ratios in gaseous inclusions are therefore urgently needed.
Two generations of air bubbles can be distinguished in ice sheets. The primary bubbles were formed during accumulation and solidification of snow to ice (including also the microbubbles described by Reference LipenkovLipenkov (2000)). With increasing pressure in the ice these bubbles shrink and the contained gases dissolve in the ice. This process can lead to the complete disappearance of smaller bubbles, which has also been shown in laboratory experiments (e.g. Reference Jones and JohariJones and Johari, 1977). Secondary bubbles are formed after the extraction of the ice core and the related decompression. They are filled with gas which had been dissolved in the ice matrix. Microscopic images of ice samples taken on fresh ice just after extraction of the core and several years later from the same samples illustrate this process (Fig. 1). While the clathrates remain stable, several of the initially visible microinclusions (the so-called black dots (BD)) developed into bubbles or plate-like inclusions (PLI). The PLI have long been of interest to glaciologists, and their formation has been linked to deformation (Reference Muguruma, Mae and HigashiMuguruma and others, 1966; Reference MaeMae, 1968) and also relaxation events (Reference GowGow, 1971; Reference Ram, Donarummo, Stolz and KoenigRam and others, 2000). More recent investigations show that PLI contain gas, mainly O2, which has been interpreted as the effect of the fast diffusion of O2 through the ice matrix (Reference Nedelcu, Faria and KuhsNedelcu and others, 2009). The effect of pressure and relaxation on bubbles has also been investigated. Reference Jones and JohariJones and Johari (1977) observed the shrinking and final disappearance of bubbles under pressure, within and outside the clathrate stability field, i.e. the effect is independent of clathrate formation. After the release of pressure, the bubble reappeared. Shoji and Langway (1983, 1985) showed that relaxation and consecutive growth of bubbles occurs mere hours after pressure release. This might also explain the observations of Reference LipenkovLipenkov (2000) who observed microbubbles in fresh ice down to the bubble-clathrate transition zone.
EDML, 1095 m depth. (a) Freshly drilled core. Various black dots, a large hydrate in the center and a smaller hydrate in the upper left corner. (b) Same sample after 3 years of relaxation. At the locations of some of the black dots, microbubbles (white arrows) or plate-like inclusions (black arrows) have formed. Other black dots apper not to be influenced by relaxation.

Raman spectroscopy has been used before to characterize gases and also to measure liquid and solid inclusions, mainly in petrology (Reference BurkeBurke, 2001, and references therein) but also in ice (Reference Pauer, Kipfstuhl and KuhsPauer and others, 1995; Reference IkedaIkeda and others, 1999; Reference Ikeda-Fukazawa, Hondoh, Fukumura, Fukazawa and MaeIkeda-Fukazawa and others, 2001; Reference BendelBendel, 2009). With the introduction of better instruments and spectrometers, non-destructive in situ measurements of gas-mixing ratios inside individual gaseous inclusions have become possible. To better understand the complex interactions of bubbles and clathrates and the processes of enclathration, we must first understand the general behaviour of gas in ice. This work aims to provide a further step towards advanced understanding of the diffusion process.
Methods
Samples and preparation
The samples were taken from two ice cores drilled at Kohnen station, Dronning Maud Land, East Antarctica (75°00’S, 0°04’ E; 2882 m a.s.l.), within the framework of the European Project for Ice Coring in Antarctica (Reference Oerter, Graf, Meyer and WilhelmsOerter and others, 2004). The EDML core was drilled in six consecutive seasons from 2001 to 2006 and reached 2774 m depth. The shallow core B34 was drilled in 2004 and reached 200 m depth. For details of the drilling method see Reference Wilhelms, Sheldon, Hamann, Kipfstuhl and KuhsWilhelms and others (2007). The cores have since been stored at-30°C at AWI, Bremerhaven.
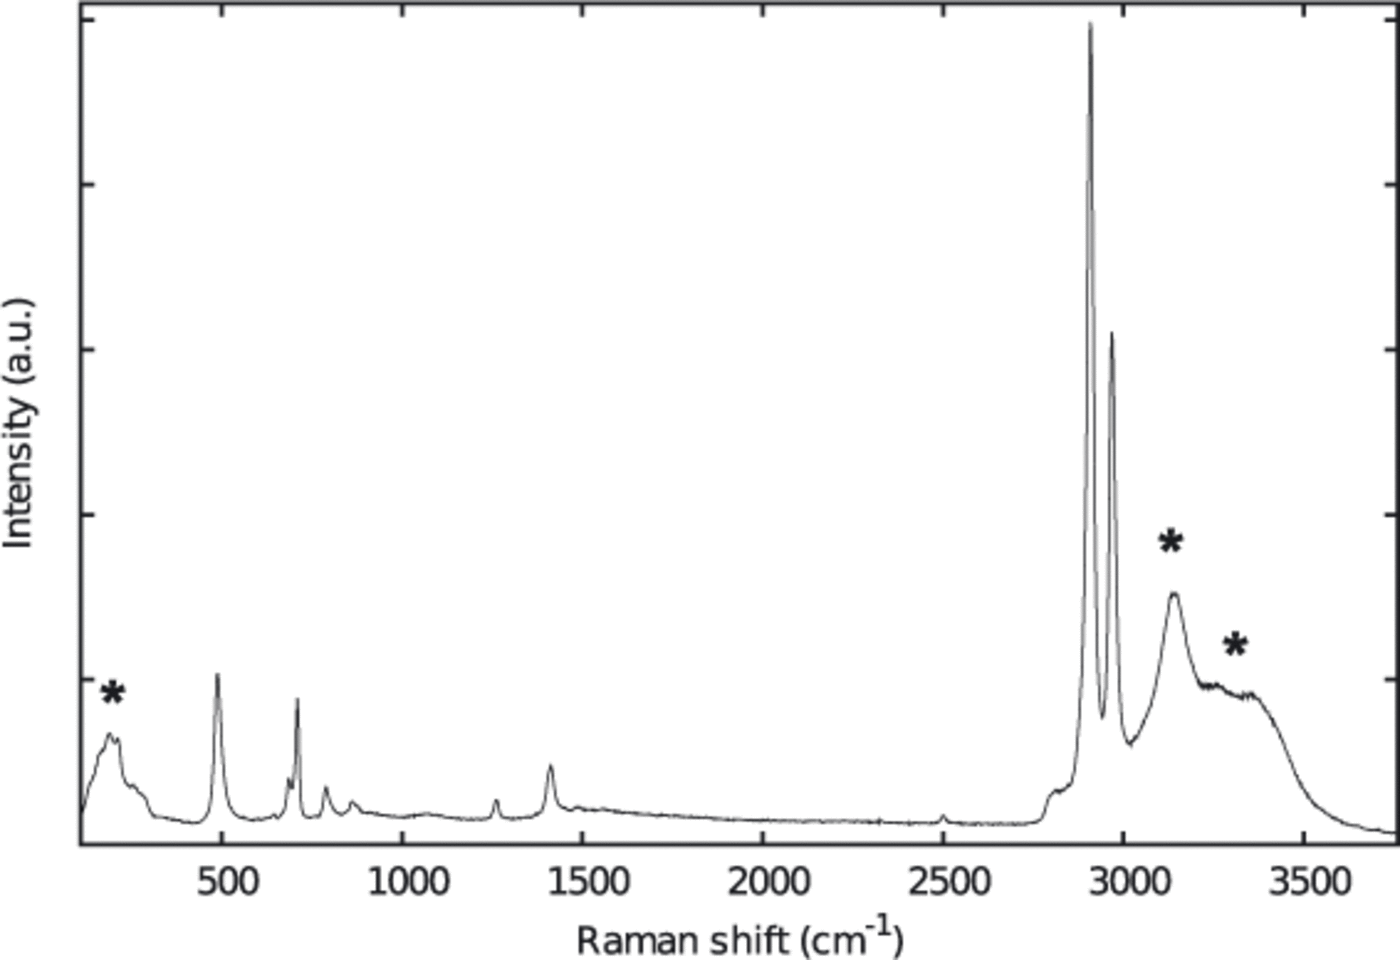
The protocols for sample preparation were very similar to those described by Reference KipfstuhlKipfstuhl and others (2006). The samples were cut with a bandsaw. Top and bottom surfaces were microtomed and afterwards smoothed by sublimation. Clear surfaces are essential for the visual detection of the bubbles as well as for the Raman measurements. The samples were then frozen to standard glass slides. In contrast to the method of Kipfstuhl and co-workers we did not use silicon oil, as it produces a very intense Raman spectrum which may mask the comparably weak bands of the gases, especially when measuring small bubbles (Fig. 2). The sample sizes were approximately 30 x 20 x 10 mm3.
Raman spectrum of an ice sample coated with silicon oil. Raman bands marked with an asterisk belong to the ice matrix (see Fig 3).
Raman spectroscopy
Background
The Raman effect describes the inelastic scattering of light on molecules or molecular groups. When light interacts with the electron clouds of the target, most of it is scattered elastically without any change in energy (Rayleigh scattering). About one in every 108 photons is scattered inelastically, i.e. energy is transferred either from the photon to a vibrational motion of the nuclei (Stokes scattering) or an already active vibration transfers its energy to the photon (anti-Stokes scattering).In the Raman spectrometer the elastically scattered light is filtered out and the frequency-shifted parts are passed to the detector. The resulting spectrum shows the Raman shift relative to the incident laser wavelength, where the values on the abscissa (conventionally given in relative wavenumbers) directly betray the energies of the involved vibrations. These energies are influenced by environmental conditions (e.g. pressure), neighbouring atoms (chemistry) and, in the case of crystalline materials, the short-range order of the crystal structure. The resulting Raman spectrum is unique to the phase of the target and is thus widely used in chemistry, geosciences and other fields as a fingerprinting technique for the identification of phases in gaseous, liquid and solid materials. It is important to have good-quality spectra where many bands can be detected. The identification of phases based on the position of only a single Raman band must remain speculative and should be avoided. After careful calibration, the Raman shift can also be used for pressure measurements (e.g. Reference Gu, Zhou, Tang, Rothe and ReckGu and others, 2000).
To extract the band parameters (peak position, width, height) from the spectrum, suitable functions (usually Voigt or Gauss-Lorentz) are mathematically fitted to the Raman bands. Many commercial as well as free software packages are available for this purpose (e.g. Reference WojdyrWojdyr, 2010). For a reliable interpretation of band parameters, additional data treatment (e.g. smoothing algorithms) must be avoided as they can alter the band parameters and the relative intensities of the bands. It is therefore essential to acquire high- quality spectra from the start. The signal-to-noise ratio can be improved by prolonging the acquisition time and/or acquiring and combining a larger number of spectra for each point. In this paper, all spectra are presented as acquired.
For a more detailed view of this method and the selection rules that make a vibration Raman-active see any of the available textbooks (e.g. Reference Smith and DentSmith and Dent, 2005).
Instrument
We used a WITec alpha 300 R spectrometer with a frequency- doubled NdYAG laser (λ = 532|nm), a grating with 600 grooves mm-1, a Peltier-cooled Electron Multiplying Charge Coupled Device (EMCCD) detector and a long working distance 50 x microscope objective with numerical aperture of 0.35. The instrument was calibrated using the Raman spectrum of a monocrystalline silicon wafer. Acquisition times used varied between 1 and 120 s per spectrum, with five to ten spectra combined for each spot, depending on the signal intensity.
During measurement, the samples were held at -15°C in a specially adapted cooling cell mounted directly to the motorized XY-stage of the spectrometer. The cell was cooled with a LAUDA RC6CP compact low-temperature thermostat and purged with dry cold nitrogen gas to prevent the formation of frost. The purging gas pressure must be chosen carefully so that the sample does not suffer enhanced sublimation. Gas pressures of ~2 bar were found to be sufficient to prevent frost while not being too detrimental to the sample surface. To ascertain the feasibility of purging with nitrogen gas while measuring N2/O2 ratios, abundant measurements of the ice matrix were performed at various depths inside the samples. None of these measurements showed any traces of the N2 Raman bands (Fig. 3 , middle), so we conclude that the purging gas does not influence the measurements. This result enables the use of nitrogen gas for purging which is much cheaper and also more readily available than, for instance, argon or helium.
Raman spectra of (top) room air, (middle) ice matrix and (bottom) bubble in the ice.

Peak fitting and calibration
After subtraction of a polynomial background, Voigt functions were fitted to the Raman bands with the open- source software package FITYK 1.0.1 (Reference WojdyrWojdyr, 2010). Peak intensities of the main vibrational bands (N2 ~2335 cm-1, O2 ~1560 cm-1) were used to calculate the N2/O2 ratios. While the integrated peak areas can also be used and do show the same trends, they were found to have a much larger scatter than the peak intensities. To enable quantification of the mixing ratios, a calibration factor for the instrument response had to be obtained. We therefore conducted several measurements of room air (Fig. 3 , top) on different days and with varying acquisition times. All air measurements were made before setting up the cooling cell, so that the possibility of biases from liquid or gaseous nitrogen used for cooling purposes can be disregarded. The results show good reproducibility and yield a raw ratio of 3.03 ± 0.07 (mean value and standard deviation of all air measurements). Assuming the laboratory air has standard atmospheric composition (i.e. N2/O2=3.73) we adopted a correction factor of 1.23 for the subsequent measurements.
Image analysis
Every measured bubble was photographed with the built- in camera of the Raman spectrometer. The bubble diameters were obtained from these photos with the free image analysis software ImageJ (Reference Abramoff, Magalhaes and RamAbràmoff and others, 2004). In case of aspherical bubbles, the longest possible diameter was used. While the values thus obtained also provide a good estimate of volume for the smaller, well-rounded bubbles, they are certainly less meaningful for the larger and more irregularly shaped objects.
Computer tomography
A representative sample from the transition zone (EDML 914 m) was analysed by computer tomography to obtain information about bubble sizes, shapes and distribution. The instrument used is a full-core tomograph with a Fraunhofer IIS XEye 4000 × 2000 pixel detector, where  (binning 2 x). The focal spot size is 20 |µm.
A Feinfocus 225 kV tube was used as the X-ray source. The measurement settings applied were 140 kV tube voltage and 380 |µA tube current. The method was Helix CT with vertical feed of the ice core during rotation and 3200 measurement steps per degree. The achieved resolution was 28.15 |µm per voxel. The sample used was half the ice core, resulting in a maximum irradiated length of ~10cm. The size and shape of the detected bubbles (n = 14 684) were evaluated. The employed shapefactor f is defined as

where V is the volume and S the surface area of the bubble. For a perfect sphere f = 1, and f = 0.90 for a prolate spheroid with (major axis)/(minor axis) = 2. We define spheric bubbles as those with a shapefactor f between 0.95 and 1.
Results
Raman spectroscopy
Figure 3 shows the Raman spectra of room air, pure ice and a bubble inside the ice. The main Raman bands of the N2 and O2 vibrations are indicated for air and bubble. The peak at ~100 cm-1 has not been described in the literature before. From our current work and also measurements of other gases it is evident that it is caused by some vibrations of N2 and O2.As this peak is very intense it can be used for fast tracking of gaseous inclusions in larger ice volumes. The spectrum of the bubble in ice is a combination of the ice spectrum with the Raman bands of the gases contained in the bubble. The measured bubbles are very small and the measurements were done through several millimeters of ice, so even with a good confocal set-up, the spectra of the bubble will always show bands from lattice and OH vibrations of the ice matrix. Figure 4a shows the N2/O2 ratios of individual bubbles as a function of diameter for a wide selection of depths (454-1023 m), including depths lying inside the bubble-clathrate transition zone. The overall trends are similar at all shown depths.
N2/O2 ratios as a function of bubble diameter for several depths. Solid symbols show depths where only bubbles occur, while open symbols mark depths inside the bubble–clathrate transition zone. The dashed line represents the recent atmospheric value of 3.73. (a) Bubbles with diameters less than 200μm are enriched in O2, with N2/O2 ratios down to 0 (only O2) and the majority less than 2. (b) In shallow ice no small bubbles fall below 1.6 and the majority have ratios above 3. The scatter is larger than for deeper ice.

The larger bubbles (diameter >200 |µm) show a rather size-independent distribution of gas-mixing ratios. For the depths above the bubble-clathrate transition, all values scatter around the recent atmospheric ratio of 3.7. The larger bubbles inside the transition zone have distinctly higher ratios than bubbles at other depths, i.e. they are oxygen- depleted, as has been shown by Reference IkedaIkeda and others (1999). Mixing ratios of the smaller bubbles (diameter <200 µm) change as a function of the diameter, with the smallest bubbles exhibiting the lowest N2/O2 ratios (the highest relative O2 contents). In the bubble-clathrate transition zone, no bubbles were found in the diameter range from ~120 to ~200 µm, resulting in a more-or-less bimodal distribution for the overall bubble sizes. It is important to note that all small bubbles (occasional outliers excepted) have ratios well below 3, with the vast majority of ratios lying in the range below 2. A considerable number of the smaller bubbles display ratios below 1, meaning that these bubbles containmore oxygen than nitrogen. Some bubbles even show ratios at or very close to zero, i.e. they only contain oxygen and no nitrogen.
For reference purposes we also analysed a depth close to the firn–ice transition (B34 157 m). The ice at this depth has not encountered high pressures in situ, and therefore should not show effects produced by extended relaxation and related changes in structure and microstructure. The results of the measurements are shown in Figure 4b, which is shown on the same scale as Figure 4a. The larger bubbles also appear to be scattered around the atmospheric value, although the deviation from this value is much larger than at the other depths. For the smaller bubbles, the measured ratios differ distinctly from the results shown in Figure 4a. Most of the smaller bubbles at B34 157m exhibit ratios well above 3, with maximum values exceeding 4. Even for the smallest bubbles, none of the measured ratios falls below 1.5, so no bubble at this depth contains more oxygen than nitrogen. Furthermore, a functional dependency of the mixing ratio son bubble sizes cannot be seen at this depth.
Computer tomography
Computer tomographic analysis of a very large number of bubbles (n = 14 684) inside the transition zone clearly shows that the smaller bubbles are distinctly more round than the larger bubbles (Fig. 5). This is in agreement with the results presented by Reference LipenkovLipenkov (2000). The diameter for the maximum of the spherical bubbles is around 150-200 |am whereas the maximum for the aspherical and elongated bubbles is around 250-300 µm.
Percentage of size distribution of spherical (f >0.95) and aspherical bubbles (f <0.95) in EDML (914m) as a functionof diameter (shown as equivalent diameter of a sphere of same volume). The absolute number of bubbles is n= 14 684. For a detailed explanation of f see text.

Discussion
The N2/O2 mixing ratios in air bubbles from deep ice cores differ systematically in bubbles of different sizes. The large bubbles (diameters above ~200 µm) have ratios that scatter around the atmospheric value, with absolute values varying with depth. Small bubbles (diameters less than ~200 µm) have very low N2/O2 ratios, i.e. they are enriched in oxygen. Furthermore, the small bubbles show a size-dependent distribution of mixing ratios, with the lowest values (highest oxygen contents) in the smallest bubbles. In shallower ice, just below the bubble close-off (firn-ice transition), all bubbles scatter approximately around the atmospheric value, without obvious functional dependence on the bubble size. The variability of ratios betweeen different bubbles and microbubbles is rather larger than in deeper ice (Fig. 4b). All bubbles measured at this depth are from the same layer (cm thick), so climatic effects can be ruled out as the cause. N2/O2 variabilities in shallow depths have been described as fractionation effects before or during pore close- off (e.g. Reference EntingEnting, 1985; Reference HuberHuber and others, 2006; Reference Severinghaus and BattleSeveringhaus and Battle, 2006; Reference Fujita, Okuyama, Hori and HondohFujita and others, 2009). However, the variations we have measured even between neighbouring bubbles are larger by far than the fractionation-dependent variations proposed in the literature. The small bubbles less than ~200 µm in diameter behave very differently from bubbles in deeper ice. Most of them show N2/O2 ratios greater than 3, while none of them have ratios less than 1.5, both of which have not been found in deeper ice.
After the bubbles have formed they are submitted to gradually rising hydrostatic pressures in the thickening ice sheet. When the pressure in the bubbles exceeds the equilibrium pressure, gas molecules are dissolved as solid solutions in the ice matrix and small bubbles will eventually vanish completely. Given the higher curvature of the small bubbles, a higher pressure and a diffusion from small to large bubbles should be expected. Due to the higher diffusion constant and flux of O2 compared to N2 (Reference Ikeda-FukazawaIkeda-Fukazawa and others, 2005; Reference HondohHondoh, 2009), this would result in the small bubbles being depleted of oxygen, i.e. their N2/O2 ratios would be higher than for larger bubbles. This cannot be seen in our data, so other processes must be considered. When the pressure is released at excavation of the core, the gases dissolved in the ice matrix become supersaturated and start to form gaseous micro-inclusions. The type of the newly forming inclusion is dependent on the local microstructure of the ice matrix: bubbles grow at the location of solid microinclusions, whereas areas of accumulated crystal defects may evolve into plate-like inclusions. Due to the differences in diffusion rates, growing secondary inclusions are initially filled with oxygen and will therefore always exhibit much lower N2/O2 ratios than other bubbles. This is in excellent agreement with our data. The shrinking and vanishing of small bubbles with pressure and their reappearance after pressure release have been observed experimentally by Reference Jones and JohariJones and Johari (1977), and our results confirm their conclusions. Further evidence for a secondary growth of the small bubbles can be found by evaluating their shape. Younger bubbles should be more rounded than older bubbles, as they have not been influenced by deformation and flow of the ice. Our computer tomographic measurements show a clear correlation of the bubble size with shape, with the spherical bubbles being significantly smaller than the aspherical bubbles. The maximum of the spherical bubbles is ~200 |µm, which is in good agreement with the results from Raman spectroscopy.
As microbubbles in all regimes (i.e. with and without directly neighbouring bubbles and/or clathrates) show similar behaviour, it is likely that the gas comes directly from the ice matrix and not via diffusion from other gaseous inclusions.
The higher N2/O2 ratios in bubbles from the transition zone agree well with the predictions of Reference Salamatin, Lipenkov, Hondoh and IkedaSalamatin and others (1999) and the data of Reference IkedaIkeda and others (1999). The relative enrichment in O2 is believed to stem from the faster diffusion of oxygen to the newly forming clathrates (Reference Ikeda-Fukazawa, Hondoh, Fukumura, Fukazawa and MaeIkeda-Fukazawa and others, 2001).
Why microbubbles start to grow only on some of the initially visible micro-inclusions will be a topic of further research. It may be related to the varying chemistry of solid micro-inclusions which has been verified by Raman spectroscopy (e.g. Reference Ohno, Igarashi and HondohOhno and others, 2006; Reference SakuraiSakurai and others, 2009, Reference Sakurai, Ohno, Horikawa, Iizuka, Uchida and Hondoh2010, and references therein).
Conclusion
The small round bubbles enriched in O2 constitute a second generation of air bubbles which have grown due to pressure release and relaxation of the ice cores during storage. Our results agree well with the experimental findings by Reference Jones and JohariJones and Johari (1977). A proposed diffusion of gases from small to large bubbles that would result in higher N2/O2 ratios in the microbubbles cannot be seen in our data. Yet this process could be masked by the more intense relaxation effects.
Based on the results presented here, more systematic investigations will follow to further clarify the interrelations between pressure relaxation, ice microstructure and the growth of secondary gaseous inclusions. Ourongoing studies will focus on the bubble-clathrate transition zone, clarifying the fractionation effects during the growth of clathrate hydrates. Measurements of different layers in the shallow cores and Raman spectroscopic pressure measurements inside individual bubbles will provide more information on fractionation effects during pore close-off. Conventional gas measurements require larger volumes of ice, so the significant variations between neighbouring bubbles in the shallow core are smoothed out. Enhanced theories about fractionation during pore close-off are needed to explain our data.
Acknowledgements
We thank G. Nehrke and E. Dunker for planning and construction of the cooling cell, and two anonymous reviewers for constructive remarks. This work was funded by German Research Foundation (DFG) grant WE4771/1.



