


Introduction
The Cooperative Extension Service provides nonformal educational and advisory services from land-grant institutions (LGIs) to farmers, youth, and rural and nonrural households and communities. This service was created in 1914 when President Woodrow Wilson signed the Smith-Lever Act “extending” the teaching and research missions of LGIs “[i]n order to aid in diffusing among the people of the United States useful and practical information on subjects relating to agriculture (…)” (Section 1, 7 U.S.C. 341). And while the Extension has evolved over its 110+ years of history, its mission largely remains the same – “bringing cutting-edge discoveries from research laboratories to those who can put knowledge into practice” (USDA/NIFA 2025a). Extension program scope has expanded, and it currently includes agricultural production, human nutrition, family & consumer sciences, youth development, and environmental systems issues (USDA/NIFA 2025b, 2025c).
The justification for public funding of research and extension is based on their public-good nature, as many of the benefits they generate cannot be captured through market transactions, leading to underinvestment by private actors (Anderson and Feder Reference Anderson and Feder2007; Bennett Reference Bennett1996; Hanson and Just Reference Hanson and Just2001; Hoag Reference Hoag2005; Kalambokidis Reference Kalambokidis2004). Extension often provides information with public goods characteristics, such as fertilizer or soil conservation recommendations. Furthermore, common pool resource management, like groundwater use, and emergency responses, like agricultural pest epidemics, require coordination and are best addressed by cooperative institutions. Finally, markets often fail to address social concerns, including human rights or fairness. For instance, Extension programs can ensure equal access to information for low-income producers and remote communities.
Studies have shown that Extension programs have been effective in advancing societal priorities. Extension increased farmer adoption of new technology and accelerated productivity growth in agriculture (Alston et al. Reference Alston, Andersen, James and Pardey2011; Wang et al. Reference Wang, Ball, Fulginiti, Plastina, Fuglie, Wang and Ball2012; Yee et al. Reference Yee, Huffman, Ahearn, Newton, Ball and Norton2002; Jin and Huffman Reference Huffman2016). Extension programs have also been linked with increased profitability of low-income producers (Akobundu et al. Reference Akobundu, Alwang, Essel, Norton and Tegene2004), improved likelihood of farm business survival (Goetz and Davlasheridze Reference Goetz and Davlasheridze2017), avoided losses due to plant disease prevention (Cembali et al. Reference Cembali, Folwell, Wandschneider, Eastwell and Howell2003; Fuchs et al. Reference Fuchs, Almeyda, Al Rwahnih, Atallah, Cieniewicz, Farrar, Foote, Golino, Gómez, Harper, Kelly, Martin, Martinson, Osman, Park, Scharlau, Smith, Tzanetakis, Vidalakis and Welliver2021; Fuller et al. Reference Fuller, McIntosh and Zidack2020), and increased natural resource conservation (Goodhue et al. Reference Goodhue, Klonsky and Mohapatra2010; Rahelizatovo and Gillespie Reference Rahelizatovo and Gillespie2004; Baumgart-Getz et al. Reference Baumgart-Getz, Prokopy and Floress2012; Schulz & Börner Reference Schulz and Börner2023). Beyond agriculture, Extension programs have been shown to improve nutrition outcomes in communities (Atoloye et al. Reference Atoloye, Savoie-Roskos, Guenther and Durward2021; Rivera et al. Reference Rivera, Dunne, Maulding, Wang, Savaiano, Nickols-Richardson and Eicher-Miller2018), enhance youth development (Agans et al. Reference Agans, Maley, Rainone, Cope, Turner, Eckenrode and Pillemer2020), and support other public priorities (e.g., Hatch et al. Reference Hatch, Burkhart-Kriesel and Sherin2018; Hill et al. Reference Hill, Ali, Narine, Spielmaker and Schmutz2020; Sherin and Burkhart-Kriesel Reference Sherin and Burkhart-Kriesel2018; White and Ondo Reference White and Ondo2020). At the same time, the century-old Extension Service has continued to evolve, responding to the agricultural commercialization, a decline in the number of producers, rising private investments in agricultural research and technology transfer, reductions in public funding, and advances in information and communication technologies (Al-Kaisi et al. Reference Al-Kaisi, Elmore, Miller and Kwaw-Mensah2015; Anderson et al. Reference Anderson, Malone and Akridge2024; King 2018; Norton and Alwang Reference Norton and Alwang2020; Perry et al. Reference Perry, Malone and Akridge2026).
Despite the long history of Extension and its evolution over time, the data on Extension resources has been sparce: no national figures on Cooperative Extension funding or staffing levels are available since 2010. Earlier studies showed that the total annual funding for Cooperative Extension grew steadily over the course of the 20th century until the early 1970s when it plateaued at $3.0–$3.3 billion (in 2020 dollars) and remained at about that level until 2005 (Alston et al. Reference Alston, Andersen, James and Pardey2010). Wang (Reference Wang2014) found that Extension staffing levels, measured in full-time equivalents (FTEs) declined from 17,009 in 1980 to 13,294 in 2010.
At the Federal level, the USDA National Institute for Food and Agriculture (NIFA) provides funding for Cooperative Extension programs conducted by LGIs.Footnote 1 States and Counties also provide funding to support Extension programs. Past studies have shown that since the 1950s, State and local governments have provided most of the funding for Cooperative Extension, while the Federal share of funding has declined over time (Ahearn et al. Reference Ahearn, Yee and Bottum2003; Wang Reference Wang2014). Fluctuations in funding support and changes in demand for Extension services led some States to restructure or reduce their Extension activities, particularly at the county level (Wang Reference Wang2014). At the same time that total Extension FTEs were declining, priorities were also shifting. Ahearn et al. (Reference Ahearn, Yee and Bottum2003) found that the number of FTE Extension personnel decreased by 12% between 1977 and 1997, with community resource development and youth education programs declining the most.
This study reviews and updates information on long-term trends in Extension funding, staffing and resource allocation across program areas at the national and regional levels. First, we extend the historical analysis of Extension staffing levels presented in Ahearn et al. (Reference Ahearn, Yee and Bottum2003) and Wang (Reference Wang2014) through 2024. As the data sources used by these earlier studies were discontinued, we identified new sources of information, and below, we discuss differences and potential biases in using various data sources on Extension staffing. Our estimates include Extension activities in all 1862, 1890, and 1994 LGIs in the 50 States and insular territories.Footnote 2 Second, we derive estimates of Extension funding, using total staffing levels, as well as price indices that are likely to reflect the changes in the cost of delivering Extension services. Finally, we compare total Extension spending to USDA formula and non-formula funding for Extension activities to determine trends in the Federal share of Extension funding at the nation’s LGIs.
Data and methods
Professional Extension staff estimates
Cooperative Extension is a State-led program performed by LGIs. The funding model for Cooperative Extension involves contributions from Federal, State, and local government appropriations, nongovernment grants or gifts, user fees, and other sources. These revenues may be in the form of unrestricted institutional support or restricted funding for specific projects. Unrestricted funding provides LGIs with broad discretion in determining the use of funds. For example, the federal government, through NIFA, allocates capacity funding to LGIs to support research and extension activities, with funds distributed among States according to a statutory formula (USDA/NIFA 2025e). In contrast, restricted funding is awarded for a specified period and for clearly defined activities or programs. Competitive grants, for instance, are allocated by federal and other sponsors to designated priority areas and awarded to specific institutions for a limited duration based on peer review of submitted proposals (see examples in Bickell Reference Bickell2024; also, see USDA/NIFA 2025e). Although both funding mechanisms support programs that address USDA priorities, capacity (unrestricted) funding historically had a higher share of projects related to agricultural production (like animal and plant health, production, and products). In contrast, competitive (nonformula) funding had more projects focused on food safety, nutrition and health, agricultural systems and technology, and agricultural economics and rural communities (TEConomy Partners LLC 2017).
States are required to match unrestricted capacity grants provided by the federal Government with funds from non-Federal sources. Recipient LGIs are required to report to the federal agency on the use of both the Federal and matching funds. Over time, the reporting requirements evolved, driven by the new legislation, changes in the lead federal agency, and improvements in information technology. The changes were likely aimed at streamlining the reporting processes, improving transparency, and increasing accountability. However, new reporting guidelines also created inconsistencies among reporting periods and databases.Footnote 3
For this study, State-level estimates of professional Extension staffFootnote 4 in FTE person-years are taken from “Salary Analyses for Cooperative Extension Service Positions,” annual reports that were prepared by the Human Resources Division of the USDA Agricultural Research Service (ARS) from 1975 through 2010. These reports were used by Wang (Reference Wang2014) to examine national and regional trends in Extension FTEs during 1980–2010. These annual Salary Analysis reports give the number of professional FTEs employed at each 1862 and 1890 LGI receiving Smith-Lever formula funds for Extension and provide a breakdown of FTEs by type of position (e.g., program administrators, State or area specialists, and County agents) and educational level. However, these reports were discontinued after 2010.
For 2010–2024, estimates of Extension FTEs are based primarily on the annual reports submitted by each State to the USDA NIFA as required by the 1998 Agricultural Research, Extension, and Education Reform Act (AREERA).Footnote 5 The Plans of Work provide 5-year projections of planned FTEs, while the Accomplishments and Results reports give actual FTEs employed in the calendar year for which the report is submitted (actual FTEs are no longer reported after 2018). We use actual FTE data from these Reports of Accomplishments through 2018, and planned FTEs for 2019–2024. To fill in some missing data, AREERA data are supplemented with data from the NIFA Research, Education, and Economics Information System (REEIS) “State Snapshots Data Mart” online database.Footnote 6 In a few cases, we contacted Extension leaders at LGIs for additional information on Extension staffing and funding in their State.
For a few years, the ARS Salary Reports, the NIFA AREERA reports, and the NIFA REEIS database overlap so checks for consistency across them are possible. Comparing these overlapping years, it is apparent that REEIS State Snapshots mostly includes information for Extension funded from unrestricted funding (Federal formula funds and State government matching appropriations), but may not include positions funded through project funds, such as Federal competitive grants, and other contributions from State and local governments, grants from nongovernment sources, and user fees. The AREERA reports, on the other hand, appear to give a more complete account of FTEs managed by the LGIs.
We also estimate Extension resources serving tribal communities. Congress began funding the Federally-Recognized Tribes Extension Program (FRTEP) in 1991. While all 1862, 1890, and 1994 LGIs are eligible to apply for FRTEP grants, most are carried out by 1862 LGIs. In 1997 Congress began appropriating funds for the Tribal Colleges Extension Program, which are exclusively for the 35 tribal colleges and universities that are designated as 1994 LGIs. The Federal government provides virtually all of the funding for these programs, with little or no supplementary funding from non-Federal sources (Hiller Reference Hiller2005; Indian Country Extension Commission 2024).
For each Tribal Colleges Extension Program grant awarded by NIFA, each grant recipient reports to NIFA on the use of funds and, since 2014, the number of FTEs employed (administrative, profession educators, scientists, and technical support staff). We define Extension FTEs as the number of professional educators and scientists and sum over all active projects in a given year to get total annual Extension FTEs at the 1994 LGIs. For years prior to 2014, we estimate the number of professional FTEs from annual Extension spending by these projects, assuming $150,000 per FTE in 2020 dollars (the average spending per FTE observed for 2020, which includes salary and benefits). To account for inflation in Extension salaries and other costs, we adjust annual expenditure per FTE by the Biomedical Research and Development Price Index (BRDPI) for life sciences research costs.
For FRTEP, the Indian Country Extension Commission (2024) estimated the number of FTEs by assuming one professional FTE per active project, and we follow this example. In 2020, there were 33 active FRTEP projects supported by $3.2 million in Federal funds, for an average of $97,000 per FTE.
Extension personnel allocation across program areas
To examine changes in Extension personnel allocation across program areas, averages in 1977–1992 (from Ahearn et al. Reference Ahearn, Yee and Bottum2003) are compared with program allocation during 2007–2018 from REEIS (the AREERA reports do not use a comparable program classification for FTEs). Ahearn et al. (Reference Ahearn, Yee and Bottum2003) used States’ plans of work to examine Extension program priorities in 1977–1992. REEIS breaks down FTE and funding by program areas and goals, though not all the program categories are the same as those used by Ahearn et al. (Reference Ahearn, Yee and Bottum2003). However, both sources break out the share of Extension resources allocated to two consistently defined categories: agricultural and natural resources (combined) and youth activities (4-H programs).
Extension expenditures
Huffman and Evenson (Reference Huffman and Evenson2006, Table A4.3, pp. 148–149) and Alston and Pardey (Reference Alston and Pardey1996, T2-Ag, pp. 89–92) published estimates of total annual Extension spending in the 48 contiguous states over 1915 to 1994 from data compiled by Fred Woods, a former head of the USDA Cooperative Extension Service. Alston et al. (Reference Alston, Andersen, James and Pardey2010, Appendix Table 6.1, pp. 177–181) also estimates expenditures for Extension in the 48 contiguous states for 1915–2005, citing unpublished USDA sources and interpolation for missing data for years 1980–2005. Extension funding by State for 2006–2018 is reported in the NIFA REEIS “State Snapshots Data Mart” online database, but these data mainly include unrestricted Federal and State funding and may exclude many project-base sources of funds (more on this in the Results section).
We derive estimates for Extension spending over 1995–2024 for each LGI in the 50 States and insular territories based on (1) the count of annual professional FTE staff at each LGI from sources described above, and (2) estimates of average spending per FTE in each State. We first estimate spending per Extension FTE in each State over 1975–1994 by dividing total Extension expenditures in a state by FTEs. Extension expenditures are from unpublished data compiled by Fred Woods, former head of the USDA Cooperative Extension Service; this expenditure series runs from 1944 to 1994. Next, we use the BRDPI published by National Institutes of Health (2024) to convert spending per Extension FTE to constant 2020 dollars. The BRDPI represents inflation in the cost of life sciences R&D inputs (it is heavily influenced by changes in university faculty salaries). Between 1950 and 2024, the BRDPI rose by an average of 4.50% annually, compared with 3.84% by the consumer price index (CPI). In constant 2020 dollars, over 1975–1994 the national average spending per FTE was quite stable at close to $200,000. Differences among States were larger, ranging from a low of $146,000 in West Virginia to a high of $393,000 in Alaska, though were generally stable within States over these years. We took the 1990–1994 average dollars per FTE (constant 2020 prices) and multiplied this by the number of Extension FTE at each 1862 and 1890 LGI to get total expenditures on Extension at these institutions.Footnote 7
For Extension programs serving tribal communities, we assumed that the Federal government was the sole source of funding for FRTEP and the Tribal Colleges Extension Program. FRTEP annual expenditures in 1991–2005 are reported in Indian Country Extension Commission (2024) and figures for 2006–2024 are taken from USDA Budget Summary and Annual Performance Plan (and Explanatory Notes for NIFA). Spending by the Tribal Colleges Extension Program for 1997–2005 are from USDA/NIFA (2015) and for 2006–2024 from USDA Budget Summary and Annual Performance Plan (and Explanatory Notes for NIFA).
Resources for Cooperative Extension
Funding trends for Cooperative Extension
After the passage of the Smith-Lever Act in 1914, resources for Cooperative Extension rose rapidly until the 1970s, when total national funding plateaued (in constant 2020 dollars) at around $3.0–3.4 billion (Figure 1). After 2008–2009, annual funding for Extension activities declined to around $2.8–2.9 billion. Funding for Extension also shifted increasingly to non-Federal sources. USDA funding for Extension (in constant 2020 dollars) peaked in 1973 at $1303 million, and by 2024 had fallen to $498 million. The Federal share of total Extension funding declined from 42.4% in 1973 to 17.7% in 2024. In 2024, 69% of NIFA funding for Extension was through formula funds (Smith-Lever sections 3b and 3c) and the rest through competitive or special grants (Smith-Lever section 3d and other programs) (based on USDA Budget Tables).
Total estimated national funding for cooperative extension from 1915 to 2024. Note: Total national extension funding is the sum of extension expenditures by all 50 states, the District of Columbia, and insular territories, by 1862, 1890, and 1994 land-grant institutions (LGIs). Sources: Total and Federal Extension spending for 1915–1994 are from Fred Woods (USDA-NIFA, retired), as reported in Alston and Pardey (Reference Alston and Pardey1996). Post-1994 Extension expenditures are estimated by the authors based on the number of Extension FTE employed in each LGI, assuming spending per FTE in each state rose at a nominal rate given by the Biomedical Research and Development Price Index (NIH 2024). R&D expenditures for 1915–1969 are from Huffman and Evenson (Reference Huffman and Evenson2006) and for 1970–2021 are from USDA, Economic Research Service (2025). Nominal spending has been adjusted for inflation by the BRDPI. The BRDPI is available for 1950–2024; to adjust nominal expenditures for years 1915–1950, we use the agricultural research and development price index in Huffman and Evenson (Reference Huffman and Evenson2006, pp. 105–107).
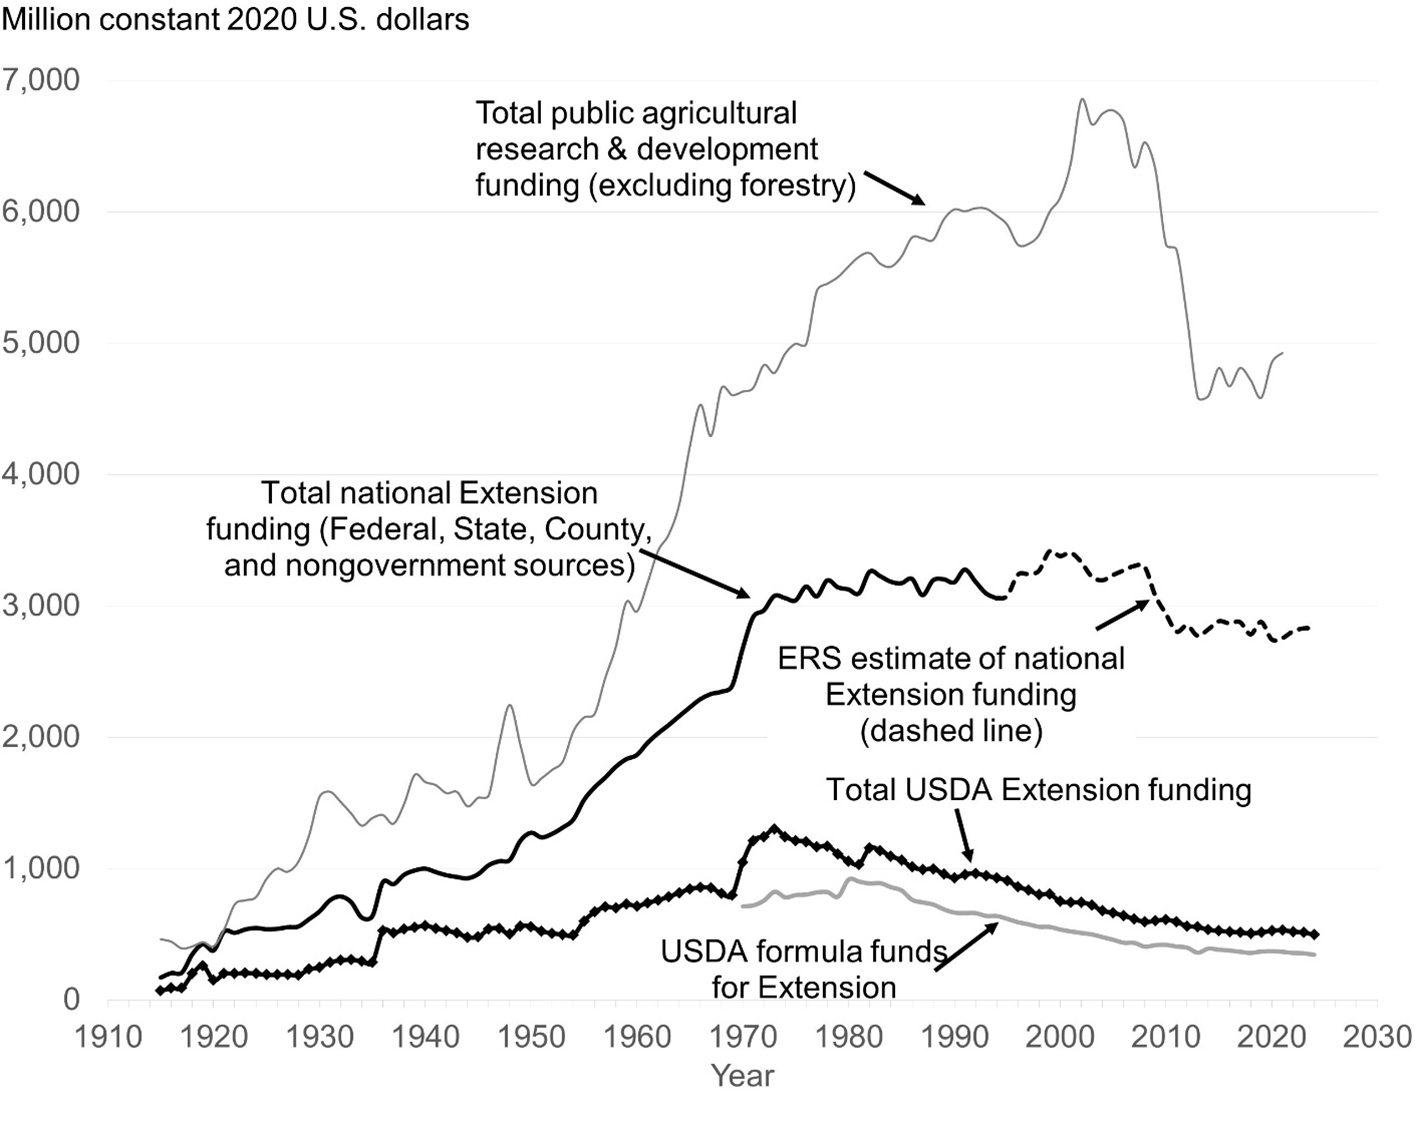
For comparative purposes, Figure 1 also shows trends in public investment in agricultural research and development (R&D) over the same period. In the 1950s, public spending on agricultural R&D began to outpace growth in Extension spending, continued to grow rapidly through the end of the 20th Century, even after Extension spending stagnated in the 1970s. Public agricultural R&D, however, underwent a major retrenchment after 2007–2008. About 70% of public agricultural R&D in the United States is funded by the Federal government (Nelson and Fuglie Reference Nelson and Fuglie2022), compared to under 20% for Extension.
One possible explanation for the declining share of Federal support for Extension is that Extension generates primarily local public goods and services. For example, for agricultural research at State LGIs, studies have found large knowledge and technology spillovers that cross State boundaries and extend into discoveries in both public and private sectors. These spillovers justify federal investments in research as a form of “public good” provision (Alston et al. Reference Alston, Andersen, James and Pardey2010; Huffman Reference Huffman2016; Huffman and Evenson 2006; Wang et al. Reference Wang, Ball, Fulginiti, Plastina, Fuglie, Wang and Ball2012). In contrast, Extension programs are generally tailored to the needs and circumstances of each state. Cross-state spillover effects are assumed to be minimal (Huffman Reference Huffman2016) and are often linked to improvements in Extension educational methods or response infrastructure. State and local taxpayers may be more willing to fund public services that principally benefit them (like Extension programs) but have incentives to underfund services that generate large benefits outside their community or state, for example, new knowledge.
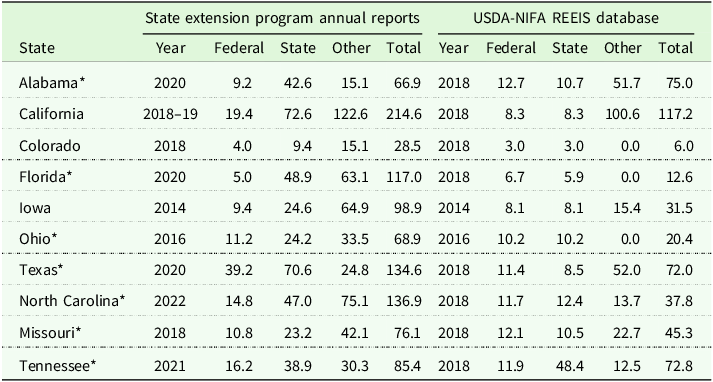
The estimate of national total Extension in Figure 1 was compiled from several sources whose quality and completeness may vary over time. Through 1994, the USDA Cooperative Extension Service compiled fairly complete information on Extension funding from Federal, State, County, and nongovernment sources for each State. Since then, USDA reporting requirements have changed. Under NIFA’s reporting guidelines, since 2006 States were only required to report on their use of Federal funds and State matching grants. While most States reported expenditures in excess of the matching requirements, for many States this fell far short of total Federal, State, County, and nongovernment sources of funding used to support Extension activities. This can be seen by comparing USDA NIFA REEIS “State Snapshots Data Mart” data and annual reports from LGI Extension programs. Table 1 illustrates this for several States. With a few exceptions, the Extension expenditure reported by NIFA REEIS corresponds to unrestricted Federal and State funding and excludes most project grant funding and other sources of funding.Footnote 8 NIFA collects project-level data for USDA grant funded projects and makes these data available as a part of their Data Gateway and Leadership Management Dashboard (not shown in Table 1), but these data still exclude portion of the funding provided by the States, as well as other sources of funding, such as fee-based programs, gifts, and local (county) project funding. Because of its narrow focus, NIFA REEIS data may exclude funding for selected permanent and project-based Extension programs and positions.
Cooperative Extension funding: comparison of data from the states’ financial reports and NIFA’s Research, Education, and Economics Information System (REEIS) “State Snapshots Data Mart”

Figures are in millions of U.S. dollars. Sources: State Annual Reports are from Swanson et al. (Reference Swanson, Nielson, Steele and Woteki2022), North Carolina State University Extension (2022); University of Missouri Extension (2017); and University of Tennessee (2022). The last year of USDA-NIFA REEIS database is 2018. The total may not equal the sum due to rounding.
* These states have both 1862 and 1890 Land-grant university Extension; the USDA-NIFA REEIS database includes funding of both 1862 and 1890 land-grant institutions. The State Extension Program Annual Reports data are only from the 1862 land-grant institution in that state.
The state Extension funding totals in Table 1 also provide a means of comparing Extension spending estimates derived from FTE counts using the BRDPI or CPI to adjust for changes in nominal spending per FTE over time. The estimate of Extension spending derived using the BRDPI came to 94% of the actual spending for these 10 States, compared with only 78% of actual spending when using the CPI. For these States, even the BRDPI appears to have underestimated the growth in Extension spending, although it gave a substantially closer estimate than when Extension spending per FTE was adjusted by the CPI.
Cooperative Extension personnel trends
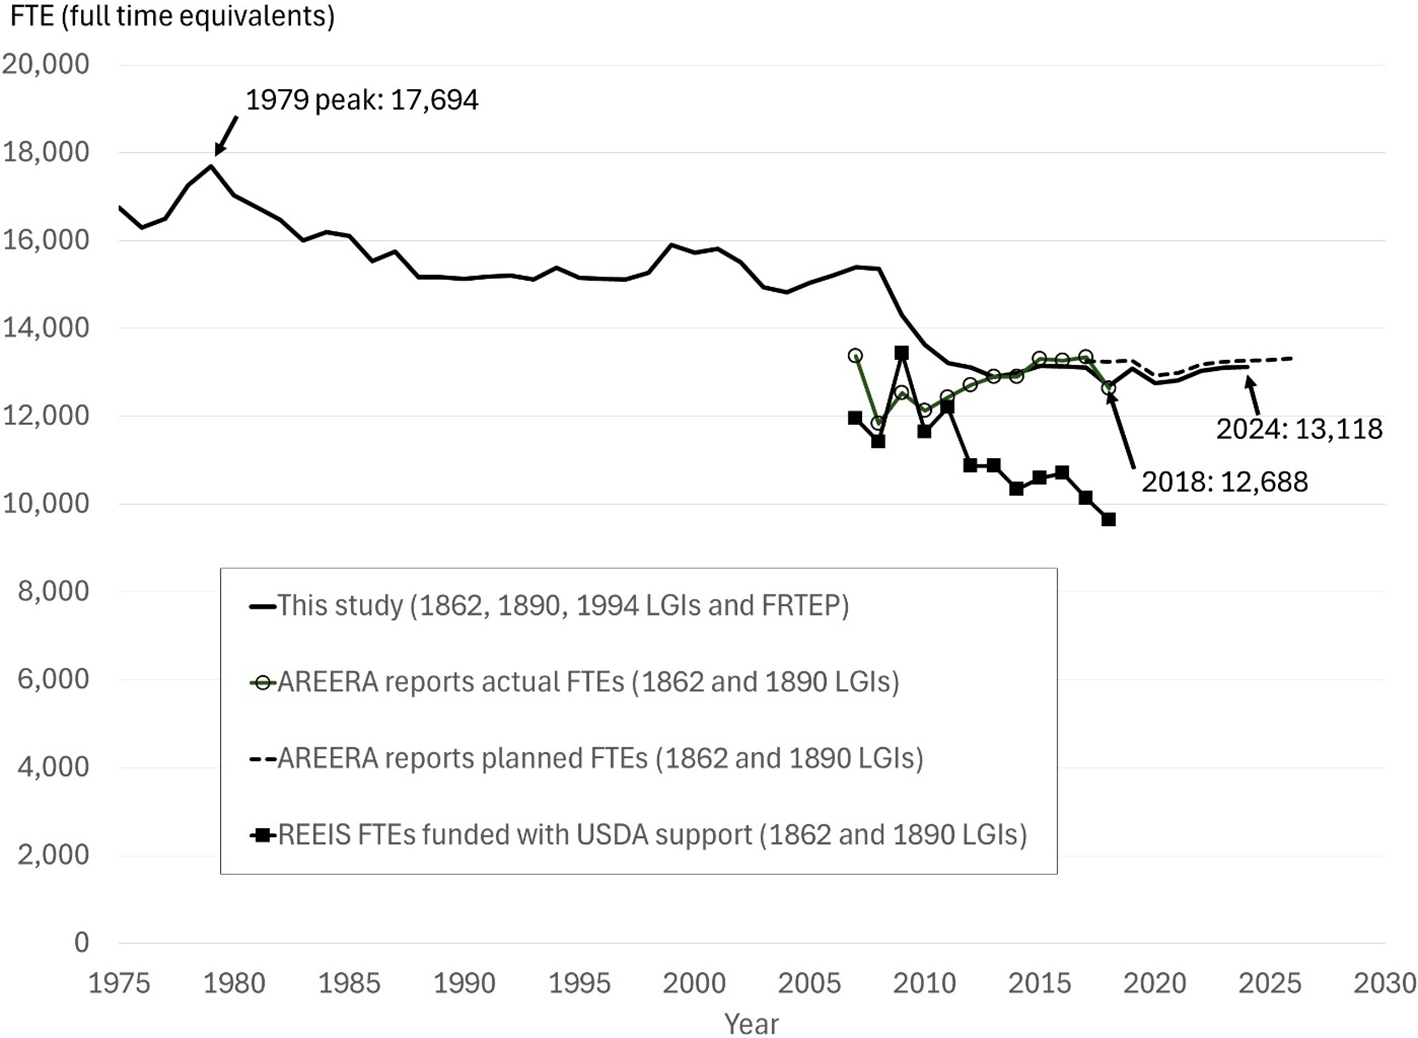
Changes in funding levels and sources can have direct implications for the number of Extension personnel and the types of programs implemented by Extension. Figure 2 shows national trends in estimated professional FTE Extension staff across the United States and insular territories since 1975. The Figure shows three different estimates of Extension FTEs: one reported by the NIFA REEIS system, one from a compilation of actual and planned FTEs reported in annual Plans of Work and Results and Accomplishments reports submitted by States to NIFA (NIFA AREERA), and one from our estimate that uses multiple sources to adjust State-level FTE estimates for missing data, and in some cases, corrected or more complete information from selected States. Our estimate shows that the number of Extension FTEs fell from a peak of 17,694 in 1979 to 12,688 in 2018, or by 28% over the past 40 years. States anticipated some growth to their Extension programs and planned for 13,118 FTEs by 2024, assuming their funding goals could be met.
Total professional extension staff employed through land-grant institutions (LGIs).
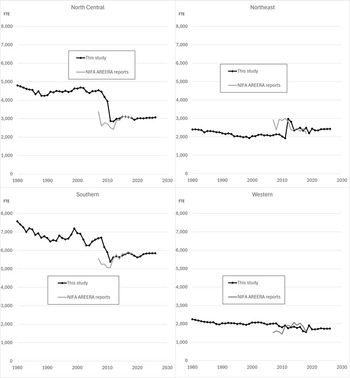
The national trend in Extension FTEs masks significant differences across regions. Figure 3 shows a regional breakdown of Extension FTE in 1862 and 1890 LGIs (combined). Most of the decline in national Extension FTEs is due to reductions in the two largest Extension regions – the North Central and Southern regions. The North Central region appears to have had the sharpest decline in Extension FTEs. Comparing FTEs in 1979 with FTEs in 2018, the North Central region lost 40% of its Extension staff positions, shrinking from approximately five thousand to three thousand FTEs. In turn, the Southern region is estimated to have had a 27% FTE decline (from approximately 7700 to 5600 FTEs). Still, the Southern region continued to maintain the largest Extension presence among the four regions. In the Western region, there was a modest decline in the number of Extension FTEs (approximately 700 FTEs), although large in percentage change (a loss of 34%). This region is the smallest in terms of the total Extension personnel (about 2100 FTEs in 1979 falling to 1400 FTEs in 2018). Finally, the Northeastern region experienced the smallest decline, losing only 181 positions between 1979 and 2018 (about 8%) and employing about 2100 Extension FTEs in 2018.
Estimates of professional extension staff by region for 1862 and 1890 land-grant institutions (1980–2024). Note: regions follow the definition by the Association of Public & Land-Grant Universities. North Central: Illinois, Indiana, Iowa, Kansas, Michigan, Minnesota, Missouri, Nebraska, North Dakota, Ohio, South Dakota, and Wisconsin. Northeastern: Connecticut, Delaware, District of Columbia, Maine, Maryland, Massachusetts, New Hampshire, New Jersey, New York, Pennsylvania, Rhode Island, Vermont, and West Virginia. Southern: Alabama, Arkansas, Florida, Georgia, Kentucky, Louisiana, Mississippi, North Carolina, Oklahoma, Puerto Rico, South Carolina, Tennessee, Texas, Virginia, and the U.S. Virgin Islands. Western: Alaska, American Samoa, Arizona, California, Colorado, Guam, Hawaii, Idaho, Micronesia, Montana, Nevada, Northern Marianas, New Mexico, Oregon, Utah, Washington, and Wyoming. Estimates include Extension staff at 1862 and 1890 LGIs but not 1994 LGIs or estimated positions funded through FRTEP.

Changing the data sources of FTE between 2010 and 2011 from ARS Salary Reports to NIFA AREERA reports showed little impact on the national trend but did affect regional counts. It indicated a lower count of FTEs in the North Central region and higher FTE counts in the Northeast and Southern Regions. The reasons for these differences are unclear but could be due to changes in the FTE accounting, such as omitting County-funded Extension staff in some States or including positions funded through restricted grants outside traditional Extension program areas.
Part of the decline in Extension FTEs around this time may also reflect funding shortfalls and Extension restructuring undertaken in some States. Economic recessions have provided an impetus for States to enact reforms to public service provision, including Extension services, for example, by closing or consolidating County Extension offices (Morse and Klein Reference Morse and Klein2006). The demand for Extension services has evolved over time, driven by declining farm numbers, expanding information market share for private companies (such as independent crop consultants and input suppliers), shifting state and local government priorities, and other factors (Al-Kaisi et al. Reference Al-Kaisi, Elmore, Miller and Kwaw-Mensah2015; Beethem et al. Reference Beethem, Marquart-Pyatt, Lai and Guo2023; McDowell 2001; Norton and Alwang Reference Norton and Alwang2020; Wolf Reference Wolf and Wolf1998). Consolidating County Extension offices into multicounty or regional offices and placing County-level agents solely under the responsibility of local governments have occurred in several States, including Alabama, Georgia, Iowa, Illinois, Michigan, Minnesota, Nebraska, Ohio, Washington, and Wyoming (Harker Reference Harker2012; Holz-Clause et al. Reference Holz-Clause, Koundinya, Glenn and Payne2012; Iowa State University 2009, 2019; Morse Reference Morse2006; Morse and Klein Reference Morse and Klein2006; White and Teuteberg Reference White and Teuteberg2015). Most of these reforms took place in the 1990s and 2000s, sometimes occurring in several stages (Harker Reference Harker2012).
Allocation of Extension resources across major program areas
Although improving farming and agricultural practices was the primary rationale behind the creation of the Cooperative Extension system, from its inception Cooperative Extension has embraced the broader goal of enhancing rural living conditions. Extension programs are an important vehicle for informal education and outreach programs of LGIs. While usually housed within colleges of agriculture, Extension programs can draw upon a wider set of university expertise to respond to demands for knowledge services from rural and nonrural communities. Veterinary schools, colleges of forestry, institutes of public policy, and schools of public health and nutrition are frequently engaged in university Extension activities. Extension includes a wide range of programs, classified by NIFA-defined topic areas, knowledge areas, subject of investigation, and field of science.
Tables 2 and 3 break down the allocation of Extension FTEs into five major program areas and compare the allocation over time and across regions at two points in time, 2007–2018 and 1975–1992.Footnote 9 For 2007–2018 (the most recent period for which the data are available from NIFA REEIS), the share of Extension FTEs focusing on agriculture was 27.1% nationwide, ranging from only 17.3% in the Northeastern region to 32.5% in the Western region. Natural resources were the focus of another 12.6% of Extension FTEs, giving agriculture and natural resources a combined total of 39.7% (agriculture stakeholders are generally the principal clientele for both agricultural and natural resource Extension activities).
Allocation of full-time equivalent (FTE) Extension staff to program areas, 2007–2018 average (%)
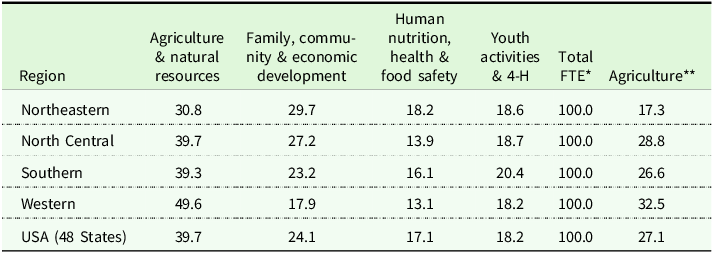
Source: based on NIFA REEIS database.
* The sum of the columns may not add up to 100.0% due to rounding.
** Agriculture program area is included in “Agriculture & Natural Resources combined.” However, it is separately identified for the period 2007–2018 and presented here for information purposes.
Allocation of extension staff time to program areas, 1977–1992 average (%)
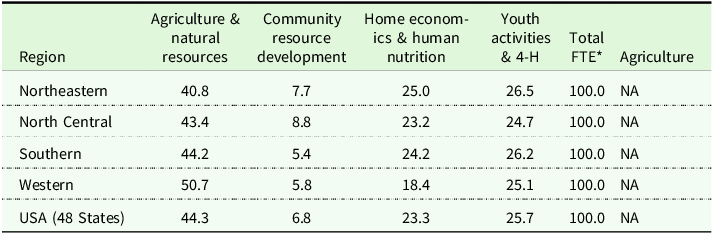
NA = not available.
* The sum of the columns may not add up to 100.0% due to rounding. Source: based on Ahearn et al. (Reference Ahearn, Yee and Bottum2003).
Although not all program categories from 1975 to 1992 are consistent with those in 2007–2018, it is possible to directly compare the share of Extension FTEs allocated to agriculture and natural resources (combined) and youth activities (4-H). As a share of total Extension FTEs, both of these program areas declined nationally and in all four regions between these periods. Our analysis shows that Extension service missions have shifted somewhat from the traditional emphasis on agriculture to placing greater attention on nonfarm issues such as community welfare, economic development, nutrition, and health.Footnote 10 Note that the 2007–2018 figures do not capture the entire Extension activities of some States, since the REEIS data focuses on funding from Federal capacity grants and State matching grants (unrestricted funds). If nonreported activities supported by other funds are disproportionately focused on nonfarm activities, then the total share of Extension resources on agriculture would be even lower.
Conclusions
In the 21st Century, Cooperative Extension continues to provide nonformal education and training to rural and increasingly nonrural communities, households, and farms. As the Federal role in funding Cooperative Extension has declined over time, States have sought alternative sources of financial support and enacted organizational reforms. In inflation-adjusted dollars, Federal spending for Cooperative Extension has fallen by about 60% since its peak in the early 1970s and by 2024, Federal funds accounted for less than one-fifth of total national Extension expenditures. We estimate that professional staff-years (FTEs) employed in Extension also decreased, from a high of 17,694 in 1979 to 13,118 in 2024, or by 28%. With Federal funding falling by 60% and FTEs by nearly 30%, this would imply that about half of the reduction in Federal funds was made up by increased funding from other sources.
The funding structure for Cooperative Extension underscores the predominantly State and local nature of Extension, with its program priorities reflecting State and local demand for its services. It stands in contrast with the funding for agricultural research, where the Federal government funds about 70% of all public agricultural research and about half of the agricultural R&D conducted at LGIs and other State cooperating institutions (Nelson and Fuglie Reference Nelson and Fuglie2022), compared to only 18% of total funding for Cooperative Extension.
Extension programs have taken on a broadening program portfolio over time but still devote significant resources to traditional areas like agricultural advisory services and 4-H youth development. In some States, Extension staffing has shifted toward regional or Statewide subject-matter specialists and away from the County agent model, although it appears that Extension offices continue to maintain a presence in most Counties. Program priorities differ significantly across regions, reflecting State and local priorities.
The trends in Extension resources and their allocation exhibit diverse patterns across regions. The nationwide decline in Extension FTEs from the 1970s onward most significantly affected the North Central region, where FTEs shrunk by approximately 40% over 1979–2024 (though some of this decline might be due to reclassification of some County Extension positions from LGIs to County employees). Among regions, the Southern region retains the largest number of Extension FTEs compared to the smallest number in the Western region. The Western region, however, has a larger share of its Extension FTEs devoted to agriculture and natural resources (i.e., 50%), compared with the other regions. In the Northeast region, programs focusing on community development and human nutrition account for almost one half of all Extension FTEs (compared to only 31% devoted to agriculture and natural resources).
In our discussions with Extension program leaders, State officials emphasized the importance of Federal formula funding, despite its declining role. The relative stability and flexibility of formula funding ensures that core Extension functions are performed even when State budgets are affected by economic downturns, while increasing reliance on fixed-term project funding creates uncertainty with regards to staffing and program delivery. Federal capacity funding also ensures that the clientele in every County has access to Extension information, while unequal access may result in Counties with a stronger tax base being able to support more local programming. Finally, formula funding is frequently leveraged to pursue non-Federal competitive funds to increase the overall funding portfolio and the reach of Extension programs.Footnote 11
This discussion echoes the themes from the broader literature on public funding for universities (Solberg and Drange Reference Solberg, Drange, Sivertsen and Langfeldt2025; Stampfer Reference Stampfer2019; Zacharewicz et al. Reference Zacharewicz, Pulido Pavón, Palma Martos and Lepori2023). Noncompetitive government funding, such as capacity funding, saves faculty time and resources that would otherwise be spent on proposals and allows for the exploration of innovative, nonconventional ideas. It also enables universities to pursue regional and local needs, as opposed to the needs of financially capable interest groups, and serve those who cannot afford to pay for information. On the other hand, competitive funding may better identify top programs through external review, incentivize faculty professionalism, and enable agencies to steer programs toward national priorities and concrete reporting milestones (Solberg et al. Reference Solberg, Drange, Sivertsen and Langfeldt2025).
As each funding source has its pros and cons, striking a balance requires comprehensive data across various funding sources – a gap that this study attempted to address. Even with significant effort spent on data collection, our study still needed to employ a few assumptions to address data gaps (such as equating the number of FRTEP projects to the number of FTEs, and assuming that different sources provide comparable data on FTE allocation across Extension program areas). Our study reveals funding patterns and trends, and we hope these findings enable more rigorous assessment of Extension resource allocation and make a strong case for more comprehensive data collection in the future. Extension’s 110-year history is shaped by adaptation to changes in the industry and rural communities, information technologies, and public and private funding for agricultural research and Extension (Anderson et al. Reference Anderson, Malone and Akridge2024; Norton and Alwang Reference Norton and Alwang2020). With farm consolidation and a decrease in farm numbers, private funding for research outpaces public investment (Fuglie et al. Reference Fuglie, Heisey, King, Pray, Rubenstein, Schimmelpfennig, Wang and Karmarkar-Deshmukh2011; Fuglie and Toole Reference Fuglie and Toole2014), shifting innovation and information from generating public good benefits to more private goods orientation (Marsh and Pannell 2000; Norton and Alwang Reference Norton and Alwang2020). Producers increasingly seek advice from private sources, such as crop consultants or fertilizer and seed companies (Beethem et al. Reference Beethem, Marquart-Pyatt, Lai and Guo2023). While Internet provided Extension with cheaper options to deliver programs and reach new audiences, it also diminished Extension’s traditional role as the primary source of information (Beethem et al. Reference Beethem, Marquart-Pyatt, Lai and Guo2023; King Reference King2018).Footnote 12 Together, these changes sharpen the question of how Extension can remain relevant. Publicly-funded extension remains critical in the areas unmet by private sector – for example, fair access to technology and advice for disadvantaged communities, management of common property resources and externalities, coordinated disaster response, or identifying science-based information in the era of wide-spread misinformation (Anderson et al. Reference Anderson, Malone and Akridge2024). The debate about public funding level and mechanism will remain relevant, and therefore, adequate data collection efforts are critical.
Data availability statement
Data sets were created using public USDA document repositories, previously published studies, and data shared through internal USDA requests.
Acknowledgements
Any opinions, findings, conclusions, or recommendations expressed in this publication are those of the authors and should not be construed to represent any official USDA or U.S. Government determination or policy. At the time this paper was prepared, Drs. Keith Fuglie and Sun Ling Wang served as senior economists with USDA’s Economic Research Service. We gratefully acknowledge the valuable insights gained through discussions with staff and faculty from several Land-grant universities and USDA-NIFA, which helped us better understand the scope of Extension activities and variations in faculty classification systems. We also appreciate the thoughtful reviews provided by Jeff Hopkins, Brent Hueth, Krishna Paudel, Ron Sands, and other colleagues at USDA ERS. Finally, we extend our sincere thanks to the two anonymous ARER reviewers for their constructive feedback, which significantly improved the clarity and quality of this paper.
Funding statement
No special funding source was used to conduct this research. This analysis is conducted by USDA/Economic Research Service economists. Any opinions, findings, conclusions, or recommendations expressed in this publication are those of the authors and should not be construed to represent any official USDA or U.S. Government determination or policy.
Competing interests
No conflicts of interest were identified.


 Open access