


Introduction
Social media has transformed the ways in which people interact with family and friends (O’Keeffe and Clarke-Pearson Reference O’Keeffe and Clarke-Pearson2011; Coyne et al. Reference Coyne, Padilla-Walker, Fraser, Fellows and Day2014), operate at work (Han et al. Reference Han, Xu, Ge and Qin2020; Rozgonjuk et al. Reference Rozgonjuk, Sindermann, Elhai and Montag2020), learn in academic settings (Casal Reference Casal2019; Ben Aoun and Jerbi Reference Ben Aoun and Jerbi2017), and collectively act within national politics (Wolfsfeld, Segev, and Sheafer Reference Wolfsfeld, Segev and Sheafer2013). This communication method also has the potential to reshape rural areas in developing nations in ways that differ from previous Information and Communication Technologies (ICTs) such as television, radio and telephones both by enabling the spread of information through a large number of strong and weak social networks (Aker Reference Aker2011; Anderson-Wilk Reference Anderson-Wilk2009; Tiwari, Lane, and Alam Reference Tiwari, Lane and Alam2019; Cash et al. Reference Cash, Clark, Alcock, Dickson, Eckley, Guston, Jäger and Mitchell2003) and by increasing the rate at which such information can be spread (Engotoit, Kituyi, and Moya Reference Engotoit, Kituyi and Moya2016; White et al. Reference White, Meyers, Doerfert and Irlbeck2014; Davis Reference Davis2017). For farmers, social media not only lowers the cost of transferring information, but also connects them to virtual markets, provides easy-to-access information on input and output prices, and provides opportunities to share experiences of new and existing best practices.
Access to information is important to farmers and policy makers in developing countries because it can increase awareness of agricultural techniques (Fisher et al. Reference Fisher, Holden, Thierfelder and Katengeza2018; Foster and Rosenzweig Reference Foster and Rosenzweig2010; Adegbola and Gardebroek Reference Adegbola and Gardebroek2007; Nwankwo et al. Reference Nwankwo, Thompson, Bokelmann, Peters and Bett2010; Caviglia-Harris Reference Caviglia-Harris2003), improve the likelihood of agricultural technology adoption (Baumgart-Getz, Prokopy, and Floress Reference Baumgart-Getz, Prokopy and Floress2012; Kassie et al. Reference Kassie, Zikhali, Manjur and Edwards2009), reduce non-financial costs of adoption and implementation (Aker Reference Aker2011; Llewellyn Reference Llewellyn2007), and reduce the uncertainty of outcomes (Llewellyn Reference Llewellyn2007). The traditional approach to disseminating information about the existence of new technologies and how to implement them is through agricultural extension programs, which have been widely found successful at encouraging technology adoption and raising farm productivity (Takahashi, Muraoka, and Otsuka Reference Takahashi, Muraoka and Otsuka2020; Pan and Chiou Reference Pan and Chiou2011; Birkhaeuser, Evenson, and Feder Reference Birkhaeuser, Evenson and Feder1991). Recent research on alternative diffusion channels has emphasized the role of modern ICTs, particularly in the context of the rapid expansion of mobile phones in rural regions; and the role of peer farmers and other trusted sources of information (Martinez et al. Reference Martinez, Labarta, Gonzalez and Lopera2021). An under-explored form of ICT for information diffusion is social media (Spielman et al. Reference Spielman, Lecoutere, Makhija and Van Campenhout2021; Suchiradipta and Saravanan Reference Suchiradipta and Saravanan2016; Talib et al. Reference Talib, Ashraf, Agunga and Chaudhary2018). Social media has the potential to support technology adoption by providing access to information on technology options, implementation, and markets from government agencies, agricultural input suppliers, and via social learning between farmers themselves.
Recent randomized experiments on the impacts of ICTs on technology adoption and other outcomes have found increased fertilizer use, yields and prices for farmers who were sent voice or SMS messages (e.g. Van Campenhout Reference Van Campenhout2022; Giulivi et al. Reference Giulivi, Harou, Gautam and Guerena2023; Soldani et al. Reference Soldani, Hildebrandt, Nyarko and Romagnoli2023) or provided with extension information via smartphone apps (e.g. Giulivi et al. Reference Giulivi, Harou, Gautam and Guerena2023; Tjernström et al. Reference Tjernström, Lybbert, Hernández and Correa2021). However, review of a broad range of studies shows that not all ICTs are effective for expanding adoption of agricultural technologies (Spielman et al. Reference Spielman, Lecoutere, Makhija and Van Campenhout2021). Efforts to harness ICTs to raise farm productivity may be constrained by a lack of mobile phone penetration among the poorest households; the costs of generating relevant content; barriers other than information such as lack of credit or input markets; and limits on the complexity of the information that can be conveyed (Nakasone, Torero, and Minten Reference Nakasone, Torero and Minten2014)
Most studies testing the effects of ICTs on technology adoption rely on one-way provision of information, for example from government agencies to farmers. However, another strand of the technology adoption literature demonstrates that the effectiveness of information provision depends on who the information comes from (Takahashi, Muraoka, and Otsuka Reference Takahashi, Muraoka and Otsuka2020). Multiple studies using randomized control trials or quasi-experimental approaches have found that technology adoption is greater when information comes from peer farmers rather than centralized sources such as extension agents (Arslan et al. Reference Arslan, Wollni, Oduol and Hughes2022; BenYishay and Mobarak Reference BenYishay and Mobarak2019; Nakano et al. Reference Nakano, Tsusaka, Aida and Pede2018). Social media has the potential to bridge this gap by providing virtual peer-to-peer engagement (through sharing and likes) and peer-to-peer feedback (with experiential posts) to enhance trust in online information on new farm technologies.
This paper estimates the impact of social media on the adoption of traditional and novel agricultural practices promoted by four government agencies in the state of Rondônia, Brazil. Agricultural development and ICT expansion are important policy goals in Brazil, particularly in the relatively poor Amazon. Less than 20% of households in the Legal Amazon had access to the internet in 2017 (Brazilian Institute of Geography and Statistics (IBGE) 2017), but access increased with the “Norte Conectado” ProgramFootnote 1 . Farmers, input suppliers, and extension agencies in this remote region now use social media to share and promote new agricultural practices. We use two quasi-experimental approaches to compare the estimated impacts of social media to three other forms of information dissemination: mobile phones, farmer cooperatives and extension visits. First, we estimate a difference-in-differences model for a panel of 336 households who responded to a similar field survey conducted in both 2009 (before the use of social media) and 2019 (after the use of social media). This approach controls for time-invariant unobservable differences in the characteristics of households that do and do not engage with social media, farmer cooperatives or extension agencies or do or do not own mobile phones. Second, to take advantage of a larger and more diverse sample of over 1,200 farm households surveyed in 2019, we use propensity score matching to select a control sample of households to compare to those engaged with each of our information treatments.
Our results suggest that social media significantly increases the adoption of cattle and pasture management practices. Adoption of traditional practices such as cattle insemination and fallowing of pasture is 25% higher among social media users in 2019 according to our difference-in-differences estimators. When we use propensity score matching to estimate impacts on a wider range of more novel practices, we find that social media users are 15 percentage points more likely to engage in pasture reform relative to a sample mean of 43% adoption, and adopt 0.05 more “frontier” practices of using clonal grass varieties and semi-confinement of cattle out of a total of 2, where the sample mean is 0.07 practices. We find that extension visits increase the adoption of pasture reform by 21 percentage points, and frontier practices by 0.06 practices. We do not observe consistently-significant impacts for mobile phones on any of our outcome categories. We test for interactions between social media and extension, and find that they neither compete with, nor amplify the effects of, one another. These results allow us to draw two important conclusions. First, they suggest that social media does have a greater network reach that enables more and deeper relationships than are possible with cell phones alone or through the existing networks that cooperatives provide. These deeper and more numerous connections lead to the adoption of the agricultural practices that are currently promoted by agricultural development agencies. Second, we believe that the lack of interaction effects between social media and extension visits highlights a missed opportunity for extension agencies.
The paper continues by outlining our conceptual model in section 2, describing the study region in section 3, and describing the data in section 4. The empirical strategy and estimation results are in the two sections to follow. Our conclusions can be found in section 7.
Conceptual model
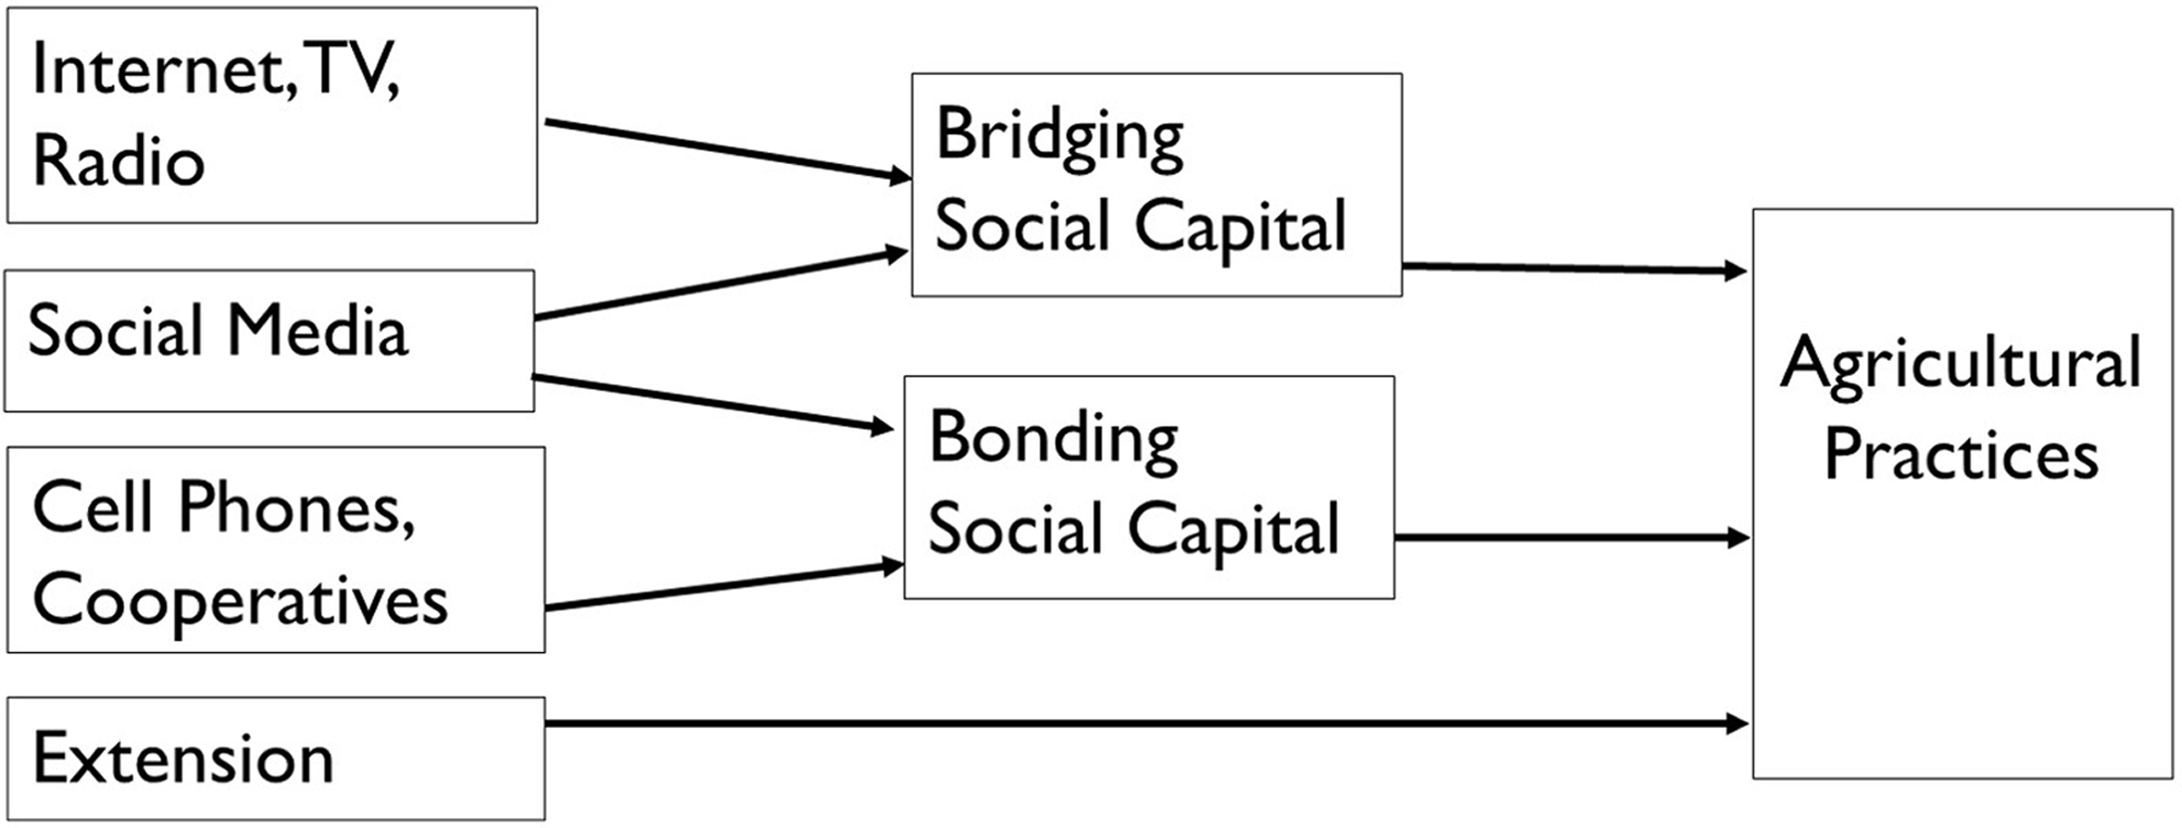
To begin, we outline a causal chain that highlights how different forms of information exchange impact agricultural practices depending on whether the information is mediated through bridging social capital, bonding social capital, or both (Figure 1). How much information a farmer has access to and the degree to which they trust that information depends on their social capital (i.e. the number and strength of relationships). The greater the social capital, the more likely a farmer is to adopt new resource practices (Wossen et al. Reference Wossen, Berger, Mequaninte and Alamirew2013). Social connections can foster information exchange by facilitating the development of “bonding” social capital (i.e. strong personal relationships) and by facilitating development of “bridging” social capital (i.e. weak, but diverse, personal relationships) (Putnam Reference Putnam2000). Bonding social capital tends to be generated among a small number of people, as many strong relationships are difficult to maintain at once, while bridging social capital most often leads to more, but weaker, ties between individuals. Figure 1 highlights that one-way forms of communication (such as internet, TV and radio) are hypothesized to influence agricultural practices by expanding access to information and networks (i.e. bridging social capital), two-way forms of communication (like cell phones and cooperatives) influence agricultural practices through deeper connections (i.e. bonding social capital) and that social media influences agricultural practices by both expanding and deepening social relationships.
Directed Acyclic Graph (DAG). This figure represents the causal path through which mobile phones, social media, farm cooperatives, and extension impact agricultural practices. Bridging social capital (which is based on weaker ties between individuals) brings together people who don’t know each other well such as colleagues, associates or neighbors. Bonding social capital (which is associated with strong relationships) builds slowly and helps to strengthen connections between family and friends (Tiwari et al. Reference Tiwari, Lane and Alam2019; King et al. Reference King, Fielke, Bayne, Klerkx and Nettle2019). Social media is the only information communication method that is mediated by both bridging and bonding social capital, enabling both weak and strong interpersonal relationships. Cell phones and cooperatives tend to only enable bonding social capital due to the lack of interactions that occur with strangers or acquaintances. Traditional extension visits do not work through bridging or bonding social capital since they generally serve as a one-way transfer of knowledge.
Farmer relationships were once limited by whom they could communicate with in-person. Information communication technologies (ICTs) expanded these farmer networks by allowing for quicker and wider communication, which resulted in access to a large volume of information that requires information-seekers to curate sources (Metzger and Flanagin Reference Metzger and Flanagin2013). Information-seekers thus rely on credibility shortcuts (including familiar sources, sources trusted by others, sources that appear professional) that are often combined with information that is consistent with prior thoughts and beliefs (Metzger and Flanagin Reference Metzger and Flanagin2013).
Early ICTs including newspapers, radio, and television broadcasts are effective one-way sources of information (Zanello, Srinivasan, and Shankar Reference Zanello, Srinivasan and Shankar2014; Aker Reference Aker2011). This form of communication means that these ICTs expose farmers to additional sources of information, but can only contribute to bridging social capital since, on their own, they do not help to develop deeper relationships. It is possible that ICTs that operate primarily as sources of information, more recently including access to the internet, can indirectly support the development of bonding social capital by providing information about community events (Stern, Adams, and Boase Reference Stern, Adams and Boase2011). Mobile phones and farmer cooperatives pose an opportunity to extend social capital development opportunities by introducing two-way communication possibilities that typically strengthen existing relationships by facilitating the development of bonding social capital. Traditional extension visits, on the other hand, generally serve as an individual-to-individual transfer of knowledge in which the credibility of the source is based on their technical qualifications.
The addition of social media to the mix allows for the development of both strong and weak ties because it exposes individual users to a large network of users while enabling participants to easily strengthen connections with existing contacts or develop new relationships through sharing personal experiences (Anderson-Wilk Reference Anderson-Wilk2009). These personal stories and two-way interactions play a vital role in disseminating information that motivates change because these personal connections help to reduce uncertainty regarding the values and variability of potential costs and benefits of new agricultural practices (Nwankwo et al. Reference Nwankwo, Thompson, Bokelmann, Peters and Bett2010).
Farmers are more likely to adopt a new and beneficial agricultural technology if they have easy access to information about the technology that is credible, legitimate, and salient (Baumgart-Getz, Prokopy, and Floress Reference Baumgart-Getz, Prokopy and Floress2012; Liverpool-Tasie and Winter-Nelson Reference Liverpool-Tasie and Winter-Nelson2012; Kassie et al. Reference Kassie, Zikhali, Manjur and Edwards2009; Llewellyn Reference Llewellyn2007; Cash et al. Reference Cash, Clark, Alcock, Dickson, Eckley, Guston, Jäger and Mitchell2003). Thus, the who and how of information dissemination plays an important role in the rate of uptake because information sources must be trusted if farmers are to act on that knowledge. Non-expert information-seekers often rely on the perceived source credibility to determine the degree to which the information can be trusted, where any known agent expertise and the farmer’s social network often play a role in drawing these conclusions (Lucassen and Schraagen Reference Lucassen and Schraagen2013). For example, prior research suggests that extension agents are trusted and positively influence adoption (Kassie et al. Reference Kassie, Zikhali, Manjur and Edwards2009). However, not all farmers in a region have access to extension support, and agents often visit or extend program opportunities to farms they think are already more likely to adopt the practice being tested (zu Ermgassen et al. Reference Ermgassen, de Alcântara and Balmford2018; Aker Reference Aker2011; Wossen et al. Reference Wossen, Abdoulaye, Alene, Haile, Feleke, Olanrewaju and Manyong2017). Therefore, many farmers depend on their social networks and any demonstration of experience with using a technology (Adegbola and Gardebroek Reference Adegbola and Gardebroek2007) to determine information quality and trust (Fisher et al. Reference Fisher, Holden, Thierfelder and Katengeza2018).
Both weak and strong relationships allow new information to be quickly and easily passed between social groups, but the information that is spread among weak ties has a larger footprint. For this reason, bridging social capital can expose farmers to a greater number of unfamiliar perspectives and increase the chances for learning about new technologies. At the same time, both types of connections can fail to result in the adoption of new practices if the social circle becomes insular (i.e. an echo chamber), reducing the possibility of new ideas and innovation (King et al. Reference King, Fielke, Bayne, Klerkx and Nettle2019). Social media is the only ICT that encourages the development of both bridging and bonding social capital, where relationship-based evaluation shortcuts tend to be the most salient due to this combination of social capital, which allows for the development of large, diverse social networks (Tiwari, Lane, and Alam Reference Tiwari, Lane and Alam2019; Abrams and Sackmann Reference Abrams and Sackmann2014) and an increased trust in information (Pan and Chiou Reference Pan and Chiou2011).
The extent to which social media can help to influence the spread of information about farming practices depends on the quality and quantity of information provided by government agencies, private input suppliers and other farmers. We conducted a systemic review of the Facebook pages and profiles of three state extension agencies (IDARON, EMATER and SENAR), a federal extension agency (EMBRAPA) and several Facebook groups interested in rural production in Rondônia to determine the reach and focus of social media in our study region. We build on our conceptual model and this qualitative analysis to inform our quasi-experimental approach. This systematic review revealed that these almost daily posts on events, research, and news provided information that is important to farmers, such as when and how to provide counts of livestock herds and how to record evidence of cattle vaccinations to federal and state agencies (Table 1). The focus of these posts is found to be cattle and pasture management practices such as pasture rotation. Additional services included photos and videos on management techniques, soil treatments, and a tool to assist decision-making on the appropriate stocking rate of cattle. Among Facebook groups interested in rural production in Rondônia, 70% were found to be focused on the purchase and sale of agricultural products and inputs. We therefore match the practices highlighted in these sites and posts with the practices recorded in our survey.
Review of social media profiles of agencies and networks
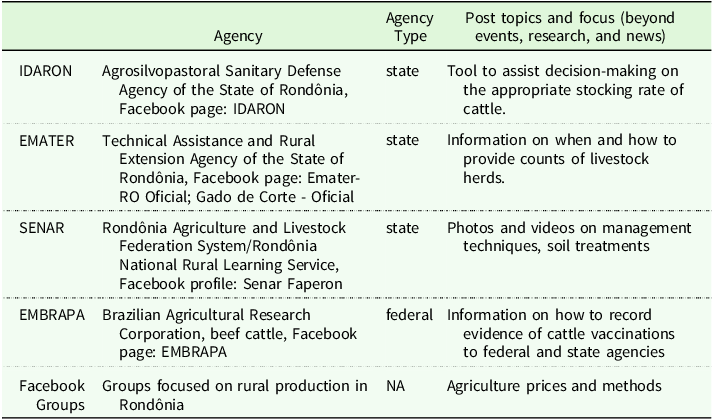
Notes: All data collected by the authors in 2020 over a course of one month. One of the Facebook groups noted that members would switch to a WhatsApp group for discussions, suggesting that this may be the preferred communication tool of farmers in the near future.
Data
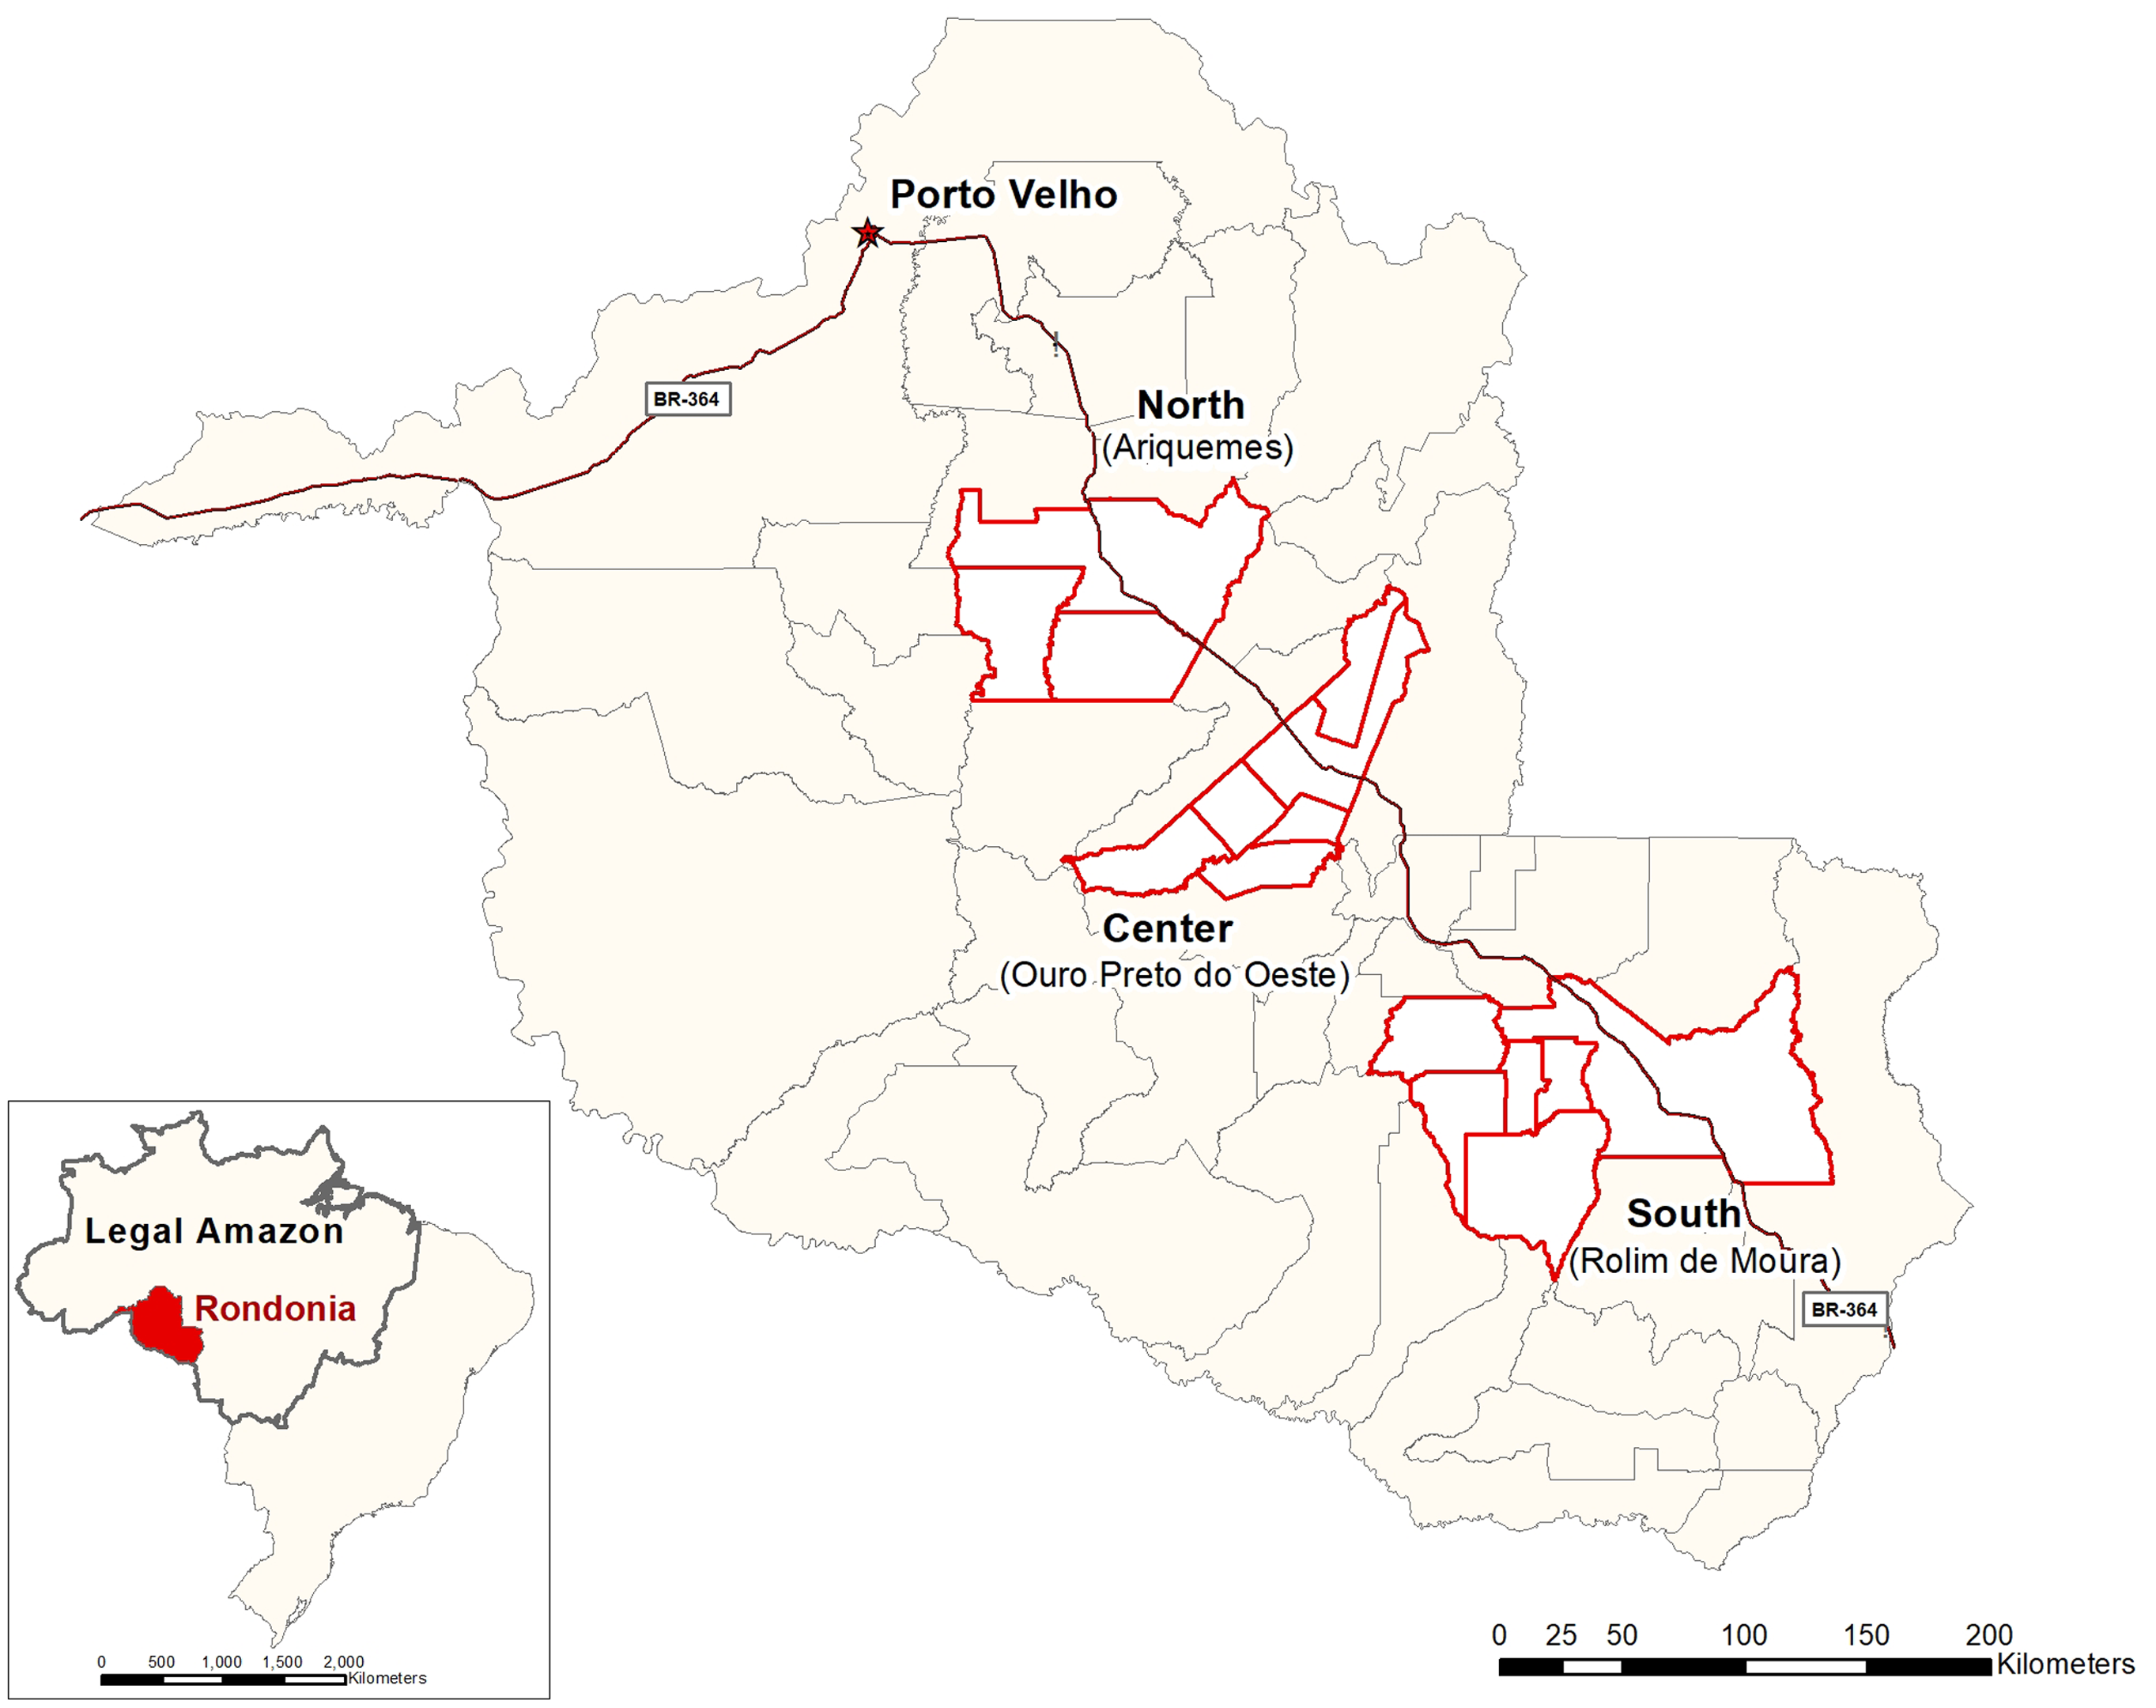
We use farm-level survey data collected from agricultural households in three regions of the Amazonian state of Rondônia, Brazil (Figure 2) to test the impact of social media (and three other forms of information communication) on agricultural practices. The majority of the population of the state is located in agricultural colonization settlements established from the 1970s onwards. Following high rates of deforestation over the previous 40 years, the region is now made up of widespread pasture and a small patchwork of mature and secondary forest (Numata et al. Reference Numata, Cochrane, Roberts and Soares2009; Roberts et al. Reference Roberts, Numata, Holmes, Batista, Krug, Monteiro, Powell and Chadwick2002). Family farms (those with less than 200 hectares of land) make up about 80% of agriculture in the state (Brazilian Institute of Geography and Statistics (IBGE) 2017). These farms are largely engaged in milk and beef production, with some perennial crops (Caviglia-Harris, Sills, and Mullan Reference Caviglia-Harris, Sills and Mullan2013; Mullan et al. Reference Mullan, Sills, Pattanayak and Caviglia-Harris2018).
Study Region. The 2009 study region includes the 6 municipalities in the Ouro Preto do Oeste Region (Center) of Rondonia. The 2019 study region includes this six municipality region plus 9 additional municipalities in the northern and southern regions of the state. The DID analysis uses the 2009 and 2019 data from the six municipality region in the center of the state. The propensity score matching includes observations for all three study sites interviewed in 2019.

Internet access in rural Brazil has historically been sparse: As late as 2017, the agricultural census found only 28% of agricultural households in Brazil had internet access (Brazilian Institute of Geography and Statistics (IBGE) 2017). Based on a Regional Center for Studies on the Development of the Information Society survey on the use of ICT in Brazilian households, access to the internet at home was 16% lower in rural regions of the country than in urban regions in 2019 (CETIC 2020). In addition, the North census region (including the Amazonian states of Acre, Amapá, Amazonas, Pará, Rondônia, Roraima and Tocantins) has historically lagged behind the national average but is catching up to the national averages. According to this same source, the use of social network sitesFootnote 2 increased in the North by more than 1.7 million users between 2009 and 2019, and of those who used a mobile phones in 2019, more than half used it to access social media, indicating the important role of smartphones in connecting rural households in this more recent time frame. Lastly, none of the millions of respondents in this national study reported using social media via mobile phones in 2009 (the pretreatment year in our study).
We collected household survey data in 2009 and 2019 to estimate the impact of social media and other information sources on adoption of agricultural practices. Survey responses are from a stratified random sample, where the stratification is based on the rural population of each of the 15 municipalities in the three study sites. Our sample represents a spatially dispersed random sampling of approximately 4–6% of the rural population in each municipality (in each of the two years). The survey included questions about household characteristics (such as age and education of household heads, involvement in organizations, and social media use), demographics (including income and wealth), farm characteristics (i.e. land use, soils, and location) and farm production and choices (including crops, yields and practices), among others (Caviglia-Harris, Sills, and Mullan Reference Caviglia-Harris, Sills and Mullan2013; Mullan et al. Reference Mullan, Sills, Pattanayak and Caviglia-Harris2018). Our panel was created by returning to the households interviewed in the previous survey year. We also added new households to the sample using a randomized sampling methodology in each survey year that ensured our interviewed population represented the urban population in this rapidly changing region (IBGE 2024).
The 2009 sample includes household responses in our Central study site (Ouro Preto do Oeste) and is from a panel that began in 1996 (Caviglia-Harris et al. Reference Caviglia-Harris, Hall, Mulllan, Macintyre, Bauch, Harris, Sills, Roberts, Toomey and Cha2012). The 2019 sample includes households from the panel in the Central study site as well as new households in our expanded study region including the North (Ariquemes) and South (Rolim de Moura) study sites. We focus on these before and after time periods in the difference-in-difference estimation (and do not use the full panel that began in 1996) because social media was not adopted by farmers in this region until after 2009.
Our data consist of (1) four information treatments, (2) outcomes, namely use of particular agricultural practices, and (3) controls (Table 2). Our information treatments are those that we outline in our conceptual model (i.e. social media, mobile phones, membership in farmer cooperatives and extension visits). We consider mobile phones and social media as more “modern” sources of information exchange and participation in farmer cooperatives and extension visits to be more “traditional” sources (Varma Reference Varma2018; Desai and Joshi Reference Desai and Joshi2014). The cooperatives in our study region include groups that gather to negotiate prices, socialize and share information about farming techniques. Extension visits are on-site consultation visits by one or more of the state or federal agencies outlined in Table 1.
Descriptive statistics for different samples
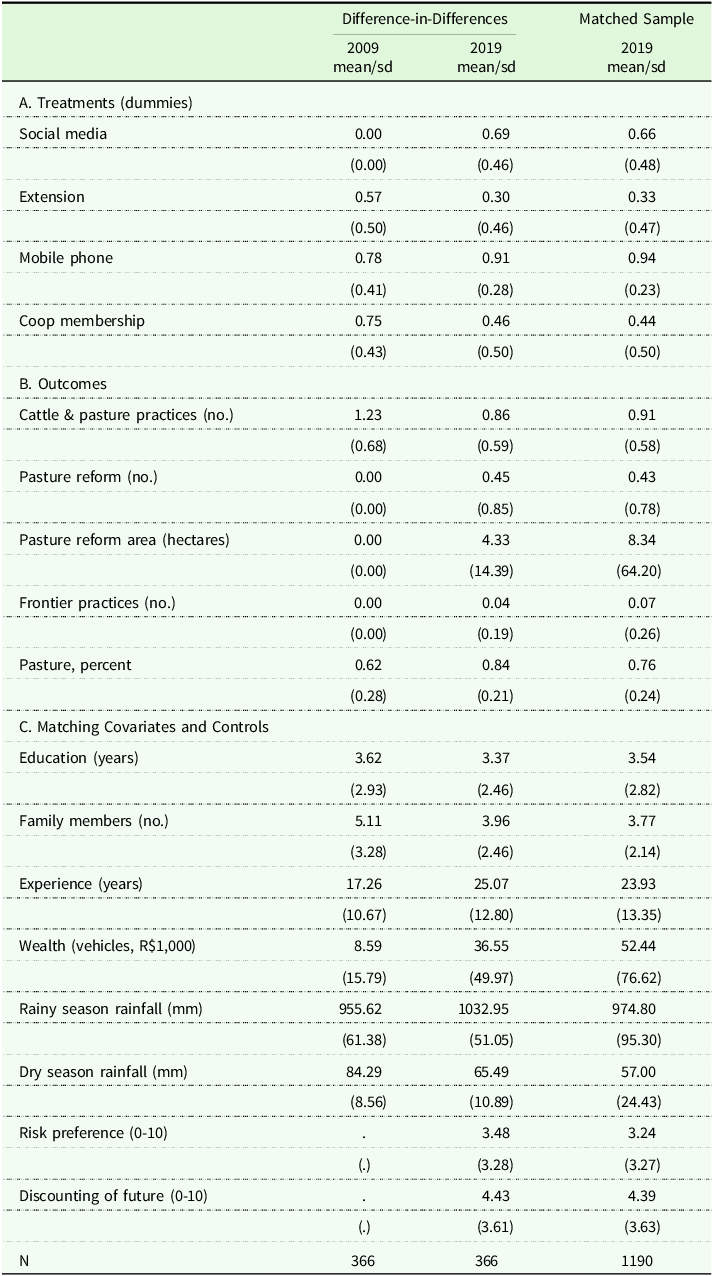
Notes: Data are from household surveys conducted at the farm properties. Wealth is measured as the value of all vehicles owned, adjusted for inflation and reported in 2019 reais. Risk preference is on a scale of 0-10, 0 is equivalent to no willingness to take risks, 10 is equivalent to being very willing to take risks. Discounting of the future is on a scale of 0-10, 0 is no willingness to take risks, 10 is very willing to give up something to get more benefit in the future.
The household panel suggests that the more “modern” information networks provided by mobile phones and social media appear to be on the rise. 78% percent of the sample had a mobile phone in 2009 and this share increased to 91% in 2019 (Table 2). Social media was not in use in the region in 2009 but by 2019 69% of the sample reported using social media. At the same time, the “traditional” cooperative networks and extension activities are found to be on the decline, with a decrease from 75% of the sample participating in at least one association in 2009 to an average of 46% by 2019, and a decrease from 57% receiving an extension visit to 30% over the same period (Table 2).
When asked in more detail about their social media use, households in our sample indicated that the most common social media platform is WhatsAppFootnote 3 , with 100% of social media users responding they use this app. Facebook is the second most common platform (67% of social media users). Far fewer respondents use Instagram, Twitter or any other social media platform. Of those who say that they use these platforms at all, 54% use them to exchange information about agricultural production. Among those who exchanged information on agriculture, the most common topics are farming techniques (65%), crop prices (64%), and agricultural sales (49%). Other uses include learning about weather, politics, and government programs. Finally, households respond that they use the platforms to receive information on average of 1–2 times per week and share their own information an average of 1–2 times per month (not provided in the table).
Our outcome variables reflect the adoption of different types of technologies and management practices (Table 2). The more traditional Cattle and Pasture Practices include insemination, other reproduction expenditures, the fallowing of pasture, and the use salt licks (for a total of four practices in our count). The use of these “traditional” practices is declining over time according to our survey responses. Farmers used 1.23 of these practices in 2009 and 0.86 on average in 2019. The “novel” practices promoted by state and federal agencies post-2009 include Pasture Reform (which we include as a dummy and as the total area) and Frontier Practices including the use of clonal varieties of grasses for pasture and the use of semi-confinement for cattle operations (for a total of two practices in our count). Almost half of the farmers in our sample (45%) reported reforming their pasture in 2019 with an average area of 4.33 hectares or less than 10% of the total area in pasture. Farmers in our sample used only 0.04 out of a potential total of 2 frontier practices in 2019.
Data in Table 2 suggest that households have an average of approximately three and a half years of education in both years, smaller families by 2019 (4 in 2019 compared with 5.1 in 2009), and that the increase in farming experience by 2019 is less than 10 years (the gap in the survey years) for the panel because some younger generations have inherited these properties and lower still for the larger 2019 matched sample because newer and younger households, who settled in the region after 2019, are included in this sample. Households have aged, as indicated by the 10-year survey gap, but some have also retired and/or passed on the farm to younger household members. Finally, we have three controls that are used in the propensity score matching models: wealth, willingness to take risks, and willingness to discount the future. Wealth (proxied with the value of all vehicles owned by the household) is approximately R$8,600 in 2009. This inflation adjusted value increases by over 300% to over R$36,000 by 2019 for the panel of households and is even greater for the matched sample (over R$52,000). Risk tolerance is not available for 2009, but in 2019, it is recorded as 3.48 on a scale of 0 to 10 in the panel sample and slightly lower at 3.24 in the matched sample, while willingness to discount the future was also not included in the 2009 survey, but stands at 4.43 in the 2019 panel sample and 4.39 in the matched sample. The risk tolerance survey question follows the design of Dohmen et al. (Reference Dohmen, Falk, Huffman, Sunde, Schupp and Wagner2011) in asking, “Please tell me how much you would say you are or are not willing to take risks in general. To answer, use a scale from 0 to 10, where 0 means you are ‘not willing at all to take risks’ and 10 means that you are ‘very willing to take risks’.” This format has been shown to be strongly correlated with the widely used (but more time consuming to elicit) lottery approach used by Holt and Laury (Reference Holt and Laury2002) to elicit risk preferences (Dohmen et al. Reference Dohmen, Falk, Huffman, Sunde, Schupp and Wagner2011; Nielsen, Keil, and Zeller Reference Nielsen, Keil and Zeller2013; Hardeweg, Menkhoff, and Waibel Reference Hardeweg, Menkhoff and Waibel2013). The relative patience question had an equivalent structure and asks about willingness to give up something that is beneficial today in order to benefit more in the future. This has also been experimentally validated and was included in the 2012 Gallup World Poll (Falk et al. Reference Falk, Becker, Dohmen, Enke, Huffman and Sunde2018).
Empirical strategy
We use two quasi-experimental approaches to estimate the plausible causal impacts of social media and other sources of information on the adoption of various agricultural practices. Our preferred estimation technique is the Difference-in-Differences (DID) analysis, which is used to quantify the impact of the ICT interventions while accounting for any pre-existing trends or inherent disparities between different groups. However, because many of the new practices that are being promoted on social media in 2019 (see Table 1) were not used in 2009, because our data collection strategy did not include questions about pasture reform in 2009, and because we expanded our sample size and geographic scope in 2019, we complement our DID analysis with Propensity Score Matching (PSM). The use of PSM allows us to estimate the impact of the different treatments on pasture reform as well as the other agricultural practices we cannot include in the DID analysis. The rationale behind the PSM is that we can include more (and newer) practices that weren’t asked about in 2009; capture a more varied sample that is perhaps more representative of the state (and the Amazon frontier); and compare an alternative identification strategy for robustness. This dual-method approach allows us to draw more reliable and nuanced conclusions, ultimately contributing to a deeper understanding of the relationship between social media engagement and agricultural practice adoption.
To estimate a causal effect, one would ideally compare the agricultural practices adopted (Y) for a given household with and without the information treatment (T), i.e. social media use, mobile phone ownership, cooperative membership or extension visits. As we cannot observe both outcomes, we estimate counterfactual outcomes for the treated individuals in the absence of the information treatment.
We first employ a Difference-in-Differences (DID) approach to estimate the changes in outcomes for treated households relative to untreated households between 2009 and 2019. For our main outcome of the number of cattle and pasture management practices adopted, we use a fixed effects Poisson regression model. The equation is specified as follows:
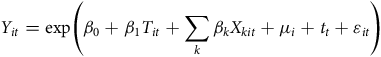 $${Y_{it}} = {\rm{exp}}\left( {{\beta _0} + {\beta _1}{T_{it}} + \mathop \sum \limits_k {\beta _k}{X_{kit}} + {\mu _i} + {t_t} + {\varepsilon _{it}}} \right)$$
In this model, Y
it
represents the count of agricultural practices for household i at time t. We compare the outcomes for households that adopted social media or mobile phones, or changed their cooperative membership or interaction with extension agents (our treatments, T) between 2009 and 2019 and those that did not. The model controls for all time-invariant unobservable influences on farm outcomes (μ
i), year fixed effects (t
t), k number of time-variant observable characteristics (X
kit
) and includes the error term ( ${\varepsilon _{it}})$
. This model allows us to capture the relationship between the treatment and the count outcomes while appropriately handling the non-negative nature of the count data. Similarly, a fixed effects probit model is used to estimate the impact of the treatments on the individual practices that are summed to create these categories. The equation for these estimations is similar; however, the model is based on a latent variable approach and uses a nonlinear function (the cumulative distribution function of the standard normal distribution) to estimate the probability of the binary outcome. Finally, we use a linear specification to estimate the effects of the treatments on the area of pasture.
${\varepsilon _{it}})$
. This model allows us to capture the relationship between the treatment and the count outcomes while appropriately handling the non-negative nature of the count data. Similarly, a fixed effects probit model is used to estimate the impact of the treatments on the individual practices that are summed to create these categories. The equation for these estimations is similar; however, the model is based on a latent variable approach and uses a nonlinear function (the cumulative distribution function of the standard normal distribution) to estimate the probability of the binary outcome. Finally, we use a linear specification to estimate the effects of the treatments on the area of pasture.
This DID estimate provides a counterfactual group that did not change their treatment status while subject to the same changes in external conditions (policies, inflation, etc.) as the group that did change their treatment status. In the case of social media, the pretreatment period (2009) serves as a baseline for all households because social media was effectively nonexistent in Rondônia in 2009. In this quasi-experimental setup, the treated households adopt social media by 2019 and the untreated “control” households do not. The difference between the changes in outcomes experienced by the treated and control households can therefore be attributed to the treatment. The identification strategy is similar for mobile phones, cooperative membership, and engagement with extension agents, although these information mechanisms were available to farmers in both time periods.
To take advantage of a larger and more diverse cross-sectional sample, evaluate impacts on additional practices, and assess the robustness of our difference-in-difference results, we also use propensity score matching (PSM) to identify a farmer population that is otherwise similar to our treated populations (i.e. the social media and mobile phone users, farm cooperative members, and farmers who received extension visits). This is because farmers who use social media, own mobile phones, participate in farmer cooperatives and/or receive extension activities could be significantly different from those who do not use or participate in regards to these information activities, particularly in regards to relative wealth. PSM addresses this potential bias resulting from non-random selection into each of the information treatments by comparing households that are similar in their observable characteristics except their information access and dropping those that are not from the analysis.
We estimate the propensity to use social media or the other information sources as a function of the observable covariates described in Section 3 to obtain a propensity score for each observation. We then use nearest neighbor matching with replacement, which matches a treated observation with the control that has the closest propensity score. Nearest neighbor matching has superior performance in regards to the variance-bias tradeoff in comparison to propensity score calipers (Austin Reference Austin2018) and assumes that differences in outcomes are random conditional on observable characteristics; i.e. that no systematic differences in unobservables exist between households that do and do not use social media or participate in farmer cooperatives. There is a possibility that our outcomes of interest may be correlated with unobservable determinants of social media, mobile phone use, farm cooperative membership and/or extension engagement. For example, if farmers with an affinity for new technology both engage with social media and are inclined to adopt innovative agricultural practices or if farmers participate in cooperatives with the objective of learning about alternative approaches to farming. In either case, this would positively bias our estimates of the impact.
Once we identify the matched sample, we estimate the difference in the means between our control and treated groups with the following linear equation:
 $${Y_i} = {\beta _0} + {\beta _1}{T_i} + {\beta _2}{X_i} + {\varepsilon _i}$$
where, similar to above, Y
i
represents the count of agricultural practices for household i in 2019, T
i represents the treatments, X
i
is a set of controls and ${\varepsilon _{it}}\;$
is the error term.
${\varepsilon _{it}}\;$
is the error term.
Results
We begin with the estimations of the impact of our four information treatments (social media, mobile phones, cooperatives and extension) on cattle and pasture practices and on the percent of pasture found on the property. While pasture creation, rotation, and management are frequently discussed in social media postings, we argue that the percentage of pasture area at a given time is largely a cumulative result of long-term land-clearing decisions and management practices that begin long before social media was introduced. Currently, farmers have already deforested up to 80% of their available land, meaning the potential for further clearing is inherently limited. This dynamic suggests that any fluctuations in pasture percentage are more likely to follow a predictable sigmoid or logistic pattern rather than respond to short-term information interventions like those we analyze. Remote sensing data from Map Biomas further supports this notion, showing that the rate of pasture expansion has historically followed a logistic trend, with annual increases slowing as land availability becomes constrained (Figure A1). Given this long-term, gradual progression, we believe pasture percentage serves as an appropriate placebo to test our identification strategy, as it should not be affected by recent social media activity or other treatments post-2009.
Difference-in-differences (DID) estimations
Table 3 includes the four treatment categories and two columns for each category, one with the same set of controls used in the propensity score matching included in the DID regression and one without the controls. The household controls should not impact the results of the estimation as long as the DID is identified correctly (and there are no errors in the data) but are included for this comparison. The outcome variables include Pasture/Cattle Practices and our placebo Pasture, percent. We also provide the estimation results for the individual categories that make up these combined practices. First, we find that mobile phones do not have significant impacts on any of our outcomes. On the other hand, there is a statistically significant 25% increase of cattle and pasture practices for those who use social media and a 14% increase for those who participated in extension visits. We also find marginally significant impacts of cooperatives on these practices, with the individual categories suggesting that that the impacts stem from the use of breeding, insemination and/or salt licks. Cooperative membership increases the probability of using these practices by about 12%. We do not find significant impacts on our placebo for any of the treatment groups. We also do not find any practically significant differences in our results when we add the household controls. These results suggest that social media (and sharing of videos and images and two-way communication that this medium allows) and extension (and in-depth information from an expert source) are more successful in spreading information about agricultural practices than is the case for mobile phones (and therefore communication via phone conversation and/or internet searches) and/or cooperatives (and therefore communication via less-frequent face-to-face meetings).
Difference-in-differences estimations
Notes: Each cell represents a different estimation of the ATT under the different treatment as identified by the column headers. For example, the top left cell is the estimated impact of social media on pasture and cattle practices. The difference-in-difference estimators are estimated in Stata with Poisson fixed effects (xtpoisson) for the grouped categories, with a logit fixed effects (xtlogit) for the individual categories, and with fixed effects (xtreg) for the estimation of pasture. Controls include education of the household head(s), number of family members, experience farming, dry season rainfall, and rainy season rainfall. The incidence rate ratios (xtpoisson), marginal effects (xtlogit), and coefficients (xtreg) are reported in the main table rows. The xtlogit estimations have fewer observations since fewer households use these individual practices. Robust standard errors are in parentheses. * p<0.10 ** p<0.05 *** p<0.01.
Propensity score matching estimates
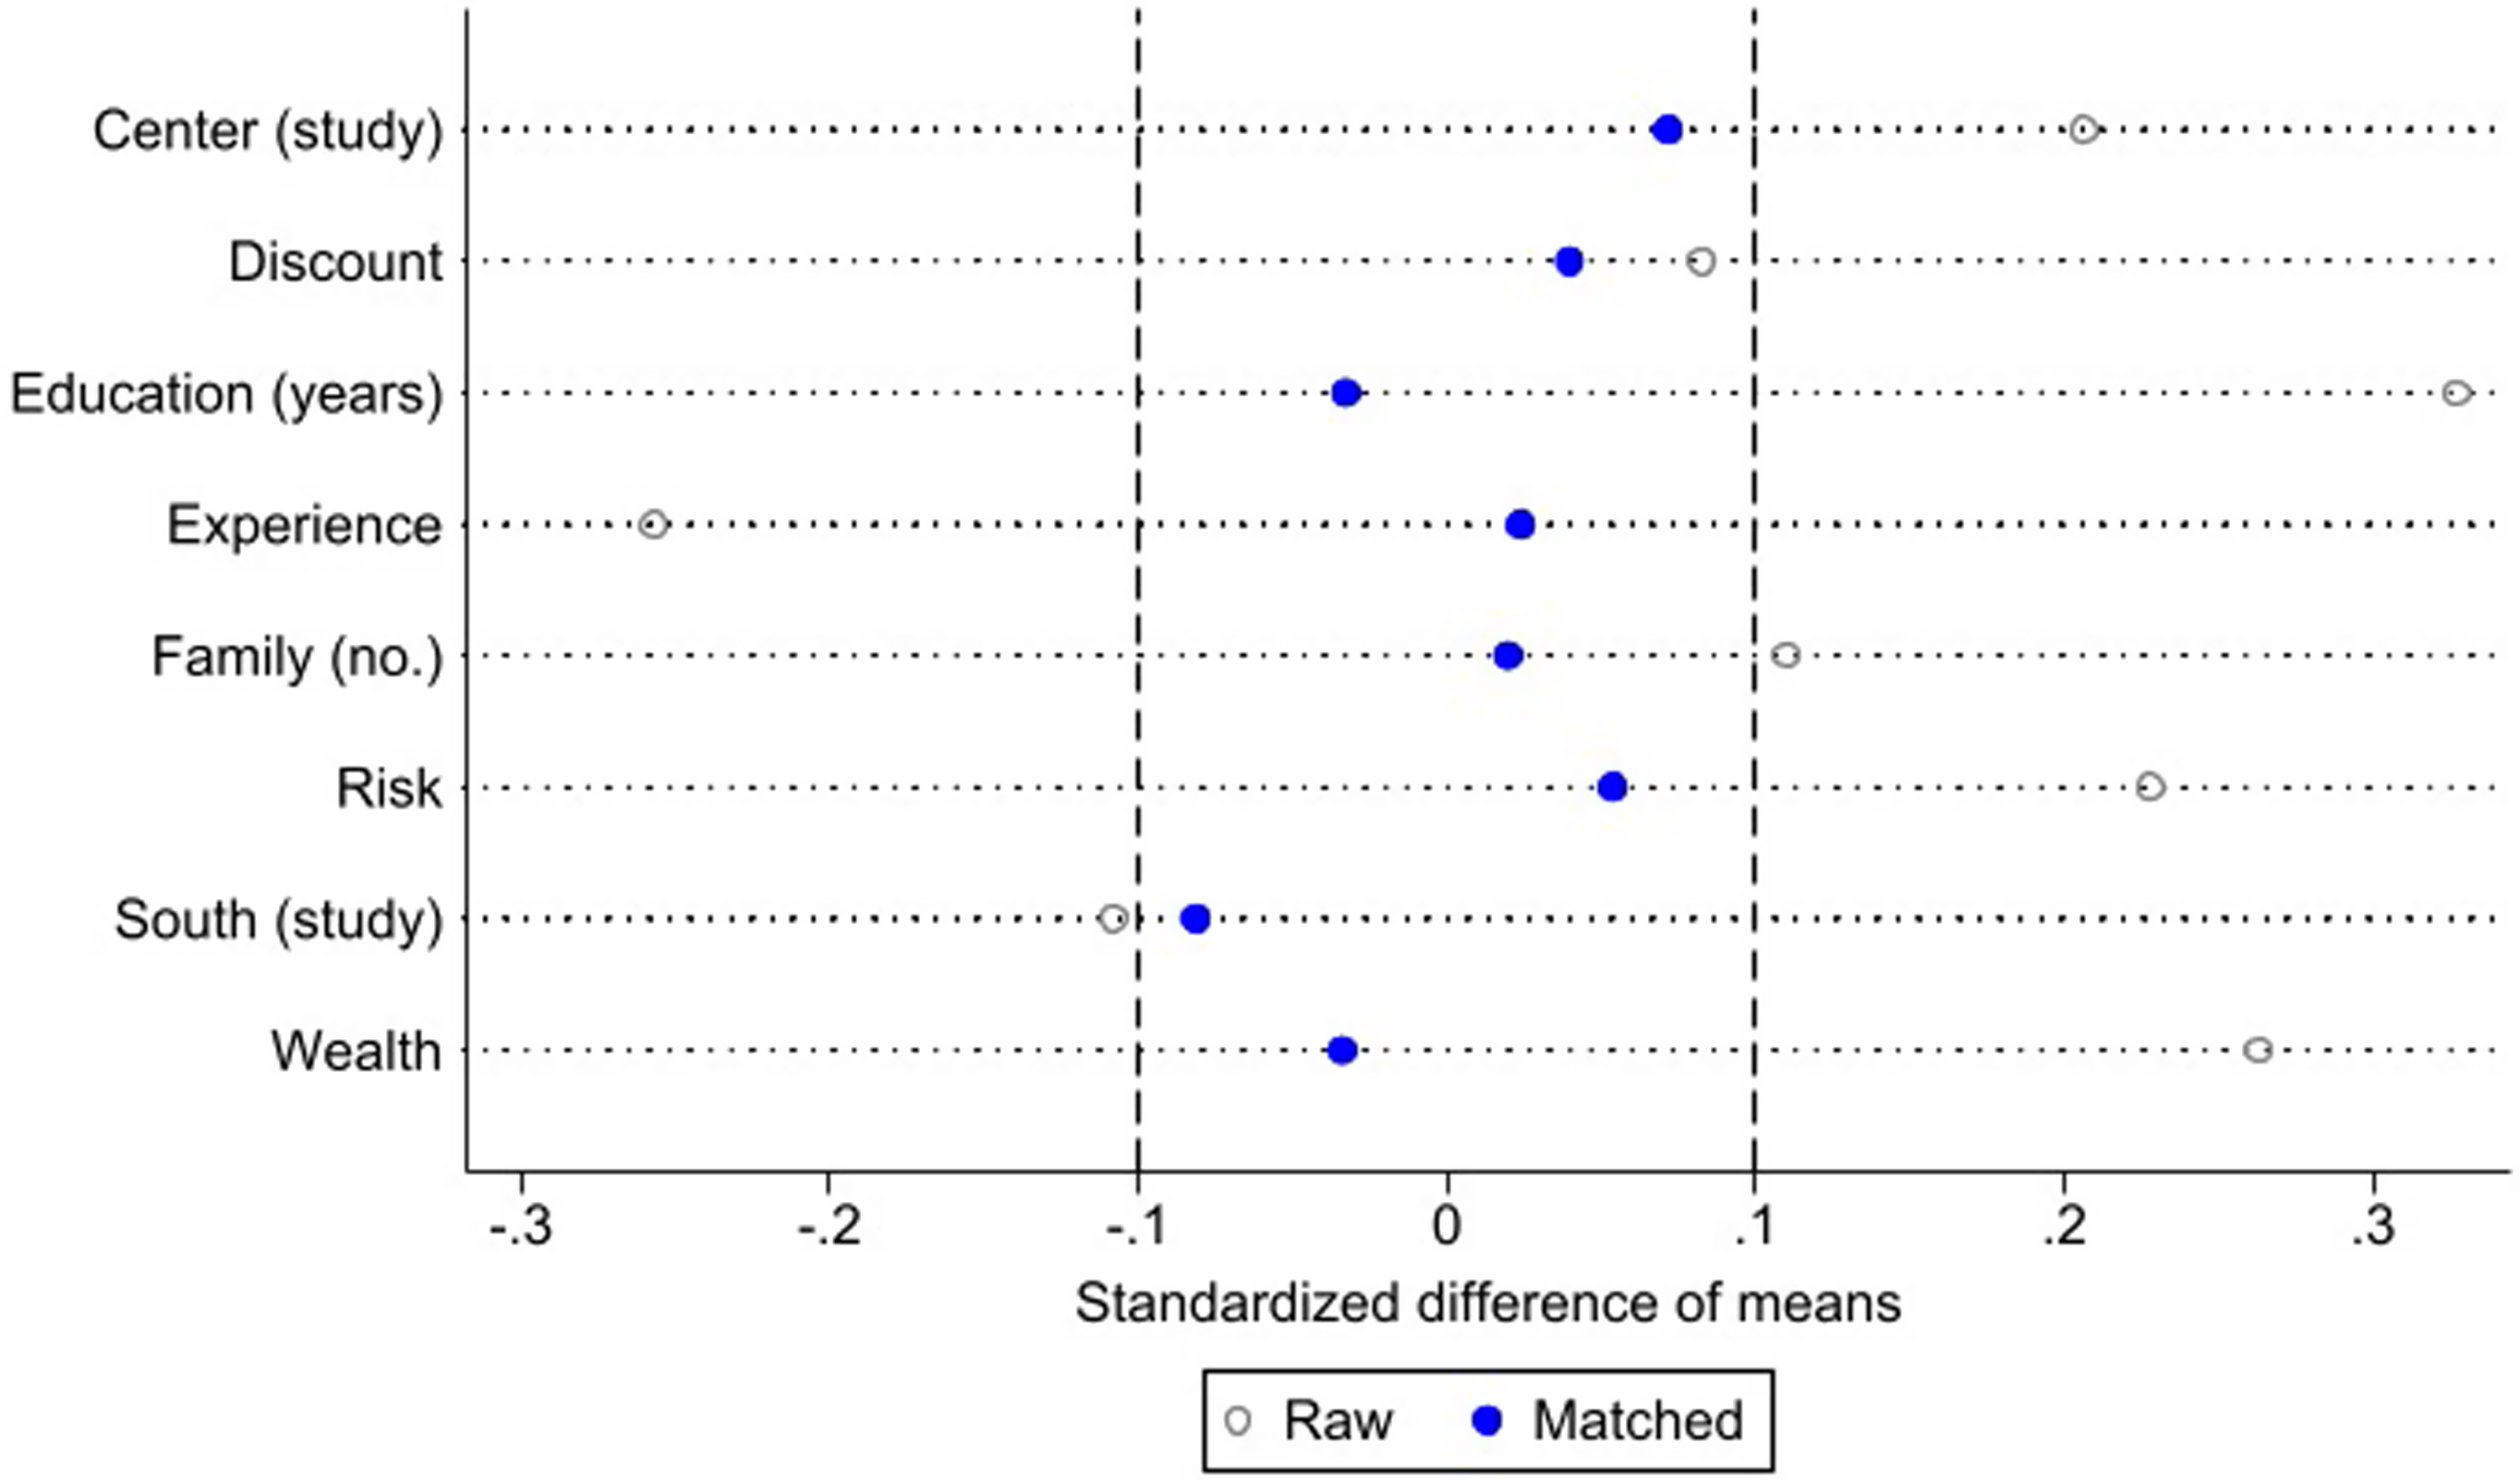
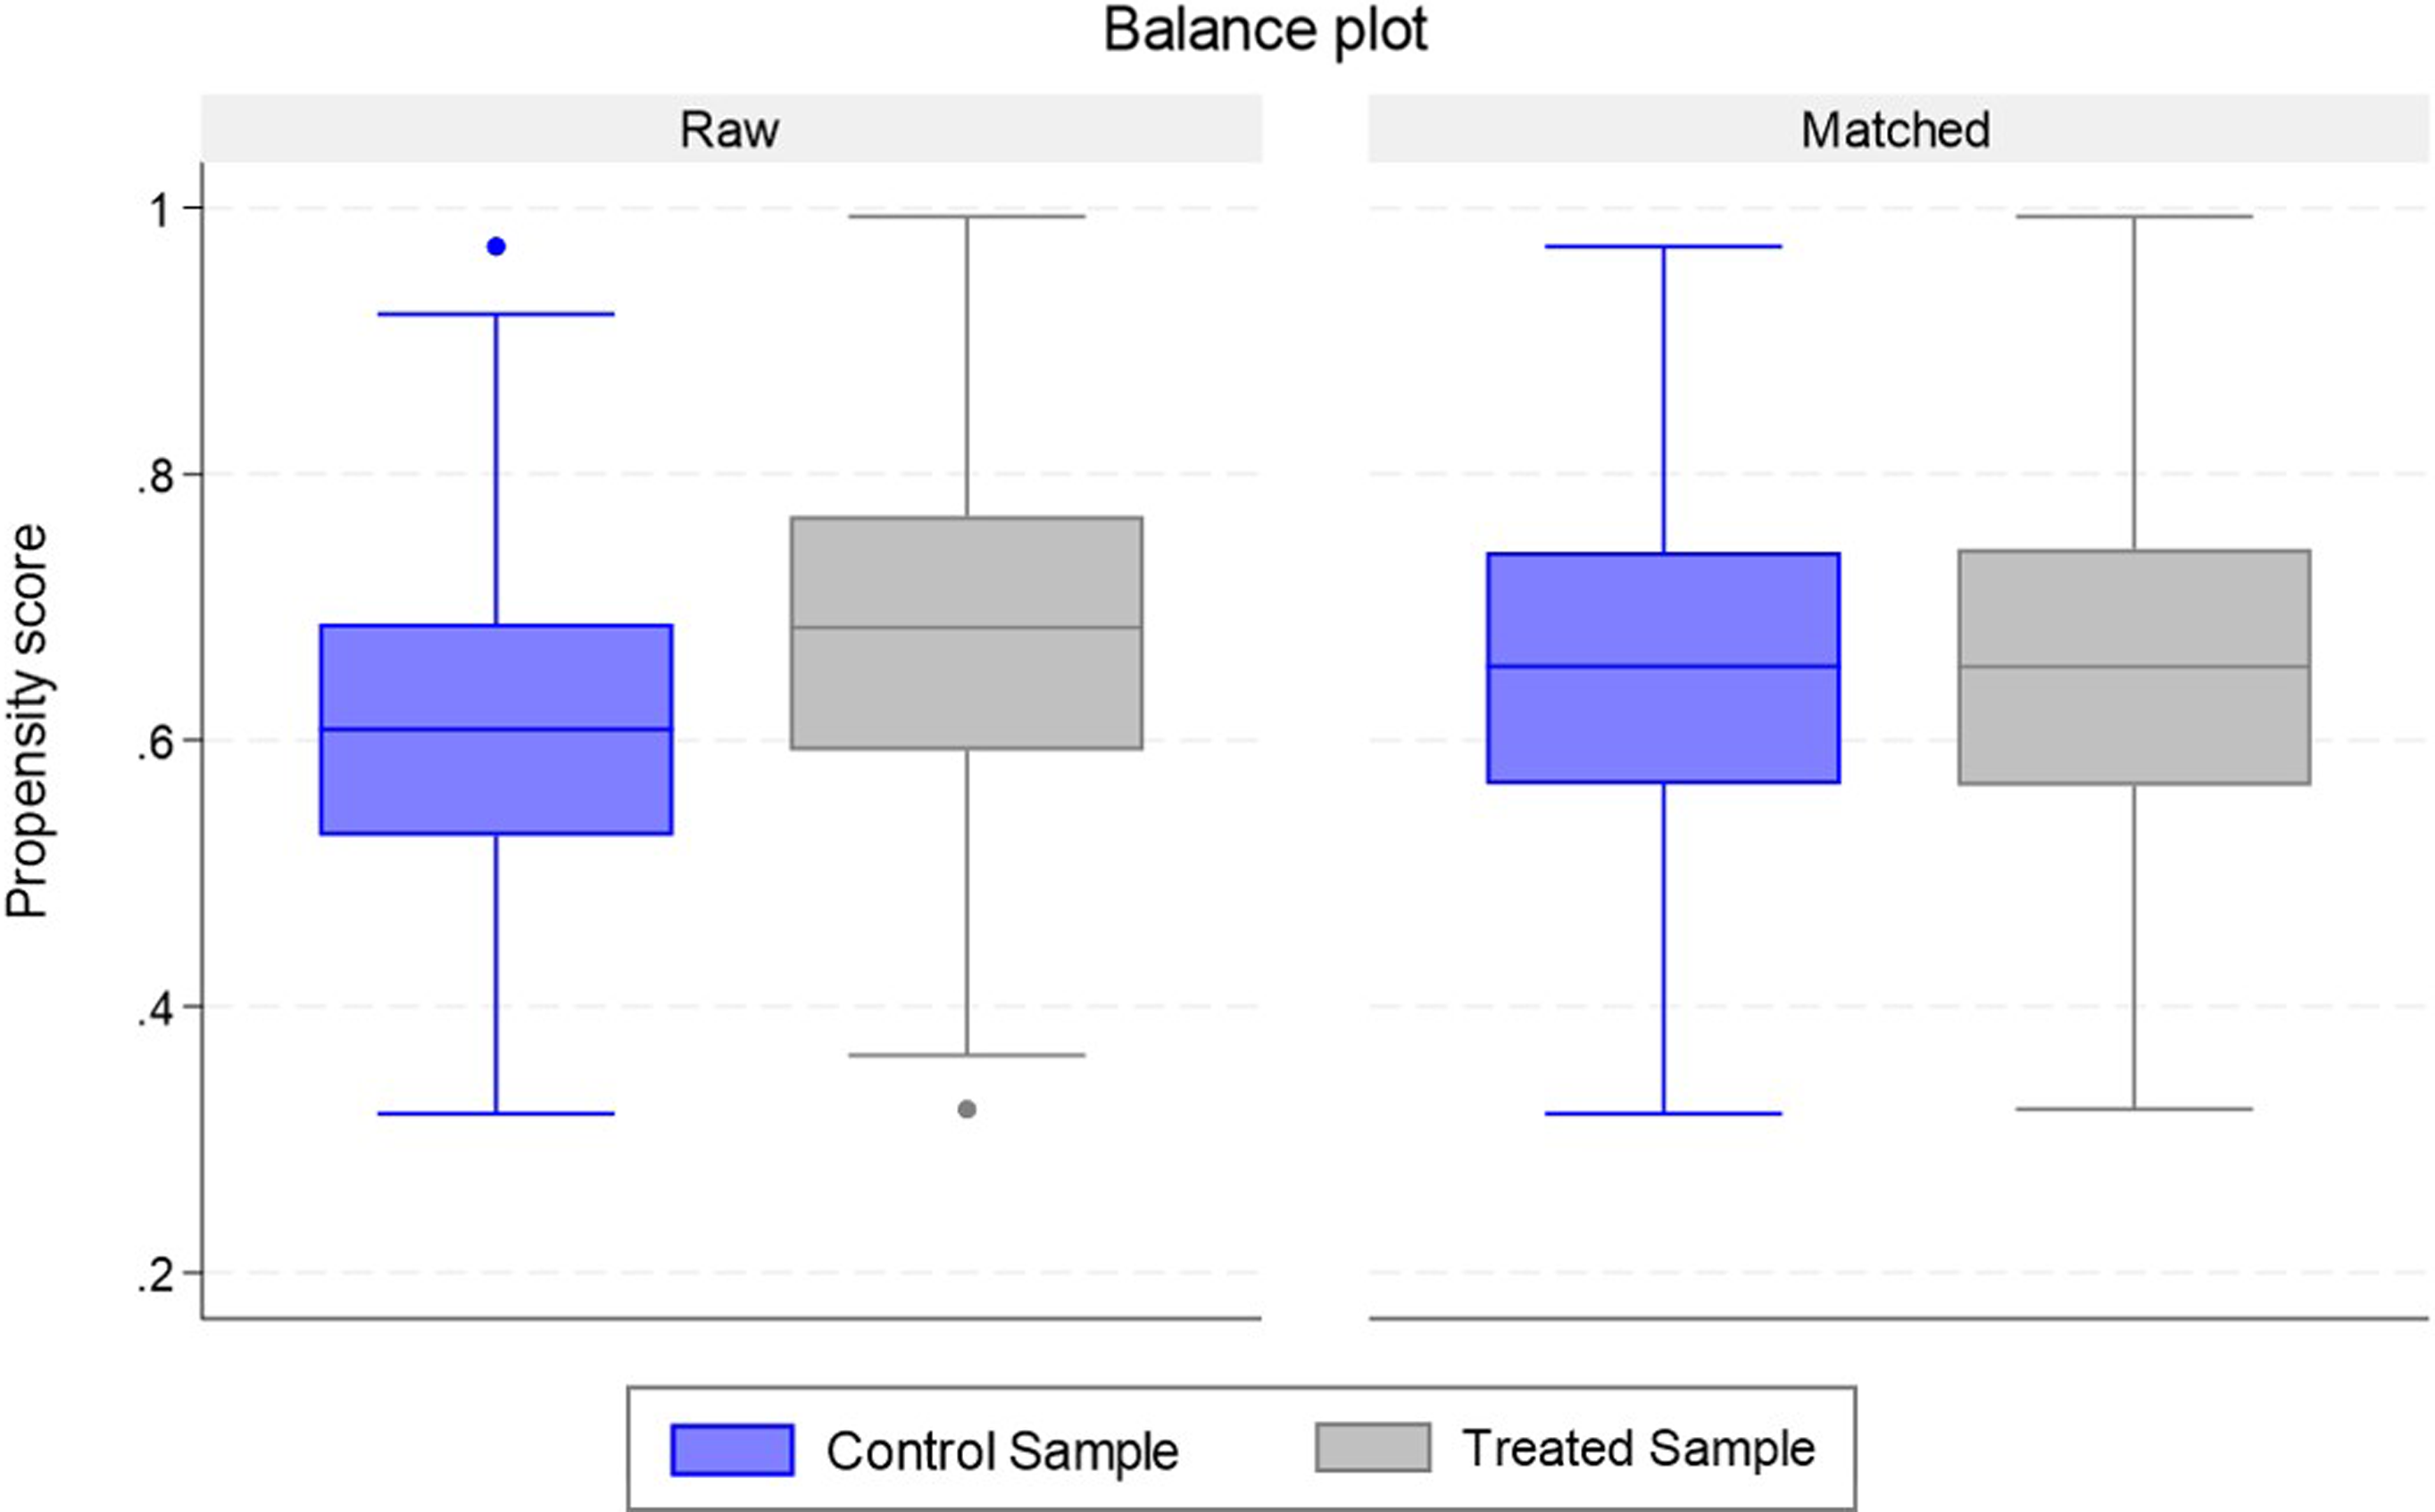
We next turn to the results from the propensity score matching, focusing on the same four treatments. We match on the covariates outlined in Table 2 in addition to dummy variables for the study regions (Figure 1) and find that matching improves the balance of our sample. First, a comparison of the standardized differences in the means for the unmatched and matched samples, suggests that each of the covariates contributes to improving balance. The matched sample has standardized differences that are all between –0.1 and 0.1. Only one of these covariates (willingness to discount the future) is within these bounds prior to matching (Figure 3). Second, a comparison of the propensity score distributions of the raw and matched samples suggests that the propensity scores of the matched sample are more similar than the raw (unmatched) samples (Figure 4).
Propensity Score Matching Improvement in Balance. This figure provides a comparison of the standardized dierences in the means for the unmatched and matched samples. The matching covariates are presented in Table 2. The matched sample has standardized dierences that are all between –0.1 and 0.1 providing evidence of a relatively good post-matching balance.
Balance Plot. This figure shows the propensity score balance for the control and treated samples before and after the matching. The improvement in balance (at least according to the propensity score) is evidenced by the increase in similarity of the box plots between the two samples after the matching.

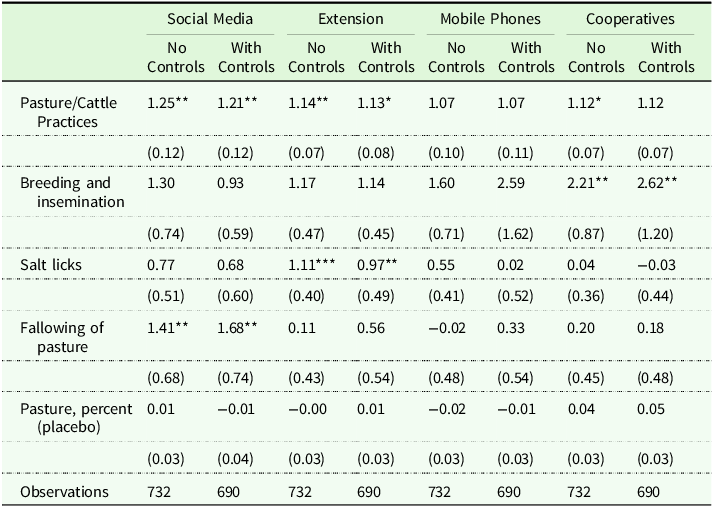
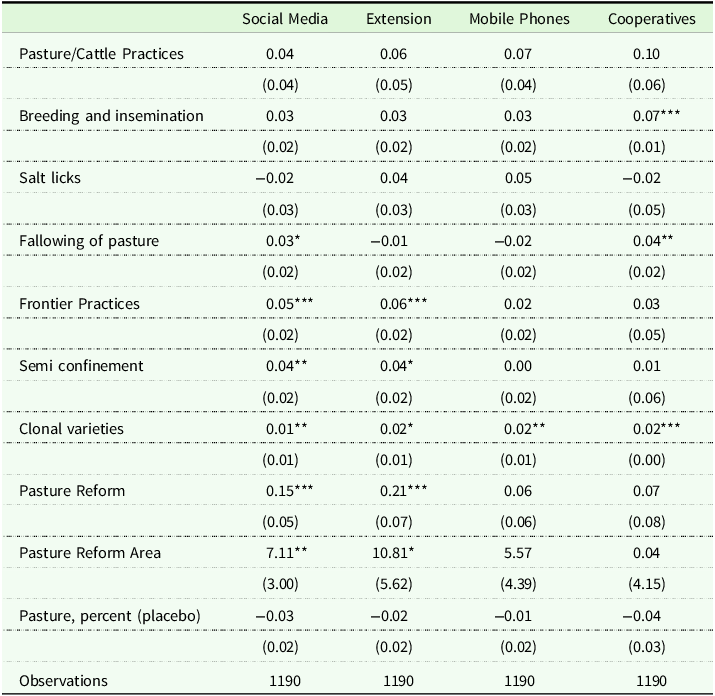
The results of the PSM estimates in Table 4 reinforce our previous estimates; however, our findings differ in some ways as compared to the DID analysis. First, for Pasture/Cattle Practices, the coefficient for the Social Media treatment is positive, but not statistically significant. This result differs in size and significance as compared to the results in Table 3, although we do find impacts on our placebo (explained below) to be consistent between these two estimation methods. Even though the PSM model includes a larger sample size (1190) as compared to the DID estimates (732), and a larger sample size generally provides more statistical power, in this case, the DID estimates are more defendable as they explicitly account for changes in outcomes over time for both the treated and control groups (and are a more effective way to address unobservable factors). While we continue to observe no effect of cooperatives on Pasture/Cattle Practices, the division of this category into its individual components suggests that membership in cooperatives is associated with higher probability of the adoption of breeding and insemination, fallowing of pasture and colonal varieties of pasture grasses.
Propensity score matching estimations

Notes: Each cell represents a different estimation of the ATT under the different treatment as identified by the column headers. Estimation coefficients are in the main table rows. Standard errors are in parentheses. * p<0.10 ** p<0.05 *** p<0.01
Next, in regards to pasture reform, we find that social media and extension both have a significant and positive impact on whether a household uses pasture reform or not. Households that use social media are 15 percentage points more likely to reform pasture relative to a sample mean of 43%, while those who had extension visits are 21 percentage points more likely to reform pasture. In addition, social media has a positive and statistically significant impact on the area that is in reform, with approximately 7.11 more hectares that have been reformed, while extension has a larger impact of 10.81 more hectares. However, we find that these results are statistically similar (Table A1).Footnote 4 We also find that social media and extension positively and significantly impact the use of frontier practices. Households that use social media adopt 0.05 more frontier practices (of a potential total of 2), while those that have had extension visits adopt 0.06 more frontier practices. These represent increases of 71% and 86% respectively compared with mean levels of adoption. Our overall findings suggest that social media and extension positively impact the adoption of agricultural practices while the results are less consistent for mobile phones and cooperative memberships. We, again, find no significant impacts on our placebo for any of the treatment groups, validating our theoretical framework and providing additional confidence in our results.
Our last set of results can be found in Table 5, where we investigate how social media and extension visits interact. These estimations (unlike those above) include social media, extension visits, and the interaction of the two treatments. Each row (instead of each table cell) contains the results from a single model that includes the two treatments and the interaction. These estimations are divided into two panels. Panel A includes the DID estimates. Panel B includes the PSM estimates.
Estimations with social media and extension visit interactions
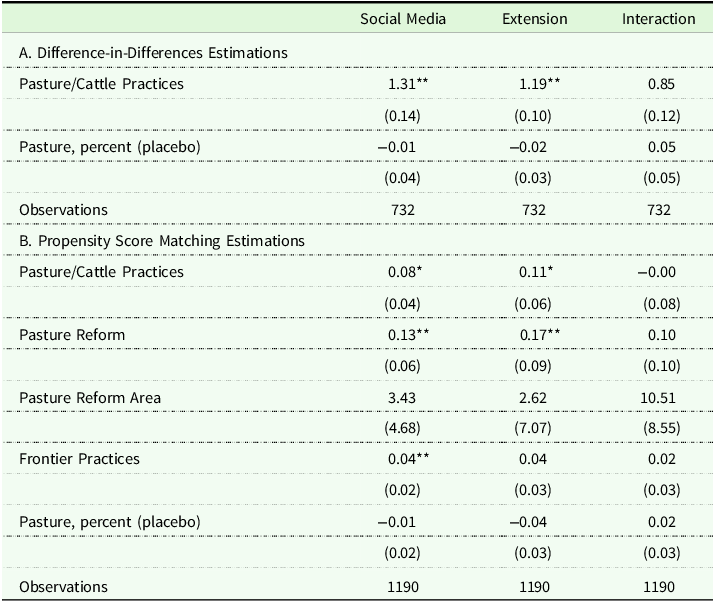
Notes: Each row represents a different estimation of the ATT with the social media treatment, technical visits (dummy), and the interaction of the two treatments. The estimations of these treatments on the different practice choices are identified in the row labels. The incidence rate ratios (xtpoisson) and coefficients (xtreg and PSM) are reported in the main table rows. The difference-in-difference estimators in Panel A are estimated as in Table 3 without the controls and with the interaction (with xtpoisson and xtreg as in Table 3). The matching (PSM) estimates in Panel B are OLS estimates made with the matched sample identified in Table 4 and the interacted treatments. Standard errors are in parentheses. * p<0.10 ** p<0.05 *** p<0.01.
We begin with Panel A. In this panel, we investigate the effect of Social Media, Extension, and their interaction on Pasture/Cattle Practices. According to these estimates, the social media treatment increases Pasture/Cattle Practices by 31% (of a total of 4) while extension visits separately increases the number of practices by 19%. The interaction of these treatments shows a positive, but insignificant, effect of 0.85, suggesting that these two treatments operate independently of one another. Our placebo again shows no evidence of significance.
The PSM estimates in Panel B tell a similar story: Pasture/Cattle Practices and Pasture Reform are impacted by social media (and marginally by extension in the case of pasture reform) but the interaction effects are no different from zero. The interaction effects are also zero for the area of pasture reform and the frontier practices along with the separate treatment effects, suggesting that the either the model is underpowered or that social media and extension contribute to adoption of these practices in similar ways. Across our models, we largely find that social media and extension each influence adoption of agricultural practices, but that social media and technical visits neither crowd-out nor strengthen one another.
Robustness checks: panel attrition
The last set of estimates that we consider are those to address any potential bias introduced by panel attrition. The panel data include farmers who were interviewed in both field campaigns. We interviewed 593 households in 2009 and were able to track down and interview 366 of these same households in 2019. To investigate any potential sources of bias, we first compare the characteristics of the 2009 panel households with households that dropped out of the panel and find that there are no statistically meaningful differences in these two samples in the base year, the with exception of farming experience (Table A2). Households who remained in the sample were significantly more experienced farming on their properties (i.e. had been living on their properties longer) in 2019. We account for this by including farming experience as a control variable in our regression models. Additionally, to further mitigate concerns about attrition bias, we run the PSM estimations with this smaller sample of households in the panel (using 2019 data) and find these results are qualitatively similar to the estimations that draw from the larger cross section (Table A3). Last, we divide the 2019 sample between those in the panel and those in the added as the “new” sample and compare the four treatments and again find minimal difference between these samples (Table A4).
Conclusion
Less than 7% of Brazilians reported using social media in 2005, but by 2019 this was 76% on average in the nation and between 68 and 69% in the most rural and remote regions of the country. Even though a substantial uptake by any standard, there is little study of the impact of this uptake in this and other places as remote as the Brazilian Amazon. Our study focuses on the role that social media and alternative mechanisms such as mobile phones, farmer cooperatives and extension visits can play in disseminating information on agricultural practices. Our conceptual framework outlines how ICTs and traditional mechanisms for information dissemination create and develop social capital and provide access to, and trust in, new information. This framework highlights that social media differs from other forms of communication in that it both expands an individual’s network of weak ties (i.e. their bridging social capital) and enhances their strong ties (i.e. their bonding social capital).
Overall, our findings highlight potential benefits of social media in relatively remote rural areas. In our study region, family farms are fairly large at around 70–100ha. This means that individual farmers are physically distant from their neighbors and from other resources such as providers of technical assistance. One-way sources of information such as radio and internet can provide access to knowledge about new farming methods or market opportunities, but social media has more potential for a greater reach and impact because this medium is more likely to provide information that is tailored to the needs and context of the individual farmer (Baumgart-Getz, Prokopy, and Floress Reference Baumgart-Getz, Prokopy and Floress2012; Llewellyn Reference Llewellyn2007). Furthermore, the two-way communication creates the opportunity to enhance trust in the information that is shared. This can have negative consequences, for example with the spread of disinformation related to health or politics. However, our analysis shows one way in which these features may be harnessed to support potential improvements in rural productivity.
Our main results use DID methods to control for unobservable time-invariant differences between farmers who do and do not use social media or access information via mobile phones, farmer cooperatives or extension visits. We see large effects of social media on the adoption of farm practices aimed at improving cattle and pasture productivity. Farmers who began using social media increased the number of traditional practices used by an average of 25%. They also increased the use of the most advanced practices, that we consider to be on the technology frontier for the study region, relative to the mean level of adoption in this sample in 2019. There is considerable evidence that the climate is changing in the Amazon, with more frequent droughts and longer dry seasons. In this context, the frontier practices that we study, namely pasture rotation, clonal varieties of grasses for pasture and the use of semi-confinement for cattle are pivotal for adaptation to increasing water scarcity and its impacts on farm productivity. The latter two practices are least likely to be familiar to farmers or their direct peers, suggesting that social media’s role in developing bridging social capital in the form of weak ties may contribute to the observed relationship. The PSM results control for observable differences between social media users and non-users, but not time-invariant unobservable differences. As a result, we consider them relatively weaker. However, they allow us to examine adoption of a wider range of farm management practices in a more diverse sample of farmers. They support the overall findings of a positive impact of social media use on adoption of new practices, in particular the frontier practices as well as pasture reform.
We also identify evidence that extension visits increase adoption of traditional and more novel management practices in our DID and PSM results. We do not see clear evidence of an interaction between social media and extension visits. Instead, they appear to operate independently of one another. This suggests that there could be potential for extension visits to be more impactful if these visits were combined with social media communications to provide more detailed or follow-up information or to encourage farmers to share new information with their personal networks.
The effects of mobile phone ownership on adoption of new technologies and management practices are not significant in many of the models we estimate. This may be because there is more limited variation in mobile phone ownership, particularly by 2019 where 91% of respondents in the survey had a phone. Where an effect of mobile phones was identified, the numbers of innovative practices adopted by those with mobile phones was higher than by those without (but smaller in size compared to those who use social media). We do not distinguish between smart phones that can access the internet and social media vs. older mobile phones that can only be used for phone calls and text messages. However, anecdotally, most of those with phones in 2019 had smart phones while the proportion was smaller in 2009. Therefore, the effect of mobile phone ownership is likely to now capture pathways that operate through calls and text messages with people within an individual’s close network and also those that operate through access to online information.
Our results suggest no effect of farm cooperative membership on adoption of traditional or frontier practices. However, when we divide these categories into their separate components, we do see impacts on individual practices (such as breeding and insemination, fallowing and semi-confinement) Since cooperatives strengthen existing close relationships (i.e. enhance bonding social capital), while social media can also expand an individual’s range of weaker ties, this indicates that a more diverse network is important for learning about potential technologies, particularly the most novel ones.
Finally, our results are similar to Fu and Akter (Reference Fu and Akter2016) in that they suggest that social media is an effective way for extension agencies to reach farmers. Farmers in our survey identified information on agricultural practices as an important use of social media. A systematic review of the Facebook pages and profiles of the four most important extension agencies in the study region suggests that their almost daily posts focus on information about, and “how to” videos on, agricultural practices. Our survey results indicate that 65% of respondents use social media to connect with other farmers and communicate with experts who are not part of their offline network. And, while our data suggest that extension visits are down from an average of 0.59 per household in 2009 to 0.30 in 2019 these social media postings appear to have replaced some of these visits. While we do not know if the source of this decline in visits was due to budget cuts or a concerted strategy to reach farmers with videos posted online and shared using social media, our results show that social media users are receptive to introduction of new farming technologies and therefore that this is a potentially productive avenue to pursue.
Supplementary material
The supplementary material for this article can be found at https://doi.org/10.1017/age.2025.18
Data availability statement
The data used in this paper are derived from field work and a survey that are described in the paper. These data and the code used for the paper analysis are stored at Zenodo, a free and open research repository developed by CERN and OpenAIRE to preserve research data and other outputs: https://doi.org/10.5281/zenodo.15230625
Acknowledgements
We would like to thank the farmers who participated in our survey and the many undergraduate and graduate students at Rondônian universities for conducting the surveys. We are indebted to the farmers for their willingness to share information about this region and their lives and to the students for learning along with us. We also thank our project collaborators including Andrew Bell, Trent Biggs, Fernando de Sales and Erin Sills for their continued collaboration and support and Marin Skidmore for her assistance with the administration of our pilot and main survey.
Funding statement
This work was supported in 2019 by the National Science Foundation under grant CNH-1825046 and in 2009 by the National Science Foundation under grant SES-0752936.
Competing interests
There are no competing interests for these authors.


 Open access