





Introduction
Many types of political behaviour rely on perceptions about other people. From our capacity to vote strategically, participate in collective action, or adhere to political norms, our individual actions depend on what we believe others are likely to think and do.Footnote 1 But these perceptions are prone to error, with people tending to ‘project’ their own views and behaviours onto others, overestimating how widely they are shared (Ross, Greene, and House Reference Ross, Greene and House1977; Mullen, Atkins, Champion et al. Reference Mullen, Atkins, Champion, Edwards, Hardy, Story and Vanderklok1985; Davis Reference Davis2017). Most evidence of projection comes from wealthy countries, where information is accessible and politics relatively stable (e.g., Castelli and Carraro Reference Castelli, Arcuri and Carraro2009; Lerman and Sadin Reference Lerman and Sadin2016; Furnas and LaPira Reference Furnas and LaPira2024; Turnbull-Dugarte and Wagner Reference Turnbull-Dugarte and Wagner2025). In lower-income contexts, where politics is more high-stakes and uncertain, the costs of misperception are far greater (Riedl and Lupu Reference Riedl and Lupu2013; Dunning, Grossman, Humphreys et al. Reference Dunning, Grossman, Humphreys, Hyde, McIntosh and Nellis2019). As yet, we know little about how projection operates in these settings. In this research note, we fill this empirical gap.
We show that voters in a low-income setting project their partisanship, ethnicity, and political participation. This ties into broader dynamics in low-income states, where perceptions of others form an essential part of everyday political life. With limited access to reliable information, citizens lean heavily on informal networks, party mobilisation, ethnic cues, and personal experience to make decisions (Conroy-Krutz Reference Conroy-Krutz2013; Cheeseman, Lynch, and Willis Reference Cheeseman, Lynch and Willis2021). Biases in these perceptions can have significant political consequences. For instance, miscalculating voting patterns in one’s community may affect the provision of goods and services from the centre (Ichino and Nathan Reference Ichino and Nathan2013; Adida, Gottlieb, Kramon et al. Reference Adida, Gottlieb, Kramon and McClendon2020). Engaging in costly forms of political participation without others might bear private costs without public gain (Olson Reference Olson1971; Ellis and Fender Reference Ellis and Fender2011). Overestimating support for one’s party might call election integrity into question when that party loses (King, Kerr, and Wahman Reference King, Kerr and Wahman2024). Misjudging support for opposition groups might constrain the ability to vote strategically and defeat dominant parties (Howard and Roessler Reference Howard and Roessler2006; Arriola Reference Arriola2013).
We draw on original survey evidence from Malawi, using bespoke outcome questions in a pre-registered fixed-effects design. By comparing individuals living within the same communities, we demonstrate that respondents consistently perceive their own party and ethnic group as more locally prevalent than others. Furthermore, individuals who participate more in political activities believe that others share similar levels of engagement. Our findings are robust across alternative modelling choices and consistent across education and information-based subgroups, though some effects on ethnicity are more limited in urban environments and among those of mixed heritage.
Providing this empirical update contributes to several strands of literature. First, we speak to general debates about how people form perceptions of others, adding to work on the role of personal experience, social networks, and the local environment in evaluating wider political phenomena (Berelson, Lazarsfeld, and McPhee Reference Berelson, Lazarsfeld and McPhee1986; Sinclair Reference Sinclair2012; Nathan and Sands Reference Nathan and Sands2023). Second, we contribute to more specific literature on political dynamics in low-income states, with projection reflecting an important microfoundation with implications for the study of clientelism, strategic voting, political participation, and confidence in elections (Riedl and Lupu Reference Riedl and Lupu2013; Adida, Gottlieb, Kramon et al. Reference Adida, Gottlieb, Kramon and McClendon2020). Third, we highlight several avenues for future research. This includes connecting our findings with ongoing efforts to correct misinformation across the Global South and extending our analyses to new contexts and different political actors (Jablonski and Seim Reference Jablonski and Seim2024; Pereira Reference Pereira2021; Furnas and LaPira Reference Furnas and LaPira2024; Badrinathan and Chauchard Reference Badrinathan and Chauchard2024).
In what follows, we briefly review existing literature on projection and its application to political phenomena, before introducing the Malawian case and pre-registered expectations, our original data and research design, and results. We conclude by discussing implications for a range of political phenomena germane to politics in low-income environments and beyond.
Background
Scholars have long shown that people think their own attitudes and behaviours are common among others. For example, nearly a century ago, Katz, Allport, and Jenness (Reference Katz, Allport and Jenness1931) found that students who cheated on tests tended to think more of their peers also cheated. Psychologists have referred to this phenomenon as a false consensus bias, in which individuals project knowledge about themselves onto others (Jones and Nisbett Reference Jones and Nisbett1971; Ross, Greene, and House Reference Ross, Greene and House1977). This pattern has been documented in multiple studies across a range of phenomena (Ross, Greene, and House Reference Ross, Greene and House1977; Mullen, Atkins, Champion et al. Reference Mullen, Atkins, Champion, Edwards, Hardy, Story and Vanderklok1985; Marks and Miller Reference Marks and Miller1987; Krueger and Clement Reference Krueger and Clement1994; Burghartswieser and Rothmund Reference Burghartswieser and Rothmund2021). Recent work has linked it to foundational questions in political behaviour, from affective polarisation (Turnbull-Dugarte and Wagner Reference Turnbull-Dugarte and Wagner2025) to perceptions of political actors (Castelli and Carraro Reference Castelli, Arcuri and Carraro2009; Lerman and Sadin Reference Lerman and Sadin2016) and ways political elites learn about constituents (Pereira Reference Pereira2021; Furnas and LaPira Reference Furnas and LaPira2024).
There are several explanations for these effects. False consensus may reflect perceptual distortions, arising from selective exposure to those more similar to oneself (Tversky and Kahneman Reference Tversky and Kahneman1973; Ross, Greene, and House Reference Ross, Greene and House1977; Sherman, Presson, Chassin et al. Reference Sherman, Presson, Chassin, Corty and Olshavsky1983). It may also be driven by dissonance reduction, where perceiving one’s views and behaviours as widely shared makes them feel more rational (Marks and Miller Reference Marks and Miller1987).Footnote 2 These effects are relative, with existing work rarely distinguishing overestimation of like-mindedness from underestimation of those who are different. Rather, existing work shows only that estimates are higher for individuals who themselves hold the relevant attitude or behaviour (Mullen, Atkins, Champion et al. Reference Mullen, Atkins, Champion, Edwards, Hardy, Story and Vanderklok1985: 263).
Previous research on projection has focused on wealthy, information-rich countries in the Global North.Footnote 3 Most people, however, do not live in these sorts of places. Instead, the median global citizen lives in a relatively lower-income setting, where access to political information is constrained and politics more uncertain (Riedl and Lupu Reference Riedl and Lupu2013). Judgements about the actions and behaviours of others play a greater role in everyday political life, from coordinating around which party to vote for, to determining trust in election results, and to deciding whether to take part in costly forms of political participation (Howard and Roessler Reference Howard and Roessler2006; Adida, Gottlieb, Kramon et al. Reference Adida, Gottlieb, Kramon and McClendon2020; King, Kerr, and Wahman Reference King, Kerr and Wahman2024). As such, we might expect projection to be more likely to take hold and more consequential for political outcomes. But, as yet, we lack empirical examination of these questions.
Context and expectations
The case
We study Malawi, a multiparty democracy in Africa with uncertain politics and low economic development. The country fits many of the conditions under which projection should take place and shares similarities with other low-income states.
First, Malawian politics takes place in a low-information environment. Mass media access is limited outside urban centres, and Malawi is one of the most rural countries in Africa (Yeandle Reference Yeandle2025). Despite a relatively institutionalised party system, elections remain uncertain and party switching by lower-level candidates is common (Dulani and Dionne Reference Dulani and Yi Dionne2014; Young Reference Young2014; Wahman and Brooks Reference Wahman and Brooks2021; Wahman Reference Wahman2023). Politicians have little information about voter preferences (Jablonski and Seim Reference Jablonski and Seim2024), while voters distrust political messages, with over 60% believing parties ‘sometimes’ or ‘often’ say things they know are false.Footnote 4 Similar patterns characterise other low-income, low-information settings, where voters rely heavily on immediate surroundings, informal networks, and heuristics (e.g., Riedl and Lupu Reference Riedl and Lupu2013; Conroy-Krutz Reference Conroy-Krutz2013; Carlson Reference Carlson2016; Larson and Lewis Reference Larson and Lewis2017).
Second, relative to its wealthier counterparts, Malawian politics is a high-stakes activity for voters. Political considerations determine the provision of resources, public goods, and exposure to bureaucratic corruption (e.g., Dulani and Dionne Reference Dulani and Yi Dionne2014; Ejdemyr, Kramon, and Robinson Reference Ejdemyr, Kramon and Lea Robinson2018; Seim and Robinson Reference Seim and Lea Robinson2020; European Union 2020; Duchoslav, Kenamu, and Thunde Reference Duchoslav, Kenamu and Thunde2023). Making the ‘wrong’ political choices can be deeply significant, given many Malawians face shortages of food, water, and medical supplies (Jablonski, Seim, Barbosa et al. Reference Jablonski, Seim, Barbosa and Gibson2023; Jablonski, Seim, and Yeandle Reference Jablonski, Seim and Yeandle2026). These dynamics reflect broader patterns in Sub-Saharan Africa and other low-income states, where partisanship, ethnicity, and favouritism strongly influence distributive politics (e.g., Franck and Rainer Reference Franck and Rainer2012; Bates Reference Bates2014; Beiser-McGrath, Müller-Crepon, and Pengl Reference Beiser-McGrath, Müller-Crepon and Pengl2021).
Third, questionable election administration adds further weight to voters’ perceptions of those around them. Malawi’s 2019 elections saw significant irregularities and were overturned by courts, with sharp partisan divides in perceptions of election integrity (Nkhata, Mwenifumbo, and Majamanda Reference Nkhata, Mwenifumbo and Majamanda2021; Ahlback and Jablonski Reference Ahlback and Jablonski2025; Ahlback and Yeandle Reference Ahlback and Yeandle2025). Projection may limit authorities’ ability to rebuild trust if ‘losing’ voters overestimate support for their party and thus struggle to accept defeat. These challenges are common in low-income settings and risk undermining faith in democracy and fuelling political violence (Norris Reference Norris2014; Daxecker, Di Salvatore, and Ruggeri Reference Daxecker, Salvatore and Ruggeri2019). The potential consequences of misperceptions are thus substantial.
Taken together, these dynamics make Malawi a valuable case for studying social projection. The country has distinctive features, including its low urbanisation and comparatively institutionalised party system. Yet Malawi’s institutions align with the global median on V-Dem’s electoral democracy index, and its dynamics of distributive politics, uncertainty, and ethnic identity are widely shared in other low-income states (Yeandle Reference Yeandle2025). Studying projection in this context thus has more general implications.
Expectations
We study projection for three broad outcomes, salient to politics in both Malawi and lower-income states across the board. We build on a parsimonious set of hypotheses, each of which was pre-registered before commencing survey fieldwork.Footnote 5
The first is partisanship. We focus on Malawi’s two main political parties, the Malawi Congress Party (MCP) and Democratic Progressive Party (DPP), who collectively secured around 75% of the vote in the 2019 election. We suggest participants will estimate the prevalence of their party as being higher in their local area. This is an attitudinal or preference-based outcome, where respondents project their political beliefs onto those living around them.
H1: Supporters of a given political party assess the level of support for that party in their local area more highly than supporters of other parties do.
Second, ethnicity. In Malawi, ethnic identities are consequential. They generally correlate with party support and access to the spoils of victory, but also to corruption dynamics in interactions with the state (Seim and Robinson Reference Seim and Lea Robinson2020).Footnote 6 While some types of ethnicity are more visible and politically useful than others (Robinson Reference Robinson2024), they remain a more ‘immutable’ and noticeable category than partisanship. We thus see this as a demographic outcome to which people project their own characteristics.Footnote 7
H2: Members of a given ethnic group assess the share of co-ethnics in their local area more highly than members of other ethnic groups do.
Lastly, we study various forms of political participation, including taking part in protests or attending community meetings. These represent behavioural outcomes, moving beyond attitudes and characteristics. Some of these, like protests, might sometimes invoke private costs to participants until a critical mass of others take part. As such, projection might be a useful mechanism for understanding why some people take part nonetheless, before others join them.
H3: Respondents who participate in politics will assess the level of participation in their local area more highly than non-participants do.
In the pre-analysis plan, we also discuss why the relative magnitude of projection might differ across geographies. Individuals might project less to their immediate community than to their wider administrative area due to more intimate familiarity with the characteristics of geographically close community members. Alternatively, some types of objective politically relevant information, like election results, may only be available at those higher levels of aggregation, and so projection would be more local in scope.Footnote 8 We discuss these differences throughout the results section and present formal significance tests in the online supplementary materials.
Research design
Data
We fielded an original survey in Malawi in October 2024 focused on two of the country’s 28 districts, Blantyre and Salima. Sampling followed a multi-step process, in which 138 census-defined enumeration areas (EAs) were randomly selected, and 8-10 individuals were sampled in each through random walk protocols and within-household randomisation. The survey contained 1,243 respondents.
Since we focus on two districts, it is important to compare our sample with the wider population. In SM A, we do this by drawing on election results, census data, and a nationally representative survey. First, our sample has a highly accurate proportion of respondents from each major ethnic group compared to the census. Second, voter intentions closely resemble district-level vote shares from the 2019 presidential election.Footnote 9 Third, compared to individual-level Afrobarometer outcomes, our survey is significantly more urban than Malawi as a whole but otherwise closely matches national patterns of partisanship, ethnicity, education, gender, and age. This urban bias reduces concerns about Malawi’s relative lack of urbanisation, allowing us to test for urban-rural heterogeneity in our effects.
Measurement
We designed bespoke outcome questions to measure projection. First, we measure respondents’ own group membership, including their party, ethnicity, and level of participation. We then ask respondents how prevalent they believe each group is in wider society and test whether their own membership predicts this.
We measure perceptions at two geographic levels: community and district. Respondents are first asked about the prevalence of each group in their immediate community, classified as the relevant census-defined EA, and corresponding to very small geographic areas in which households are within walking distance of each other. While these are often socially meaningful, corresponding, for instance, to an entire small village or a small part of an urban neighbourhood, the precise spatial boundaries of one’s community are naturally subjective. To alleviate concerns about measurement error that this may bring, we also capture perceptions about group prevalence in the respondent’s district. Districts are an objective, larger, and well-known administrative unit in Malawi for which we may see different dynamics play out.
We measure community and district-level perceptions on an ordinal outcome scale, ranging from ‘None’, to ‘Very few’, ‘Some’, ‘Most’, or ‘All’. Questions’ wordings are in Table 1 below, and we present descriptive statistics in SM B. We initially planned to ask respondents to estimate a percentage, which we could in turn compare to objective figures, but had trouble communicating this to respondents in pilot testing. Using ordinal scales is commonplace in surveys across Africa, including in several questions of the Afrobarometer, but there is still a risk that respondents ‘anchor’ certain categories differently conditional on their own characteristics. For instance, groups in the local majority might interpret ‘Very few’ or ‘Some’ differently from those in the minority. In SM D we show our results are consistent across a dichotomised dependent variable which collapses these categories together.
Survey measures of projection

Table 1. Long description
A table with three columns and four rows comparing survey measures of projection. The columns are labeled Respondent’s own group, Community-level perceptions, and District-level perceptions. The rows are labeled Partisanship, Ethnicity, and Political participation. Each cell contains specific survey questions related to the row’s topic. The table provides a structured view of how different levels of perception are measured in surveys.
Empirical strategy
We examine respondents’ perceptions of how prevalent supporters of each political party, members of each ethnic group, and political participants are in their communities and districts. We model whether these perceptions are systematically related to respondents’ own group membership in a manner consistent with social projection.
Estimating these effects presents inferential challenges, since similar individuals tend to sort into the same geographic areas. For example, if ruling party supporters live in the same place, they might each report that a larger share of their community supports the ruling party. Rather than social projection, this would be an unbiased perception that reflects the actual composition of the area.
To account for this, we include community or district fixed effects. These adjust for baseline differences between areas, allowing us to compare in- and out-group members who live in the same place.Footnote 10 If respondents are fully informed about their local surroundings, then we would expect no systematic differences in perceptions between in- and out-group members after including fixed effects. If we do observe such differences, it therefore indicates a relative over or underestimation of group prevalence.
We estimate variants of the following equation for respondents i living in a community or district m: $group\;assessmen{t_{im}} = \;{\beta _1}own\;grou{p_i} + \;\gamma {X_i} + \;{\phi _m} + \;{\varepsilon _{im}}$
Here, group assessment is the respondent’s reported prevalence of each given group in their community or district. Own group, in turn, indicates whether the respondent is themselves a member of that group. Xi is a vector of individual-level demographic controls (age, gender, education, and wealth), which capture cross-sectional differences between individuals, even those living in the same place. Lastly, ϕm is a fixed effect for the relevant geographic unit, ensuring that we only ever compare respondents living in the same community or district. We use binary indicators of a respondent’s group membership and continuous measures of their perceived wider prevalence. Standard errors are clustered at the enumeration area level to reflect the sampling procedure of our survey.
We run separate regressions for each group. This results in four models for party support (supporters and voters of both the MCP and DPP) and ethnic identity (Chewa, Lomwe, Yao, and Ngoni) and five for political participation (attend community meetings, attend protests, join others, contact the media, and post on social media). Each model is estimated once on community perceptions, with community fixed effects, and once on district perceptions, with district fixed effects. Finally, we present results with and without the inclusion of demographic covariates, giving a total of 40 specifications reported in the main paper.
This approach allows us to leverage both fine-grained local variation at the community level and objective, recognisable administrative units at the district level. Community-level models reduce concerns about sorting, though they may bring in heterogeneous interpretations of what constitutes a ‘community’. District-level models provide a clear common reference point but lose some spatial granularity. We report results across both levels to ensure our findings are robust to either choice.
Lastly, while our design documents clear systematic trends in respondents’ perceptions, we do not make definitive claims about the mechanisms that underpin them. This is not unique to our study; in existing literature, the psychological processes through which respondents form and project beliefs remain something of a ‘black box’. There is ongoing debate as to whether projection is driven by overestimating one’s own group or underestimating others, which we make some effort to disentangle in SM D but cannot do completely. In addition, we cannot adjudicate conceptual debates in previous work about whether misperceptions stem from cognitive dissonance, perceptual distortions, or Bayesian updating.
Results
Main effects
We present our main results in the figures below and find evidence consistent with our pre-registered expectations. In each figure, coefficients represent the average difference in perceptions between in- and out-group members. Panel (a) shows results with community-centred perceptions and fixed effects; panel (b) for districts. Baseline specifications are in blue, and covariate-adjusted in orange. We standardise the outcome variable to allow for an easier comparison of effect sizes between models. We discuss differences in magnitude across community and district models in the text and present formal significance tests in SM E.1.
We start with partisanship. The results in Figure 1 show that respondents perceive their party as more popular in their community and district, relative to supporters of others. The effects are substantively large, equivalent to around a 75% to 85% standard deviation shift in voting intention and a 30% to 60% shift with party identification, each robust to the inclusion of demographic covariates. The findings provide support for H1, and effect sizes are statistically indistinguishable across community and district outcomes.
Projecting party support.
Note: Coefficients represent the marginal effect of supporting a given party (via party identification or vote intention) on the perceived support for that party in the community or district, compared to supporters of other parties.

Figure 1. Long description
The image contains two side-by-side graphs labeled a and b. Graph a shows perceived support for respondent’s party in the community, while graph b shows perceived support in the district. Each graph includes four horizontal lines representing different respondent groups: those who intend to vote for the MCP or DPP versus other parties, and those who identify as MCP or DPP versus other or no party. The x-axis represents the projection effect in percentage standard deviation, ranging from 0 to 100 percent. The y-axis lists the respondent’s own group categories. Baseline and covariate-adjusted data are depicted with blue and orange lines, respectively. The graphs indicate varying levels of perceived support based on the respondent’s political affiliation and voting intentions.
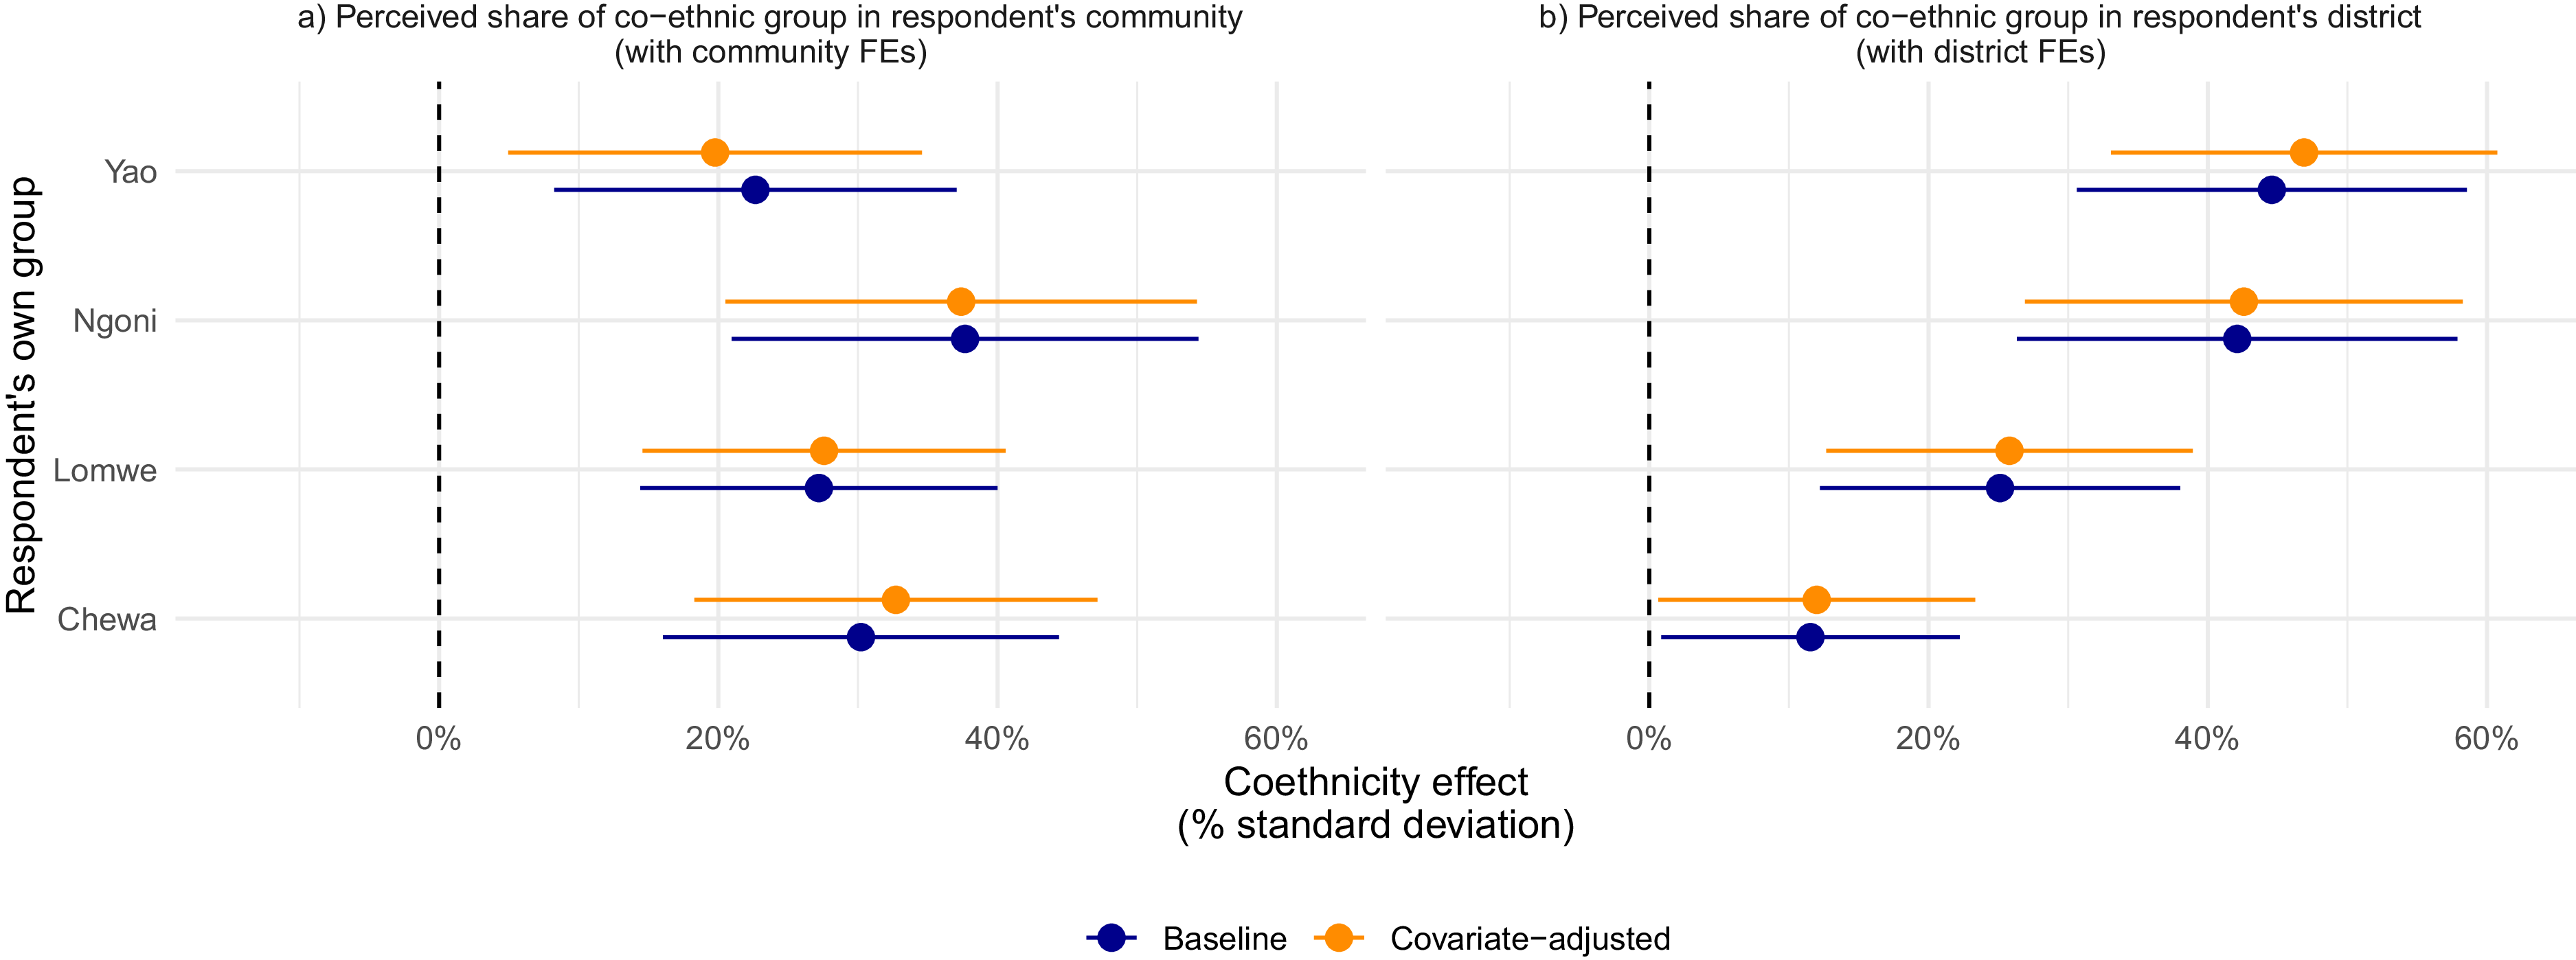
In Figure 2, we consider ethnicity. There is again evidence indicative of projection, with respondents reporting a higher prevalence of their own ethnic group, relative to members of others living in the same place. This persists when controlling for individual-level characteristics and is consistent with H2. Unlike partisanship, we observe slight differences between geographies. When using the district-level outcome, effect sizes are smaller among Chewa respondents (p = 0.011) and larger among Yao (p = 0.008), while Lomwe and Ngoni are indistinguishable. These dynamics provide mixed support for our hypotheses about the relative sizes of effects at the community and district levels.Footnote 11
Projecting ethnic identities.
Note: Coefficients represent the marginal effect of belonging to an ethnic group on the perceived share of that ethnic group in the community or district, compared to belonging to a different ethnic group. Specifications otherwise as in Figure 1.

Figure 2. Long description
The image contains two side-by-side graphs comparing the perceived share of co-ethnic group in respondent’s community and district. The left graph, labeled ‘a’, shows the perceived share in the respondent’s community with community fixed effects, while the right graph, labeled ‘b’, shows the perceived share in the respondent’s district with district fixed effects. Each graph features four groups: Yao, Ngoni, Lomwe, and Chewa. The x-axis represents the coethnicity effect in percentage standard deviation, ranging from 0 to 60 percent. The y-axis lists the respondent’s own group. Two sets of data points are plotted: baseline (blue) and covariate-adjusted (orange). The data points are accompanied by horizontal error bars indicating the range of uncertainty. The graphs illustrate how perceptions vary across different ethnic groups and contexts.
Lastly, in Figure 3, we turn to participation. Here, we focus on a number of ways people might take part in the political process, including attending protests, posting on social media, contacting the media, joining others to further a cause, and attending a community meeting. We recode individual-level participation as a binary outcome, equal to one if a respondent did the relevant activity at least ‘once or twice’ in the past year. Group-level outcomes remain continuous and standardised, as before.
Projecting political participation.
Note: Coefficients represent the marginal effect of political participation on the perceived share of others who participate in the community or district, relative to non-participants. Specifications otherwise as in Figure 1.

Figure 3. Long description
The image contains two side-by-side graphs comparing perceived political participation in respondent’s community and district. The left graph, labeled ‘a’, shows perceived political participation in respondent’s community with community fixed effects, while the right graph, labeled ‘b’, shows perceived political participation in respondent’s district with district fixed effects. Each graph has five categories on the y-axis: Attends protests, Posts on social media, Contacts media, Joins others, and Attends meetings. The x-axis represents the projection effect in percentage standard deviation, ranging from 0 to 120 percent. Two models are compared: Baseline, represented by blue dots and lines, and Covariate-adjusted, represented by orange dots and lines. The projection effect varies across different political activities, with some activities showing higher projection effects in the community context compared to the district context.
We again find significant, positive impacts across the board. This is consistent with H3. Those who individually participate more in politics perceive others, in their community and district, as also participating more. Coefficients hold after including demographic covariates and are statistically indistinguishable across geographic levels. The sole exception is attending a community meeting, where projection effects are smaller at the district level (p = 0.017) and lose significance with covariates. We see the greatest effects on protests, with those who personally attended a demonstration perceiving an 80%-85% higher community share.
Robustness
In SM D, we show robustness under different estimation and measurement strategies. These test, and, where possible, rule out alternative explanations for the results.
First, we vary the outcome. One concern is that our measure of perceptions might be interpreted differently by respondents and that our overall effects risk being driven by small movements between middling categories rather than a genuine divergence in perceptions. To mitigate this, we show that our results hold under a binary version of the dependent variable, clustering the middle categories (‘Very few’, ‘Some’, and ‘Most’) together in different ways. This suggests that our findings are not driven solely by ‘anchored’ differences between respondents.
Second, we vary the fixed effects. To address worries that respondents interpret their ‘community’ differently or that districts are too large to capture one’s local environment, we show that our findings persist when using mid-range ward and traditional authority fixed effects.
Third, we vary the control group. As discussed, our design cannot fully distinguish overestimation of one’s in-group from underestimation of out-groups. But to shed light on this distinction, we re-run our partisanship specifications using a more neutral control group comprised only of independent voters (rather than all out-group voters). This provides further evidence that MCP and DPP supporters do overestimate support for their own party and that they underestimate support for their opponents. While fully distinguishing these channels is complex and remains an important avenue for future research, our results suggest that overestimation drives a greater proportion of the overall effects we report.
Heterogeneity
We examine heterogeneity in our results to provide a richer understanding of projection dynamics. This centres around respondents’ ethnic heritage, education, access to information, and urban/rural location.
First, following a growing body of work on multi-ethnic voters in Africa, we pre-registered the expectation that respondents of mixed ethnic heritage would be less likely to project their nominal ethnic identity (Dulani, Harris, Horowitz et al. Reference Dulani, Harris, Horowitz and Kayuni2021; A. S. Harris Reference Harris2022). We present results in SM E.2 and find partial support. There is evidence of reduced projection among mixed-heritage respondents who nominally identify as Yao or Ngoni, but those from the larger Chewa and Lomwe groups see no differences.
Second, turning to more exploratory analyses, we examine whether projection is moderated by education. Better-educated voters might project less for many reasons, including greater cognitive capacity reducing proclivity to bias and likely exposure to more diverse people. We do not find evidence to support this, however. In SM E.3, we show that adding an education interaction term makes minimal difference to our central estimates.
Third, we explore if information shapes projection. Better-informed respondents may be more knowledgeable about political phenomena and have more realistic perceptions of others. But they may also learn through biased means, for instance from ethnically segregated or politically biased networks in other parts of the country (Eubank Reference Eubank2019; Yeandle Reference YeandleForthcoming). We re-run our specifications with an interaction term on mobile internet access to proxy broader access to political information and present results in SM E.4. We find minimal evidence of divergence, except greater projection among DPP voters at the district level and overall effects on social media falling away. DPP projection may be driven by exposure to partisan content inflating perceptions of district support, while social media effects may reflect the underlying correlation between social media use and internet access. The general lack of heterogeneity suggests that neither trend is widespread.
Finally, we examine urban-rural divides. Urban environments are more diverse than their rural counterparts, which may leave urbanites better informed and less likely to project. We present results in SM E.5 and find some support for this: ethnic projection is driven more by rural respondents, with minimal differences on party support and mixed impacts on participation. One explanation is that while towns and cities are more ethnically diverse, they are not always politically so. Indeed, support for ruling parties is often systematically lower in urban Africa (Harding Reference Harding2020), and the spatial distribution of voters within neighbourhoods can drive coordination across ethnic lines (Nathan Reference Nathan2019).
Discussion
In this research note, we provide initial evidence that voters in low-income environments engage in social projection. Using original data from Malawi, we show that respondents in the same communities and districts perceive greater local support for their preferred party, prevalence of their own ethnic group, and like-minded political participation by others.
This finding has important implications for political dynamics in low-income states. Misestimating political support may explain the difficulties voters face in acting strategically (Adida, Gottlieb, Kramon et al. Reference Adida, Gottlieb, Kramon and McClendon2020) and why some struggle to accept election outcomes when their party loses (King, Kerr, and Wahman Reference King, Kerr and Wahman2024). If respondents misperceive the prevalence of their ethnic group, this may constrain coordination around a local majority to secure resources from the state (Ichino and Nathan Reference Ichino and Nathan2013; Ejdemyr, Kramon, and Robinson Reference Ejdemyr, Kramon and Lea Robinson2018). Anticipating greater participation by others may shed light on why some engage in ‘costly’ behaviours, even absent visible collective support (Olson Reference Olson1971).
We raise several avenues for future research. First, scholars should examine in greater detail the dynamics that underpin projection. Our initial evidence of urban-rural divergence warrants further study, as does the relative homogeneity across education and information levels. Understanding who projects and who does not will clarify the mechanisms that drive misperceptions, and how they link to wider bodies of work on political learning and local context (Sinclair Reference Sinclair2012; Nathan and Sands Reference Nathan and Sands2023).
Second, the intersection of projection with efforts to ‘correct’ citizen beliefs remains greatly underexplored. Do voters respond to objective facts about the composition of their local area? Does this spill over onto other attitudes and behaviours, or do biases persist beyond this? These questions are relevant for the design of civic education programmes in low-income settings (Gottlieb Reference Gottlieb2016; Mvukiyehe and Samii Reference Mvukiyehe and Samii2017; A. J. Harris, Kamindo, and van der Windt Reference Harris, Kamindo and van der Windt2021), alongside efforts to explicitly counter falsehoods (Badrinathan and Chauchard Reference Badrinathan and Chauchard2024).
Third, our design highlights the methodological trade-offs associated with studying projection in low-income settings that future work should improve. This could include capturing a wider range of outcomes, refining administrative units, or developing questions able to adjudicate competing dynamics. These, in turn, will help overcome the empirical caveats to our results and their interpretation.
Finally, while Malawi provides a relatively representative setting in which to study projection, extending to other contexts remains important. Future research should probe if and how projection manifests in other low-income contexts, where politics may operate under different regime types, party systems, urbanisation, or levels of ethnic diversity. Doing so would advance understanding of the structural conditions that drive misperceptions, conditions under which they are most likely to persist, and how this shapes wider political behaviour.
Supplementary material
The supplementary material for this article can be found at https://doi.org/10.1017/S1475676526101406.
Data availability statement
All data and code required to reproduce the results of the paper can be found on the Harvard Dataverse at https://doi.org/10.7910/DVN/HWITZE.
Acknowledgements
We are grateful to Boniface Dulani and the research team at the Institute for Public Opinion Research in Malawi for implementing our survey and providing feedback on the design. Analysis was pre-registered at https://osf.io/vjtfb.
Author contributions
Alex Yeandle: Conceptualization-Equal, Data curation-Equal, Formal analysis-Equal, Funding acquisition-Equal, Investigation-Equal, Methodology-Equal, Project administration-Equal, Resources-Equal, Software-Equal, Supervision-Equal, Validation-Equal, Visualization-Equal, Writing - original draft-Equal, Writing - review & editing-Equal. Johan Ahlbäck: Conceptualization-Equal, Data curation-Equal, Formal analysis-Equal, Funding acquisition-Equal, Investigation-Equal, Methodology-Equal, Project administration-Equal, Resources-Equal, Software-Equal, Supervision-Equal, Validation-Equal, Visualization-Equal, Writing - original draft-Equal, Writing - review & editing-Equal
Funding statement
We received financial support from the London School of Economics Research Impact Support Fund (111291) and the research initiative ‘Structural Transformation and Economic Growth’ (STEG), a programme funded by the Foreign, Commonwealth & Development Office (FCDO) (grant number: STEG_LOA_3073_Yeandle). The views expressed are not necessarily those of the FCDO.
Competing interests
None.
Ethical standards
The research was approved by ethics committees at the London School of Economics (420291) and the University of Malawi (ref: P.08/24/447).




 Open access

