


Introduction
Parties are the backbone of representative democracy, providing the crucial link between the preferences of citizens and policy outputs. According to the delegate model of representation (Eulau, Wahlke, Buchanan et al. Reference Eulau, Wahlke, Buchanan and Ferguson1959), it is the primary task of parties to represent the preferences of their constituents. However, citizens’ preferences are constantly evolving. To facilitate representation, parties must thus shift their positions to align with public opinion.
Scholars have long debated whether parties respond to voter preferences. Most early contributions found some evidence of party responsiveness (Adams, Clark, Ezrow et al. Reference Adams, Clark, Ezrow and Glasgow2004, Reference Adams, Clark, Ezrow and Glasgow2006) and identified two responsiveness models. In the ‘general electorate’ model, parties shift to align with the mean voter, whereas in the ‘partisan constituency’ model, parties prioritize their supporters (Ezrow, De Vries, Steenbergen et al. Reference Ezrow, De Vries, Steenbergen and Edwards2011). Most research finds that mainstream parties follow the general electorate model and niche parties follow the partisan constituency model (Bergman and Hjermitslev Reference Bergman and Hjermitslev2025; Bischof and Wagner Reference Bischof and Wagner2020; Ezrow, De Vries, Steenbergen et al. Reference Ezrow, De Vries, Steenbergen and Edwards2011; Hjermitslev and Bergman Reference Hjermitslev and Bergman2025). Yet, previous findings have been challenged on empirical and methodological grounds. Empirically, O’Grady and Abou-Chadi (Reference O’Grady and Abou-Chadi2019) question whether parties are responsive at all, and Dassonneville, Fréchet, Jabbour et al. (Reference Dassonneville, Fréchet, Jabbour, Ferland and Homola2024) suggest that responsiveness varies over time. Methodologically, most studies rely on a framework that understands parties as responsive when they shift positions in line with concurrent shifts in public preferences. This framework ignores concerns of reverse causality and misclassifies some party shifts that increase the distance to voter preferences as responsive (see Beyer and Hänni Reference Beyer and Hänni2018; Golder and Ferland Reference Golder, Ferland, Herron, Pekkanen and Shugart2018). Addressing these concerns with a novel framework focused on party responsiveness to past incongruencies with voters, Ibenskas and Polk (Reference Ibenskas and Polk2022a, Reference Ibenskas and Polk2022b, Reference Ibenskas and Polk2024) show that mainstream and niche parties alike follow the partisan constituency model.
I adopt their congruent responsiveness framework and extend their recent contributions in several important ways. Doing so, this research note provides the most comprehensive account of party responsiveness in the EU to date. Most previous studies exclusively focus on the left-right dimension (Adams, Clark, Ezrow et al. Reference Adams, Clark, Ezrow and Glasgow2004, Reference Adams, Clark, Ezrow and Glasgow2006; Ezrow, De Vries, Steenbergen et al. Reference Ezrow, De Vries, Steenbergen and Edwards2011; Ibenskas and Polk Reference Ibenskas and Polk2022a, Reference Ibenskas and Polk2022b). I integrate this dimensional component with recently proposed issue-level frameworks (Bergman and Hjermitslev Reference Bergman and Hjermitslev2025; Hjermitslev and Bergman Reference Hjermitslev and Bergman2025; Ibenskas and Polk Reference Ibenskas and Polk2024). The empirical analysis draws on recently updated data from the Chapel Hill Expert Survey (CHES) on party positioning (Jolly et al. Reference Jolly2022; Rovny et al. Reference Rovny2025) and the European Election Survey (EES) on public preferences (Egmond, Brug, Hobolt et al. Reference van Egmond, van der Brug, Hobolt, Franklin and Sapir2017; van der Eijk et al. Reference van der Eijk2009; Popa et al. Reference Popa2024; Schmitt et al. Reference Schmitt2009; Schmitt, Hobolt, Popa et al. Reference Schmitt, Hobolt, Popa and Teperoglou2016; Schmitt, Hobolt, van der Brug et al. Reference Schmitt, Hobolt, van der Brug and Adrian Popa2020). Using the updated time-series, I extend the work by Ibenskas and Polk (Reference Ibenskas and Polk2024) to examine responsiveness across the six key issues of immigration, European integration, redistribution, social lifestyle, the environment, law and order, and the left-right dimension over a significantly extended period of up to 25 years (1999–2024).
In contrast to, in my knowledge, all previous studies with an issue-centered approach (Bergman and Hjermitslev Reference Bergman and Hjermitslev2025; Hjermitslev and Bergman Reference Hjermitslev and Bergman2025; Ibenskas and Polk Reference Ibenskas and Polk2024), I do not limit my scope to Western Europe (WE) but also examine Central and Eastern European (CEE) parties. There are good reasons to expect differences. Compared to WE, party competition in CEE is more volatile, turnout is lower, and programmatic party-voter linkages are considered minimal (Ibenskas and Polk Reference Ibenskas and Polk2022b). However, the few studies that examine left-right responsiveness in CEE find little evidence for substantial differences (Dassonneville, Fréchet, Jabbour et al. Reference Dassonneville, Fréchet, Jabbour, Ferland and Homola2024; Ibenskas and Polk Reference Ibenskas and Polk2022b), calling for further investigation.
The empirical analysis is guided by the three main questions. 1) Are parties responsive to public opinion? 2) Which responsiveness model best describes party behavior? 3) Does party responsiveness differ across party types, European regions, and time? I find strong evidence of party responsiveness. In line with the partisan constituency model, parties align their position with their supporters rather than the general public. The overarching pattern is consistent across party types, the whole EU, and time, and is supported by both responsiveness frameworks. In short, contemporary European parties do ‘everything for the fans’. The research note has important implications for our understanding of voter representation in the 21st century.
A dual framework of party responsiveness
The extant literature offers a rich variety of conceptualizations of party responsiveness. I focus my attention on positional responsiveness, but parties can, for example, also show responsiveness by emphasizing the issues that voters care about (Klüver and Spoon Reference Klüver and Spoon2016). I draw on two competing responsiveness frameworks discussed in-depth by Beyer and Hänni (Reference Beyer and Hänni2018). I understand parties as responsive when they dynamically align their positions with public opinion. One approach that tries to capture this dynamic is the ‘standard framework’. In this approach, parties are perfectly responsive to public opinion when they shift their positions, on a given dimension or issue, in the same spatial direction to the same degree as the public. When voters shift one unit to the right, perfectly responsive parties shift one unit to the right. Despite its wide empirical application (Adams, Clark, Ezrow et al. Reference Adams, Clark, Ezrow and Glasgow2004, Reference Adams, Clark, Ezrow and Glasgow2006; Dassonneville, Fréchet, Jabbour et al. Reference Dassonneville, Fréchet, Jabbour, Ferland and Homola2024; Ezrow, De Vries, Steenbergen et al. Reference Ezrow, De Vries, Steenbergen and Edwards2011; O’Grady and Abou-Chadi Reference O’Grady and Abou-Chadi2019), the approach has two major conceptual weaknesses.
My understanding of responsiveness requires that parties change to align with public opinion, but the standard framework allows them to shift in the same direction without reducing the spatial distance. Consider a conservative party located to the right of the mean voter. When the mean voter shifts right and the conservative party responds with an equally sized rightward shift, the standard framework would consider the party perfectly responsive. This misses the point, as the ultimate representational goal of responsiveness should be to reduce existing party-voter incongruencies. Recognizing this conceptual weakness, Beyer and Hänni (Reference Beyer and Hänni2018) have proposed the ‘congruent responsiveness’ framework. Empirically adapted by Ibenskas and Polk (Reference Ibenskas and Polk2022a, Reference Ibenskas and Polk2022b, Reference Ibenskas and Polk2024), the new approach conceptualizes parties as responsive when they shift their position to reduce past incongruencies with the public. The conservative party from the previous example would thus only be considered responsive if it shifted to the left, to facilitate closer alignment with the past mean voter position. For a detailed explanation, see Ibenskas and Polk (Reference Ibenskas and Polk2024: 7–10).
The standard and congruent responsiveness frameworks are grounded in a bottom-up understanding of representation, where parties react to rather than shape the preferences of citizens. This theoretically ignores the existence of top-down representation, where citizens change their opinions based on elite cues (Druckman, Peterson, and Slothuus Reference Druckman, Peterson and Slothuus2013; Slothuus Reference Slothuus2010; Slothuus and Bisgaard Reference Slothuus and Bisgaard2021). As the standard framework focuses on concurrent shifts in party positions and public opinion, it can, by design, not disentangle the two types of representative relationships. In contrast, the congruent responsiveness framework empirically accounts for this by focusing on how parties react to past incongruencies. My empirical examination includes measures to assess responsiveness in the standard and congruent responsiveness framework. Due to the conceptual weaknesses of the standard framework, I focus my analysis on congruent responsiveness.
Party responsiveness beyond the left-right dimension
To this date, the left-right dimension remains the predominant focus of the party responsiveness literature (Adams, Clark, Ezrow et al. Reference Adams, Clark, Ezrow and Glasgow2004, Reference Adams, Clark, Ezrow and Glasgow2006; Adams, Haupt and Stoll Reference Adams, Haupt and Stoll2009; Bischof and Wagner Reference Bischof and Wagner2020; Dassonneville Reference Dassonneville2018; Ezrow, De Vries, Steenbergen et al. Reference Ezrow, De Vries, Steenbergen and Edwards2011; Ezrow and Krause Reference Ezrow and Krause2023; Ferland Reference Ferland2020; Ibenskas and Polk Reference Ibenskas and Polk2022a, Reference Ibenskas and Polk2022b). In light of the increasing multidimensionality in European party competition (Albright Reference Albright2010; Caughey, O’Grady and Warshaw Reference Caughey, O’Grady and Warshaw2019), this approach has come under scrutiny (Beyer and Hänni Reference Beyer and Hänni2018: 21; Ibenskas and Polk Reference Ibenskas and Polk2024; O’Grady and Abou-Chadi Reference O’Grady and Abou-Chadi2019: 2). The main issue with aggregating to the left-right dimension is that it may obfuscate the representational component of party responsiveness. Parties may be responsive on one issue but unresponsive on another. Solely focusing on the left-right dimension can thus skew our understanding of party responsiveness and voter representation. Hence, some scholars have broadened their investigations to include sub-dimensions, such as an economic or socio/postmaterial dimension (Dassonneville, Fréchet, Jabbour et al. Reference Dassonneville, Fréchet, Jabbour, Ferland and Homola2024; O’Grady and Abou-Chadi Reference O’Grady and Abou-Chadi2019). Others have been interested in single issues, like European integration (Schmitt and Thomassen Reference Schmitt and Thomassen2000; Spoon and Williams Reference Spoon and Williams2017; Steenbergen, Edwards, and de Vries Reference Steenbergen, Edwards and de Vries2007; Williams and Spoon Reference Williams and Spoon2015) or immigration (Vrânceanu Reference Vrânceanu2019). Building on recent contributions (Bergman and Hjermitslev Reference Bergman and Hjermitslev2025; Hjermitslev and Bergman Reference Hjermitslev and Bergman2025; Ibenskas and Polk Reference Ibenskas and Polk2024), I study party responsiveness through a multi-issue framework. To benchmark the issue-level results, I compare them to responsiveness on the left-right dimension.
Data
Measuring party positions and voter policy preferences
To assess the state of party responsiveness across the EU, I require comparable measures of party positions and public opinion across issues. Following Ibenskas and Polk (Reference Ibenskas and Polk2024), I rely on CHES data for my measure of party positions. The expert survey provides data on party characteristics and strategies with consistent question wording over time. I utilize six waves fielded in 1999, 2006, 2010, 2014, 2019, and 2024, excluding the 2002 CHES wave, as it did not closely follow a European Parliament (EP) election. CHES asks experts to position parties on a large variety of issues. I harmonize all items to a common 0–10 scale.
I use data on party positioning on the issues of immigration, European integration, redistribution, social lifestyle, the environment, law and order, and the general left-right dimension. The selection includes the most salient and contested political issues in contemporary European politics. To retrieve measures of position change, I subtract party positions from the previous survey in t−1 from the party position in the current period t0. Higher values indicate party shifts towards a position that is, respectively, more right-wing, anti-immigration, Europhile, anti-redistribution, opposed to socially liberal policies, in favor of economic growth over environmental protection, and tough on crime.
I further require consistent measures of issue-specific public opinion across time. I rely on data from the EES that comes with several distinct advantages. I utilize data from the 1999, 2004, 2009, 2014, 2019, and 2024 voter studies. Since the fieldwork for the EES and CHES is synchronized to the EP election cycle, they yield closely matched measures of party positions and public opinion. In the single case with a two-year gap (EES 2004/CHES 2006), I measure public preferences before party positions.
Since 2014, the EES and CHES have included almost identical questions and response scales that ensure high comparability between party and voter positions. For the preceding years, I used comparable but not identical measures. The EU and social lifestyle issues only have comparable measures for the entire period, and the measurement of party positions on social lifestyle changed in CHES 2024. Table A1 in the online Appendix details all issue positions and preference measures. Another major advantage of the CHES and EES combination is that both are fielded in all 28 EU member states (+ the UK), enabling comparison across EU regions. I classify all countries with a recent Communist past as part of CEE and the remainder as WE. Neither CHES nor the EES includes measures for all issues across all survey waves. Only the left-right dimension and European integration are covered during the whole 25-year period. Consult online Appendix A for detailed information on the sample, data coverage, variable descriptions, and descriptive statistics.
Measuring party responsiveness
The congruent responsiveness framework focuses on whether parties shift to reduce past incongruencies with voters. Following Ibenskas and Polk (Reference Ibenskas and Polk2024), I derive incongruency scores by subtracting the party’s position in t−1 from the mean voter’s position in t−1. The resulting variable is a measure of party-voter distance in t−1. To capture party responsiveness as understood by the standard framework (i.e., concurrent shifts), I create a measure of change in the public’s position between t−1 and t0, following the same procedure used to generate the party position change scores. In a first step, I assess party responsiveness to the mean voter. To do so, I regress party shifts on the two measures to assess responsiveness. The baseline model can be expressed as follows:
 $$\eqalign{\Delta {\mkern 1mu} {\rm{Party}}\;{\rm{positio}}{{\rm{n}}_{{\rm{i}},{\rm{t}}}} = {\beta _0} + {\beta _1}\left( {{\rm{Party - voter}}\;{\rm{congruence}}\;{\rm{ga}}{{\rm{p}}_{{\rm{i}},{\rm{t - 1}}}}} \right) + {\beta _2}\left( {\Delta {\mkern 1mu} {\rm{Voter}}\;{\rm{positio}}{{\rm{n}}_{{\rm{i}},{\rm{t}}}}} \right) + {\varepsilon _{{\rm{i}},{\rm{t}}}}}$$
Let i denote the party, t the year, and ϵ the error term.
To test the partisan constituency against the general electoral model, I examine party responsiveness to the mean supporter and non-supporter. I thus need measures of past incongruencies and shifts relating to these groups. I define party supporters as individuals who voted for the party in the previous national election (see Bergman and Hjermitslev Reference Bergman and Hjermitslev2025; Hjermitslev and Bergman Reference Hjermitslev and Bergman2025). All remaining individuals are non-supporters. The models testing whether parties respond to the general electorate or partisan constituency include all relevant variables used to assess responsiveness to supporters and non-supporters. The results thus show whether parties respond to supporters [non-supporters] when controlling for incongruencies and shifts by non-supporters [supporters]. The model is specified as follows:
 $$\eqalign{\Delta {\mkern 1mu} {\rm{Party}}\;{\rm{positio}}{{\rm{n}}_{{\rm{i}},{\rm{t}}}} = {\mkern 1mu} {\mkern 1mu} &{\beta _0} + {\beta _1}\left( {{\rm{Party - supporter}}\;{\rm{congruence}}\;{\rm{ga}}{{\rm{p}}_{{\rm{i}},{\rm{t - 1}}}}} \right) + {\beta _2}\left( {\Delta {\mkern 1mu} {\rm{Supporter}}\;{\rm{positio}}{{\rm{n}}_{{\rm{i}},{\rm{t}}}}} \right) \cr & + {\beta _3}\left( {{\rm{Party - non - supporter}}\;{\rm{congruence}}\;{\rm{ga}}{{\rm{p}}_{{\rm{i}},{\rm{t - }}1}}} \right) \cr & + {\beta _4}\left( {\Delta {\mkern 1mu} {\rm{Non - supporter}}\;{\rm{positio}}{{\rm{n}}_{{\rm{i}},{\rm{t}}}}} \right) + {\varepsilon _{{\rm{i}},{\rm{t}}}}}$$
The dataset is structured on the party-year level, with each row representing the issue/dimension-specific positional strategies of one political party for one CHES wave, matched to the issue- or dimension-specific data on mean voter, supporter, and non-supporter preferences. The descriptive statistics in Table A3 indicate that party position change is most limited on the left-right dimension. On average, party-voter and party-supporter incongruencies are the smallest on the left-right dimension, suggesting high levels of left-right representation. Incongruencies are the largest in the EU and the environment. The average party is more Europhile and less in favor of environmental protection than the mean voter and supporter.
In the main analysis, I report baseline OLS regression model specifications. In the robustness section, I detail the results of more restrictive specifications. The substantive conclusions hold under all estimated alternatives. In the main text, I summarize the results through coefficient plots. The full regression tables are available in the online Appendix B.
Empirical analysis
Are parties responsive and, if so, to whom?
To start, I test whether parties are responsive to the mean voter. The results summarized in the upper part of Figure 1 (‘voter gap’) provide strong evidence of party responsiveness to public opinion within the congruent responsiveness framework. Across all six issues and the left-right dimension, I find a significant positive relationship between mean voter past incongruencies and party shifts. There is, however, strong variation in effect sizes. On the left-right dimension, parties shift, on average, 0.02 units to the right [left] when the mean voter is located one unit to the right [left] of them. This unsubstantial effect echoes findings of recent research (Dassonneville, Fréchet, Jabbour et al. Reference Dassonneville, Fréchet, Jabbour, Ferland and Homola2024; O’Grady and Abou-Chadi Reference O’Grady and Abou-Chadi2019). I find the largest effects on the environment. Parties respond with a 0.12-unit shift to a one-unit incongruence with the mean voter. Two illustrative examples of parties shifting to align with public opinion on the environment are the two main Spanish parties – PSOE and PP. Between 2019 and 2024, the social democrats and conservatives reduced the gap to the mean voter by, respectively, shifting 1.23 (PSOE) and 1.62 (PP) units towards environmental protection.
Party responsiveness to the mean voter across issues.

The standard framework returns less clear results. The lower part of Figure 1 (‘Δ Voter’) shows significant variation in responsiveness across issues. On immigration, the EU, and social lifestyle issues, parties shift in line with the mean voter to a sizeable and statistically significant extent. This is not the case for the left-right dimension, redistribution, and law and order. On the environment, parties shift in the opposite direction of the mean voter. One explanation is that voters used to be significantly more pro-environment than parties. Between 2019 and 2024, parties then shifted 0.5 units in favor of environmental protection (5.2 to 4.7). Voters, in contrast, shifted 1.2 units away from their pro-environmental stance (3.3 to 4.5). The two sides have strongly approached each other, reducing the gap from 1.9 to 0.2 units. The standard framework fails to capture this.
Note that this naïve model does not provide clear support for the general electorate model, as it cannot disentangle to whom parties really respond. Party shifts can be consistent with reducing incongruencies with the mean voter and supporter, but when parties need to choose, they may prioritize one over the other. Accordingly, I estimate models that distinguish between supporter and non-supporter preferences. Parties consistently shifting to align with supporters over non-supporters can be interpreted as evidence for the partisan constituency model.
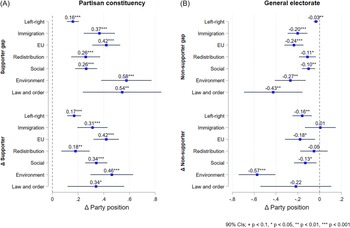
Figure 2 unequivocally supports the partisan constituency model. Irrespective of the responsiveness framework, parties consistently respond to supporters over non-supporters across all six issues and the left-right dimension. I find precisely zero evidence that parties are responsive to non-supporters over supporters (see right panel), casting doubt on the validity of the general electorate model in contemporary European politics. Table B3 reports that the substantive conclusions hold when I exchange the mean non-supporter for the mean voter. The findings corroborate recent studies by Ibenskas and Polk (Reference Ibenskas and Polk2022a, Reference Ibenskas and Polk2022b, Reference Ibenskas and Polk2024).
Party responsiveness to the mean supporter [non-supporter] across issues.

Responsiveness on the left-right dimension is, again, the weakest. On average, parties shift 0.16 units to reduce a one-unit supporter gap. Congruent responsiveness is stronger on every examined issue and strongest on the environment, where parties respond to a one-unit gap with a 0.56-unit shift towards their supporters. On the issue with the second-highest partisan responsiveness – law and order – one example is the 2.43-unit shift of the Greek KKE between 2019 and 2014 towards favoring civil liberties. The shift increased the Communist party’s distance from the mean voter but closely aligned the party with its leftist supporters.
The dominance of the partisan constituency model may appear puzzling, given the evidence that party shifts tend to reduce incongruencies with the mean voter. However, the results should not be taken as an indication that party shifts increase incongruencies with the mean non-supporter. Due to the high correlation between mean supporter and mean non-supporter/voter preferences, parties usually do not need to choose whom to respond to. What the models do suggest is that when parties choose, they tend to prioritize supporters.
To further illustrate this dynamic, Figure B1 reports regression models that test party responsiveness to supporters and non-supporters in isolation. The results further highlight that responsiveness is usually not a trade-off, but that parties prioritize their supporters. Across all issues, I find that party shifts tend to reduce incongruencies with both groups, but more with supporters than non-supporters. The standard model of responsiveness supports a similar conclusion, although with less consistency. Figure B2 reports models that additionally separate by responsiveness framework, yielding the same conclusions.
Party responsiveness by party type
One explanation of the findings is that responsiveness is conditioned by party type. Most research within the standard framework finds that mainstream parties respond to the mean voter and niche parties to their supporters (Adams, Clark, Ezrow et al. Reference Adams, Clark, Ezrow and Glasgow2006; Bergman and Hjermitslev Reference Bergman and Hjermitslev2025; Bischof and Wagner Reference Bischof and Wagner2020; Ezrow, De Vries, Steenbergen et al. Reference Ezrow, De Vries, Steenbergen and Edwards2011; Hjermitslev and Bergman Reference Hjermitslev and Bergman2025). There are many ways to classify mainstream and niche parties. In the main text, I adopt a recently proposed operationalization, specifically developed for studying party responsiveness (Hjermitslev and Bergman Reference Hjermitslev and Bergman2025). Following Hjermitslev and Bergman (Reference Hjermitslev and Bergman2025), I classify all party families with an economic focus as mainstream. This includes social democratic, Christian democratic, conservative, liberal, and far-left parties. Lacking this economic focus, I classify far-right, green, regionalist, and agrarian parties as niche. I base the party family classification on the CHES coding. Figure 3 displays the interaction effects between party type and the supporter/non-supporter preference measures. Against most extant research, I find little evidence that mainstream and niche parties systematically follow different responsiveness models. Irrespective of the framework, both party types respond to supporters over non-supporters. There are only two statistically significant differences. Within the congruent responsiveness framework, mainstream parties are more responsive to their supporters on immigration. Within the standard framework, niche parties shift less in line with non-supporters on law and order.
Party responsiveness to the mean supporter [non-supporter] across issues and party type.

In Appendix E, I show that the results are robust to two alternative definitions. The first uses the classic mainstream-niche distinction proposed by Adams, Clark, Ezrow et al. (Reference Adams, Clark, Ezrow and Glasgow2006). For the second, I draw on Bischof (Reference Bischof2017) for a continuous indicator of nicheness based on a party’s exclusive focus on niche issues and its issue specialization. I further display the results for the left-right dimension.
Party responsiveness across the EU
The results so far suggest the dominance of the partisan constituency model. Yet, they may also hide important variation in party-voter linkages across the EU. To my knowledge, there is not a single issue-centered study including a broad range of CEE parties. It is thus possible that the inclusion of CEE is driving the results. To test this, I interact the responsiveness measures with the WE/CEE indicator. I directly differentiate between responsiveness to supporters and non-supporters. Figure B3 reports party responsiveness to the mean voter, yielding the same substantive conclusions.
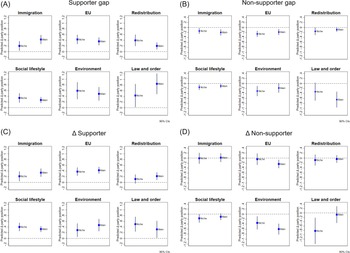
Panels A and B of Figure 4 summarize the results, following the congruent responsiveness framework. The panels show how parties in WE and CEE shift their position in response to a marginal increase in past incongruency with the mean supporter (panel A) and mean non-supporter (panel B). I only find a single statistically significant difference between WE and CEE. On the environment, only WE parties follow the partisan constituency model and strongly shift to reduce past incongruencies with their supporters.
Party responsiveness to the mean supporter [non-supporter] across issues and European regions.

Panels C and D of Figure 4 summarize the results according to the standard framework. The panels show how WE and CEE parties shift their position in response to a marginal shift in the position of the mean supporter (panel C) and mean non-supporter (panel D). I again find little heterogeneity between the regions. CEE parties shift more in line with their supporters on the EU, and they shift less in line with their non-supporters on the EU, social lifestyle, and the environment. Still, the overarching pattern remains incredibly consistent. Parties in WE and CEE tend to prioritize supporters over non-supporters. They never follow non-supporters over supporters. This is further supported by Figure B5, which shows no significant differences in left-right responsiveness across regions. Parties are marginally responsive to the mean supporter, irrespective of framework, and decisively unresponsive to non-supporters. The results corroborate Ibenskas and Polk’s (Reference Ibenskas and Polk2022b) finding that established CEE parties respond to the mean supporter on the left-right dimension.
One possibility is that the mainstream-niche dichotomy is more applicable to the WE context. However, Figure E2 shows that even within WE, mainstream and niche parties consistently follow the partisan constituency model with few statistically significant differences across issues. The findings align with those of Ibenskas and Polk (Reference Ibenskas and Polk2024).
Party responsiveness over time
To identify time trends across issues, I interact the public preference measures with a year indicator. As I only have between two and five time points, I use a categorical year variable. I exclude law and order, as the EES 2024 did not measure voter preferences on the issue. I immediately turn my attention to the evaluation of the general electorate against the partisan constituency model over time.
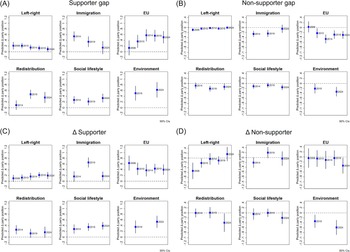
Figure 5 displays the results, with panels A and B focusing on the congruent responsiveness framework and panels C and D on the standard framework. A few trends stand out. The dominance of the partisan constituency model on immigration has disappeared. Congruent responsiveness to supporters strongly declined between 2014 and 2024, whereas responsiveness to non-supporters has increased concurrently. Conversely, the partisan constituency model has become more prevalent in the EU between 2006 and 2014, after which the levels stabilized. The standard model suggests the opposite trend, where parties shifted more alongside their supporters on the EU in 2006 than in 2010 and onward. Between 2014 and 2019, parties have also become more responsive to their supporters on redistribution. I find no significant trends in the left-right, social lifestyle, and the environment. Here, parties consistently follow the partisan constituency model.
Party responsiveness to the mean supporter [non-supporter] across issues and time.

In Figure B4, I examine party responsiveness to the mean voter over time. No clear trends emerge. The congruent responsiveness framework reveals strong evidence of party responsiveness to the mean voter across issues and weak responsiveness on the left-right dimension. Within the standard framework, I find no evidence for left-right responsiveness throughout the last two decades, corroborating evidence from Dassonneville, Fréchet, Jabbour et al. (Reference Dassonneville, Fréchet, Jabbour, Ferland and Homola2024). Yet, contrary to their findings, I only find significant responsiveness on immigration in 2019.
Robustness checks and additional analyses
I demonstrate in Appendix C that the substantive conclusions are supported by alternative model specifications, adding a lagged dependent variable, standard errors clustered by survey wave, and country fixed effects. I further estimate models pooling across issues and years. On average, parties shift around 0.33 units to reduce a one-unit supporter incongruency. When their supporters shift one unit, parties shift 0.33 units in the same direction. Appendix D checks whether parties and voters merely react to some underlying conditions. I find no evidence that issue-specific conditions, such as economic growth or migrant inflows, can account for the observed relationships. Appendix F demonstrates that using an alternative definition of party supporters, relying on self-reported party identification (e.g., see Ibenskas and Polk Reference Ibenskas and Polk2024), yields highly similar results. Appendix G reports jackknife-type analyses showing that the results are not driven by outlier years.
Conclusion
I have examined patterns of party responsiveness across six key issues and the left-right dimension between 1999 and 2024 throughout the entire EU. Three questions have guided the empirical analysis. 1) Are parties responsive to public opinion? 2) Which responsiveness model best describes party behavior? 3) Does party responsiveness differ across European regions and time? In short, the answers are as follows: 1) Yes; 2) The partisan constituency model; 3) No.
To elaborate, I examine party responsiveness through the lens of two competing frameworks. The standard framework predicts concurrent party and voter shifts in the same direction. This approach has recently been criticized for failing to consider the possibility that voters follow parties and recognizing shifts that do not reduce incongruences as responsive. The congruent responsiveness framework has been proposed as a solution to these shortcomings (Beyer and Hänni Reference Beyer and Hänni2018).
The results reveal a consistent pattern of parties responding to their supporters over non-supporters. The partisan constituency model dominates. Across all six issues and the left-right dimension, I find evidence that parties prioritize their supporters over non-supporters. The finding is consistently supported within both responsiveness frameworks. Proponents of the delegate model of democratic representation should take the results as good news. I find a robust connection between changing public preferences and the issue positions supplied by parties. While the results suggest that this connection is particularly strong for parties and their supporters, they do not imply that party shifts are incompatible with the preferences of the general electorate. The preferences of supporters and non-supporters often overlap. Accordingly, party shifts also tend to align with the preferences of the mean voter/non-supporter. The findings do suggest, however, that when parties choose, they prioritize supporters and do ‘everything for the fans’.
The findings speak to the broader literature on electoral competition, especially issue yield theory (De Sio and Weber Reference De Sio and Weber2014). The theory postulates that parties emphasize issue positions that unite their core supporters and are popular within the broader electorate. My findings demonstrate that parties, first and foremost, seek to align their positions with supporters, but these shifts also tend to align them with the broader electorate. After all, only parties that occupy these broadly popular positions can employ issue yield strategies.
The overarching patterns of responsiveness are highly similar in WE and CEE. By now, key aspects of party competition in WE and CEE may be more similar than previously believed. Decisions concerning the empirical scope of future studies should thus be guided by careful theoretical considerations instead of a priori assumptions about potentially non-existent differences. Examining responsiveness over time reveals no major trends. The only consistent pattern is that parties follow the partisan constituency model.
I leave it for future research to test potential reasons for the dominance of the partisan constituency model. One possible explanation is that vote-seeking parties respond to their supporters to stabilize their core support base and make it more difficult for rival parties to pick up supporters based on incongruencies on specific issues. This aligns with findings that the presence of a successful far-right party increases mainstream responsiveness on immigration (Vrânceanu Reference Vrânceanu2019). I encourage future research to pay closer attention to how issue-level factors, such as issue ownership and issue salience, shape responsiveness. Another fruitful avenue is to explore whether the reasons for the dominance of the partisan constituency model differ between WE and CEE. One could imagine that CEE parties prioritize partisans because they tend to be more politically informed and aware of the parties’ positions than independents (Ibenskas and Polk Reference Ibenskas and Polk2022b). The same mechanism could not, however, explain the revealed patterns in WE.
In contrast to previous work building on the standard framework (Bergman and Hjermitslev Reference Bergman and Hjermitslev2025; Bischof and Wagner Reference Bischof and Wagner2020; Ezrow, De Vries, Steenbergen et al. Reference Ezrow, De Vries, Steenbergen and Edwards2011; Hjermitslev and Bergman Reference Hjermitslev and Bergman2025), I find no evidence that mainstream and niche parties follow different responsiveness models across issues or the left-right dimension. While my findings align with the few studies within the congruent responsiveness framework (Ibenskas and Polk Reference Ibenskas and Polk2022a, Reference Ibenskas and Polk2022b, Reference Ibenskas and Polk2024), they do call for replication using different data sources to measure party positions and voter preferences to ensure the validity of the claims.
The findings not only amplify the need to move beyond party type but also the singular focus on the left-right dimension. Likely because of its ideological nature, responsiveness on the left-right dimension is much more muted than responsiveness across issues. To better understand representation in increasingly multidimensional European party competition, scholars need to shift their attention towards more issue-based explanations of party responsiveness. Considering that the substantive content of the left-right dimension varies across contexts (Lindqvist and Dornschneider-Elkink Reference Lindqvist and Dornschneider-Elkink2024), issues should also provide more consistent reference points for comparative assessments of party responsiveness. Finally, previous research has shown that voters are not always receptive to responsive parties (see Adams Reference Adams2012). It remains to be seen whether party supporters reward responsive behavior.
Supplementary material
The supplementary material for this article can be found at https://doi.org/10.1017/S1475676526100735
Data availability statement
Data and replication code are available under Supplementary material.
Acknowledgements
I would like to thank the three anonymous reviewers for their excellent feedback and the EJPR editorial team for their great guidance throughout the process. I further want to thank Ann-Kristin Kölln, Jonathan Polk, Jacob Gunderson, Elena Leuschner, and Lena Huber for their valuable comments. Previous versions of this research note were presented at the 2025 Swedish Network for European Studies in Political Science (SNES) conference, at the 2025 Centre for European Research at the University of Gothenburg (CERGU) conference, at the 2025 Gothenburg Research Group on Elections, Public Opinion and Political Behavior (GEPOP) conference, and at the 2025 European Political Science Association (EPSA) conference. I thank all participants for their helpful comments.
Funding statement
The author received no external funding for the creation of this manuscript.
Competing interests
The author declares none.


 Open access