

The literature on the relation between political trust and electoral behaviour shows that dissatisfied voters are more likely to abstain from voting (Bélanger and Nadeau Reference Bélanger and Nadeau2005; Gabriel Reference Gabriel2015; Hetherington Reference Hetherington1999). In a context of compulsory voting, however, abstaining is not a valid option, and in that case blank and invalid votes are strongly related to low levels of political trust (Hooghe et al. Reference Hooghe, Marien and Pauwels2011). Furthermore, previous research offers convincing evidence that some parties succeed in attracting the ‘disgruntled’ voters (van der Brug Reference Van der Brug2003). By voting for third parties, protest parties, extremist or populist parties, citizens have a way of voicing their discontent (Miller and Listhaug Reference Miller and Listhaug1990).
The relation between distrust and protest voting has been well established. van der Brug and Fennema (Reference Van der Brug and Fennema2003: 58) define protest voting as ‘a vote primarily cast to scare the elite that is not policy driven’. Accordingly, a party preference that is mainly driven by distrust in political institutions qualifies as a protest vote. In the literature there is more disagreement about the long-term consequences of this form of protest voting. While most of the previous studies have investigated the relation between political (dis)trust and voting behaviour in a cross-sectional manner, the purpose of the current study is to investigate the dynamic relation between trust and voting. If a protest party succeeds in gaining appeal, it might partly restore a citizen’s faith in the electoral process. In that case, voting for an anti-establishment party might have a positive effect on democratic legitimacy as this vote functions as a kind of safety valve to stabilize levels of discontent. However, a number of scholars have also argued that voting behaviour might fuel discontent and spread negative feelings across the population (Rooduijn et al. Reference Rooduijn, de Lange and van der Brug2014).
With respect to the relation between protest voting and distrust, different expectations emerge from the literature. A first expectation is that protest parties only benefit from pre-existing attitudes of dissatisfaction and register the attitudes that are already present. A second expectation is that protest and populist parties not only mobilize dissatisfied voters but also fuel a sense of dissatisfaction in the electorate (van der Brug Reference Van der Brug2003). Thirdly, it has been argued that particular protest parties succeed in channelling dissatisfaction and stop a decline of political trust over time (Miller and Listhaug Reference Miller and Listhaug1990). The cross-sectional data that have previously been used to shed light on this question allow speculation about the direction of this link, but panel data are needed for us to draw strong inferences.
In this article, we investigate the dynamic relation between political trust and voting behaviour by means of a panel design. This allows a study of how the trust level of protest voters evolves following their vote decision. We make use of the data from the Belgian Election Panel (2009–14), in which a representative sample of voters has been surveyed in the context of both the 2009 and the 2014 Belgian elections. Previous research has already shown a strong relation between political trust and voting for populist and extreme right parties in Belgium (Hooghe et al. Reference Hooghe, Marien and Pauwels2011), rendering the Belgian context an interesting case for investigating this research puzzle on dynamic patterns as well. Furthermore, the general decline of trust in Belgium as a result of long political crisis (Hooghe Reference Hooghe2012) introduces considerable variation in our data during the observation period.
The Belgian context consists of two separate party systems: one of Dutch-language parties and one of French-language parties. As protest parties are mainly present in the Dutch-language area of the country (Deschouwer et al. Reference Deschouwer, Delwit, Hooghe, Baudewyns and Walgrave2015), we expect protest voting to be present mainly in the Dutch-language region of Flanders, while we expect a more diffuse pattern among Francophone voters. If voting has a subsequent effect on political trust, this effect therefore should be limited to the Flemish region, and be absent in the French-language region.
We first review the literature on the relation between political trust and voting behaviour with specific attention to the discussions, not only on how attitudes affect vote choices, but on how vote choices can affect attitudes as well. We provide more information on the Belgian electoral context, before presenting data and methods. After discussing the results from our analyses, we add some remarks on the implications of our findings for the role of protest voting in electoral democracy.
POLITICAL TRUST AND VOTE CHOICES
It is now readily accepted in the literature that levels of political trust affect voters’ party preferences. The first studies on this topic originated in the context of two-party systems and highlighted that low levels of political trust might be beneficial for the opposition party (Citrin Reference Citrin1974). When more than two candidates or parties compete for election, however, dynamics are different. Hetherington (Reference Hetherington1999) has shown that if there is a viable third party, this party attracts the distrusting voter – breaking the dominance of the two major parties in the US. Similarly, political distrust has been found to be an important determinant of third party voting in the Canadian context (Bélanger and Nadeau Reference Bélanger and Nadeau2005). Miller and Listhaug (Reference Miller and Listhaug1990) argue that how the distrusting citizen votes depends on how flexible the party system is. If a party system is sufficiently open, protest parties can rise and attract votes among the low trusting. In their view, this form of responsiveness could subsequently have a positive effect on the level of legitimacy of electoral politics because the disgruntled find an effective instrument to voice their discontent.
The relation between distrust and protest voting has also been investigated in the literature that establishes at an individual level the link between the aggregate level trends of an alleged decline of political trust on the one hand (Hetherington Reference Hetherington1998; Norris Reference Norris1999) and a surge of populist and protest parties across Western democracies on the other (Arzheimer Reference Arzheimer2009; Mudde Reference Mudde2007; van Kessel Reference Van Kessel2011). Attitudes of dissatisfaction and political distrust are indeed a recurrent theme in research analysing the determinants of choosing protest or populist parties. A prime example is the Netherlands, where voting for the populist party List Pim Fortuyn (LPF) clearly was an expression of anti-partyism, political cynicism, low levels of political efficacy and political distrust (Bélanger and Aarts Reference Bélanger and Aarts2006; Schumacher and Rooduijn Reference Schumacher and Rooduijn2013; van der Brug Reference Van der Brug2003). Even though all these authors stress the relevance of policy positions and leader effects in voting for populist parties (either on the left or on the right), it is clear that a vote for one of these parties is to some extent a protest vote (Ivarsflaten Reference Ivarsflaten2007). Our first hypothesis is thus that there will be a relation between distrust and protest voting:
Hypothesis 1: There is a negative relation between levels of political trust in 2014 and the probability of voting for protest parties.
The impact of political trust on voting behaviour is generally investigated in a static way; that is, the effect of levels of trust on vote choices are looked at. A case could be made, however, for taking into account changes in trust levels. A first reason to think so is that voters can vote in a directional manner (Rabinowitz and Macdonald Reference Rabinowitz and Macdonald1989). For political trust, what matters for their vote choice would then be not the overall level of trust, but how the assessment of the political system has changed over time. If voters have become less trusting in politics, the direction of how their attitudes changed would lead them to choose a party that is mobilizing on distrust. Second, research in the field of economic voting shows that voters act retrospectively and take into account past performances of the incumbent (Fiorina Reference Fiorina1978; Lewis-Beck and Stegmaier Reference Lewis-Beck and Stegmaier2013). With respect to political trust as well, voters could be retrospective and be guided by their assessment of change over an electoral cycle. Our second hypothesis therefore reads that change in political trust, rather than the absolute level of trust, would be associated with protest voting:
Hypothesis 2: A decline in political trust over time is positively related to the probability of voting for protest parties, even controlling for absolute levels of political trust.
Most research on the relation between political trust and voting for protest parties is based on single or repeated cross-sectional studies. Such designs provide evidence of the presence of a relation between political trust and voting behaviour, but they do not shed light on its direction. In terms of the role of political parties themselves, three different perspectives can be distinguished. First, protest parties could merely attract dissatisfied voters and offer an option for representation for the low-trusting voters present in the electorate (Bélanger and Aarts Reference Bélanger and Aarts2006). As such, we would not expect protest voting to have any effect on the subsequent development of political trust. Second, protest parties can – by channelling feelings of distrust within the electoral system – reduce political discontent, as pointed out by Miller and Listhaug (Reference Miller and Listhaug1990). From a comparative analysis of the impact of trust and efficacy on voting behaviour in the US, Sweden and Norway, they concluded that ‘in the flexible multi-party system of Norway, distrust was channelled back into the electoral arena as support for the opposition and protest parties of the right’ (Miller and Listhaug Reference Miller and Listhaug1990: 382–3). The theoretical relevance of this claim is that protest voting can be considered to be a ‘healthy’ sign for the vitality of electoral politics. If citizens can express their distrust in the voting booth, it might restore their faith in the electoral process. If the protest party is successful, it might even moderate its party programme and join a new governing coalition (Dandoy Reference Dandoy2014). A third, and opposite, claim is that protest parties can act to ‘fuel’ political discontent. From his study of determinants of voting for LPF in the Netherlands, van der Brug (Reference Van der Brug2003) concludes that a preference for LPF aroused discontent rather than being driven by it. Bélanger and Aarts (Reference Bélanger and Aarts2006: 16), however, make use of panel data and disagree with this point of view. Their analyses lead them to stress that a ‘reservoir of discontent’ already existed in the Netherlands, which the LPF successfully tapped into. Still, they also find that LPF supporters become more cynical over time. For the Belgian case, using panel data, Thijssen (Reference Thijssen2001) has shown that voting for the extreme right in Flanders is associated with a growing sense of political alienation. The causal mechanism for this effect might be that once a voter has voted for a specific party, this behaviour affects the voter’s attitudes and is incorporated into the political identity of the voter (Boonen and Hooghe Reference Boonen and Hooghe2014; Dinas Reference Dinas2014). As Dinas (Reference Dinas2014) has shown with regard to the development of party identification, voters’ attitudes can change to match more closely their previous voting behaviour.
Mechanisms of cognitive dissonance and self-perception help us explain why voters – perhaps unconsciously – change their attitudes and bring them in line with the attitudinal pattern that is associated with a specific political party (Dinas Reference Dinas2014). This kind of causal logic is well grounded in the social psychological literature. Cognitive dissonance theory, and also the research tradition on minimal group effects, assumes that actors have a tendency to adapt their attitudes to their assigned or selected group identity. Self-perception theory assumes that actors actively interpret their own behaviour and develop attitudes and preferences that are compatible with their behaviour. Selection and adaptation mechanisms, finally, put forward the notion that individuals might initially self-select into a group identity or an interaction context, but later on adapt to the prevailing value pattern within that group. Thus there are various social psychological traditions that argue in favour of investigating the link between behaviour and attitudes. Applying these insights to protest party voters suggests that subsequent levels of dissatisfaction become more salient, as this offers a stronger congruence between one’s own attitudes and the attitudinal pattern associated with this specific party. Following this logic, we hypothesize that in the Belgian context protest parties not only mobilize distrust, but additionally fuel distrust among their voters.
Hypothesis 3: Citizens who voted for a protest party will subsequently become more distrusting over time than those who did not vote for protest parties.
In sum, while it is an established fact that political distrust is associated with voting for protest parties, questions remain on the evolution of trust over time and how this is related to voting behaviour. We address this research puzzle because it is highly relevant to the general debate about the effects of protest and populist parties on the stability of electoral democracy in Europe.
We investigate this relation in Belgium, as this country offers an ideal setting, both for the study of political trust and for the study of protest voting. Because there is a system of compulsory voting in Belgium, abstaining from voting is not a valid exit option, and therefore it can be expected that low levels of political trust are strongly linked to voting for populist parties. In the context of the 2009 regional elections in the Flemish region, distrusting citizens were found to have a higher probability of voting for the populist List Dedecker (LDD), the extreme right Vlaams Belang (VB – Flemish Interest) or the Flemish nationalist party Nieuw-Vlaamse Alliantie (N-VA – New Flemish Alliance). If we follow the definition of van der Brug and Fennema (Reference Van der Brug and Fennema2003), the significant role of political distrust as a vote determinant would qualify these parties as protest parties. It seems, therefore, that a number of parties in the Flemish party system succeeded in ‘providing the disaffected with a means of representation’ (Miller and Listhaug Reference Miller and Listhaug1990: 357). It has to be noted that all these parties are active in the Dutch-language party system, while in the French-language party system no effects of political trust could be documented (Hooghe et al. Reference Hooghe, Marien and Pauwels2011; Pauwels Reference Pauwels2011). This by itself renders Belgium an interesting case for a comparison between a system with protest parties (the Dutch-language party system) and a system without protest parties (the French-language party system). If protest parties indeed ‘fuel’ discontent, as van der Brug (Reference Van der Brug2003) has argued, this effect should be present only in the Dutch-language region (Dandoy Reference Dandoy2014).
The standard definition of a protest vote is a vote for a party that fundamentally challenges the established status quo of the political system (McAllister Reference McAllister1982). Given the ongoing debate about exactly which parties should be considered protest parties, we opt for a broad comparison by investigating the vote motives for voters of all parties (van der Brug et al. Reference Van der Brug, Fennema and Tillie2000; van Spanje Reference Van Spanje2011) and analyse the relation between political trust and each political party. For the Flemish region, we build further on previous research that has shown that protest voting in this party system is clearly discernible (Hooghe et al. Reference Hooghe, Marien and Pauwels2011). For the 2014 elections, we assume we will find the same voting patterns as observed for the 2009 elections and expect higher levels of political trust to decrease the probability of voting Vlaams Belang or N-VA.Footnote 1 Interestingly, the nationalist party N-VA was considered to be the great winner of the 2009 elections, gaining 13.1 per cent of the vote. The party subsequently entered the Flemish regional government; in the Belgian federal system this is a very important power position. The nationalists thus quickly made the transition from an anti-establishment party to a governing party, and it remains to be investigated how their voters reacted to this transformation: did they continue to develop a distrusting attitude, or did the entry of their preferred party reconcile them with the functioning of the political system in the country? Since the regional level in Belgium has extensive authorities, we could assume that most voters will be familiar with the distinction between the federal and the regional level and will be knowledgeable of the fact that the N-VA was in government at the regional level. In fact, research on media attention given to members of parliament in Belgium shows that the regional and federal parliaments receive almost equal attention in television news broadcasts (Hooghe et al. Reference Hooghe, Jacobs and Claes2015). For the French-language party system, by contrast, given that there is not a clear protest party participating in the elections, we do not have a strong hypothesis on how political trust affects voting behaviour.
DATA AND METHODS
As we aim to shed light on the dynamic relation between political trust and protest voting, we need to have access to data on the evolution over time. Therefore, we rely on data with a panel structure for our analyses. We employ the data from the Belgian Election Panel (BEP, 2009–14), a representative survey of voters in the two main regions of Belgium (Flanders and Wallonia), based on a sample from the national register of the citizens of Belgium. The 2009 part of the panel survey consisted of three survey waves, two of which were before the 2009 regional elections of 7 June 2009 and one that was in the field shortly after.Footnote 2 1,698 respondents took part in this post-electoral survey wave and were interviewed by phone, which is 35 per cent of the original sample (PartiRep 2009). In the run-up to the elections of 25 May 2014, these respondents were contacted again to participate in the 2014 part of the panel study. A total of 792 respondents who took part in the third wave of the 2009 survey sent back a paper questionnaire, which is 46.7 per cent of the population of interest (Dassonneville et al. Reference Dassonneville, Falk Pedersen, Grieb and Hooghe2014). The data thus suffer from attrition, and as this is not a random phenomenon it probably biases our results (Frankel and Hillygus 2014; Vandecasteele and Debels Reference Vandecasteele and Debels2007). We partly account for attrition effects by weighting our data by socio-demographic characteristics. Even though the panel data are not perfect, for the purpose of our analyses they are to be preferred over cross-sectional surveys – as recall questions on the previous vote are known to result in large errors (van der Eijk and Niemöller Reference Van der Eijk and Niemöller2008).
As a measure for political trust, we use respondents’ indicated level of trust in the following institutions: political parties, the regional government, the regional parliament, the federal government, the federal parliament and politicians. For each of these institutions, respondents reported their level of trust on a scale from 0 (no trust at all) to 10 (complete trust). As is clear from the results in Table 1, for Flemish and Walloon panel respondents, both in 2009 as well as in 2014, these six items load solidly on a one-dimensional scale, which is in line with earlier research (Hooghe et al. Reference Hooghe, Marien and Pauwels2011; Marien Reference Marien2011).Footnote 3 The mean values for political trust in Table 1 additionally point out a decline in political trust between 2009 and 2014. This decline, from an average of 5.36 in 2009 to 4.84 in 2014 in the Flemish region and from 5.05 to 4.01 in Wallonia, is observable for every item included, but is especially pronounced for the regional institutions. Even though this is a marked decline, it is unsurprising, given the major political crisis the country went through between 2007 and 2012 (Hooghe Reference Hooghe2012). Other studies, too, suggest that this long-lasting governmental crisis had a negative impact on political trust levels in Belgium (Deschouwer et al. Reference Deschouwer, Delwit, Hooghe, Baudewyns and Walgrave2015). In terms of the differences between both regions, we observe that levels of political trust are somewhat lower in the Walloon region than in the Flemish region and the decrease of political trust over the 2009–14 electoral cycle is more pronounced among Walloon respondents as well (−1.04, compared with −0.53 for Flemish respondents).
Measuring Political Trust
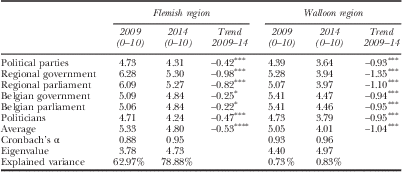
Source: Belgian Election Panel 2009–14.
Notes: N Flemish region=500 and N Walloon region=364. Entries are average scores on a 0–10 scale. Significance: *p<0.05; **p<0.01; ***p<0.001.
Although the scale is by itself one-dimensional and as such will be used in the analysis, for some analyses we will also use a distinction between federal and regional institutions. For these subscales only two items in each case could be used, referring to the regional or federal parliament and government, respectively. The reasons for making this distinction is that the N-VA in 2009 entered the regional government but not the federal government after the 2010 elections (Deschouwer and Reuchamps Reference Deschouwer and Reuchamps2013). It could be expected that dissatisfied N-VA voters after 2009 would develop higher levels of trust in the regional institutions, while they would continue to lose trust in the federal institutions of Belgium.
Our first two hypotheses deal with how trust affects voters’ electoral choices. Investigating the vote choice implies that our dependent variable has a categorical nature, distinguishing between different vote choice options in the 2014 elections. Therefore, we present the results of a series of multinomial logistic regression models and we examine voting in the two party systems separately. For the Flemish region we take a vote for the Christen Democratisch en Vlaams (CD&V – Christian Democratic and Flemish) as the reference category. We do so because this is the major mainstream party. The other outcome options are a vote for the green party Groen!, a vote for the Flemish nationalist party (N-VA), a vote for the liberal party Open Vlaamse Liberalen en Democraten (Open VLD – Open Flemish Liberals and Democrats), a vote for the social-democratic Socialistische Partij Anders (SP.a – Socialist Party Differently), a vote for the extreme right Vlaams Belang, a vote for another party and a blank or invalid vote. Similarly, for the French-language parties, we take a vote for the Christian democratic Centre Démocrate Humaniste (cdH – Humanist Democratic Centre) as a reference category. In the Walloon region, the other options are a vote for the green party Ecolo, the liberal Mouvement Réformateur (MR – Reformist Movement), the Parti Socialiste (PS – Socialist Party), the extreme left party Parti du Travail de Belgique – Gauche d’Ouverture (PTB-Go! – Belgian Workers’ Party – Opening to the Left), a vote for another small party and casting a blank or invalid vote.
We investigate the impact of political trust on vote choices while controlling for a number of socio-demographic control variables. We control for respondents’ gender, age and level of education – distinguishing between low levels of education (with no qualification or less than a high-school degree), middle levels (with only a high-school degree) and high levels of education (with a higher education degree). We additionally control for respondents’ level of political interest and their self-placement on an ideological left–right scale (both measured on a 0–10 scale).
We also investigate how attitudes of political trust evolve after voting for a populist or protest party. To test our third hypothesis, we first descriptively analyse the evolution of levels of political trust for voters of different parties. Subsequently, we perform a multivariate analysis explaining the impact of the vote choice in 2009 on levels of political trust in 2014, while controlling for the 2009 level of political trust. In order to do so, we run an OLS regression, in which we control for the same set of socio-demographic characteristics as included in the vote choice model.
RESULTS
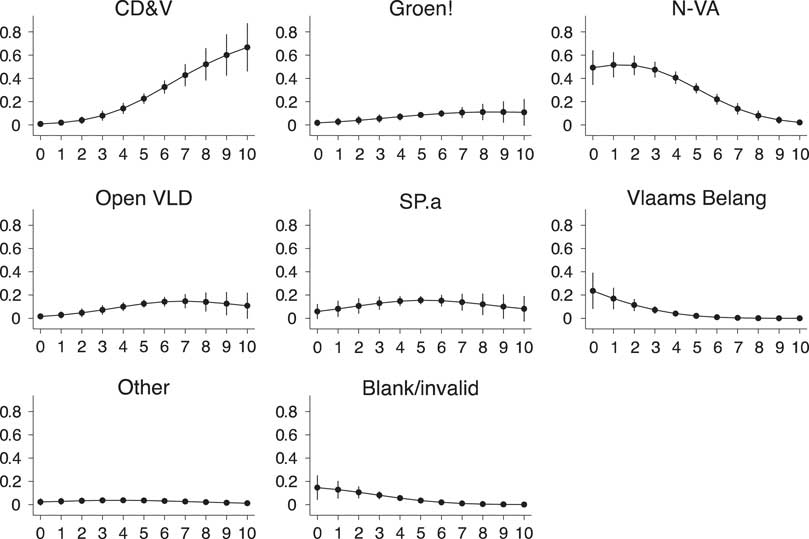
Before investigating the effects of political trust over time and voting for protest parties, we assess whether levels of political trust in the Flemish region are strongly correlated to preferring particular parties in 2014 – as they were in 2009 (Hooghe et al. Reference Hooghe, Marien and Pauwels2011). For the French-language party system, we expect that – as in 2009 – there is no clear pattern of distrusting voters choosing specific parties. We control for the effect of gender, age, levels of education, political interest and left–right self-placement. The full results of this multinomial regression analysis for the Flemish region are included in Appendix 1 in the online appendixFootnote 4 and suggest that political trust is indeed significantly related to respondents’ party preferences. Higher levels of political trust significantly decrease the likelihood that voters intend to vote for the liberal party Open-VLD, the Flemish nationalist party N-VA, the extreme right Vlaams Belang, another party or to cast a blank or invalid vote, rather than intending to vote for the CD&V.
As the coefficients obtained from a multinomial logit model are relative to the reference category and hence hard to interpret, in Figure 1 we present the average adjusted predictions of intention to vote for each of the parties by different levels of political trust. The results are in line with what was observed in 2009. Low levels of political trust are associated with higher probabilities of voting N-VA, Vlaams Belang or casting a blank or invalid vote. The results offer support for our first hypothesis, as lower levels of political trust are associated with higher probabilities of voting for protest parties. Even though the Flemish nationalist party N-VA is not generally characterized as a protest party (Boonen and Hooghe Reference Boonen and Hooghe2014; Hooghe et al. Reference Hooghe, Marien and Pauwels2011), the impact of distrust is strongest for this party. For the other parties, there is hardly any impact of political trust at all, with the notable exception of CD&V. A higher level of political trust strongly and significantly increases the probability of intending to vote for the Christian Democratic party in 2014. A possible explanation for this finding is that the party is perceived by Flemish voters as the main historical incumbent (Hooghe and Dassonneville 2014).
Average Adjusted Predictions of Intention to Vote for Each of the Parties by Political Trust (2014) – Flemish Region Source: Belgian Election Panel 2009–14. Notes: Data are weighted by socio-demographics (gender, age and level of education). Average adjusted predictions and 95% confidence intervals based on the model in online Appendix 1.
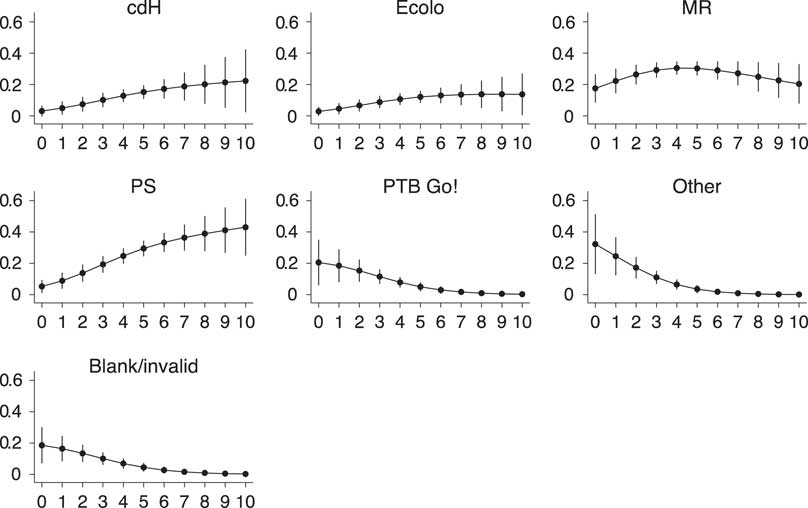
Next, we investigate the effect of political trust in 2014 on the voting intentions of Walloon respondents. As we have done for the Flemish case, we estimate a multinomial logit model and specify the cdH as the reference group. As there are no real protest parties among the French-speaking political parties, we do not expect one specific party to attract distrusting voters. The full results of this estimation are reported in Appendix 2 in the online appendix and indicate that for the main parties (that is, greens, liberals or socialists) there are no significant effects of political trust on the voters’ likelihood of voting for one of these parties rather than choosing cdH, the reference category in our analyses. We do observe, however, that those who voted for the extreme left party PTB-Go!, those who voted for one of the smaller parties (e.g. Front Démocratique des Francophones (FDF – Democratic Front of Francophones) and Front National (FN – National Front)) or those who cast a blank or invalid vote are significantly less trusting than those who intended to vote for cdH in 2014.
To facilitate the interpretation of these results, in Figure 2 we present the average adjusted predictions of intention to vote for each of the parties by different levels of political trust. While the effect of political trust to vote for PTB-Go!, another small party or to cast a blank or invalid vote is clearly negative, confidence intervals are rather wide – which is due to the small number of respondents in each of these categories. Furthermore, plotting the estimated effect of political trust on vote intention clarifies that having a higher level of trust in politics in 2014 significantly increases the probability of intending to vote for the socialist PS. In line with the observation that high levels of political trust increased the probability of voting CD&V in the Flemish region, we observe that in the Walloon region as well the party that is generally and historically perceived as the main incumbent is attracting the most trusting voters (Dassonneville and Hooghe Reference Dassonneville and Hooghe2012).
Average Adjusted Predictions of Intention to Vote for Each of the Parties by Political Trust (2014) – Walloon Region Source: Belgian Election Panel 2009–14. Notes: Data are weighted by gender, age and level of education. Average adjusted predictions and 95% confidence intervals based on the model in online Appendix 2.
The descriptive statistics for political trust in Table 1 have already shown that there was a decline in levels of political trust between 2009 and 2014. In the next step, we assess how these changes in trust levels between 2009 and 2014 affect which parties voters prefer. Therefore, we add to the models presented in online Appendix 1 and Appendix 2 respondents’ evolution of political trust between 2009 and 2014 (Δ political trust). This indicator takes a positive value if respondents are becoming more trusting in politics between 2009 and 2014 and a negative value if their level of trust in politics decreases. The predominant pattern among panel respondents is one of decreasing levels of trust in politics. For the Flemish case, in particular, we can also introduce a distinction between trust in the regional institutions (with N-VA in the governing coalition) and the federal institutions of Belgium (without N-VA in the governing coalition) as this allows us to observe whether the participation of N-VA in the regional governmental coalition actually makes a difference for Flemish respondents.
The full results of these multinomial logistic regression analyses are presented in the online Appendix 3 (Flemish region) and Appendix 4 (Walloon region). First, for the Flemish region, results indicate that, as well as respondents’ level of political trust, the evolution of this attitude is also correlated to vote intentions. As levels of trust increased between 2009 and 2014, panel respondents became significantly less likely to intend voting for the N-VA, Vlaams Belang or to cast a blank or invalid vote compared with voting for the CD&V.
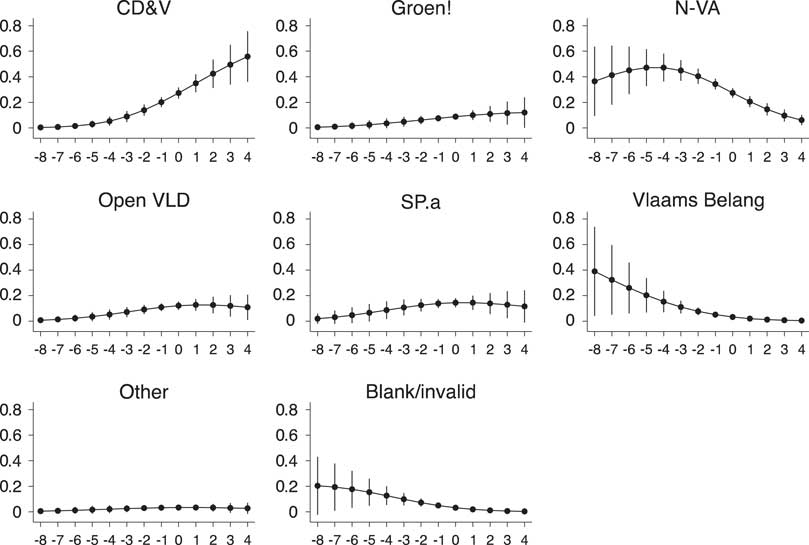
We graphically present the estimated effect of Δ political trust on intending to vote for each of the parties in Figure 3. The graphs clarify that, similar to what also holds for levels of political trust in the Flemish region for change in trust levels, effects are strongest for CD&V on the one hand and N-VA on the other. First, as voters become more trusting between 2009 and 2014, this significantly increases their probability of voting for the Christian Democratic party. The reverse is true for voting Vlaams Belang or casting a blank or invalid vote, although these effects are only marginally significant. For the Flemish nationalist party, we observe that improving trust levels significantly decrease the probability that respondents intend to vote N-VA.
Average Adjusted Predictions of Intention to Vote for Each of the Parties by Δ Political Trust (2009–14)–Flemish Region Source: Belgian Election Panel 2009–14. Notes: Data are weighted by gender, age and level of education. Average adjusted predictions and 95% confidence intervals based on the model presented in online Appendix 3.
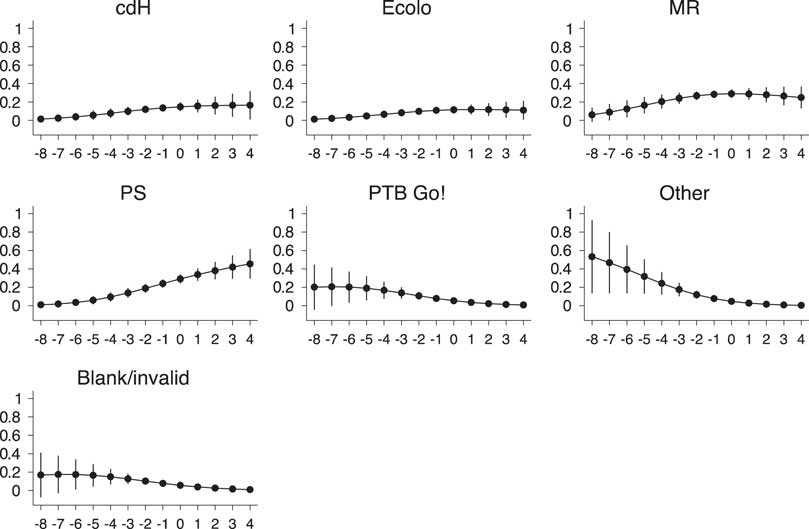
For the Walloon region too, focusing on the evolution of political trust over the electoral cycle results in similar conclusions. From the full results in online Appendix 4 it can be observed that there are no significant differences in the impact of Δ trust on choosing any of the main parties over cdH. We note, however, that a higher Δ-value significantly decreases the probability of choosing PTB-Go!, another party or of casting a blank or invalid vote rather than voting for cdH. The graphical representation of these effects (Figure 4) illustrates that variations in Δ trust have virtually no impact on the likelihood of voting cdH, Ecolo or MR, while we also note that higher Δ values are significantly increasing the probability of voting for the PS. For choosing the extreme left PTB-Go!, another small party or for casting a blank or invalid vote, finally, the estimated effect of Δ trust is negative, but highly uncertain.
Average Adjusted Predictions of Intention to Vote for Each of the Parties by Δ Political Trust (2009–14)–Walloon Region Source: Belgian Election Panel 2009–14. Notes: Data are weighted by gender, age and level of education. Average adjusted predictions and 95% confidence intervals based on the model presented in Appendix 4.
Combined, the results offer support for our second hypothesis: protest parties succeed in attracting voters who are becoming more distrustful. The analyses thus indicate that low levels of political trust as well as a decline of trust increase the probability of voting for protest parties. The contrast between the Flemish and Walloon region further highlights the key role played by protest parties: in Wallonia, where there are no clear protest parties running for election, patterns of protest voting remain more diffuse.
In the Flemish region, the Flemish nationalist party N-VA especially succeeds in attracting voters who are becoming more distrusting over time. Since 2009, however, this party was part of the governing coalition at the regional level.Footnote 5 Therefore the N-VA could no longer be considered a pure protest party at the regional level – in contrast to what holds at the federal level, where the party was in opposition. As an additional test, we therefore investigate how evolutions in regional political trustFootnote 6 and federal political trustFootnote 7 respectively affect voting behaviour in the 2014 elections. The results of these analyses are presented in online Appendix 5 and Appendix 6 and indicate that for both levels of governance decreasing levels of political trust significantly increase the probability of choosing N-VA, Vlaams Belang or casting a blank or invalid vote over choosing CD&V, confirming what we observed for a general sense of political trust. Even though the estimated impact of decreasing levels of federal political trust on choosing the N-VA is somewhat stronger compared with the effect of decreasing levels of regional political trust – the status of the Flemish nationalist party as an incumbent at the regional level does not seem to hinder it in attracting voters who have become more distrusting towards that specific level of government.
The question that remains is what subsequently happens to voters who have voted for a protest party? Does voting for a protest party suffice as a way to channel dissatisfaction, as Miller and Listhaug (Reference Miller and Listhaug1990) assume? Or do protest parties further ‘fuel’ distrust, as we hypothesized? We first descriptively assess changes in levels of political trust between 2009 and 2014 for the electorates of different parties. As evident from mean levels of change in political trust, on average, voters have become less trusting in political institutions, with a decrease of about 0.5 among Flemish respondents and a 1-point decrease on the 0–10 trust scale among Walloon respondents. Furthermore, for both groups, levels of trust in the regional institutions (parliament and government) have decreased somewhat more than levels of trust in the federal institutions. In terms of the differences between parties, among the Dutch-language parties, we note the strongest decrease in levels of political trust among those who voted Vlaams Belang, N-VA or Open-VLD in 2009. Table 2 also offers indications that N-VA voters are distinguishing between different levels of government. Their decrease of trust at the regional level – where the party was in the governing coalition – is less pronounced (−1.10) than at the federal level (−1.41), where the party was still in opposition. It is remarkable, though, that entry into the regional coalition did not have a beneficial effect on the level of trust N-VA voters had in that level of government. For the electorates of the French-language parties, levels of political trust have decreased in all groups, but quite markedly so among those who voted for the socialist party in 2009.
Δ Political Trust (2009–14) by Vote Choice in the 2009 Regional Elections

Source: Belgian Election Panel 2009–14.
Notes: N Flemish respondents=500 and N Walloon respondents=364. Mean values are reported. Values for groups <20 are not shown.
Although indicative, descriptive statistics are not sufficient for strong conclusions to be drawn on the impact of having voted for a particular party. We therefore proceed with the estimation of OLS regressions, explaining respondents’ change in political trust levels between 2009 and 2014.Footnote 8 Besides the socio-demographic variables gender, age and level of education, we also control for voters’ level of political trust in 2009, which takes into account potential ceiling effects when investigating the evolution of trust over time. In order to assess the impact of voting for a protest party on change in political trust, we add a series of dummy variables on respondents’ reported vote in 2009. For both language groups, we present three models, one explaining the evolution in general levels of political trust, a second model focusing on regional institutions, and a third on federal institutions.
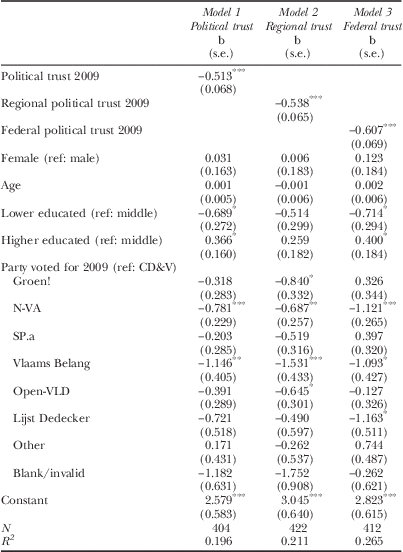
The results for the Dutch-language parties are presented in Table 3. First, it has to be noted that it is indeed important to control for the 2009 level of political trust, as the level of trust is significantly related to the subsequent change in trust levels. Most importantly, the results offer evidence for the thesis that protest parties are fuelling dissatisfaction. Respondents who voted for either the Flemish nationalist party N-VA or Vlaams Belang in 2009 had a significantly stronger decrease in trust between 2009 and 2014 compared with those who voted CD&V in 2009. Additionally, even though the previous analyses indicated that lower levels of trust as well as a strong decrease of political trust are significantly correlated to casting a blank or invalid vote, the results in Table 3 do not indicate a ‘strengthening’ of distrust felt by those voters similar to the strengthening of distrust held by those who voted for a protest party. This offers support for the causal mechanism suggested by Dinas (Reference Dinas2014). When focusing on trust in the regional or federal levels of government only, differences are minor, and those who voted for N-VA and Vlaams Belang in 2009 are consistently more distrusting over time. Focusing on having voted N-VA in 2009, the effect is somewhat smaller for regional political trust than for federal trust, but we note a significant decrease in both cases. The fact that among the 2009 N-VA voters, the trust in the regional institutions (in which the N-VA participated) further declined shows an interesting dynamic. While Miller and Listhaug (Reference Miller and Listhaug1990) assumed that giving protest parties a say in government could restore political trust among their supporters, the opposite seems to occur, as protest parties ‘contaminate’ the level they participate in. The fact that we do not observe much difference between Vlaams Belang and N-VA voters is highly relevant. While the Vlaams Belang remained stuck in the opposition, the N-VA joined the coalition at the regional level. Opposition or government, however, does not seem to have an effect on the development of trust levels among their supporters. Both groups of the electorate firmly continue to display all the characteristics of a protest vote.
Explaining Δ Political Trust (2009–14), Dutch-language Parties
Source: Belgian Election Panel 2009–14.
Notes: Data weighted by socio-demographics (gender, age and level of education). Unstandardized regression coefficients, standard errors in parentheses. Significance: *p<0.05; **p<0.01; ***p<0.001.
The results indicate that in effect the N-VA is associated with low levels of political trust. Not only does the party attract voters with lower levels of political trust, it has also been found that N-VA voters subsequently are more likely to develop even lower levels of political trust. These findings are all the more remarkable, since in reality, during the 2010–14 period, the N-VA occupied a rather ambiguous position in the Belgian federal system, by being in opposition on the federal level, while joining the governing coalition on the regional level. It falls outside the scope of the current article to explain this finding, but two potential explanations come to mind. Firstly, it is possible that Belgian voters consider the federal level to be the most important level of government, and as a result the N-VA for them was first of all an opposition party. A second possibility is that the party itself stressed in its campaign rhetoric its opposition to the federal government, while downplaying its accomplishments within the regional government. Further research is needed to assess which explanation is most plausible.
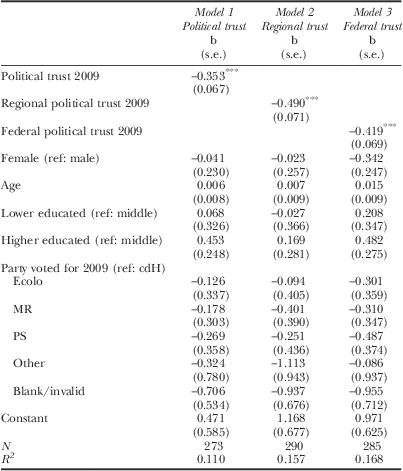
For voters in Wallonia, the descriptive results in Table 2 indicated that those who voted for the PS in 2009 became especially more distrusting over the 2009–14 electoral cycle. In Table 4, we assess whether a vote for the socialist (or any other electoral choice in 2009) has significantly affected the subsequent evolution of political trust in general, regional political trust or federal political trust. Unlike the results we observed for Flemish respondents, none of the 2009 vote options significantly affects the evolution of respondents’ attitudes of political trust over time. In the Walloon electoral context – a context that is marked by the absence of clearly identifiable protest parties – we find no evidence that particular parties would be fuelling political distrust.
Explaining Δ Political Trust (2009–14), French-language Parties
Source: Belgian Election Panel 2009–14.
Notes: Data weighted by socio-demographics (gender, age and level of education). Unstandardized regression coefficients, standard errors in parentheses. Significance: *p<0.05; **p<0.01; ***p<0.001.
DISCUSSION
Confirming previous research, we find that low levels of political trust are associated with a preference for a protest party. Furthermore, becoming more distrustful between two elections also increases the probability of voting for a protest party. As levels of political trust are deteriorating, not only do protest parties benefit electorally from the fact that the pool of low-trusting voters is growing, but the voters who are becoming less trusting are also more likely to vote for protest parties. If we want to understand how attitudes such as political trust affect political behaviour, it is hence important not only to look at levels but also to take into account changing attitudes. Longer panel data could shed light on fluctuations over a more extended period of time and provide insights into what happens if respondents vote for an anti-establishment party for a longer period of time. Interestingly, whether the protest party joins a government coalition (N-VA) or not (Vlaams Belang) does not seem to change this fuelling effect. For mainstream parties it is therefore not at all clear how they can react to the challenge of protest parties. Following a ‘damned if you do, damned if you don’t’ logic, both ignoring and incorporating protest parties seem to have exactly the same effect.
Our findings hint at a ‘spiral of distrust’.Footnote 9 Low levels of trust as well as decreasing levels of political trust increase the probability of voting for a protest party. Having chosen such a party subsequently acts to decrease one’s level of trust in politics even further. The result is a spiral of distrust, where distrust and protest voting enforce each other. Miller and Listhaug (Reference Miller and Listhaug1990) were quite optimistic on how flexible party systems would allow protest parties to rise. Such parties, according to Miller and Listhaug, could channel dissatisfaction and stop the accumulation of discontent. What we observe in the Belgian multiparty system is more in line with what van der Brug suggested held true in the Netherlands: protest parties can ‘fuel’ discontent and this discontent rises even further when the protest party is integrated in the governing coalition. In line with the argument by Dinas, casting a protest vote apparently leads to the consolidation of a specific political identity, and voters further develop the attitudes that are congruent with their party preference. The key role that protest parties play in this ‘spiral of distrust’ is evident from the contrast between voting behaviour in the Flemish and Walloon regions of Belgium. Among Flemish voters, those who voted for protest parties are becoming significantly less trusting over time. In the French-language party system, which is marked by the absence of a clear protest party, we do not observe a pattern in which voting for a particular party leads voters to become less trusting over time.
Obviously, this study comes with a number of important limitations. Firstly, the analysis is restricted to one particular case: the Belgian electoral context in the 2009–14 period. Future research should hence clarify whether our observations can be generalized more broadly, and applied to political systems that do not have compulsory voting. The fact, however, that for List Pim Fortuyn in the Netherlands previous research has also indicated a pattern of ‘fuelling’ discontent suggests that what we observe is not a particularity of Belgian electoral politics. Secondly, it has to be remembered that we only have data for one electoral cycle of five years. It is possible that this is not sufficient as an observation period to document the transformation from a protest party to a ‘party in government’. In order to show the presence of a ‘spiral of distrust’ convincingly, we would ideally make use of a panel study that covers a more extended period of time. Thirdly, the use of panel data also comes with disadvantages, of which panel attrition is an essential one. Finally, our results point out that those who voted for a protest party subsequently become more distrusting, but we can only speculate about the mechanism causing this pattern. More research, linking individual-level data with data on campaign coverage, is needed to enhance our knowledge of whether and how parties actively contribute to the spiral of distrust. Better insight in the exact causal mechanisms determining the spiral of distrust might also provide more specific suggestions on how the spiral could be reversed.
SUPPLEMENTARY MATERIAL
To view the supplementary material for this article, please go to http://dx.doi.org/10.1017/gov.2016.18.



