


1. Introduction
“[Donald Trump] is the chaos candidate”, Jeb Bush lamented in December 2015, “…and our nominating system is a chaos process.” Part of this chaos rests with the fact that presidential primary elections confront voters with a unique set of challenges. First, voters cannot rely on partisanship cues to inform their votes. Primary candidates vie to represent one party in the general election and their policy views tend to be similar to one another. Second, primary elections have involved large numbers of candidates since the current primary system effectively began in 1972. Ten of the last 13 election years have seen fields of over 10 candidates in either major party’s primary elections.Footnote 1 The 2016 and 2020 presidential election cycles have also seen the most crowded fields to date; 17 candidates ran for the Republican nomination in 2016, and a record 28 entered the Democratic primary race in 2020.
The 2020 Democratic presidential primaries exemplified all of these challenges and presented voters with new ones. In addition to being the largest candidate pool in history, 2020’s Democratic primary candidates represented the most diverse in a variety of ways. The field included six women, six nonwhite candidates, one openly LGBTQ candidate, and two candidates running to the left of the Democratic base. One implication of this is that even voters with strong preferences for a candidate with particular ascriptive characteristics would have more than one option. 2020 Democratic primary candidates also represented one of the most qualified fields in terms of prior office holding, so voters who valued experience would also have an abundance of options.
In addition to the difficulty associated with this surfeit of choices, incumbent president Donald Trump’s abysmal approval ratings among Democrats throughout his term in office led many in the popular press to posit that Democratic primary voters would be more concerned than ever about each candidate’s ability to beat him in the 2020 general election should they win the primary (Masket, Reference Masket2020). New York Magazine dubbed 2020’s Democratic primary “the Electability Primary.”
This focus on electability throughout the 2020 Democratic primary came as no surprise. Political scientists have long understood that voters implicitly consider a candidate’s chances of winning the general election when they cast their ballots in primaries (Bartels, Reference Bartels1988; Abramowitz, Reference Abramowitz1989; Steger, Reference Steger2007). Two major groups of questions remain, however. First, how exactly do voters trade off their policy preferences against electability perceptions? How do they choose between a candidate (or party) who agrees with them on the issues and a candidate who stands a much better chance of winning the general election? How large must the trade-off between agreement over policy issues and electoral prospects be before voters act on it? The second set of questions asks: how do voters even conceive of electability? Do they differentiate viability in a primary election from electability in a general election? Despite the term’s wide adoption in the media and by political scientists, electability vs. viability in the public mind has not been a topic that has received direct scholarly attention.
In this study, we present two distinct experiments to address these questions. The first of these (study 1) asks respondents to evaluate potential trade-offs between voting for a candidate who agrees with them on a wide variety of policy issues and voting for a candidate who might be more likely to win the general election. Our approach to this elicitation departs from past work in two important ways: first, we present information about policy agreement and electability to respondents on the same scale, allowing them to make a tractable comparison and allowing us to interpret treatment effects in terms of utility. This is a crucial difference compared to prior work because it allows us, for the first time, to directly compare the relative impact of policy proximity and electability. Second, we calculate policy agreement by comparing respondents’ views on a wide variety of policy items to candidates’ own responses instead of showing an abstract measure of ideological distance. We find that presenting respondents with information about electability can change their intended votes, but not nearly as often as commentators framing elections as “electability contests” would suggest. Respondents remain largely policy-driven in their evaluations of candidates.
In our second experiment (study 2), we explore how voters conceptualize electability. Political scientists painstakingly distinguish between the ideas of electability and viability, where the former refers to a candidate’s chances of winning the general election and the latter refers to her chances of winning the primary. We offer some of the first evidence about voters’ own views of electability. We show that respondents have a much more general sense of what electability means than the literature has posited thus far. We do this in two ways. First, we show that describing a candidate’s chances of winning to respondents in terms of electability, viability, or a combination of the two does not differ in their effects on voters’ candidate evaluations (i.e., voters do not draw distinctions between these portrayals of electability). Second, when we asked respondents to describe electability in their own words, we found that they largely understood it as a general measure of how qualified or broadly appealing a candidate is, with surprisingly little focus on the strategic aspects of winning elections, candidate identity, or candidate ideology. Taken together, findings from the two experiments suggest that candidates’ policy positions play a substantial role in vote choice even when concerns about electability in a given election are high. Additionally, people interpret the information they receive about candidates’ “electability” as a very general signal about how popular they might be.
2. Strategic voting
2.1. The rational calculus of voting
Since Downs (Reference Downs1957), models of voting behavior have assumed that voters seek to maximize utility. The decision to turn out depends on whether a voter’s perceived utility outweighs the costs associated with the act of voting. Even conditional on turning out to vote, voters prefer to select candidates who maximize their utility. The utility voters can expect to derive from supporting a particular candidate is a function of many possible inputs, but chief among these is the projected benefit afforded to them by a candidate’s future policy decisions. In an election with just two candidates who have distinguishable policy platforms, the implications for utility-maximizing voters are straightforward. Assuming voters know enough about candidates to make informed decisions, the utility-maximizing decision for each voter is to cast a sincere ballot for the candidate who promises to enact policies closest to her preferences (Downs, Reference Downs1957; McKelvey and Ordeshook, Reference McKelvey and Ordeshook1968; Riker and Ordeshook, Reference Riker and Ordeshook1973).
Elections marked by competition between more than two candidates, imperfect information, or both provide a variety of incentives for voters to deviate from the candidates who might support their most desired policies. In elections with more than two options, voters consider not just the benefits they might receive from each candidate’s policies but also the probability that those policies are realized (McKelvey and Ordeshook, Reference McKelvey, Ordeshook, Herndon and Bernd Joseph1972; Abramson et al., Reference Abramson, Aldrich, Paolino and Rohde1992; Aldrich, Reference Aldrich1993). Consequently, voters might strategically cast their ballots for less preferred candidates who stand better chances of winning the election—particularly when their first-choice is unlikely to be elected, and the contest between candidates further down the list is close (Stone et al., Reference Stone, Rapoport and Abramowitz1992; Heath and Evans, Reference Heath and Evans1994; Blais and Nadeau, Reference Blais and Nadeau1996). Indeed, in first-past-the-post electoral systems where parties or candidates win by maximizing their total votes within the relevant jurisdiction, voters tend not to “waste” votes on fringe candidates or small parties because they know such candidates are unlikely to win (Duverger, Reference Duverger1954; McKelvey and Ordeshook, Reference McKelvey, Ordeshook, Herndon and Bernd Joseph1972; Cox, Reference Cox1997).
2.2. Empirical evidence of strategic voting
Empirical evidence demonstrating that voters engage in some form of strategic voting across electoral systems and election years is abundant in the literature (e.g., Artabe and Gardeazabal, Reference Artabe and Gardeazabal2014; Leowen et al., Reference Leowen, Hinton and Sheffer2015; Eggers and Vivyan, Reference Eggers and Vivyan2020). What remains less clear is how much voters weigh their policy preferences relative to electability concerns. In the context of a formal model, researchers can start from a series of assumptions about the sizes of these trade-offs and derive closed-form solutions in equilibrium that identify the conditions under which a voter might change her choice. The empirical realities underlying these assumptions remain relatively unexplored, partially due to the fact that measuring this form of voter behavior is extremely difficult. Researchers who pursue this question in the context of real elections have to ask voters both about the candidates they might have preferred to the ones they ultimately voted for and about how they perceived candidates’ electoral prospects. Accessing past preferences over candidates is a difficult task for voters; voters may either recall them incorrectly or state that they always preferred the candidate for whom they voted, even if they convinced themselves of that fact in the final moments before casting a ballot. Similarly, without additional information, the candidates voters perceive to be most likely to win may be endogenous to their personal preferences over candidates (Granberg and Brent, Reference Granberg and Brent1983; Simas, Reference Simas2017; Green et al., Reference Green, Schaffner and Luks2022). All of these challenges make research questions about voters’ preferences and strategic behavior particularly well-suited to experimental formats, where researchers can control and manipulate the information environment prospective voters interact with, mitigating concerns about the endogeneity of perceived electability to voter preferences.
Previous studies have taken advantage of these design benefits in order to learn about strategic voting. Rickershauser and Aldrich (Reference Rickershauser and Aldrich2007) presented undergraduates with information about whether or not leading candidates in the 2004 Democratic presidential primary race emphasized social security or economic concerns as a campaign issue, as well as information about whether each candidate was likely or unlikely to defeat George W. Bush in the upcoming general election. Similarly, Simas (Reference Simas2017) treated respondents with information about where hypothetical candidates for a U.S. House primary were located on an ideological spectrum and how hypothetical polls ranked their chances of winning the general election. Both studies found that respondents were significantly more likely to support candidates presented as more electable. Minozzi and Woon (Reference Minozzi and Woon2023) took a different approach, using a survey experiment on 2020 Democratic voters to estimate the proportion of voters who base their decisions primarily on a preference scale, an electability scale, or a classic expected utility framework in which preferences are weighted by electability (Abramowitz, Reference Abramowitz1989; Abramson et al., Reference Abramson, Aldrich, Paolino and Rohde1992; Stone et al., Reference Stone, Rapoport and Abramowitz1992).
We expand upon these designs in several ways. First, our measure of policy agreement between respondents and candidates captures positions on a wide variety of salient topics rather than using one or two or collapsing policy alignment into an abstract ideological scale. The disadvantage of selecting small numbers of policy issues is that these may not be entirely representative of the issues important to the electorate in a given election; while a candidate’s positions on social security or the economy might cue ideological leanings, those issues may not be important to respondents and leave them still relatively uninformed about how to vote. The disadvantage of collapsing everything into a single ideological scale is that respondents have to make reasonable inferences about how to position themselves and how much distance they might accept between themselves and a candidate before they withdraw their votes. This is a potentially difficult task, and respondents may approach it from the perspective of centrist bias in the sense that they may overwhelmingly view themselves as moderate and view others as extreme (Levendusky and Malhotra, Reference Levendusky and Malhotra2016).
Second, another advantage of our approach is that we present electability and policy agreement to respondents on the same scale. Other research in this vein has typically presented policy alignment on either a small subset of issues or as a score on an ideological scale, then presented electability separately as statements about whether a candidate is likely or unlikely to win an upcoming election (Rickershauser and Aldrich, Reference Rickershauser and Aldrich2007; Simas, Reference Simas2017). Alternatively, some studies have echoed the formal utility maximization approach to voting by introducing electability as a probability dictating how likely respondents might be to have their ideal policy bundles realized (Minozzi and Woon, Reference Minozzi and Woon2023). All of these approaches can yield meaningful information, but they do not permit researchers to directly analyze trade-offs between electability and policy agreement, which is our aim in this study. That is, the lack of a common scale has prevented past work from cleanly estimating the relative importance of proximity and electability.
Third, it is not always clear what cues about electability actually communicate to respondents. Researchers typically present these as the chances that a candidate might beat an opponent in the general election. Yet, for candidates running in primary elections that have not yet yielded a nominee, it is not obvious whether respondents think about that signal as the chances that a candidate might win conditional on winning the primary or absent any concerns about the primary. Do voters differentiate viability in a primary from electability in a general election? We address the first two design limitations in study 1 and the last one in study 2.
3. Study 1: trade-offs between policy agreement and electability
3.1. Recruiting respondents for study 1
We recruited 1,651 participants for study 1 using Amazon’s Mechanical Turk (MTurk) between March 2, 2020, and March 4, 2020. We restricted the sample to U.S.-based MTurkers with task approval ratings of 95% or better. Respondents were recruited for a multi-stage experiment, where 531 of our 1,651 participants were randomly assigned to additional treatment conditions designed to isolate the effects of electoral endorsements. These results are omitted here for brevity and fully detailed in other work. The effective total respondent pool for this study is the 1,120 respondents assigned either to control (580) or just the electability information treatment (540), as described later in this section.
Data collection ran concurrently with primaries and caucuses in Super Tuesday states. By early March, several candidates had suspended their campaigns in the wake of disappointing primary results in Iowa, New Hampshire, and South Carolina. Accordingly, respondents in our experiment were asked to choose between the remaining candidates, Joe Biden, Bernie Sanders, Tulsi Gabbard, Elizabeth Warren, and Michael Bloomberg. We terminated data collection before Michael Bloomberg announced that he was suspending his campaign on March 4 and dropped respondents who reported living in any state where primary elections had already closed by the time our survey went into the field.
3.2. Study 1 experimental framing
After providing their demographic background, political views, and participation history, all participants in study 1 saw the control text depicted in blue in Figure 1. We framed this experiment around the consideration of a second- or third-choice candidate for several reasons. First, 23 candidates had already exited the 2020 Democratic primary race by the time this study went into the field. Polls suggested that 10–15% of voters declared their intention to vote for someone in January who had dropped out of the race by late February, and pollsters regularly asked respondents about second choices.Footnote 2
Intervention preamble.

Figure 1 Long description
Many voters may not get to vote for their first-choice candidate in the 2020 Presidential primary (or general) election. It is important to consider the possibility, for instance, that a candidate might experience health issues serious enough to force him or her to withdraw. Other candidates might withdraw from the race due to a family emergency or a lack of campaign funding. As a voter, it is important to think about candidates who might be the best second or third choice for you in case you do not get to vote for your favorite candidate. So for the following screen, you will see a list of candidates who agree with you most on policy issues - but who were not your first choice to be in the 2020 Democratic nomination. The candidate in the top spot is your closest match, while the candidate in the last spot is your weakest match. You will also see some additional information about these candidates. This information will tell you each candidate's chances of winning the 2020 Presidential election against Donald Trump. Please review the information about these candidates and tell us more about how you plan to vote in 2020. Control Treatment Next.
By definition, the need to consider alternatives to a first choice is ever-present for voters in any election who begin by supporting anyone other than a frontrunner. Polling data collected throughout the 2020 Democratic primary suggested that this group of voters was large; for instance, Quinnipiac polls from July 2019 to February 10, 2020, never showed a combined total of support for Biden and Sanders larger than 49%, leaving 51% of the electorate to weigh their lower-ranked choices.Footnote 3 From this perspective, framing decisions around second, third, fourth, and fifth choice candidates would have seemed both highly realistic to voters and generalizable to any election context where they may not have gotten to vote for their top choice.
Another reason to ask voters to think beyond their first choices in this setting was the possibility that many were still weighing their options. In January 2020, a Pew Research Center survey showed that 54% of Democratic respondents who expressed a preference for a candidate in the primary were actually enthusiastic about several options.Footnote 4 In our data, which we describe in more detail in Section 3.1, only 52% of all respondents and 67% of Democratic respondents who passed quality controls reported being certain that they would vote for their first-choice candidate if that candidate was still on the ballot for their state’s primary. Since it was likely true that many Democratic voters liked more than one candidate in the race and therefore remained open to the possibility of voting for more than one candidate, presenting respondents with a series of candidates beyond strictly a first choice would not have looked like a departure from the way they were likely thinking about primary candidates before participating in the study.
Prospective voters had other reasons to consider more than one candidate in 2020. Bernie Sanders had a heart attack in October 2019. In the wake of the cardiac incident, Sanders’ campaign was forced to cancel several events. Respondents to a series of polls in the aftermath expressed concerns that Sanders’ physical health might impair his ability to serve as president and conveyed their reluctance to nominate a candidate over 70 years of age. Since Sanders was a frontrunner, considering the remaining candidates was a meaningful concern for a nontrivial portion of Democratic primary voters. Primary voters taking our survey were likely to have been aware of this incident and the implication that considering a second choice to replace any older candidate they might have been considering as a first choice was a good idea, making them more inclined to take a survey exercise like ours seriously.
All of these features of voting made framing the experiment in terms of second choices relevant and realistic, but another key set of reasons we asked respondents to think about second choices was rooted in design and ecological validity. To the extent that respondents had settled on first-choice candidates, those choices were a function of candidate characteristics, information, and circumstances that we could not manipulate. For all of the reasons we discussed in the previous section, it would be extremely difficult to assess the roles that policy agreement and electability played in respondents’ support of their first choice candidate as that formed outside of our experiment—and more difficult still to understand trade-offs between the two. So, we asked respondents to make a new choice in which policy and electability information would be relevant, and the effects of either would be estimable. Additionally, since the intervention in this experiment presents respondents with information about policy and electability, we needed to focus on a context in which that information would be useful to respondents. Focusing on first choices may not have allowed us to evaluate the roles of this information because respondents may not have been sensitive to it for a variety of reasons. Respondents may have had powerful affective commitments to their first choice (but not a second, or third) that led them to ignore information about how good a policy match that choice might have been and how electable they might have been. Respondents may also have been disproportionately well informed about a first choice (but not a second, or third) and stood to learn nothing about that particular candidate. Thus, we framed this experiment in terms of second choices in order to guide respondents toward a new choice that we could observe, for which policy and electability information might have been valuable, and where the trade-offs between the two might have been most meaningful.
3.3. Study 1 policy agreement and electability
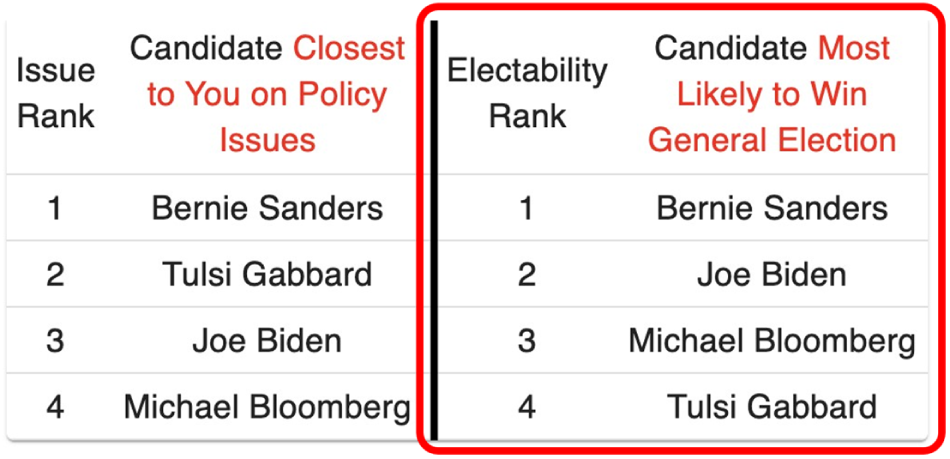
Policy agreement: All 1,120 respondents in study 1 saw information telling them which remaining Democratic primary candidates agreed with them most on a series of policy issues. Respondents received this information in the format shown in Figure 2. Respondents in the control condition (580) only saw the left half of the table in Figure 2; the right half, enclosed in a red box, was only shown to respondents assigned to the electability information treatment condition (540). Respondents in the treatment condition would have also seen the preamble text inside the red box in Figure 1. Note that, given the framing of the experiment we described above, the example in Figure 2 corresponds to a respondent who said Elizabeth Warren was her first choice among the remaining primary candidates. Elizabeth Warren does not appear in the list, but Bernie Sanders appears as this respondent’s best match along policy issues absent Elizabeth Warren.
Agreement and electability treatment.

Figure 2 Long description
The table has four columns: Issue Rank, Candidate Closest to You on Policy Issues, Electability Rank and Candidate Most Likely to Win General Election. Row 1: Issue Rank 1, Bernie Sanders; Electability Rank 1, Bernie Sanders. Row 2: Issue Rank 2, Tulsi Gabbard; Electability Rank 2, Joe Biden. Row 3: Issue Rank 3, Joe Biden; Electability Rank 3, Michael Bloomberg. Row 4: Issue Rank 4, Michael Bloomberg; Electability Rank 4, Tulsi Gabbard.
The policy agreement ranking that appeared to respondents in our study is based on a measure of distance between participants’ answers to a battery of policy questions and remaining primary candidates’ answers to these same questions. Constructing this ranking required us to identify positions candidates had taken on the same survey items asked of respondents. Because surveying the 2020 Democratic primary candidates themselves would prove prohibitively difficult, we based our questions to respondents on a series of items that The Washington Post had already asked of them.Footnote 5 the Post’s questions covered a wide range of topics, including gun control, drug legalization, taxation and inequality, education, climate change, immigration, democratic institutions, and foreign policy. We selected questions from across the full range of categories, prioritizing questions for which there was variation in responses among candidates.
The full set of questions we used to construct the policy agreement battery appears in Supplementary Appendix I. Not all candidates responded to all of The Washington Post’s questions, so we weighted respondent-candidate distances by the proportion of questions each candidate answered.Footnote 6 Ties between candidates who were the same distance to a given respondent were broken randomly. Our approach weighs all policy areas equally for respondents. The Washington Post did not elicit rankings or priority policy areas from candidates, which means we could not directly compare respondents and candidates along policy views and their relative importance. The implication of this assumption is that candidates agree with respondents most at the lowest distances between their scores across issues and respondents’ own, but may not agree with respondents on the issues they care about the most. This assumption is simplifying but plausible in a world where most voters care more about just one or two issues. A detailed reference to this coding scheme appears in Supplementary Appendix F.
Electability: Respondents assigned to the treatment condition were also shown the right-hand side of the table in Figure 2.Footnote 7 Electability rankings presented to all respondents were fixed; what respondents assigned to treatment ultimately saw differed only in that we removed the candidate they identified as their first choice. As Figure 2 shows, this ranking shows respondents who might be the candidate most likely to win the general election. This is the traditional definition of electability used in the press and the academic literature, but we will return to study how voters interpret this information in study 2. We based the electability rankings presented to respondents on polling averages calculated from polls conducted on the eve of Super Tuesday (March 3, 2020). We summarize the polls included in this average in Table 1. We focused on polls fielded between February 20 and March 4 that (1) specifically asked about electability, or each Democratic primary candidate’s perceived chances of beating Donald Trump in the November 2020 Presidential election and (2) asked about most (if not all) candidates remaining in the race as of March 2.
Late February and early March general election head-to-head polls against Donald Trump

Table 1 Long description
The table compiles late February to early March 2020 polls that asked which Democratic candidate would do best against Donald Trump, either via head-to-head vote choice or “best chance to beat Trump” questions. Each poll lists percentages for Biden, Sanders, Warren, Bloomberg, and sometimes Gabbard, plus an implied rank within that poll. Sanders ranks first in four of six polls (CBS/YouGov, Economist/YouGov, Morning Consult Feb 23, and Fox News), while Biden ranks first only in the March 1 Morning Consult poll. Bloomberg’s best showing is a first-place implied rank in Harvard Harris, where he leads that question, while Warren is consistently near the bottom, ranking fourth in five of six polls and second only in the CBS/YouGov head-to-head item. The average implied ranks summarize the period: Sanders first, Biden second, Bloomberg third, Warren fourth, and Gabbard fifth based on the single poll that included her. Percent levels vary by question wording and pollster, so comparisons are most reliable within each poll’s ranking rather than across different formulations.
Notes: Polls included in this table taken from the RealClearPolitics polling summary from February 20, 2020, to March 3, 2020, in order to depict the information environment surrounding the days preceding and running through the period in which the experiment was fielded (3/2–3/4). Some polls listed in RealClearPolitics for this period were dropped because they did not contain general election electability questions that pitted each Democratic primary candidate against Donald Trump. Polls listed in this table often included Amy Klobuchar and Pete Buttigieg—candidates who had dropped out of the race by March 2.
Measuring electability is far from straightforward, and there are several important caveats to the approach we used. First, Table 1 shows that we aggregated across polls that formulated the electability question in a variety of ways. Additionally, not all polls asked about all primary candidates; just one poll included Tulsi Gabbard. For simplicity, we derived the implied rankings directly from each poll and then averaged these to construct our ranking for which Democratic primary candidate prospective voters saw as the “most electable” against Donald Trump.Footnote 8 We also looked at how candidates polled in terms of viability, or the extent to which voters declared support for them to be the Democratic nominee. These would have yielded an identical set of rankings for the remaining candidates. We similarly checked each remaining primary candidate’s odds of winning across a series of betting and prediction markets before fielding our experiment. These would have also produced the same ranking we showed treated respondents in our study.
Detailed snapshots of the 2020 Democratic primary viability polls and prediction markets appear in Supplementary Appendix D. We did not explicitly provide respondents with information on how electability rankings were calculated. While doing this would have likely enhanced respondents’ investment in the realism of the experiment, incredulity from respondents who rejected it as fact would have likely biased any potential treatment effect of seeing the information to zero. Additionally, presenting electability rankings as a fixed list generated by a process unconnected to policy agreement ensures against the possibility that respondents’ electability rankings might be endogenous to their policy preferences—a common problem for experiments that elicit respondents’ own perceived electability rankings.
The timing of these polls is critical. While Joe Biden had already won the February 29 South Carolina primary and would ultimately go on to win both the Democratic nomination and the presidency, most of the polls that would capture Biden’s post—South Carolina surge in electability remained in the field for several days after election results came in. Polls did not register Biden as the most likely winner until after March 4—when our survey had already come back from the field.Footnote 9 Almost any aggregation of polls that pre-dated our survey would have put Sanders ahead of Biden in terms of electability.Footnote 10 Respondents researching candidates on their own would have seen the same information: while some media outlets had begun to suggest that Biden would win the nomination after South Carolina, most polls still put Sanders first in light of wins in Iowa, New Hampshire, and Nevada, and most elite media outlets had not yet completely coalesced around Biden as the most electable candidate in the first days of March. Our study’s aim was not to correctly forecast the winner, but rather to present respondents with a reasonable forecast of each candidate’s electoral prospects as they appeared on March 2, 2020. While the tone of the Democratic primary changed substantially after our study period, the information we presented to respondents would have looked completely plausible relative to the available data on March 2.
To further guard against the possibility that survey respondents might read news media arguing that Biden was overtaking Sanders as the most electable candidate, we replicated the main analysis we will present in Sections 3.4 and Supplementary Appendix C with just respondents who reported supporting Biden or Sanders as a first choice. Since we framed our experiment around second-choice candidates, these respondents would not have seen Biden and Sanders ranked against one another if they received the electability information treatment. Instead, they would have seen either Biden or Sanders ranked ahead of Michael Bloomberg, Tulsi Gabbard, and Elizabeth Warren—information that would have been unlikely to strike even the most informed respondents as invalid on its face. Results using these respondents are essentially identical to the results we will present in forthcoming sections.
3.4. Study 1 results: electability and vote choice
Voters are likely to take information on policy agreement more seriously when they have had little chance to invest in a candidate’s personal or ascriptive characteristics and when they know relatively little about a candidate’s policy positions heading into an election, which is why we expected agreement on policy information to matter considerably more when voters were asked to evaluate candidates outside of their top choice. Our results bear out this expectation. Our chief outcome question asked survey respondents to tell us: “Which of the following candidates would you most likely vote for in the 2020 Democratic presidential Primary if your favorite candidate was no longer running?” 282 (46%) of Democratic and independent respondents said that absent their first choice, they would vote for the candidate our survey tool suggested might be their top match on policy issues. The proportions of respondents who selected the top-ranked candidate in terms of either policy congruence or electability appear broken out by treatment condition in Table 2.Footnote 11
Proportions of democratic respondents who chose top-ranking candidates

Table 2 Long description
The table reports, by treatment status, the share of Democratic respondents whose top-ranked candidate was based on policy, electability, neither, or the candidate who was top on both lists, along with sample sizes. In the control group of 330, about 51 percent chose their top candidate based on policy, 22 percent on electability, and 31 percent on neither. In the treatment group of 280, policy-based choices were lower at about 41 percent, while electability-based choices were higher at about 29 percent; neither was about 35 percent. The share selecting the candidate who was top-ranked on both policy and electability was about 4 percent in both groups. The proportion whose top policy and top electability candidate were the same was about 8 percent in control and about 12 percent in treatment. Interpret comparisons cautiously because the control group did not explicitly receive electability information, even though the table reports what their overlap would have been under treatment.
Notes: 97 of 1,071 respondents (9%) assigned to one of the three treatment conditions in our sample saw the same candidate appear as their top-ranked policy and electability option. The proportion of respondents within each treatment category who have the same candidate at the top of each list appears in the rightmost column above (respondents in the control condition did not explicitly see information about each candidate’s electoral prospects, but the proportion reported in that cell reflects how many of them would have seen the same candidate in the top spot had they been treated). Respondents in the second column from the right both had the same candidate at the top of each list and chose that candidate.
These proportions help answer an intuitive question: if respondents were planning on selecting a candidate who agreed with them most on policy issues, can revealing candidates’ electoral prospects change their minds at all? More formally, we can represent the average treatment effect of receiving information about a candidate’s electoral prospects as a difference in the average proportions of respondents who said they would vote for their best-ranked second choice candidate in terms of policy agreement. Table 2 shows that this difference is −0.10. The associated p-value from a two-tailed t-test of difference in means, where the null hypothesis holds that the average proportions of people who select their top match in terms of policy agreement do not differ across treatment conditions, is 0.02, suggesting that presenting treated respondents with information about a candidate’s electoral prospects makes them significantly less likely to choose the candidate they most agree with at the 5% level.
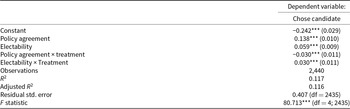
Focusing on candidates in the top-ranked position presents a “hard case” for our results, in the sense that it ignores respondents who may well have changed their minds after seeing information concerning electability but decided to select, for instance, a candidate ranked second in their policy agreement rankings over a candidate ranked third, and so forth. Table 2 suggests that 31–35% of Democratic and Independent respondents across treatment conditions chose candidates who appeared to them neither as the top-ranked candidate in terms of policy agreement, nor as the most electable candidate. We can incorporate these respondents by reconceptualizing our outcome as an indicator for whether a given respondent said that she would vote for a given candidate if her first choice dropped out of the race. In the context of our experiment, this produces four observations for each respondent. We can regress the indicator for whether a respondent declared her intention to vote for each of the four candidates she saw in her ranked lists on an indicator for treatment (seeing electability information), each candidate’s policy agreement with our respondent, each candidate’s electoral prospects, and interactions between these and the treatment. The results of this analysis appear in Table 3. Policy agreement and electability are both operationalized using the candidate rankings for both features that respondents actually saw in the experiment. Rankings are reversed in this analysis such that positive coefficients imply that better rankings in either category increase the likelihood of selecting a given candidate; the top-ranked candidate in each category is ranked 4, with the second-best candidate ranked 3, and so on.
Electability treatment and vote choice: all candidates

Table 3 Long description
The table reports a regression predicting whether a respondent chose a candidate. Policy agreement has a positive, highly statistically reliable association with choosing the candidate and is larger than the electability effect. Electability also shows a positive, highly statistically reliable association with choice. The interaction between policy agreement and the treatment is negative and highly statistically reliable, indicating the treatment weakens the influence of policy agreement on vote choice. The constant term is negative and highly statistically reliable, suggesting a lower baseline likelihood of choosing the candidate when predictors are at their reference levels. The model uses 2,440 observations and explains about 0.12 of the variation in the outcome, with a residual standard deviation around 0.41. Overall model fit is strong based on the reported F statistic with high statistical reliability. Coefficients are associations and should not be interpreted as causal effects without additional design details.
Notes: Standard errors clustered by respondent. Rankings reversed for ease of interpretation.
*p < 0.1; **p < 0.05; and ***p < 0.01.
There are several things worth noting about this result. First, the specification in Table 3 makes the assumption that treatment could only affect intended vote via interaction with information about policy agreement or electability. We assume that simply seeing information on electoral prospects in addition to information on policy agreement has no effect on our respondents’ intended vote outside of considerations related to these two features. Relaxing this assumption, as we do in Table 13 of Supplementary Appendix E, does not change these estimates and implies that the coefficient for a lower-order treatment term is essentially zero. Second, this result suggests that, even if we look beyond candidates ranked in the top spots, candidates ranking one unit higher in terms of electability were approximately 3% (±2.2%) more likely to get a treated respondent’s vote relative to a respondent assigned to control in this experiment.
Finally, while these results provide some intuition for both the relative importance of policy agreement and electability and how treatment affects both, they do not fully reflect the decision presented to respondents in this study. Respondents were asked to select the single candidate they would vote for in the event that their first choice dropped out; they were not asked to reflect on each candidate separately. Respondents thus faced a multinomial choice problem in which the set of choices they saw was constrained by the candidate they declared as their first choice overall. One implication of this design that is obscured in Table 3 is the fact that both the average probabilities of considering candidates as a second choice and the effects of electability differ by candidate. We address this formally in Supplementary Appendices B and C. Supplementary Appendix C provides our underlying voter utility model, connects this model to a multinomial choice estimation framework, and similarly shows that candidates’ policy proximity to voters has a stronger effect on the log-odds of being chosen by voters than candidates’ purported chances of winning do.
4. Study 2 and the interpretation of electability
The key treatment in study 1 was exposure to a specific informational cue representing each candidate’s chances of winning the general election. This approach raises two questions: one about the relevant mechanism and the other about how voters interpret the information given to them. In terms of mechanisms, the treatment likely worked in one of two ways: by raising the salience of information about electability or by changing respondents’ perceptions of who might have been more or less electable. While isolating the precise pathway by which respondents experienced treatment is impossible in our study, we think the salience mechanism was the more likely driver of what we observed because the electability information treated respondents saw was a reflection of contemporary polls, betting markets, and press coverage. Given the treatment’s consistency with virtually every other source of information about electability respondents might have encountered outside of the experiment at the time, it is unlikely that treatment would have radically reshaped their background sense of each candidate’s chances of winning. Respondents who found the electability information they saw implausible would have likely rejected or ignored it, thereby pushing our treatment effects to zero. Similarly, by virtue of random assignment, we have no reason to believe that respondents assigned to the treatment and control conditions would have had systematically different perceptions of candidates’ real-world chances or of electability in general. We also mitigate any effects that respondents’ background perceptions of electability might have had on our treatment effects by explicitly controlling for candidates’ underlying electability scores (whether respondents saw these or not) in Table 3, and by showing that our results are robust to accounting for the extent to which respondents followed politics and might have been exposed to electability information outside the experiment in Supplementary Appendix E.2. We also show heterogeneous effects by level of exposure in Supplementary Appendix B; policy agreement appears more important to respondents who claim to follow politics.
While this evidence makes us confident that heterogeneity in respondents’ perceptions of electability was unlikely to have posed a threat to inference in the context of this experiment, it leaves open our other question about how respondents understood what exactly electability meant. We conducted study 2 to address some of these questions and clarify how respondents understood the treatment using 2,468Footnote 12 respondents recruited via the CloudResearch Connect platform, from January to February 2025. We provide a detailed description of the design, recruiting procedures, and results in Supplementary Appendix H.
4.1. Study 2 results: what is electability?
In study 1, we represented electability to respondents as a ranking indicating which candidate was “most likely to win [the] general election”—in keeping with recent experimental literature.Footnote 13 Yet this framing of electability introduces potential ambiguity. Winning the general election and winning the primary are necessarily connected, and by eliding any mention of the primary researchers who opt for language like ours leave respondents to wonder whether winning the general election should be understood as the probability of winning the general election conditional on winning the primary, the joint probability of winning the primary election and the general election, the probability of winning the general election as if the primary did not matter, or something else entirely. Respondents who understood that primary and general electorates were different groups of voters, for instance, might have believed a particular candidate would have fared the best against Donald Trump in the general election but was unlikely to satisfy a more ideologically extreme primary electorate. Alternatively, respondents might have thought a progressive candidate more viable in a primary decided by a left-leaning Democratic base, but less electable in a general election decided by moderates.
If respondents did understand the electability information they saw as a specific combination of candidates’ chances of winning the primary election and chances of winning the general election, then our treatment effect might be interpretable as local to only a specific conception of electability and a specific type of trade-off with getting a candidate who shares a respondent’s views. To test this possibility explicitly, we replicated our experiment using a hypothetical election.
Echoing our first experiment, respondents could be assigned to control and exclusively shown information about how much hypothetical candidates agreed with them on policy issues, or assigned to one of three treatment conditions in which they would also be shown information about candidates’ electoral prospects in a ranking format. Respondents in treatment conditions were randomized into one of three possible framings of electability: either a general condition where they were told the top candidate was “most likely to win” without any additional mention of primary and/or general elections; a general election condition mirroring our original experiment where respondents were told the top candidate was most likely to win the general election but no information about the primary as in Table 4; a full explanation condition in which respondents were told the top candidate was most likely to win their party’s nomination and then the general election. We then asked respondents to tell us what they believed each candidate’s chances of winning the general election were and which candidate they might vote for, given the information they had. The complete survey instrument for the follow-up study appears in Supplementary Appendix I.
Please take a few seconds to consider the following hypothetical scenario: Earlier in the survey, you mentioned that you identify as a(n) [respondent’s party affiliation].
Imagine that several candidates from your party are competing to win your party’s nomination for president in the next election. The current president is a member of the political party you like least.
The table below shows two sets of rankings for these candidates. The ranking in the middle column shows how much the candidates agree with you on important policy issues. The candidate ranked 1 agrees with you most, followed by the candidates ranked 2 and 3. Similarly, the candidate ranked 1 in the rightmost column is most likely to win the general election, followed by the candidates ranked 2 and 3

Table 4 Long description
The table ranks three candidates by two criteria: who agrees most with the respondent on policy issues and who is most likely to win the general election. For policy agreement, Candidate A is ranked first, Candidate B second, and Candidate C third. For general election likelihood, Candidate C is ranked first, Candidate A second, and Candidate B third. Candidate A leads on policy alignment but is not the top choice for electability. Candidate C shows the opposite pattern, ranking highest for winning but lowest for policy agreement. These rankings reflect relative order only and do not indicate how large the differences are between candidates.
This part of the study answers several key questions. First, does the key set of results from study 1 replicate? That is, does providing respondents with any kind of electability information make them more likely to consider electability and less likely to declare support for a best policy match if that best policy match is less likely to win? Study 2 replicates this result from study 1. Even in a more abstract setting with hypothetical candidates and absent a battery of real policy questions to anchor policy agreement, respondents (1) select their top policy match as the candidate they support in higher proportions, on average, than the most electable candidate but (2) are significantly less likely to express support for a top policy match if we show them any version of the electability information. We present this result in Supplementary Appendix Table 30 and compare it to study 1 at length in Supplementary Appendix H.
The second question worth asking of study 2 is whether or not electability information affects how respondents perceive a candidate’s chances of winning at all. One potential concern is that respondents have no sense of what electability means, which would make providing information about it to voters valueless. In fact, electability information does help respondents correctly understand which candidate has a better chance of winning. When we asked respondents to tell us the chances (from 0 to 100) that any of three candidates would win based on the information they saw, they correctly endowed higher-ranked candidates in all versions of the electability treatment with greater chances of winning, with average chances descending as ranks went from 1 to 3 in all cases. Thus, respondents do understand that candidates described as more electable are more likely to win. We display these results in Supplementary Appendix Table 31.
Finally, this study allows us to address whether the way that we frame electability information to respondents matters. These results appear in Table 5, where we regress our measure of respondents’ perceived chances of winning for each candidate on candidates’ policy ranks, electability ranks, and treatment conditions. The generic “best chances of winning” description is the reference category, and conditional on each candidate’s rankings, the way we describe electability has no significant effect on what respondents believe each candidate’s chances of winning are. Table 6 shows that the way we describe electability to respondents similarly has no effect on whether they support the hypothetical candidates we have asked them to evaluate. Here, the effects of policy and electability rankings are smaller than in the original experiment, but that is largely a function of fewer candidates (and therefore fewer possible trade-off splits between rankings in policy and electability lists) and of the fact that the candidates are fully hypothetical. We provide a longer discussion of these specifications and additional analysis in Supplementary Appendix H.3.
Perceived win probabilities by treatment condition

Table 5 Long description
The table reports two regression models predicting a candidate’s perceived chances of winning. In both models, electability rank has a large positive association, about 12.22 points in model 1 and 12.12 points in model 2, and is statistically significant. Policy rank is also positively associated, about 2.78 points in model 1 and 2.95 points in model 2, and is statistically significant. The treatment indicators are small and not statistically distinguishable from zero: general election is about 0.36 in model 1 and 0.07 in model 2, while primary then general is about minus 0.84 in model 1 and minus 0.97 in model 2. The constant is positive in both models, about 18.59 in model 1 and 14.39 in model 2. Model 1 uses 3,110 observations; model 2 reports a higher fit, with R squared rising from 0.08 to 0.12. Standard errors are clustered by respondent, and the rank measures are coded so higher values correspond to more favorable rankings.
Note: Standard errors clustered by respondent. Rankings reversed for ease of interpretation.
*p < 0.1; **p < 0.05; and ***p < 0.01.
Electability framings have no discernible effect on candidate support

Table 6 Long description
Two regression models predict whether a respondent supported a given candidate. In both models, higher policy rank is linked to higher support, with an estimated increase of about 0.07 and a small standard error. Higher electability rank is also linked to higher support, with an estimated increase of about 0.05 and a small standard error. The framing conditions labeled General Election and Primary then General have coefficients near zero and are not statistically distinguishable from no effect. Interaction terms between the ranks and the framing conditions are also near zero, suggesting the relationship between ranks and support does not meaningfully change by framing. The constant is negative in both models, more negative in model 2. Model 1 uses 3,110 observations and model 2 uses 3,069; both have an R-squared of 0.03, indicating limited overall explanatory power.
Note: Standard errors clustered by respondent. Rankings reversed for ease of interpretation.
*p < 0.1; **p < 0.05; and ***p < 0.01.
We believe that the reason for this is that respondents interpret “electability” as a general signal about a candidate’s quality or appeal. Our evidence for this proposition comes from respondents’ answers to a free-response question asking them to define electability in their own words. Looking at the words used most frequently across responses, the preponderance (47%) describes electability as a candidate’s abilities, character, fitness, policy views, experience, or other indications of quality. Just 17% of responses used words associated with a candidate’s popularity, appeal, likelihood of winning, or getting votes.Footnote 14 Just 11% of responses use the word “win,” and only 11 (0.45%) contain “primar,” the root for primary or primaries.
The large proportion of respondents who focus their definitions of electability on candidate quality may be a concern for some readers: might this mean that respondents think electability has something to do with how much they personally like a candidate and less to do with that candidate’s ability to appeal to a broad base of voters? If that were true, then treating respondents with information about a candidate’s chances of winning would not be effective. In this case, telling respondents a candidate’s chances of winning would not change their perceptions of electability because it would not change how warmly they felt about the candidates. While we did not formally isolate valence from strategic concerns or other mechanisms that might shape respondents’ views of electability in this study, we think this is unlikely to be the case. One way to search for evidence of this is to look at the responses that use the word “my” when they define electability.Footnote 15 Respondents who use this term are the ones who are personalizing the idea of electability: rather than describing it as something about a candidate’s general qualities or her ability to get votes, these respondents are thinking about how the candidate relates to them personally. To them, it is not about whether a candidate’s policies might help many people in the country (and therefore garner votes from the many people who recognized that), but whether those policies aligned with their own values or made them personally like the candidate more. Responses like “aligning with my values on most important issues” and “someone who will represent my safety, security, and freedom” are typical in this group. Yet only 90 responses (3.6%) even contain this term, which suggests that a small minority of respondents are thinking about how much they individually like a candidate when they think about electability. Responses discussing candidate quality largely do not contain any personal reflection on how the respondent feels about the candidate, instead saying things like “the candidate has qualities that will help his constituents” or “electability to me means someone who is honest, and compassionate while being strong and able to follow through on your promises.” These are not incompatible with an interpretation of electability as having something to do with the ability to win votes. As Table 5 shows, candidates with higher electability rankings are perceived to have a better chance of winning the upcoming general election. Some respondents explicitly link a candidate’s “goodness” to her ability to win votes, e.g., “how charismatic they are and how likely to draw votes,” but others may be doing it implicitly. Respondents who cite candidate quality without a personal reflection may still be thinking implicitly about the potential to get votes in the sense that they believe candidates who are obviously high quality will be recognized as such by large numbers of people and have an easy time getting votes.
4.2. Study 2 results: identity, policy, or something else?
There were aspects of our original experiment beyond the direct framing of electability rankings for treated respondents that communicated additional information about candidates’ electoral prospects. Recent research surrounding perceptions of electability has pointed out that candidates’ descriptive characteristics, such as race and gender, affect both their actual electability (Visalvanich, Reference Visalvanich2017; Hassell and Visalvanich, Reference Hassell and Visalvanich2024) and their perceived electability (Green et al., Reference Green, Schaffner and Luks2022). Voters engage in a form of strategic discrimination against nonwhite and female candidates, thinking that the rest of the electorate would be biased against them even if voters themselves are not (Bateson, Reference Bateson2020; Green et al., Reference Green, Schaffner and Luks2022; Hassell and Visalvanich, Reference Hassell and Visalvanich2024). Additionally, voters take candidates’ ideological extremeness into account when they think about electability. Moderate voters tend to perceive ideologically extreme candidates as less electable, but voters who are more ideologically extreme themselves do not (Hassell and Visalvanich, Reference Hassell and Visalvanich2024).
For our purposes, demographic determinants of electability—real and perceived—were aggregated into the electability rankings shown to respondents. It was likely the case, for instance, that gender affected where Elizabeth Warren and Tulsi Gabbard stood in the electability rankings we presented to respondents. Similarly, perceptions of distance from the Democratic party median, to the extent that respondents had these, could have affected the electability rankings we calculated and presented to respondents. As before, we do not think of these as a threat to inference since our treatment effects are estimates of the extent to which revealing this fixed set of electability rankings affected respondents’ decisions regardless of where those rankings came from. We also worry less about policy information bleeding into the electability treatment because, in the context of our experiment, voters understood policy information as a measure of distance between themselves and the candidate on the exact series of policy questions we asked. Using this information to impute a candidate’s position relative to the median Democrat would have required accurate self-placement on the ideological scale, accurate placement of the candidate, and assumptions about how important the issues that drove any disagreement that respondents observed would have been to ideological placement.
Additionally, evidence from our own follow-up question asking respondents to comment on what electability meant suggested that questions about candidate identity, partisanship, and ideology are not necessarily top-of-mind considerations. Just 8% of our respondents mentioned anything about candidates’ race, age, or gender when they talked about electability.Footnote 16 Similarly, only 6% said anything about partisanship or ideology.Footnote 17 No terms related to these demographics emerged in any topic across various approaches to topic modeling, which we present in detail in Supplementary Appendix H.4.
5. Conclusion
Our results suggest that voters consider both a candidate’s policy positions and her chances of winning the general election when they think about how to cast their ballots. Our first contribution, then, is providing clear evidence that voters can behave strategically rather than registering sets of incoherent and uninformed choices (Converse, Reference Converse1964). Our primary-specific findings are consistent with Rickershauser and Aldrich (Reference Rickershauser and Aldrich2007), Simas (Reference Simas2017), and Minozzi and Woon (Reference Minozzi and Woon2023), but we contribute several additional insights. First, absent prompting with electability concerns, voters weigh the level of policy agreement they have with a candidate more heavily than a candidate’s chances of winning. The coefficient on policy agreement in Table 3, which we can think of as the way that information about agreement over policy agreement affects candidate choices in the control group, is more than twice as large as the analogous coefficient on the lower-order term for electability. We can interpret this as a signal of “organic” candidate choice in a context where respondents are weighing less preferred candidates about whom they have specific policy information and an atmospheric sense of electoral prospects from their news environment, but not researcher intervention. Similarly, our results in Supplementary Appendix Table 10 suggest that revealing a candidate is higher ranked in terms of policy agreement with a respondent has a larger effect on the respondent’s log-odds of selecting that candidate than revealing a candidate is higher ranked in terms of electability.
These results do not appear to be driven by respondent characteristics. Supplementary Appendix B shows no meaningful evidence of heterogeneous treatment effects by age, gender, education, race, employment, income, marital status, citizenship (in the full sample), or religious affiliation. Similarly, there is limited evidence that respondents’ political interest, party affiliation, ideology, turnout history, level of approval for the Trump administration, or certainty over their first choice candidate drives any difference in treatment effects. These results, then, are not driven by one particular type of voter in the electorate, but broadly true for voters making these trade-offs.
One valuable innovation we provide is the basis for the agreement scale. Unlike previous research, policy agreement is based on a set of concrete policy positions that fully anchor respondents to a real sense of what it means to agree or disagree with a candidate on something. We do not require respondents to form abstract ideas over what spatial, ideological distances between themselves and particular candidates actually represent in practice, and we do not base our measure of agreement entirely on one or two policy issues that may not be particularly pivotal for voters.
Still, voters remain aware of the implications of electability and appear persuadable that high levels of agreement with a particular candidate might be worth trading off for candidates with better chances in the general election. Consistent with Rickershauser and Aldrich (Reference Rickershauser and Aldrich2007), Simas (Reference Simas2017), and Minozzi and Woon (Reference Minozzi and Woon2023), our results suggest that providing respondents with information concerning the electoral prospects for 2020 Democratic primary candidates makes them significantly more willing to consider electability and more likely to select candidates who do not appear in the highest positions within their policy agreement rankings. This appears particularly true for respondents who agreed most closely on policy issues with Elizabeth Warren—a finding echoed in the popular press throughout the 2020 primary season. This is similarly consistent with the explanations for poll variability provided in Gelman and King (Reference Gelman and King1993), who argue that variability results from the fact that voters begin by offering poorly informed responses to pollsters but gradually learn about candidates over time. In this case, voters may learn about the preferences of other voters and form perceptions of candidate electability over the course of the election, which means that voters value maximizing their agreement with a given candidate but are willing to trade some of this away as they learn more about their preferred candidate’s chances of winning.
We shed additional light on how respondents think about electability in study 2, which suggests that even though respondents learn something about a candidate’s prospects when researchers or the press make electability more salient to them, they understand electability as a very general indication of how popular a candidate might be. Respondents do not seem to be thinking about whether a candidate would do better in the sequence of primary then general elections or in general elections in isolation. Instead, they seem to think about electability as a loose sense of how much people who are not themselves might like the candidate. When we ask respondents to characterize the idea of electability itself, they tend to tell us that electability is about a candidate being clearly qualified and skilled at performing the office and thereby appealing as a consensus candidate to a large group of voters, though they are not always explicit about the voting part of electability. This is probably not a function of respondents conflating their views of the candidate with that candidate’s broad popularity, since very few respondents directly reflect on how much they personally must like a candidate, but it suggests that electability is a moving sense of how much other people might like a candidate.
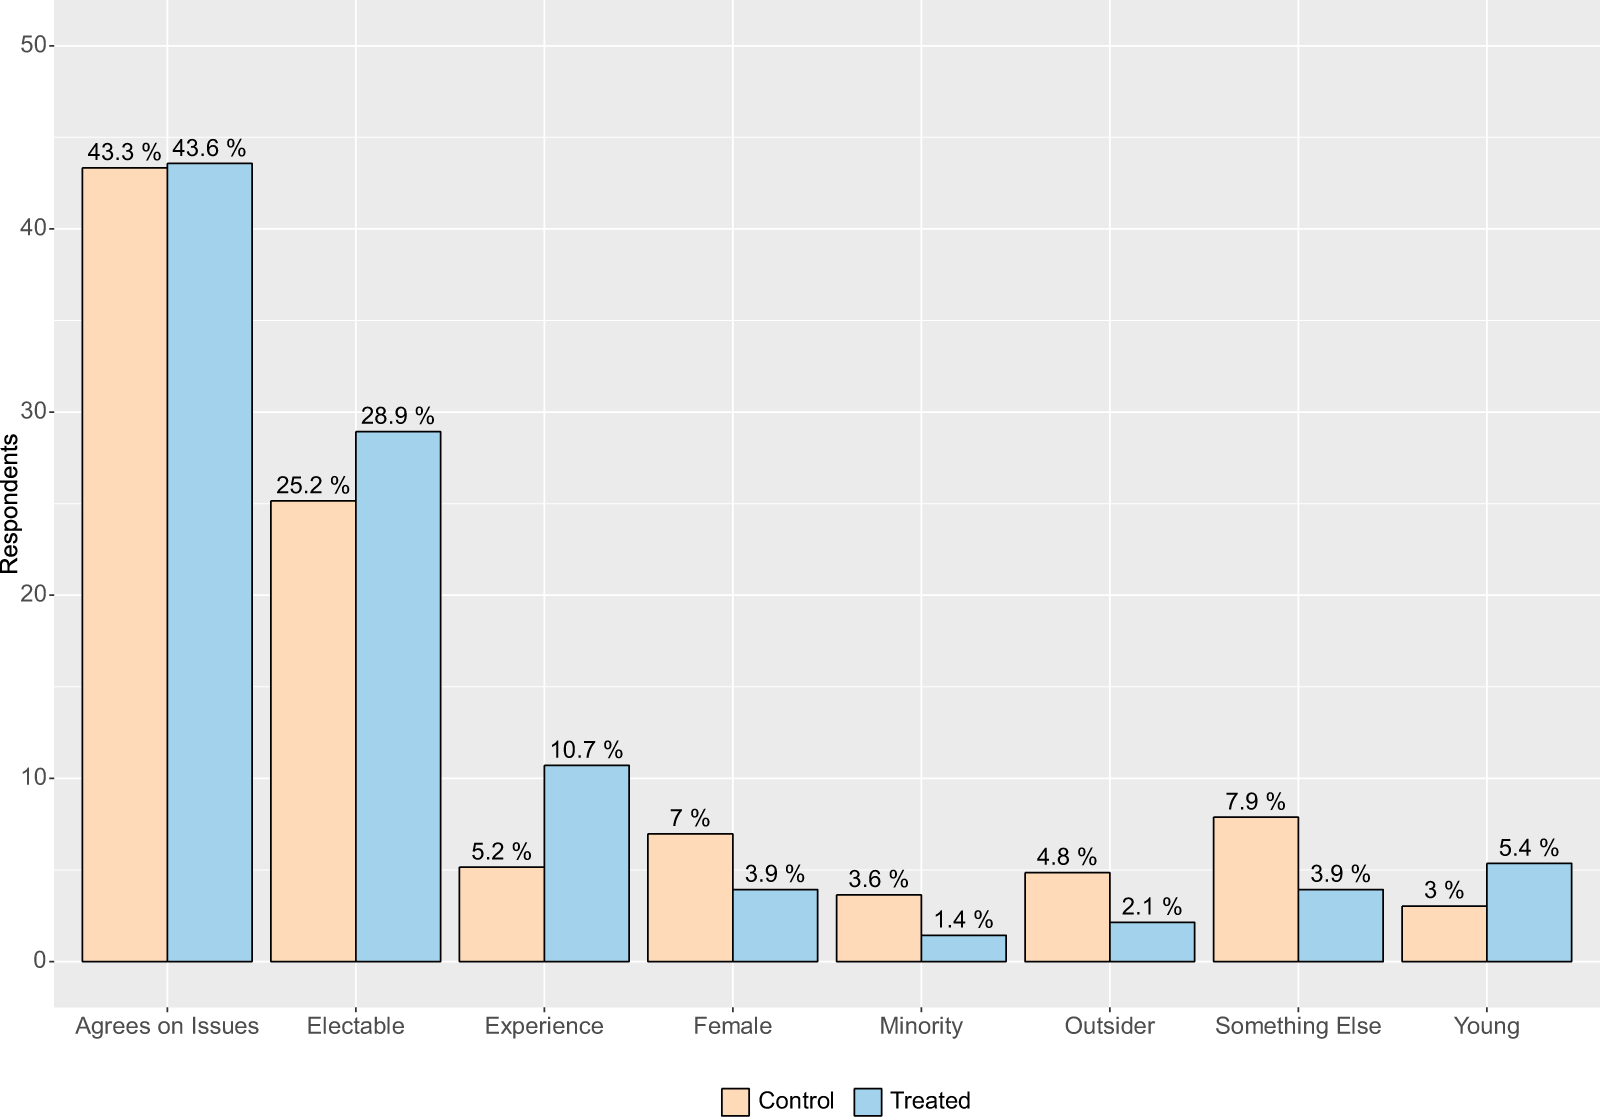
One limitation of study 1 rests with the fact that our focus on trade-offs between agreement over policy issues and electability limits our ability to draw firm conclusions about the effects that race, age, gender, experience, or any number of other candidate-specific characteristics on vote choice. While the number of candidates who entered the 2020 Democratic primary race was a record-breaking high, for the purposes of estimation, there were not enough candidates with any particular subset of traits to determine how prospective voters viewed those traits. Study 2 suggested, however, that candidate ability and appeal were their overwhelming concerns when they considered what made candidates electable. One possible way to reconcile this with recent findings reporting that race and gender had significant effects on perceived electability (Green et al., Reference Green, Schaffner and Luks2022; Hassell and Visalvanich, Reference Hassell and Visalvanich2024) may be that voters evaluate the impact of candidates’ descriptive characteristics on electability when they are presented with those characteristics, but do not consider them first if they are asked about electability without being prompted by specific candidate features. This is consistent with the explanation that candidates’ abilities and policy positions weigh more heavily in voters’ minds than personal characteristics, but evaluating this fully would require a different research design than the one we used in study 2. It is important to remember, however, that despite the undeniable importance of these candidate-specific traits, policy views and electability represented two of the most significant considerations in prospective voters’ minds during the primary election cycle. This fact is broadly reflected in the contemporaneous press coverage emphasizing concerns over who might be most likely to beat Donald Trump and directly in our own data. One of the outcome questions we posed to respondents asked “Which of the following represents the most important reason you might choose a particular candidate?” Results appear in Figure 3. Though this outcome question was asked after treatment, even respondents in the control group who did not see the electability manipulation selected agreement over policy issues or electability as the most important reason motivating their candidate choice, with much higher frequency than other options like wanting to vote for a candidate who was young or female or experienced, etc. This question did not specifically ask respondents to justify their selection for a second choice in the experiment, so it is plausible to infer that respondents weighed features similarly when settling on their first choice candidates.
Distribution of reasons for candidate choice.

Figure 3 Long description
The bar graph has two bars per category with a legend listing Control and Treated. The horizontal axis label is not shown. The categories, in left to right order, are: Agrees on Issues, Electable, Experience, Female, Minority, Outsider, Something Else, Young. The vertical axis label is Respondents. The vertical axis ranges from 0 to 50. Agrees on Issues: Control 43.3 percent, Treated 43.6 percent. Electable: Control 25.2 percent, Treated 28.9 percent. Experience: Control 5.2 percent, Treated 10.7 percent. Female: Control 7 percent, Treated 3.9 percent. Minority: Control 3.6 percent, Treated 1.4 percent. Outsider: Control 4.8 percent, Treated 2.1 percent. Something Else: Control 7.9 percent, Treated 3.9 percent. Young: Control 3 percent, Treated 5.4 percent.
The overall implication of these findings is that voters try to maximize the level of agreement between themselves and available candidates. Voters seem to value this more than concerns about electability; they are not purely strategic. Yet voters are willing to trade off some policy agreement for electability. Exposing prospective voters to information about candidates’ chances does affect their willingness to select particular candidates.
Column labels refer to candidate features that respondents say they desired, where “Young” corresponds to respondents who said they preferred to elect a younger candidate, etc. Complete response wording appears in Supplementary Appendix I.
Supplementary material
The supplementary material for this article can be found at https://doi.org/10.1017/psrm.2026.10106. To obtain replication material for this article, https://doi.org/10.7910/DVN/GNEWPE.
Ethical standards
This research involves human subjects. Accordingly, protocols for this study were reviewed and approved by the IRB at the authors’ home institution. The research team obtained informed consent from all participants prior to their involvement in the study. Documentation can be provided upon request. We have no external funding sources or conflicts of interest to disclose. All of the underlying data and analysis for this project will be made publicly available upon publication.







 Open access

