


1. Introduction
Military service represents a significant event in the life course. In addition to the health and safety risks represented by potential military conflict, service members also delay their educational attainment and the acquisition of civilian work experience. The extent to which military experience substitutes for these delays in terms of the subsequent career trajectories and earnings of veterans remains unclear. Additionally, the relatively younger average age at which marriage and family formation occur for military personnel and the associated financial and family commitments may increase the difficulty of pursuing post-service educational investments, potentially locking in education gaps between civilians and veterans.
There has been little research on how the timing of educational attainment among veterans differs from nonveterans over the life course or on how these differences have evolved over time. Evidence on this relationship may bear directly on both approaches to military recruitment and efforts to increase diversity in the armed forces. Such knowledge is also important more broadly in understanding the role that military service and post-service educational benefits may play in social mobility in the USA.
In this study we provide novel evidence on the evolution of educational attainment across five 3-year birth cohorts. We use cross-sectional Census and American Community Survey (ACS) data to construct synthetic panel data at the birth cohort-by-age level. Two of the cohorts we focus on represent the tail end of “Generation X” (birth years 1975–1977 to 1978–1980), while the other three span the “Millennial” generation (birth years ranging from 1981–1983, 1984–1986 to 1987–1989) (Dimock, Reference Dimock2019). The primary period of military service for these cohorts begins 3–4 years prior to the events of 9/11 and continues through the major drawdowns of forces in the Iraq and Afghanistan wars in the early 2010s. The period we focus on also spans the adoption and implementation of the 2008 post-9/11 GI Bill, which significantly increased the generosity of educational benefits (Kofoed, Reference Kofoed2020).
We measure the evolution of educational attainment across these cohorts by comparing the educational paths of veterans and nonveterans from ages 23 to 25 on to ages 32 to 34 for the youngest cohort and to ages 44 to 46 for the oldest cohort. These analyses reveal a set of novel results that, to the best of our knowledge, have not been presented in the prior literature on veteran educational attainment or the literature on educational attainment gaps in general. Overall we find that veteran educational attainment of a bachelor's degree or greater is significantly delayed, but that all veteran groups with the exception of non-Hispanic White men, fully close this gap or ultimately exceed this level of educational attainment relative to observably similar nonveterans. Additionally, over time all veteran subgroups exceed the level of attainment of an associate's degree or higher among observably similar civilians. Finally, we show that, while the gaps in educational attainment are initially larger for younger cohorts, veterans in these cohorts close these gaps at increasingly earlier ages.
We do not employ an explicitly causal research design in this study. Instead, our focus is on measuring the observed gap between veterans and nonveterans over time while controlling for important observable and unobservable variables that may have shifted differentially over time between veterans and nonveterans, rendering measurement of these gaps more directly comparable across time and across key demographic subgroups.
2. Existing research on veteran educational attainment
While a substantial number of servicemembers remain in the military until retirement, the majority serve no more than 5 years (Wenger & Ward, Reference Wenger and Ward2022). Thus, a typical servicemember leaves the military at a relatively young age and usually without a 4-year college degree. Education benefits are a type of deferred benefit for servicemembers intended to facilitate the transition back to civilian life; these benefits also serve as a form of compensation to servicemembers as well as a substantial public investment.
Differences in educational access and costs faced by veteran students arise from time- and location-specific variation in post-service education benefits as well as geographic variation in tuition and housing costs. Based on these sources of variation, a sparse but growing literature estimates plausibly causal effects of military educational benefits on educational attainment. In the interest of brevity, we do not focus on this literature specifically in this article, but relevant works include Angrist (Reference Angrist1993), Bound and Turner (Reference Bound and Turner2002), Steele et al. (Reference Steele, Salcedo and Coley2010), Barr (Reference Barr2015), Barr (Reference Barr2019), and Kofoed (Reference Kofoed2020). Broadly, this research finds that the availability of education benefits for veterans increased educational attainment in a dose–response manner.Footnote 1 A related literature focuses on barriers faced by Black veterans in using educational benefits and other specific factors relevant to Black veteran educational attainment including O'Neill (Reference O'Neill1977), Onkst (Reference Onkst1998), Turner and Bound (Reference Turner and Bound2003), and Katznelson (Reference Katznelson2005).
More closely related to this study, Loughran et al. (Reference Loughran, Martorell, Miller and Klerman2011) tracked the earnings and educational attainment of both servicemembers and military applicants who do not ultimately enlist. By following both groups from a 4-year application cohort (1991–1994) for nearly two decades, the authors were able to document the emergence and subsequent attenuation of a gap in educational attainment among servicemembers over a period of 18 years. Their results show an initial gap in the attainment of a 4-year degree of approximately zero between future service members and applicants at the time of application that grows to approximately 4% gap for veterans 7 years after application; 17 years after joining or having applied the gap had closed to around 2 percentage points. For attainment of a 2-year degree, they show that this gap begins to close roughly 6 years after the initial application and becomes statistically indistinguishable by year 13.
They also demonstrated that servicemembers were more likely than non-enlistees to attain a 2-year degree, but less likely to attain a 4-year degree. We note that the attainment gaps documented in this study are much smaller than those we document with the broader nonveteran population, consistent with their claim to estimate plausibly causal effects of military service using participation in the military application process to address selection effects.
To our knowledge, the nonparametric, cohort-based approach to using synthetic panel data employed in this study has not been used in the literature on educational attainment. We are aware of one recent study that has used this approach to estimate the relationship between educational attainment and health and mortality outcomes (Kaestner et al., Reference Kaestner, Schiman and Ward2020).
3. Data
For this study we use U.S. Census 5% extract data from 2000 and ACS data from 2005 to 2021. The 2000 Census data are a 1 in 20 random sample of the U.S. population. From 2005 onward, the ACS data are a 1% sample of the population. We use harmonized versions of these data from IPUMS (Ruggles et al., Reference Ruggles, Flood, Sobek, Brockman, Cooper, Richards and Schouweiler2023). ACS data from 2000 to 2004 exist, but do not provide geographic information on respondents below the state level. Because our empirical approach relies on using public use microdata area (PUMA) geographic identifiers as a key control, we exclude these years of ACS data from our analysis sample.Footnote 2
These data represent a rich set of demographic and socioeconomic measures at the individual level. However, there are important limitations of these data pertaining to measuring military service. Most importantly, they lack important details about veteran status and history of military service such as branch of service, officer/enlisted status, whether service was on active duty or in the reserves, years of service, or length of time since separation from the military. For this reason, our approach to identifying an appropriate age to begin comparing the educational attainment of veterans and nonveterans uses the modal path of military service, in terms of years of age. Specifically, we choose the initial age for our analysis based on the notion of a typical enlisted service member who transitions to veteran status at approximately age 23.Footnote 3 We document the empirical evidence supporting this approach in online Appendix A.1.
We make two important sample restrictions to obtain our analysis sample. First, we exclude from the sample individuals who failed to complete high school or attain a Test of General Educational Development (GED) certification. This restriction increases comparability between veterans and nonveterans since such individuals are rare among enlistees and are typically admitted in relatively small numbers that are proportional to the annual difficulty of meeting end strength goals (Alvarez, Reference Alvarez2007). This sample restriction drops 11.7% of the nonveteran sample, but only 2.1% of the veteran sample (and nearly 40% of these excluded veterans are from the earliest birth cohort we consider, 1975–1977). Second, we restrict the sample to three large, self-identified racial/ethnic subgroups: non-Hispanic Whites, Blacks (regardless of Hispanic ethnicity), and non-Black Hispanics (which we refer to going forward simply as “Hispanic” for simplicity). These broad subgroup classifications mirror those commonly used in past research on gaps in educational attainment (see, for instance, Cameron & Heckman, Reference Cameron and Heckman2001; Desmond & López-Turley, Reference Desmond and López-Turley2009; McDaniel et al., Reference McDaniel, DiPrete, Buchmann and Shwed2011) and they include 91% of individuals in our analysis sample, yielding large enough subsample sizes for useful statistical inference even when split by gender.
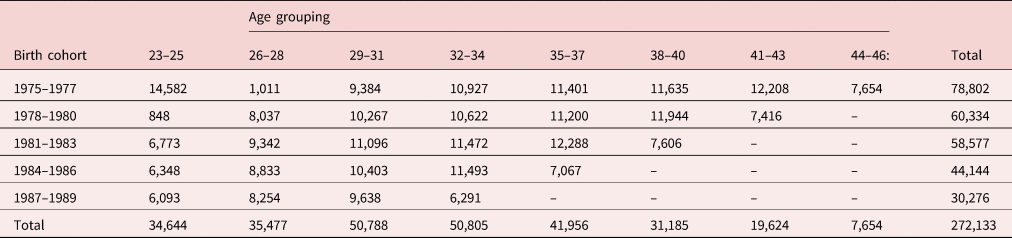
In Table 1, we present the sample sizes of veterans in each of the five grouped birth cohorts we generate.Footnote 4 Each cell in this table represents the total number of veteran observations for each cohort by age grouping provided by the full, pooled data sample. We direct the reader's attention to two notable points. The first is that there is significant variation in the size of these cohorts; this variation is related to the survey sample sizes described above and how our veteran cohorts are spread across them. The second, related point is that these sample sizes are sufficiently large – the average cell size is around 9,000 veterans – to generate credible estimates relating to our research questions. On average, around 17–18% of each veteran cohort–age group is female. The smallest demographic group we consider in any of our analyses is Hispanic female veterans and average sample size for this subgroup is 335, with the smallest of these cohort-by-age group samples comprising 150 veterans.
Veteran birth cohort sample sizes at each age grouping

Source: Author calculations from ACS and Census data from IPUMS (Ruggles et al., Reference Ruggles, Flood, Sobek, Brockman, Cooper, Richards and Schouweiler2023) as described in text. Sample sizes for the age 23–25 cell for the 1978–1980 birth cohort and the age 26–28 cell for the 1975–1977 birth cohort are very small due to the primary years of data for these age and birth cohort combinations (the 2000–2004 ACS 1-year samples) lacking valid PUMA identifiers. We include these small cells in the main analysis of all veterans and note that the associated confidence intervals are a good deal larger for these two cells than for any others in the analysis, but we omit them in all subgroup analyses since in these subsamples the standard errors get very large and fail to provide useful inference.
Due to the absence of geographic identifiers in the 2001–2004 ACS data mentioned above, there are two age group-by-birth cohort cells that have particularly small sample sizes. These are individuals aged 26–28 in the 1975–1977 birth cohort and individuals aged 23–25 in the 1978–1980 birth cohort. These two cells are identified only by individuals on the youngest and oldest months of these 3-year age groups who were observed in the adjacent data years (the 2000 census and the 2005 ACS data). These sample sizes (of around 1,000 veterans) are sufficient to generate estimates among both the full sample and the White, non-Hispanic samples split by sex, but we omit them from the visual estimates for smaller subgroup analyses due to the overly large confidence intervals, while still reporting these intervals in the tables included in online Appendix B.Footnote 5
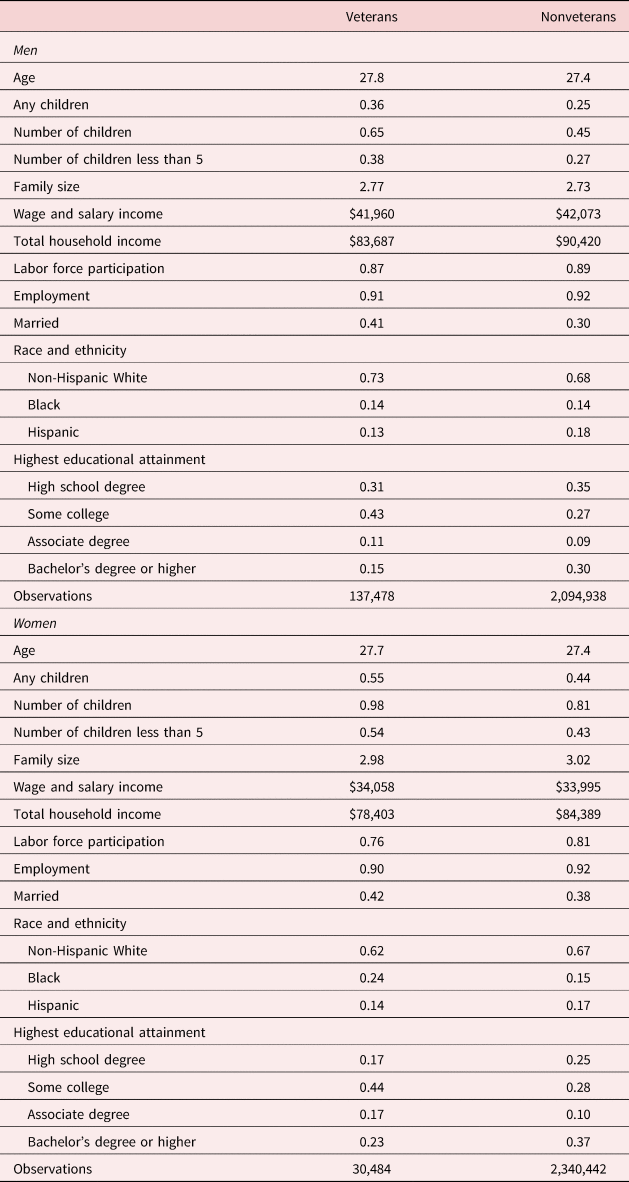
In Table 2 we present some basic characteristics of the veteran and nonveteran samples from our data. This table pools all veterans across the five birth cohorts, using observations between the ages of 23 and 34 (years of age for which all five cohorts are represented in the pooled data). Male veterans and nonveterans are broadly similar on dimensions including income, labor force participation, and employment. But other characteristics differ to varying degrees including age (veterans are slightly older, highlighting temporal shifts in the size of the armed forces over recent years related to the operational needs of the wars in Iraq and Afghanistan), presence and number of children, marital status, share non-Hispanic White, and share Hispanic.
Descriptive statistics for pooled observations of individuals between ages 23 and 34

Source: Author calculations from ACS and Census data (Ruggles et al., Reference Ruggles, Flood, Sobek, Brockman, Cooper, Richards and Schouweiler2023) as described in text.
Note: Sample restricted to respondents born between 1978 and 1990 who self-identify as non-Hispanic White, Black, or Hispanic who attained a high school degree (or equivalent credential) or higher, and who are observed in the data at ages 22–34. Estimates use person weights. Employment is conditional on labor force participation. High school degree includes those with a GED (high school diploma and GED are only disaggregated beginning in 2008). Race/ethnicity categories are mutually exclusive and as described in text. Shares may not sum to 100% due to rounding.
We include measures of personal and family income in these comparisons for the sake of demonstrating both similarities and differences among veteran and nonveteran households. Specifically, veterans and nonveterans have virtually identical personal income but, for both male and female veterans, total family income is 7–8% lower than nonveteran households. We conjecture that this is likely due to a persistent component of the well-documented earnings penalty that accrues to military spouses (Burke & Miller, Reference Burke and Miller2016; Meadows et al., Reference Meadows, Griffin and Pollak2015).
More directly relevant to the focus of this study, veterans in this age group are more likely to have completed some college or attained an associate's degree, and are much less likely to have obtained a bachelor's degree or greater.
Most demographic differences between women veterans and nonveterans are smaller in magnitude than for their male counterparts including marital status, number of children, and share non-Hispanic White. However, differences in educational attainment, our outcome of interest, largely mirror the relationships observed among men.
4. Empirical approach
The goal of our analysis is to characterize differences in the accumulation of education between veterans and nonveterans over the life cycle using available, large-scale, cross-sectional survey data. To accomplish this, we use the series of annual random samples described above to form synthetic longitudinal data at the birth cohort level. We then use a synthetic panel data approach to estimate educational attainment at a series of grouped years of age starting at 23–25.Footnote 6 We generate estimates to ages 32–34 for all cohorts, which is as far as we can estimate for the youngest cohort, born between 1987 and 1989, and as far as ages 44–46 for the oldest birth cohort, those born between 1975 and 1977.
Using the birth cohort born between 1975 and 1977 to provide an example of how this approach is implemented, we observe a large, randomly sampled group of individuals between 23 and 25 years old in survey years 2000–2002. We then observe a different randomly sampled group of individuals between 26 and 28 years old in survey years 2003–2005, and between 29 and 31 years of age in survey years 2006–2008, and so on. Because each of these samples is large and random (conditional on included sample weights) we can generate estimates of the average educational attainment for this birth cohort for each age group that we consider.
We estimate a series of semiparametric linear probability models separately for each 3-year birth cohort and, when indicated, for each relevant demographic subgroup (e.g., by sex and race/ethnicity). Otherwise, we control for these and other observable characteristics. These models are of the following basic form:

Equation (1) estimates, for binary educational outcome y for individual i in age group a (e.g., 26–28) born in birth cohort group c (e.g., 1978–1980), a set of nonparametric, age group-specific estimates of educational attainment levels for both veterans and nonveterans. This approach allows each of these estimated paths of the outcome variable for each birth cohort group to take on any shape across grouped years of age without being restricted by functional form assumptions.Footnote 7
For models that pool the entire sample we include indicator variables for race/ethnicity (as defined above) and female to control for the differential composition of veterans and nonveterans in each grouped birth cohort along these two dimensions.Footnote 8 We also control nonparametrically for marital status and linearly for total family size, number of children less than 5 years old, and number of children 5 years or older.Footnote 9 Finally, we interact the female dummy variable with the controls for marital status and the number of children to control for well-documented differences in gender roles with respect to child rearing and differing constraints potentially affecting school-going for men and women depending on marital and parental status (Bianchi, Reference Bianchi2011; Negraia et al., Reference Negraia, March Augustine and Chambers Prickett2018). This specification makes some potentially nontrivial assumptions, including uniformity of this gender/family size relationship across racial/ethnic groups (as a result of not interacting female with these variables) and no important differences in these relationships across cohorts or ages. While conceptually restrictive, testing the inclusion of these dimensions suggested they failed to qualitatively influence the estimates, so we retained this simpler specification.
In all models we include fixed effects for each single birth year (δ a) to allow for potential differences in age-specific factors affecting attainment within our grouped birth cohorts.Footnote 10 We weight all regressions using the provided person weights for each of the pooled datasets. As mentioned earlier, we also include small geographical area fixed effects (Census Bureau public use microdata areas or PUMAs) in our analysis, an approach that helps to control for differences in several otherwise difficult to observe or truly unobservable factors including proximity to post-secondary institutions, variation in average community educational attainment, local labor market opportunities and employment conditions, and local cultural and demographic factors that affect propensity to serve in the military (Goldberg et al., Reference Goldberg, Cheng, Huff, Kimko and Saizan2018).
The coefficients $\beta _{ac}^{nonvet} {\rm \;and\;}\beta _{ac}^{vet}$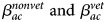 from these models, which are the estimated educational attainment levels for nonveterans and veterans net of our included controls, are then combined to construct graphical presentations of the results in either levels or gaps (as discussed further below) with appropriate confidence intervals.Footnote 11 The outcomes we consider are attainment of a bachelor's degree or higher, attainment of an associate's degree or higher, and enrollment in school.
While we have taken care to develop an empirical approach that accounts for observable and certain unobservable differences that could render the comparisons in this study less informative, we reiterate that the empirical results in this study are descriptive in nature and we do not propose that these estimates represent a causal effect of military service on educational attainment. Our focus is on presenting what we believe is new and novel evidence on the noteworthy evolution of secular trends in the educational attainment of veterans relative to nonveterans over time.
5. Results
5.1 Attainment of a bachelor's degree or higher
We begin by presenting our results graphically in two related ways. Initially we present results plotting complete sets of these coefficients in levels to demonstrate how the levels of educational attainment for a given outcome may vary between veterans and nonveterans across the life cycle. Subsequently, we focus on presenting outcome gaps, measured as the difference between veterans and nonveterans (specifically, we plot a series of single coefficients corresponding to $\beta _{ac}^{vet} -{\rm \;}\beta _{ac}^{nonvet}$ for each age group a and each cohort c).
Although we generate estimates for five 3-year birth cohorts, for visual clarity we present graphical results for the first, third, and fifth of these (1975–1977, 1981–1983, and 1987–1989). This sparser figure captures the trends that we focus on while allowing a reader to see the distinct point estimates and confidence intervals more easily. In online Appendix B we reproduce these figures with all five cohorts as well as tables with the underlying estimates.
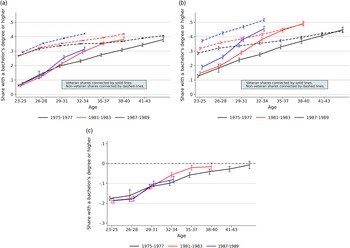
Figure 1 presents three graphs representing estimates from equation (1). Panel a presents the results of equation (1) in levels, with the attainment of a bachelor's degree or higher as the outcome without the inclusion of demographic controls or PUMA fixed effects (only including single year-of-birth fixed effects). This approach yields a plot of actual mean levels of educational attainment for each discrete 3-year age period for each 3-year birth cohort of veterans and nonveterans with 95% confidence intervals shown as capped whiskers at each discrete group of years of age. For ease of visual interpretation, at each age group on the x-axis we sequentially offset each cohort-specific estimate, with each more recent birth cohort's estimate to the right of the prior cohort's estimate. At ages 23–25, the average share of veterans with a bachelor's degree or higher is approximately 10% while for nonveterans it is between 27% and 29%. Across all birth cohorts, nonveteran attainment increases to between 37% and 40%, but for the oldest cohort this process plays out over roughly 18 years, while for the youngest cohort it takes only around 6 years to occur, a pattern of secular increases in the tempo of educational attainment that we see throughout the study. From ages 23–25 to 26–28, the gradient of veteran attainment is very similar to nonveterans, increasing around 5 percentage points. But for ages 26–28 and 29–31 this gradient increases for veterans (to around 8–9 percentage points) while it declines to around 2–3 percentage points for nonveterans. From this point, the steeper gradient of veteran attainment decreases the magnitude of this initial roughly 18 point gap. This gap is nearly fully closed for the oldest three cohorts by their mid-30s to early 40s. Similar to the pattern for nonveterans, among veterans we see the same pattern of faster achievement of a bachelor's degree or higher as we look at younger cohorts, but this increase over time is occurring at a greater magnitude, leading to the closing of attainment gaps at increasingly younger ages.
Attainment of a bachelor's degree or higher by birth cohort and veteran status. Figures depict outcomes derived from equation (1), with results from panel a controlling only for individual years of birth fixed effects while results from panels b and c include additional controls for marital status, family size, and number of children as well as PUMA fixed effects. Heteroskedasticity-robust standard errors clustered at the PUMA level are used to calculate 95% confidence intervals, which are shown as capped whiskers for each estimate. Panel a: attainment levels (no controls); panel b: attainment levels (with controls); and panel c: attainment gaps (with controls).
Source: American Community Survey data from IPUMS (Ruggles et al., Reference Ruggles, Flood, Sobek, Brockman, Cooper, Richards and Schouweiler2023).

Panel b presents these same results, but now including the rest of the controls described above. We include this figure to demonstrate that the included controls have a substantial effect on both between-cohort differences in educational attainment among veterans and nonveterans, and within-cohort gaps (meaningfully reducing their magnitudes in most cases). The inclusion of controls leads to a substantial spreading out of these paths of educational attainment, suggesting that the composition of college-going young adults is shifting over time with respect to characteristics including sex, race, marital status, and other factors. However, once these controls are included, the levels presented here no longer have a straightforward interpretation (they now reflect the residual levels of educational attainment net of the associations between educational attainment and our included controls). To focus on the primary outcome of interest that has a more straightforward visual interpretation – residual differences in educational attainment between veterans and nonveterans – panel c presents the results from panel b as educational attainment gaps (the difference in levels).
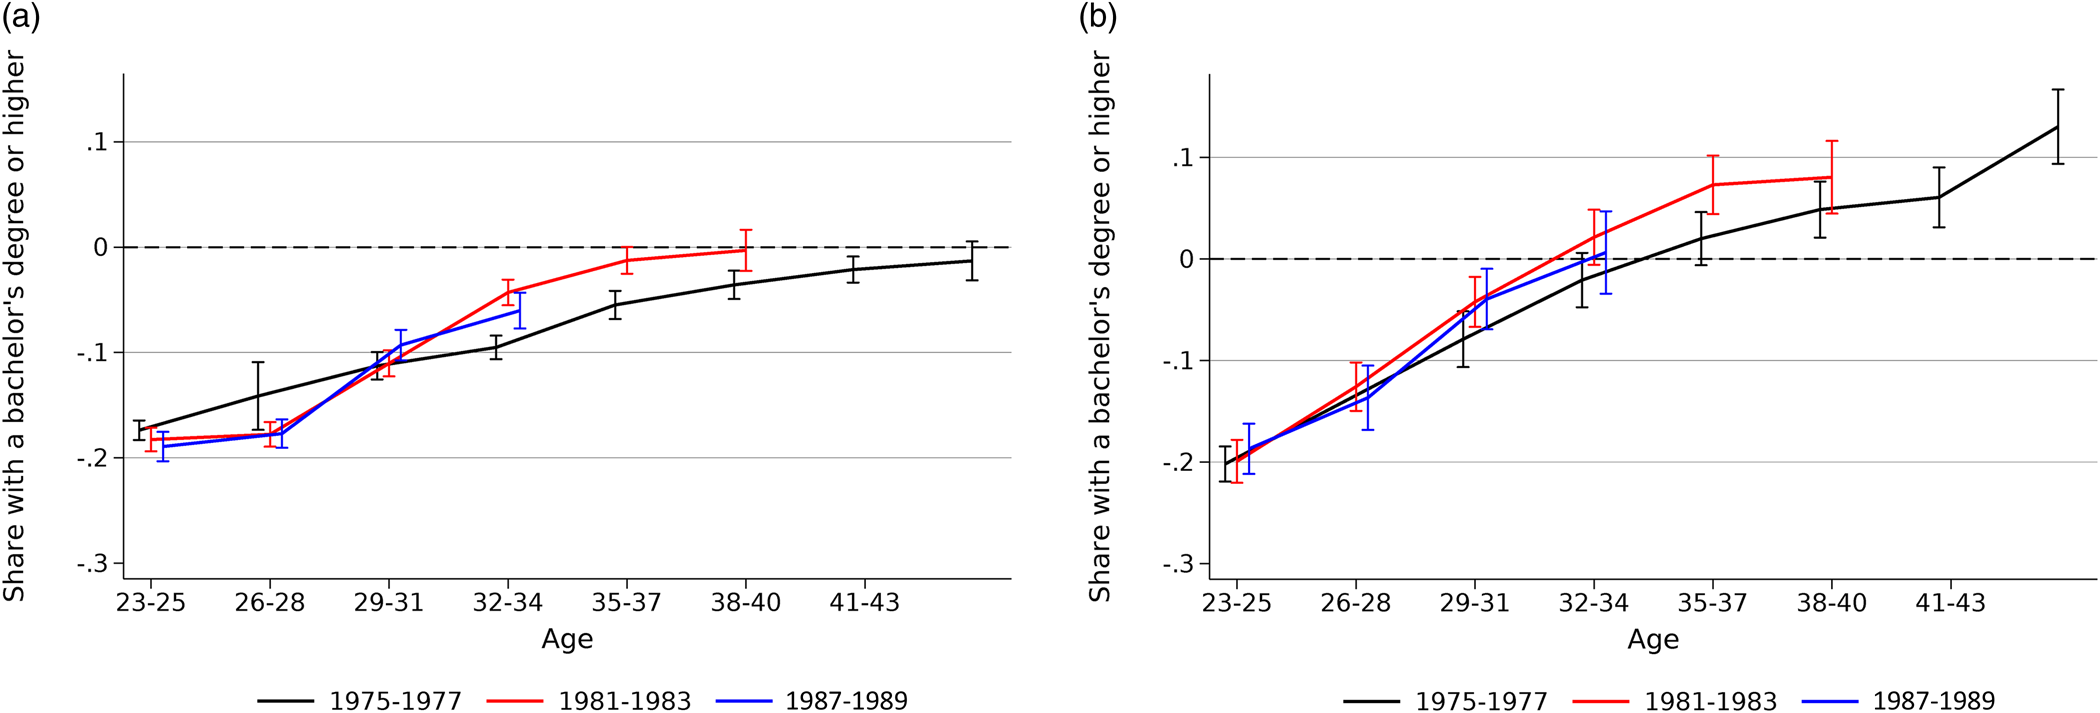
Panel c shows that, across all five birth cohorts, there is a large and relatively stable gap in educational attainment of 15–18 percentage points at ages 23–25. Between ages 23–25 and ages 26–28 this gap declines slightly to 15 percentage points on average, with slightly larger gaps for the most recent birth cohorts. Between ages 26–28 and 29–31, veterans close the education gap (panel c) by approximately one-third (from 15 percentage points to 10). The three oldest cohorts fully close these gaps by the end of our observation period with the 1975–1977 birth cohort closing the gap by ages 44–46 and the 1981–1983 birth cohort closing the gap by ages 35–37. In the last observations for each of the two youngest cohorts – 1984–1986 and 1987–1989 – it can also be observed that they are on a path to close these gaps fully by the middle to late 30s.
Recent decades have witnessed a well-documented rise in the share of female college graduates. In 2021, among adults aged 25–34, 46% of women and 36% of men have a bachelor's degree (Parker, Reference Parker2021). This implies a larger attainment gap for women than for men, motivating us to consider potential differences in veteran attainment gaps by sex.Footnote 12 In Figure 2, we present these results. The pattern of attainment gaps for males reflects the overall results in Figure 1 due to males making up a significant majority of the veteran pool including the pattern of more recent cohorts closing attainment gaps at earlier ages. As expected from the discussion above, female veterans begin with a slightly larger attainment gap than men, but the gradient at which the attainment gap is closed with age is steeper and more linear than the path for men. In addition to closing these large attainment gaps at an earlier age, women go on to exceed the average attainment level of their nonveteran peers in subsequent years by between 5 and 10 percentage points.
Veteran attainment gaps for bachelor's degree or higher by sex. Figures depict outcomes derived from equation (1) as described in text for each indicated subsample. Heteroskedasticity-robust standard errors clustered at the PUMA level are used to calculate 95% confidence intervals, which are shown as capped whiskers for each estimate. Panel a: men and panel b: women.
Source: American Community Survey and Census data from IPUMS (Ruggles et al., Reference Ruggles, Flood, Sobek, Brockman, Cooper, Richards and Schouweiler2023) as described in text.

Next, we consider outcomes by the three mutually exclusive racial/ethnic subgroups that comprise the analysis sample: non-Hispanic Whites, Blacks, and Hispanics. This analysis is motivated, first, by substantial educational attainment gaps between these groups in the general population.Footnote 13 Additionally, the military uses strict cutoffs on the Armed Forces Qualification Test (AFQT) as a mechanism to screen recruits into or out of eligibility for enlistment, but there are large differences in the distribution of AFQT scores by race, likely reflecting substantial, persistent differences in academic opportunities and other important socioeconomic factors among racial and ethnic minorities (Rodgers & Spriggs, Reference Rodgers and Spriggs1996).Footnote 14 These differences lead to meaningful positive selection on academic preparedness among racial and ethnic minorities.Footnote 15 Thus, within-group attainment gaps are likely to differ substantially among these groups due to both of these factors.
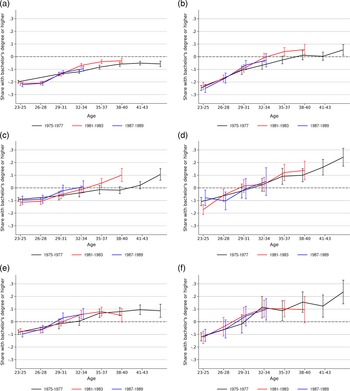
In Figure 3, we present estimated attainment gaps for each of these racial/ethnic groups stratified by sex. To ease visual comparability between the results in these six panels that feature large differences in the magnitude and even the sign of these gaps, we constrain them all to a common scale that is expansive enough to accommodate the maximal variation observed (which is, in each case, among women). As noted earlier, due to the lack of PUMA identifiers for data years 2001–2004, we omit two cohort–age combinations from these subgroup analyses: ages 26–28 for the 1975–1977 cohort and ages 23–25 for the 1978–1980 cohort, though these estimates are included in tables in online Appendix B.
Veteran attainment gaps for bachelor's degree or higher by sex and race/ethnicity. Figures depict outcomes derived from equation (1) as described in text for each indicated subsample. Heteroskedasticity-robust standard errors clustered at the PUMA level are used to calculate 95% confidence intervals, which are shown as capped whiskers for each estimate. Panel a: non-Hispanic White men; panel b: non-Hispanic White women; panel c: Black men; panel d: Black women; panel e: Hispanic men; and panel f: Hispanic women.
Source: American Community Survey and Census data from IPUMS (Ruggles et al., Reference Ruggles, Flood, Sobek, Brockman, Cooper, Richards and Schouweiler2023) as described in text.

Panels a and b present education gaps for, respectively, non-Hispanic White men and women. The results in panel a are broadly similar to the results from panel a of Figure 2, as would be expected given that, among males, this subgroup makes up around 69% of veterans in the sample. However, non-Hispanic White male veterans are the only group that does not fully close the attainment gap for earning a bachelor's degree or higher over the time we consider. Somewhat similarly, non-Hispanic White women fully close attainment gaps for all the cohorts we observe at ages 35–37 or later, but do not exceed the attainment of their nonveteran counterparts.
Black males in all cohorts fully close the roughly 10 percentage point gaps with their nonveteran peers by ages 32–34, but the youngest cohort, 1987–1989 does so by ages 29–31. Hispanic males enter ages 23–25 with an 8–10 percentage point gap but all cohorts close it by ages 29–31. By ages 35–37 Hispanic male veterans attain a bachelor's degree or higher at a rate around 7–10 percentage points higher than their nonveteran counterparts, and then the gradient flattens out completely on average.
The most striking patterns of increasing attainment into early middle age are seen among Black and Hispanic women veterans. Despite the much smaller sample sizes adding a considerable range to the 95% confidence intervals of these estimates, it is apparent that these two subgroups nearly or fully close a roughly 12 percentage point attainment gap with nonveterans as early as ages 26–28 for some cohorts and continue to, on average, increase their share of attainment of a bachelor's degree or higher through the end of the data in our sample, as late as mid-40s for the oldest cohort. By their mid- to late-30s and early 40s, Black and Hispanic female veterans have attained a bachelor's degree or higher at rates that are up to 20 percentage points above their nonveteran counterparts.
The fact that Hispanic veterans, Black female veterans and, to a lesser extent, Black male veterans are opening positive attainment gaps with their nonveteran counterparts means that they are also closing persistent existing gaps with nonveteran non-Hispanic Whites. In online Appendix D, we estimate these racial/ethnic and gender gaps among nonveterans and consider the implications of our findings on veteran attainment gaps in the context of racial, ethnic, and gender gaps in educational attainment among nonveterans and show that the results above indicate that by their late 30s or early 40s, minority veterans are actually closing most or all of the attainment gap for a bachelor's degree or higher with non-Hispanic White nonveterans.
5.2 Alternate measures of educational attainment
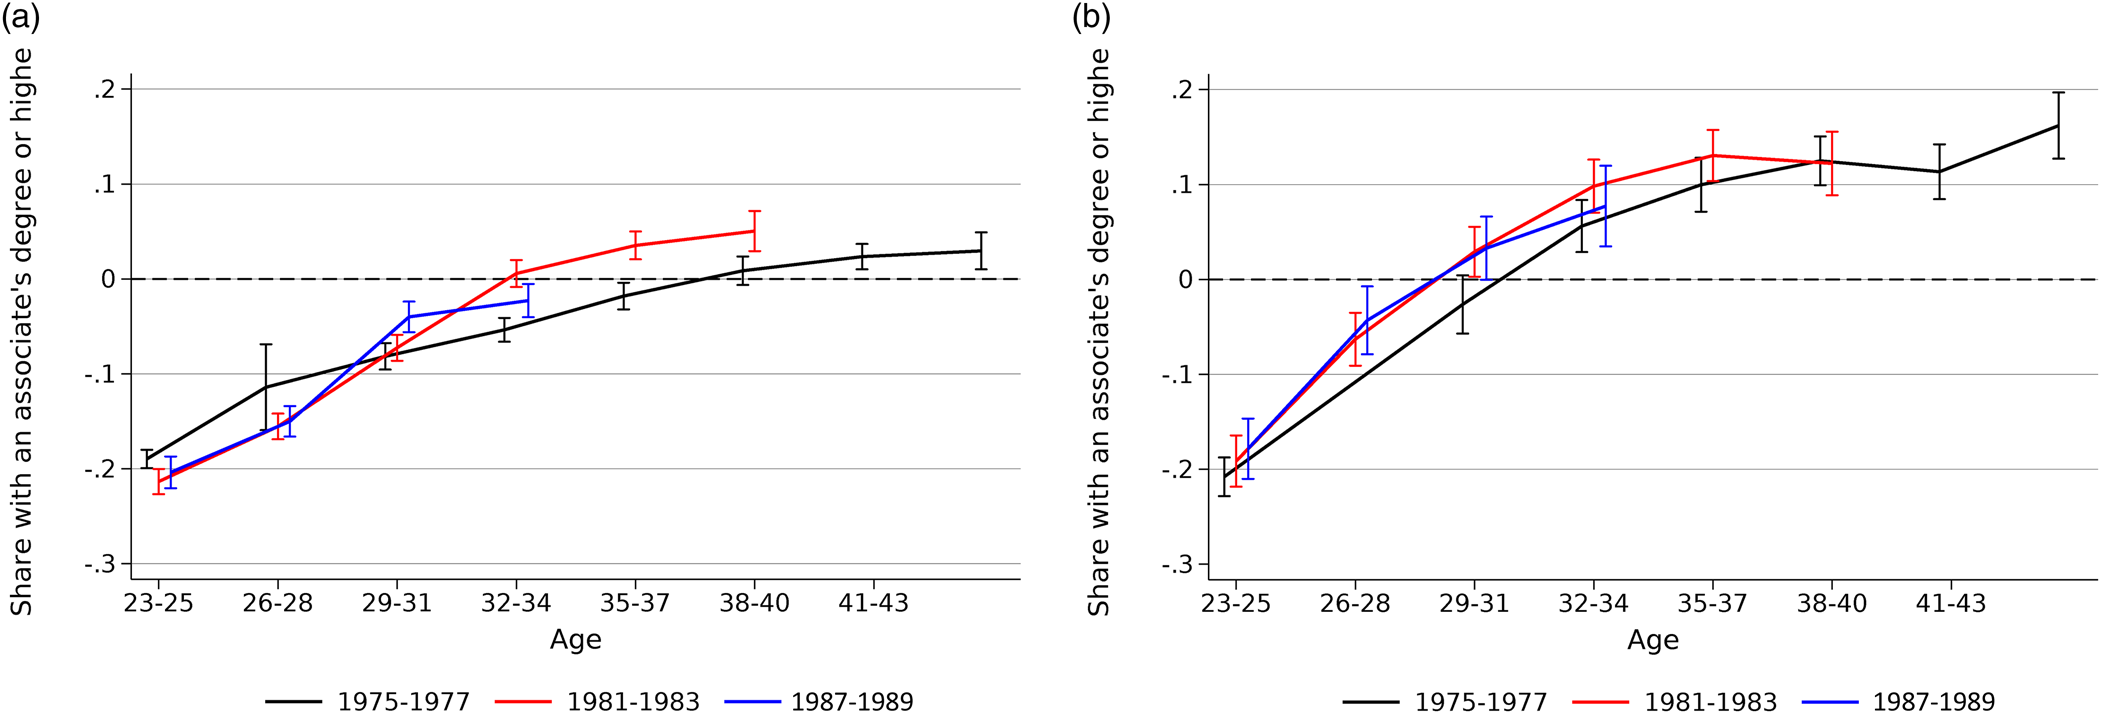
One possible effect of military service that may directly relate to differences in educational attainment is that the training service members receive and the skills they develop in the military could lead these individuals to pursue a different educational path then they would have pursued absent military service. One example of this is for veterans who served in various health care occupations in the military. These individuals typically received extensive military training in health care provision, but after exiting the military they must still complete an accredited civilian educational program to enter a career as, for example, a nurse or a physician's assistant (Synder et al., Reference Synder, Wick, Skillman and Frogner2016). In many such cases, credentialing may take the form of an associate's degree and some relevant professional licensure. Past work has suggested that there are important differences for veterans in associate's degree versus bachelor's degree attainment (Loughran et al., Reference Loughran, Martorell, Miller and Klerman2011).Footnote 16 In Figure 4, we assess whether this alternate definition of educational attainment (associate's degree or higher) results in a different picture of educational attainment gaps between veterans and nonveterans.
Veteran attainment gap for associate's degree or higher by sex. Figures depict outcomes derived from equation (1) as described in text for each indicated subsample. Heteroskedasticity-robust standard errors clustered at the PUMA level are used to calculate 95% confidence intervals, which are shown as capped whiskers for each estimate. Panel a: men and panel b: women.
Source: American Community Survey and Census data from IPUMS (Ruggles et al., Reference Ruggles, Flood, Sobek, Brockman, Cooper, Richards and Schouweiler2023) as described in text.

Using this alternate definition of educational attainment male veterans exceed attainment of nonveterans in all birth cohorts by the latter part of the observation period for each one, with the same pattern seen in other cases of closing gaps persistently earlier. For female veterans, the roughly 5–10 percentage point positive attainment gaps at older ages becomes a 10–15 percentage point difference using this broader measure of attainment. Overall, any gap with nonveterans across cohorts is fully closed by ages 29–31.
In online Appendix Figure B.1, we present subgroup-specific results analogous to Figure 3 using this alternative measure of attainment. These results show that, among other things, the dramatically higher levels of attainment for Black and Hispanic female veterans are even larger using this definition, with these veterans attaining an associate's degree or higher at a rate as much as 25 percentage points higher than their nonveteran peers.
6. Mechanisms driving increased educational attainment
There are multiple mechanisms that may be driving veterans to increase their educational attainment relative to nonveterans, both over time within-cohort, and across cohorts. First, the share of veterans attending school may be increasing across cohorts, leading to greater attainment through veterans crossing this extensive margin to pursue post-secondary education. Second, veterans may be increasing their persistence of school attendance over time, leading to increased attainment conditional on beginning studies. Finally, veterans may be enrolling in school more intensively, shortening their time to attainment.Footnote 17
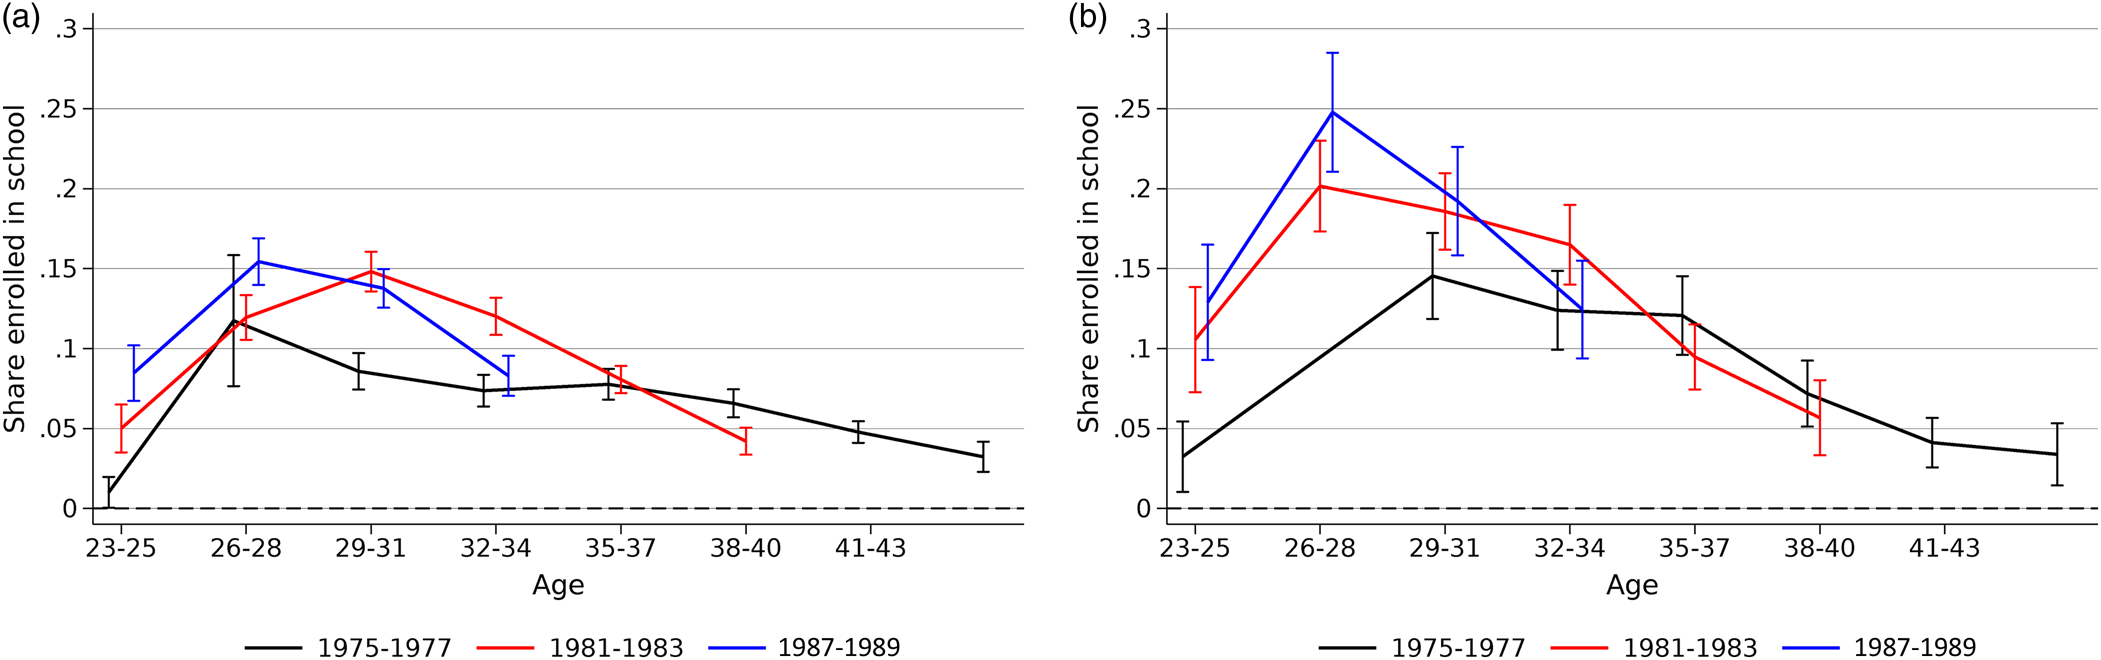
We have one measure in the Census/ACS data, school enrollment at the time respondents are surveyed, that can provide evidence on the relative plausibility of the first two of these three mechanisms in influencing the trends we present. Comparing enrollment levels indicates that this channel appears to be an important factor in explaining increased attainment. For both male and female nonveterans, enrollment at ages 23–25 ranged from around 22% (men) to 26% (women) for the 1975–1977 birth cohort. Over subsequent cohorts, this level increased to between 27% (men) and 31% (women). Enrollment declines by 8–10 percentage points by ages 26–28 and continues to decline through the rest of the ages we assess. Veteran enrollment for the 1975–1977 cohort was similar in level to nonveteran enrollment at ages 23–25 but for all subsequent (younger) cohorts in our analysis, enrollment levels increased such that our youngest cohort (1987–1989) had enrollment levels 10 percentage points (men) to 18 percentage points (women) higher at ages 23–25. In some cases these levels increased slightly by ages 26–28 and in some they were flat or declined slightly and continued to decline and subsequent ages, but for male veterans, the average (positive) gap in enrollment with similar nonveterans between ages 26–28 and 32–34 was 10–15 percentage points across the five birth cohorts and for women the gap across the same years of age was between 13 and 25 percentage points across the five birth cohorts. (We include these figures in our online Supplementary Appendix material.)
In Figure 5, we show these differences in enrollment as gaps for male and female veterans. In both panels of Figure 5 two patterns are readily apparent. The first is that the relative share of veterans enrolled at ages 23–25 (compared to nonveterans) has been growing in more recent cohorts, indicating support for the first mechanism. The second is that the gradient of this enrollment gap has increased in more recent cohorts as well, suggesting that the second mechanism, increased persistence, is also likely playing a role in closing attainment gaps.Footnote 18
Veteran enrollment gap by sex. Figures depict outcomes derived from equation (1) as described in text for each indicated subsample. Heteroskedasticity-robust standard errors clustered at the PUMA level are used to calculate 95% confidence intervals, which are shown as capped whiskers for each estimate. Panel a: men and panel b: women.
Source: American Community Survey and Census data from IPUMS (Ruggles et al., Reference Ruggles, Flood, Sobek, Brockman, Cooper, Richards and Schouweiler2023) as described in text.

We do not have an explicit measure to use in exploring how the third factor may be affecting the growth in relative attainment by veterans (increased enrollment intensity among those who do enroll in school leading to faster completion) but using the conceptual implications of recent changes in the generosity of veteran educational benefits, we can provide some evidence on the role of this third mechanism.
The increased generosity of the post-9/11 GI Bill (PGIB) has two primary components: increased tuition benefits and a set of significant nontuition benefits. Overall, nearly half of the total increase in the overall generosity of the PGIB is due to a housing allowance that provides money for room and board for 36 months for students enrolled in school for at least half of full-time enrollment level (Bass, Reference Bass2019). Additionally, the PGIB provides for up to $1,000 per year for books and supplies. This increase in housing and school supplies benefits under the PGIB likely reduces the need to be employed while enrolled in school. As a result, veteran students are less likely to mix schooling and employment. Since the PGIB covers 36 months of schooling (equivalent to 9 months for 4 years), these time limits may further incentivize veteran students to complete coursework and, hence, educational attainment more quickly.
One sufficient measure of the likelihood that this mechanism plays a meaningful role would be a decline in labor force participation among more recent cohorts of veterans who were increasingly likely to be fully eligible for the PGIB. Online Appendix Table A.1.2 shows that there is an increasing probability for our successively younger cohorts to be eligible for the PGIB. A number of recent studies on the effect of the PGIB have used this same exposure-based approach to identify causal effects of the PGIB on enrollment (e.g., Barr, Reference Barr2015). We incorporate this notion in the following model that estimates differences in the labor force participation for young adult veterans and nonveteran students in birth cohorts that are increasingly likely to be eligible for PGIB benefits:

This model regresses the labor force participation of individuals in our analysis data who are enrolled in school when they are between 23 and 28 years of age on a set of mutually exclusive birth cohort group indicator variables for both veterans and nonveterans (indexed by c). The model controls for the same measures in our main analyses and includes year-fixed effects for common factors that may have affected labor force participation (e.g., the effects of the Great Recession of 2008).
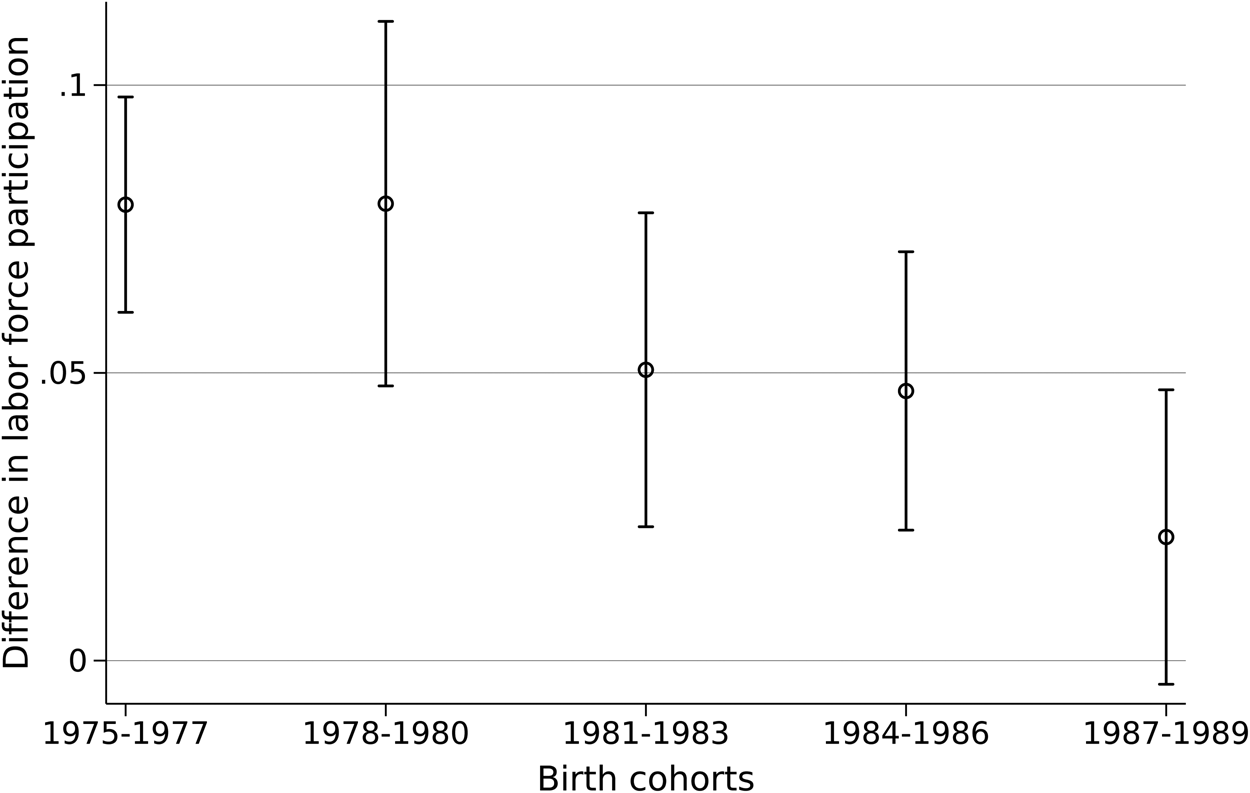
As in our main analyses above, we use the difference in coefficients to construct a measure of veteran/nonveteran labor force participation gaps for each grouped birth cohort. But to provide context on the levels behind these gaps, for the 1975–1977 cohort, veterans enrolled in school (after controlling only for year, year of age, and PUMA fixed effects) had a labor force participation rate of 60% while fewer than 53% of enrolled nonveterans were in the labor force. These differences declined over time due to lower levels of veteran labor force participation at these younger ages such that the gap in labor force participation between these groups was approaching zero for the 1987–1989 cohort. These labor force participation gaps by cohort are presented in Figure 6. For the 1975–1977 cohort, the figure shows a positive labor force participation gap for enrolled veterans relative to nonveterans of around 7.5 percentage points for the three oldest birth cohorts. However, the magnitude of this positive gap declines among more recent birth cohorts such that, for the most recent cohort, the difference is no longer statistically distinguishable from zero at the 95% confidence level. This first big decline, from around 7.5 percentage points to around 5 percentage points, occurred for the 1981–1983 cohort, who would have been among the first to serve as young adults in the period making them prospectively eligible for the PGIB. This evidence is consistent with the third mechanism, increased course taking conditional on enrollment, playing a role in closing attainment gaps that appears likely related to the increasing nontuition benefits of the PGIB.Footnote 19
Differences in labor force participation among veteran and nonveterans ages 23–28 over five birth cohorts. Positive estimates indicate that veteran labor force participation is, on average, higher at these ages than nonveterans. Estimates for each grouped birth cohort shown are relative to the level of labor force participation of the 1975–1977 nonveteran birth cohort. Heteroskedasticity-robust standard errors clustered at the PUMA level are used to calculate 95% confidence intervals, which are shown as capped whiskers for each estimate.
Source: American Community Survey and Census data from IPUMS (Ruggles et al., Reference Ruggles, Flood, Sobek, Brockman, Cooper, Richards and Schouweiler2023) as described in text.

7. Conclusion
In this analysis we examined the life cycle of veteran educational attainment relative to observably similar nonveterans in terms of birth cohort, age, gender, and broad race/ethnicity groupings while additionally controlling for family structure and size. Most military service members postpone college during their period of service; consequently, we find that at the most common ages of separation from military service (ages 23–25) there is an economically significant educational attainment gap between young veterans and similar nonveterans, with many more nonveterans having completed associates' or bachelor's degrees at these ages. However, we find that the educational attainment for veterans increased dramatically over the subsequent 18–20 years of age and that in many cases the gap between veterans and nonveterans was closed, or a positive gap emerged at latter ages. Non-Hispanic White male veterans close the attainment gap but do not substantially exceed the attainment of their nonveteran counterparts. However, Black and Hispanic female veterans in our analysis opened large, positive attainment gaps, regardless of the measure of attainment used, indicating that even by their late 20s or early 30s, these subgroups have acquired significantly more education than their nonveteran counterparts. Recent cohorts of Black and Hispanic male veterans opened up a positive education gap between their nonveteran peers by their early 30s.
It is useful to place this trend into the context of broader trends in educational attainment among nonveterans. As we show in online Appendix Figure D.1, the Black/White nonveteran bachelor's degree attainment gap is increasing largely due to the White male college completion rate increasing over time faster than that of Black males, leading to a gap that has grown from around 15 percentage points for the 1975–1977 birth cohort to around 18 percentage points for the 1987–1989 birth cohort. The large Hispanic/White gap of approximately 20 percentage points is approximately static. Viewed through this lens, the substantial positive gaps among Black and Hispanic veterans relative to their nonveteran peers imply that over time veterans close approximately half or more of this substantial race/ethnicity gap in bachelor's degree attainment. In terms of female veterans, in the context of the notable trend of females attaining a bachelor's degree at increasingly higher rates than males discussed earlier makes the positive attainment gaps observed among women veterans relative to their female peers by their later 30s even more remarkable.
We also considered an alternate measure of educational attainment, that of an associate's degree or higher, and find that all veteran subgroups fully close educational gaps (or open positive gaps) with their nonveteran counterparts under this definition. This finding suggests that either there may be greater job opportunities associated this level of attainment when combined with military training, or higher opportunity costs for veterans to obtain educational credentials beyond this level.
Two noteworthy patterns emerge from our analysis. First, veterans continue to close education gaps with nonveterans well into the latter half of their 30s or even early 40s, highlighting the importance of considering when education gaps are observed to appropriately characterize their magnitude and persistence. Second, younger cohorts of veterans close education gaps earlier in their lives. This suggests a role for the more generous educational benefits of the PGIB in incentivizing greater enrollment and persistence, but the broad time span of our analysis, covering birth cohorts over a 15-year period, reveals evidence of a broader, secular trend toward increased educational investments by veterans that may be independent of this policy change.
The results we present bear on both the broader literature on demographic educational attainment gaps, suggesting that the military may be an increasingly important channel for narrowing education gaps by race/ethnicity and may contribute very modestly to the widening of the gender-based attainment gap that has emerged in recent decades. Our findings also highlight how the military may experience greater success in meeting diversity goals by making clear to potential recruits the comprehensive nature of post-service educational benefits that may not be well understood at the point of enlistment. We note however, that utilizing the PGIB to meaningfully induce young adults to enlist may ultimately induce shorter military careers, bringing a different set of retention issues (Simon et al., Reference Simon, Negrusa and Warner2010; Wenger et al., Reference Wenger, Miller, Baird, Buryk, Daugherty, Graf, Hollands, Jahedi and Yeung2017).
Future work using richer data that could assess causal relationships behind the patterns we present here would be a worthy avenue, as would further descriptive work considering labor market outcomes at different ages, where not only educational attainment, but work experience may play important roles.
Supplementary material
The supplementary material for this article can be found at https://doi.org/10.1017/dem.2024.5
Acknowledgments
We thank attendees at the 2023 ASSA meeting and an anonymous reviewer for helpful comments and suggestions. We also thank our RAND colleague Molly McIntosh for support and encouragement with this research.
Funding statement
This research was conducted within the RAND National Security Research Division (NSRD), which operates the RAND National Defense Research Institute (NDRI), a federally funded research and development center (FFRDC). This research was made possible by NDRI exploratory research funding that was provided through the FFRDC contract and approved by NDRI's primary sponsor.
Competing interests
None.


 Open access

