

Introduction
Securing a stable revenue base through taxation is paramount to the operation of a welfare state. The scale of welfare spending and the scope of beneficiaries fundamentally depend on government tax receipts, meaning that the relationship between ‘beneficiary’ and ‘contributor’ groups shapes the structural characteristics of social policy (Cansunar, Reference Cansunar2021). When the effective tax rate on high-income earners is markedly lower than that on low-income households, a sense of relative deprivation among middle-class voters may erode political support for redistribution. Citizens’ perceptions of tax-burden fairness thus play a critical role in ensuring both fiscal stability and the legitimacy of the welfare state. Rothstein (Reference Rothstein1998) argues that a broad social consensus on equitable tax-burden distribution is necessary for a welfare state to maintain its moral authority. Supporting this view, a U.S. field experiment found that informing households about others’ average tax rate significantly increased their own willingness to comply (Nathan et al., Reference Nathan, Perez-Truglia and Zentner2024).
Perceptions of how tax burdens are distributed across income groups shape individuals’ support for welfare-financing tax increases (Bernasconi, Reference Bernasconi2006; Edlund, Reference Edlund, Svallfors and Taylor-Gooby1999; Roosma et al., Reference Roosma, Van Oorschot and Gelissen2016). If people believe other groups pay less, they are less inclined to back higher levies. In high-inequality contexts, low-income households may feel overtaxed while high-income earners perceive their own contributions as excessive relative to benefits received. Under these conditions, middle-income perceptions of tax fairness become decisive in forming coalitions for or against tax hikes (Laenen et al., Reference Laenen, Roosma and Achterberg2025; Rothstein, Reference Rothstein1998). When the middle class views the system as too regressive, it tends to ally with lower-income groups to support progressive reforms; conversely, if it feels overburdened, it may align with higher-income cohorts to oppose further increases.
In this context, the present study seeks to uncover the latent structure of tax-burden perceptions across income strata and to assess empirically whether these perceptions differ by economic position. Departing from the traditional focus on income-based coalitions (Alt & Iversen, Reference Alt and Iversen2017; Iversen & Soskice, Reference Iversen and Soskice2006; Laenen et al., Reference Laenen, Roosma and Achterberg2025; Lupu & Pontusson, Reference Lupu and Pontusson2011), we classify respondents into upper, middle and lower groups based on the intersection of household disposable income and total asset holdings. Assets, whether in financial instruments or real estate, generate returns and typically accumulate faster than labor income, causing wealth inequality to outpace income inequality (Piketty, Reference Piketty2014). Moreover, income and asset standings do not always align: newly employed professionals may earn high wages but hold few assets, while recent retirees may possess substantial wealth despite modest pensions (Jensen & Wiedemann, Reference Jensen and Wiedemann2023). These dynamics underscore the need to analyse tax-burden perceptions using a combined income–asset framework rather than income alone.
This study pays particular attention to the Korean case. Lee et al. (Reference Lee, Shin and Kim2020) report that the post-2010 rise in income inequality in Korea is driven primarily by widening gaps between middle- and lower-income strata, whereas asset inequality reflects divergent gains concentrated in the upper-asset group. Building on the income-group coalition literature, this suggests that middle-‘income’ groups tend to align with upper-‘income’ groups under income-based coalitions, but middle-‘asset’ groups may join lower-‘asset’ cohorts when wealth defines coalition boundaries. Recent inheritance-tax debates – sparked by surging real-estate prices and reform proposals in early 2025 – underscore the political significance of asset-anchored interests.
Accordingly, this study classifies individuals into upper, middle and lower categories via joint income–asset deciles and employs latent class analysis (LCA) to uncover the underlying structure of tax-burden perceptions across these groups. To capture potential differences arising from asset liquidity, we repeat analyses defining assets as total holdings and, separately, as liquid versus illiquid assets. We then test whether latent class membership varies systematically by combined income–asset status and whether these perception profiles predict support for welfare-expanding tax increases. By integrating wealth into the study of redistributive attitudes, our approach advances coalition research and offers nuanced insights for tax-policy design.
Theoretical backgrounds
Income group coalitions and welfare attitudes
Scholars argue that welfare-state policies with distinct institutional designs give rise to coalitions among income groups that either support or oppose redistributive measures. The Meltzer–Richard model (Reference Meltzer and Richard1981) demonstrates that, under majority rule, the median-income voter is the key determinant of government size and redistribution levels. In a right-skewed income distribution where mean income exceeds median, the median voter will back redistribution up to the point at which the marginal utility gains from transfers equal the marginal social efficiency losses caused by distortionary taxation and reduced labor incentives. Accordingly, wider gaps between mean and median incomes create stronger incentives for expanding government scope, progressive taxation and welfare expenditures.
Building on this, Lupu and Pontusson (Reference Lupu and Pontusson2011) emphasise social affinity among income strata, arguing that support for public spending hinges on the relative distance between middle- and lower-income groups versus that between middle- and upper-income groups. If the income gap between the middle and lower strata is smaller than that between the middle and upper strata, the middle class feels greater affinity with lower-income groups and favours redistribution; when the reverse holds, solidarity shifts toward upper-income groups. This framework highlights how middle-class coalitions in welfare politics are shaped by perceived income proximities.
Empirical cross-national analyses support income-group coalition models. Machtei et al. (Reference Machtei, Huber and Stephens2025), drawing on data from twenty-two countries between 1969 and 2019, show that a higher mean-to-median income ratio – proxying the Meltzer–Richard hypothesis – consistently dampens redistributive spending, whereas wage-skewness measured as the 90–50 to 50–10 wage ratio – representing the Lupu–Pontusson social-affinity framework – exerts a positive effect on redistribution. These findings underscore the dual importance of income dispersion and perceived proximity between income strata in shaping welfare coalitions. Laenen et al. (Reference Laenen, Roosma and Achterberg2025) further refine our understanding of coalition formation by demonstrating, using European Social Survey data, that middle-income voters indeed align with high-income cohorts to oppose means-tested programmes but exhibit far less aversion to universally applied policies such as a basic income. They define a coalition as any set of adjacent income groups whose support levels for a given policy do not differ significantly, thereby moving beyond analyses that focus solely on linear income effects (Barnes, Reference Barnes2015; Beramendi & Rehm, Reference Beramendi and Rehm2016; Brady & Bostic, Reference Brady and Bostic2015; Vlandas, Reference Vlandas2021).
While the literature on income-based coalitions has matured, recent work highlights the necessity of incorporating asset holdings into the framework. Jensen and Wiedemann (Reference Jensen and Wiedemann2023) provide compelling evidence that combined income–asset status operates through two buffering mechanisms: liquid assets function as private insurance, mitigating vulnerability to income shocks and bolstering support for social insurance among otherwise high earners (‘income-buffered’ group), whereas substantial illiquid holdings – such as housing – diminish redistributive preferences even among low-income households (‘asset-buffered’ group). Their results suggest that welfare coalitions are multi-dimensional, forming not only around shared income levels but also around the security – or insecurity – conferred by different types of asset portfolios.
In this context, the present study divides respondents into upper, middle and lower groups based on their combined income–asset status and empirically examines how tax-burden perception structures differ across these categories. Although prior work has investigated welfare attitudes by segmenting populations into income or asset groups (Fuller et al., Reference Fuller, Johnston and Regan2020; Jensen & Wiedemann, Reference Jensen and Wiedemann2023; Yang, Reference Yang2024), those studies simply compared high- versus low-income or high- versus low-asset cohorts, leaving unclear how the middle class aligns with either camp in terms of welfare preferences and tax-burden perceptions. This research, therefore, seeks to identify empirically which coalitions form under a combined income–asset grouping and how these coalitions shape perceptions of tax fairness.
Moreover, we distinguish liquid from illiquid assets when defining income–asset positions, recognising that asset liquidity may influence tax perceptions. Illiquid holdings, such as real estate, can subject owners to forced-sale risk under inheritance or property tax regimes, prompting taxpayers to view taxes as ‘asset expropriation’. Conversely, liquid assets, such as stocks and bonds, raise transparency concerns in effective tax-rate calculations due to market volatility, fostering perceptions of ‘arbitrary taxation’. By comparing these asset types, this study tests whether the inherent liquidity of assets further differentiates tax-burden perception structures.
Previous research on tax-burden perception structures
Existing research on tax-burden perception has concentrated on taxpayers’ fairness evaluations, drawing on Adams’s (Reference Adams1965) equity theory to explain how individuals assess distributive justice from both input and output perspectives. Within this framework, three dimensions of equity are distinguished. First, horizontal equity refers to tax fairness based on comparisons with peers in similar economic positions, focusing on equal treatment among taxpayers with equivalent income or asset levels. Second, vertical equity addresses progressive taxation, whereby taxpayers in higher income brackets should face greater effective tax rates than those in lower brackets, reflecting expectations of redistribution across economic strata. Finally, exchange equity assesses the balance between the taxes paid by individuals and the public-service benefits they receive, emphasising the quid pro quo aspect of the tax–benefit relationship.
In the Korean context, Kang and Jeon (Reference Kang and Jun2019) examined fiscal panel data and found that high-income, high-asset taxpayers who face greater exposure to taxation – perceive horizontal inequity, judging their tax burden unfair relative to peers of similar means. They also report that this group is significantly more likely than middle- and low-income cohorts to view vertical equity as violated. Extending this analysis to post-reform data, Lee and Shin (Reference Lee and Shin2020) document that following the 2014 income-tax overhaul, perceptions of vertical equity deteriorated overall; low-income households, despite benefiting from reduced tax liabilities, exhibited particularly negative fairness assessments.
Bernasconi’s (Reference Bernasconi2006) International Social Survey Programme (ISSP) analysis reveals a consistent pattern: most respondents view taxes on low and middle incomes as too high, high taxes as too low. Those disappointed by redistributive outcomes support stronger government intervention. The middle class registers the second-highest satisfaction with existing tax distribution, trailing only high-income earners. This finding – when juxtaposed with the Meltzer–Richard median-voter model and income-group coalition literature (Alt and Iversen, Reference Alt and Iversen2017; Iversen and Soskice, Reference Iversen and Soskice2006; Lupu and Pontusson, Reference Lupu and Pontusson2011) – suggests middle-income voters may be less inclined to ally with lower-income groups for further redistribution.
Roosma et al. (Reference Roosma, Van Oorschot and Gelissen2016) critique Bernasconi’s (Reference Bernasconi2006) typology for ad hoc categorisation and employ LCA on 2006 ISSP data to uncover six tax-burden perception profiles. Their LCA reveals that 29.2% of respondents are broadly satisfied with the current tax burden, whereas 23.2% view high earners as undertaxed, low earners as overtaxed, and the middle class as appropriate. Another 21.1% simultaneously highlight both excessive burdens on lower- and middle-income groups and inadequate taxation of the wealthy. Subsequent multinomial logistic regression shows that lower-income individuals are more likely to belong to the progressive-tax preference class, while higher-income respondents show significantly greater odds of belonging to the dissatisfied or middle-class overburdened cluster.
Turning to Korea, Yang (Reference Yang2021) applies the same LCA approach to Korea Welfare Panel Study (KOWEPS) data and identifies three predominant perception types: a ‘regressive-structure’ group (48.7%) perceiving lower-income households as undertaxed relative to higher-income peers, a ‘high-income low-burden’ segment (23.8%), and a ‘middle-class overburden’ cluster (27.6%). Income and asset values significantly predict class membership: higher incomes increase the likelihood of belonging to the high-income low-burden group, while elevated asset prices correlate with greater odds of falling into the middle-class overburden category and reduced odds of the regressive-structure type.
Although these studies advance our understanding of distributive fairness perceptions, their reliance on continuous income and asset covariates limits insights into coalition formation across distinct socioeconomic blocs. In response, the present research employs combined income–asset status to empirically test whether and how such multidimensional groupings yield meaningful differences in tax-burden perception structures.
Research method and variables
Data and methodology
We employ KOWEPS data to empirically test whether tax-burden perception structures differ across upper, middle and lower groups defined by combined income–asset status. Released annually by the Korea Institute for Health and Social Affairs, KOWEPS measures household income and assets each year and includes a supplementary welfare-attitudes module every three years since 2007. This panel design mitigates the limitations of purely cross-sectional analysis. Crucially, KOWEPS separately assesses perceived tax burdens for high-, middle-, and low-income households, making it well-suited to our study. To correct for the oversampling of low-income households inherent in KOWEPS, we apply sampling-probability weights via Stata 19.5’s pweight option.
To uncover the heterogeneity of tax-burden perceptions, we apply LCA following McCutcheon (Reference McCutcheon1987) and Collins and Lanza (Reference Collins and Lanza2009). LCA is an exploratory, person-oriented technique that identifies latent classes based on similarities in response patterns without imposing distributional assumptions (e.g. normality or linearity), making it ideal for our ordinal, categorical indicators of tax fairness (Hagenaars & McCutcheon, Reference Hagenaars and McCutcheon2002). This approach makes it possible to identify complex perception profiles that variable‑oriented methods cannot capture, such as cases where high‑income groups are perceived as underburdened while middle‑income groups are seen as overburdened. We determine the optimal number of classes using information criteria (Bayesian information criterion (BIC), Akaike information criterion (AIC), consistent AIC (CAIC)), entropy measures, and the Lo–Mendell–Rubin likelihood-ratio test, thereby minimising subjective bias in class enumeration. After classifying tax-burden perception structures via LCA, we estimated a multinomial logistic regression to test whether combined income–asset status is significantly associated with class-membership probabilities. We then ran an ordinal logistic regression to assess how these perception typologies affect support for welfare-expanding tax increases. To leverage all available waves, we pooled KOWEPS data collected at three-year intervals from 2013 through 2022 into a synthetic panel and applied pooled logistic regression. Period effects were controlled by including year-dummy variables, with 2013 as the reference category. Although panel-data methods could address serial dependence more directly, fixed-effects logistic models assume constant sampling weights across waves. Because our analysis requires wave-specific weight adjustments to correct for low-income oversampling, we could not apply panel logistic regression without sacrificing proper weighting. Instead, to obtain valid inferences in the presence of potential serial correlation, we report cluster-robust standard errors.
Variables
Dependent variables
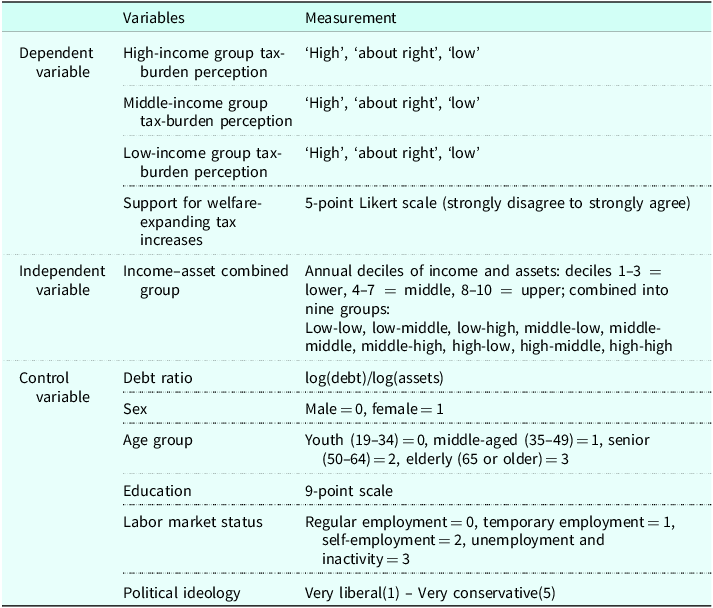
The dependent variable in this study is the latent class derived from an LCA of tax-burden perception structures. The LCA indicators measure tax-burden perceptions by income group. Specifically, participants were asked, ‘How do you think the level of taxes currently paid by each of the following income groups is?’ Taxes include all levies (income, consumption tax, etc.). For each income group – high, middle, and low – respondents chose one of: ‘much too high’, ‘fairly high’, ‘about right’, ‘fairly low’, ‘much too low’ or ‘cannot say’. The ‘cannot say’ responses were excluded from analysis as they did not typify tax-burden perception structures. We then recoded ‘much too high’ and ‘fairly high’ as ‘high’, and ‘fairly low’ and ‘much too low’ as ‘low’, yielding three ordered categories of perceived tax burden: ‘high’, ‘about right’ and ‘low’.
To assess whether these tax-burden perception typologies are associated with differences in support for welfare-expanding tax increases, we employed the item: ‘Taxes should be increased to expand social welfare’. Respondents rated this statement on a five-point Likert scale from ‘strongly agree’ to ‘strongly disagree’, and scores were reverse-coded so that stronger agreement corresponds to higher values.
Independent variables
The independent variable in this study is the group defined by combined income–asset status. Income was measured as household disposable income, and assets were measured as the sum of illiquid assets and liquid assets. Illiquid assets comprise the value of the primary residence and any other real estate holdings. For the primary residence, owner-occupiers’ asset values were measured by market price, jeonseFootnote 1 renters by their key money deposits and monthly renters by their security deposits. Liquid assets were measured as the total of bank deposits, savings accounts, stocks, bonds, funds and other financial assets.
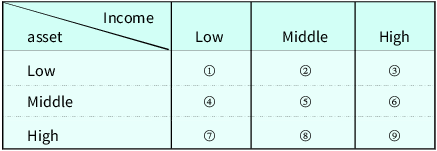
To construct the combined income–asset status, both income and assets were divided into deciles each year: deciles 1–3 as lower class, deciles 4–7 as middle class, and deciles 8–10 as upper class. These classifications yielded nine distinct groups, as shown in Table 1. Additionally, to examine differences by asset type, we repeated this procedure separately for illiquid and liquid assets – each divided into annual deciles – and then grouped respondents by their combined income–asset status for each asset category.
Classification of income-asset combined status (nine groups)

Control variables
To account for factors that may influence both tax-burden perception structures and support for welfare-expanding tax increases, we include the following control variables in our models. Household debt ratio is defined as the debt-to-asset ratio, with both debt and assets log-transformed before calculating the ratio. Gender is coded 0 for male and 1 for female. Age is categorised into four groups: 19–34 (youth), 35–49 (middle-aged), 50–64 (senior) and 65+ (elderly). Educational attainment is measured on a nine-point scale. Labor market status is coded into four categories: (0) regular employees as the reference group; (1) temporary wage workers – including fixed-term contract, daily-wage, self-support, public employment and senior job programme participants; (2) employers, self-employed and unpaid family workers; and (3) unemployed and non-economically active individuals. Political ideology is measured on a five-point scale ranging from very progressive (1) to very conservative (5). Variable definitions and measurement details are provided in Table 2.
Variables

Results
Descriptive statistics
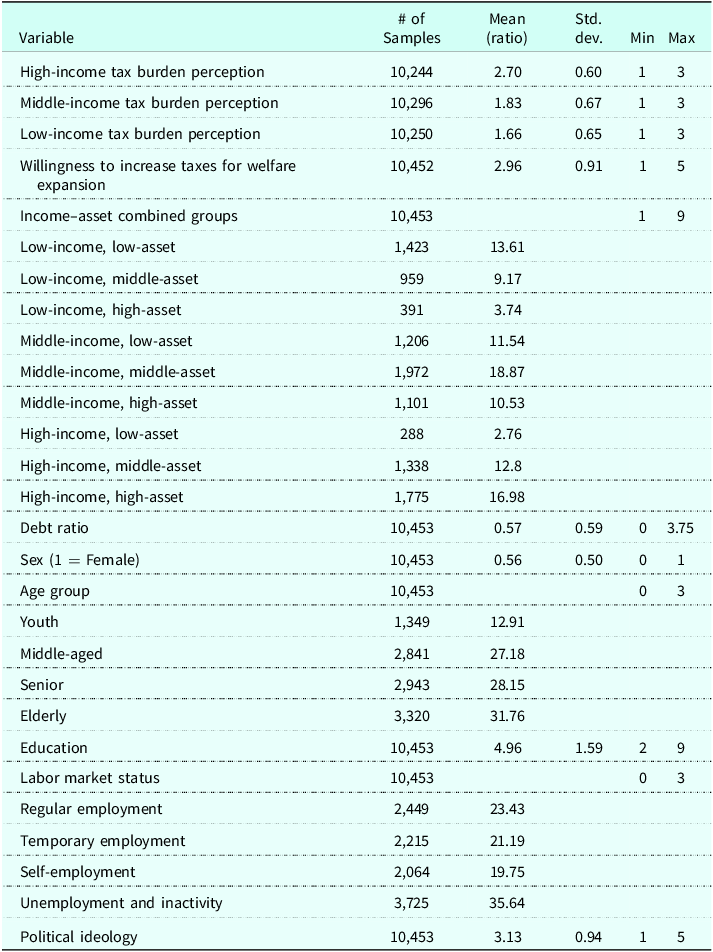
The descriptive statistics for all variables are presented in Table 3. First, regarding perceived tax burden by income group, the high-income cohort scores 2.70; higher values denote lighter burden, indicating high-income respondents feel they bear a low tax burden. In contrast, the middle-income and low-income groups score 1.83 and 1.66, respectively – both below the ‘about right’ benchmark of 2.00 – signifying that these cohorts perceive their tax burden as relatively heavy. Regarding support for welfare-financing tax increases, the median response is 3.00, and the mean is 2.96, reflecting approximately neutral support. Regarding Income–Asset Combined Groups, the middle-income/middle-asset category comprises the largest sample share, followed by the high-income/high-asset and low-income/low-asset groups; conversely, the high-income/low-asset and low-income/high-asset combinations are less prevalent.
Descriptive statistics

Table 3. Long description
The table presents descriptive statistics for various variables. It includes 10453 samples for most variables, with mean, standard deviation, minimum, and maximum values provided. The variables include high-income tax burden perception with a mean of 2.70, middle-income tax burden perception with a mean of 1.83, and low-income tax burden perception with a mean of 1.66. Willingness to increase taxes for welfare expansion has a mean of 2.96. Income-asset combined groups are categorized into nine groups with varying sample sizes and mean values. Debt ratio has a mean of 0.57. Sex is represented with a mean of 0.56, indicating the proportion of females. Age group is divided into youth, middle-aged, senior, and elderly with respective mean values. Education has a mean of 4.96. Labor market status includes regular employment, temporary employment, self-employment, and unemployment and inactivity with respective mean values. Political ideology has a mean of 3.13.
Among the control variables, women account for 56% of the respondents, and the elderly represent the largest age cohort. The average education level is 4.96 on the nine-point scale. Within the labor market status, the unemployment/inactivity category has the highest proportion. Finally, the average political-ideology score is 3.13, indicating a stance that is slightly more conservative than the scale midpoint.
Latent class analysis results
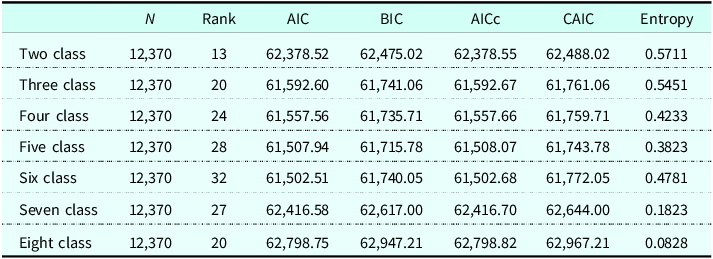
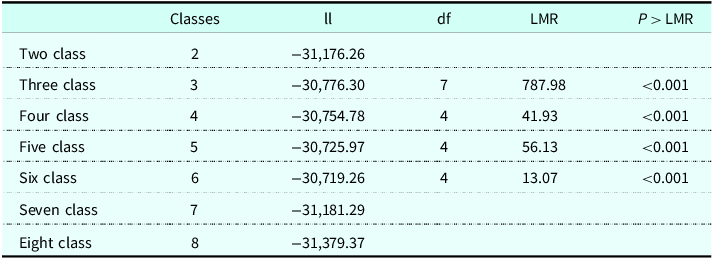
We evaluated multiple statistical criteria to determine the optimal latent class model (see Tables A1 and A2). First, we compared information criteria – AIC, BIC, corrected AIC (AICc), and CAIC – which jointly assess model fit and parsimony, with lower values indicating better performance. Second, we assessed classification quality via entropy, which ranges from 0 to 1 and signals greater classification precision as it approaches 1. Finally, we applied the Lo–Mendell–Rubin likelihood-ratio test (LMR) to evaluate whether a k-class solution significantly improved fit relative to a k–1 class model.
The analysis revealed that a five-class specification provided the best fit. BIC values steadily declined from the two-class through the five-class models before increasing at six classes; CAIC followed the same trajectory. The LMR test confirmed the superiority of the five-class solution (LMR = 56.13, p < 0.001) and showed a marked drop in significance when comparing five to six classes (LMR = 13.07). Although entropy for the five-class model was modest (0.3823), the convergence of information criteria and statistical tests supported the selection of the five-class model as the most appropriate.
These five latent classes display markedly different perceptions of tax burdens across income strata, highlighting the pluralism of social preferences toward tax policy (Figure 1). First, the Regressive System Perceivers class (26.5%) views high-income earners as under-taxed (76.9%), while perceiving middle-class (88.5%) and low-income (71.1%) taxpayers as overburdened. This group perceives the current tax system as regressive, with middle-class overburden particularly salient. Second, the Middle-Low Fairness Advocates class (30.1%) considers middle-class (93.6%) and low-income (76.9%) burdens appropriate, though opinions on high-income earners split: 52.4% view as too low, 46.1% as appropriate. As the largest segment, this class reflects satisfaction with lower and middle-income treatment, with ambivalence about taxing the wealthy.
Perceived tax burden by income group across five latent classes.

Third, the Tax Perception Ambivalents class (11.4%) exhibits no coherent pattern across income groups. Within this segment: 50.6% view high-income earners as under-taxed versus 38.7% over-taxed; 49.7% perceive middle-class burdens as too high versus 48.2% appropriate; 49.0% judge low-income burdens appropriate versus 36.1% low. As the smallest group, these respondents display ambivalence in fairness judgements. Fourth, the Progressive Taxation Advocates class (14.8%) perceives high-income earners as under-taxed (98.5%), low-income households as over-taxed (55.3%), and middle-income burdens as appropriate (46.9%) or low (39.8%). This indicates a strong belief that the current tax system lacks sufficient progressivity and supports strengthening redistributive measures. Fifth, the High-Income Focus with Middle-Class Fairness class (17.4%) unanimously regards the tax burden on high earners as too light (100%), yet accepts the middle-income share as appropriate (63.7%). Perceptions of low-income burdens are divided, with 54.7% seeing them as excessive and 43.2% as appropriate. This pattern suggests support for targeted tax increases on the wealthy while preserving the status quo for middle-income taxpayers.
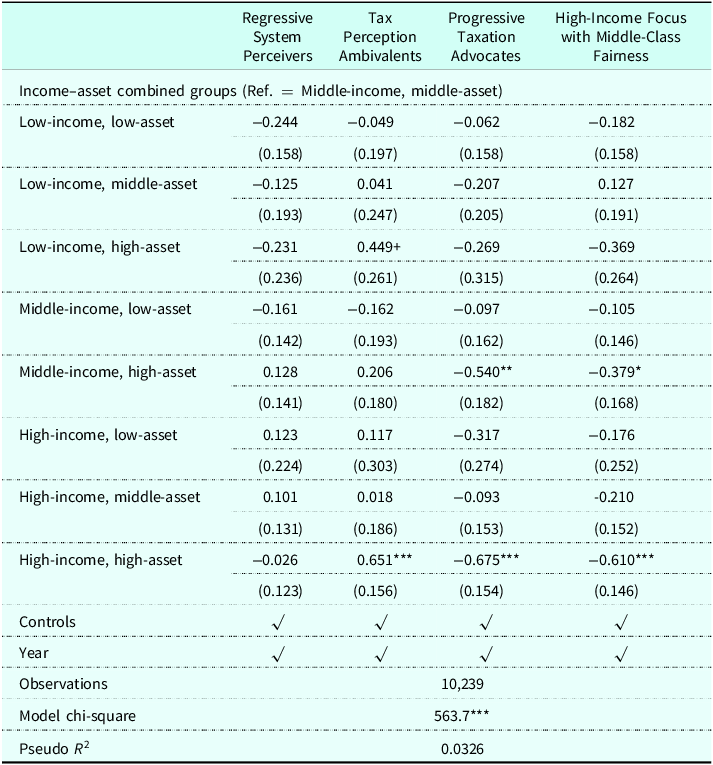
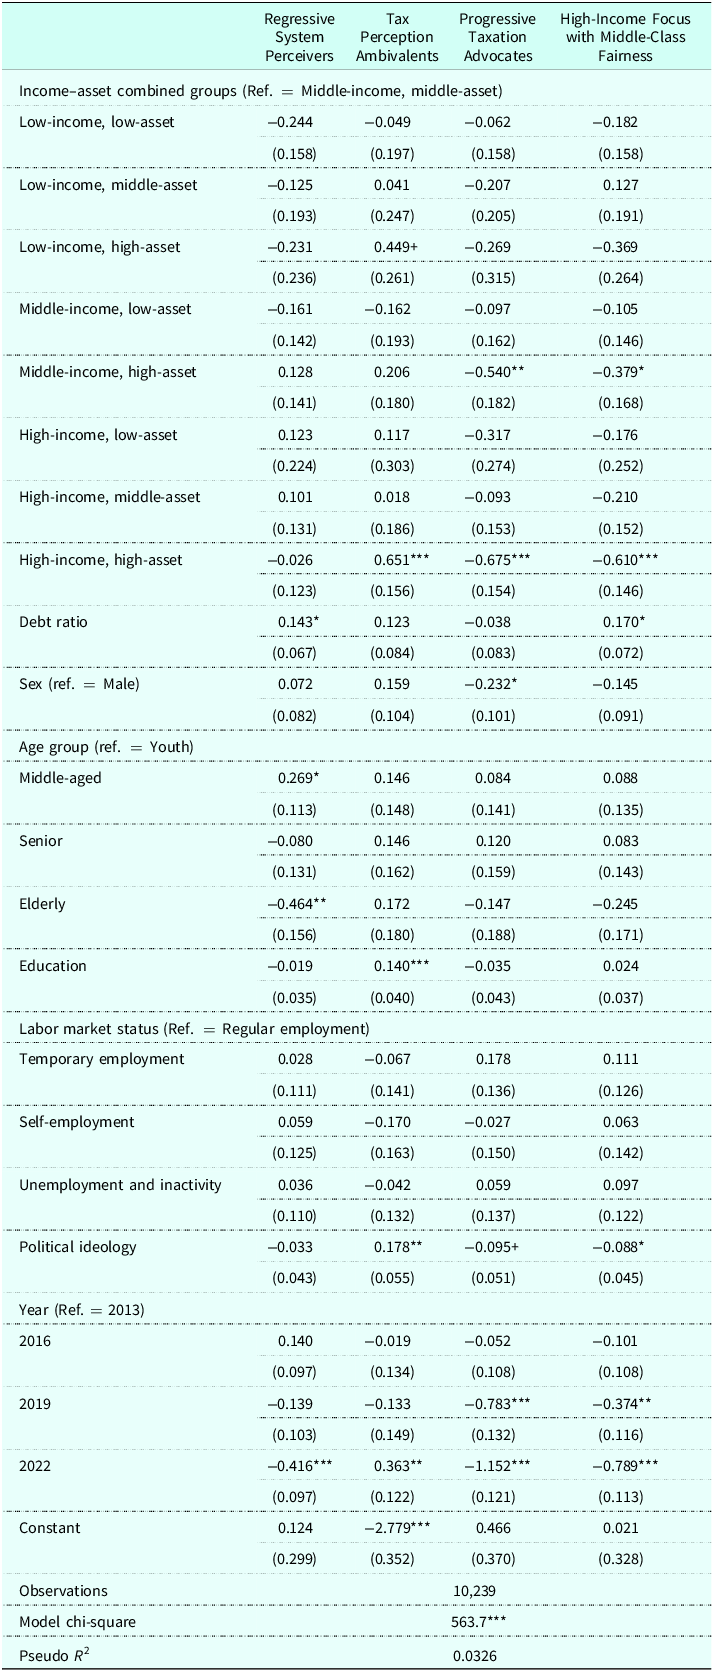
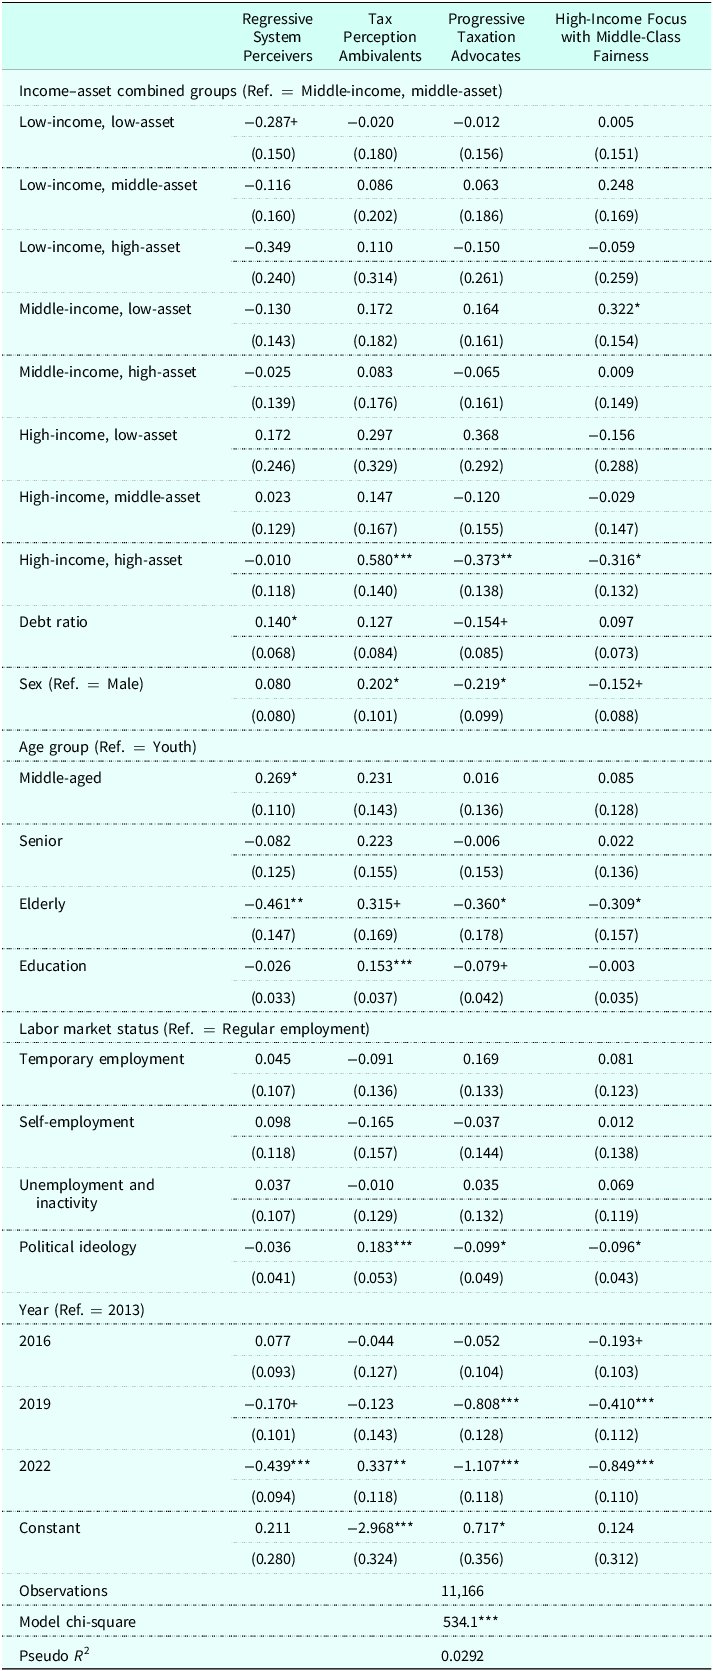
Table 4 reports the results of a multinomial logistic regression assessing how combined income–asset status predicts membership in each of the five latent classes of tax-burden perceptions. To minimise estimation error, the Middle-Low Fairness Advocates class – the largest subgroup – served as the reference category. All models in Table 4 use total assets; the full specifications, including control variables, appear in Table A3. For the Regressive System Perceivers class, no significant differences in membership probability emerged across income–asset combinations relative to the reference group. In contrast, members of the Tax Perception Ambivalents class were significantly more likely to belong to the high-income/high-asset category than to the middle-income/middle-asset baseline, reflecting this group’s heightened concern that high-income earners bear an excessive share of the tax burden. Both the Progressive Taxation Advocates and High-Income Focus with Middle-Class Fairness classes exhibited lower probabilities of membership among the middle-income/high-asset and high-income/high-asset groups compared to the reference category. These patterns indicate that, even at moderate income levels, substantial asset holdings are associated with resistance to stronger progressive taxation. Overall, the results highlight the crucial influence of asset wealth in shaping tax-burden perceptions.
Association between income-asset combined status and latent class membership probability: multinomial logistic regression results (Ref. = Middle-low fairness advocates)

Note: Please refer to Table A3 for detailed regression analysis results.
***p < 0.001, **p < 0.01, *p < 0.05, + p < 0.1.
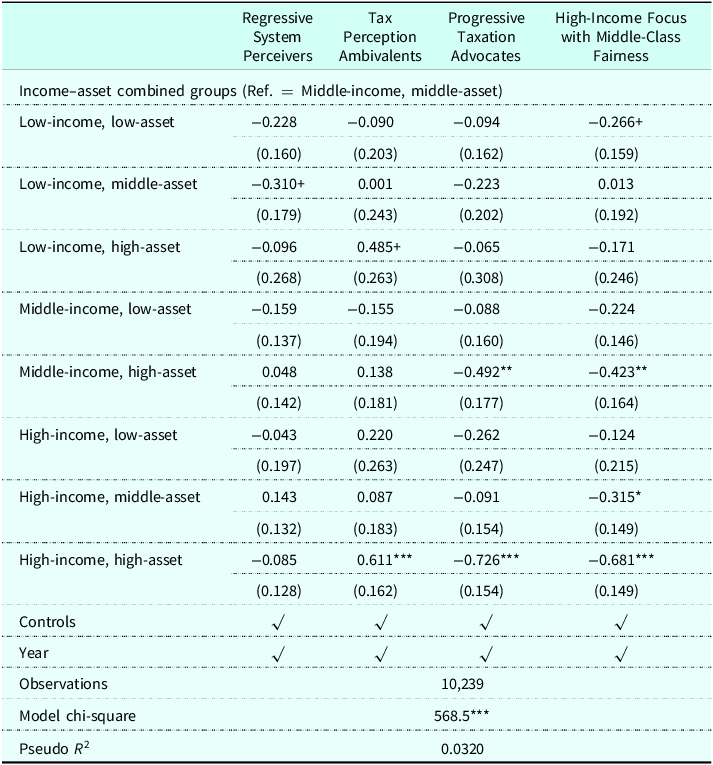
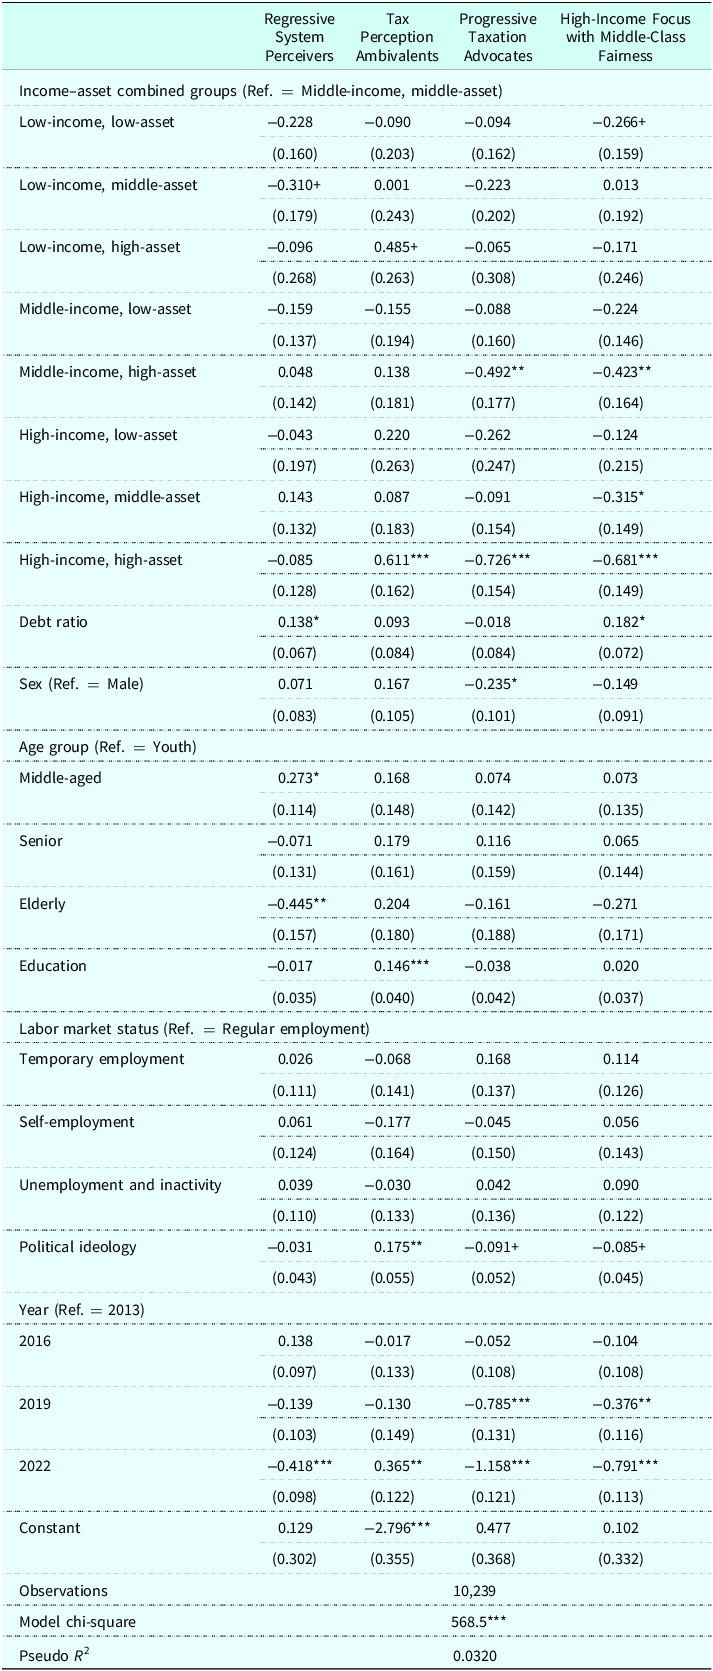
Table 5 presents the results of a multinomial logistic regression in which the combined income–asset status is redefined using illiquid assets. The set of income–asset categories that achieve statistical significance closely parallels those obtained when total assets are used. However, individuals in the high-income/middle-illiquid-asset category remain significantly less likely to belong to the High-Income Focus with Middle-Class Fairness class relative to both the Middle-Income/Middle-Asset reference group and the Middle-Low Fairness Advocates class. This finding suggests that, among high earners with only moderate illiquid holdings, perceptions of an under-taxed upper class and an appropriately taxed middle class are less prevalent, underscoring the role of illiquid asset ownership in shaping middle-class tax-burden perceptions.
Association between income-illiquid asset combined status and latent class membership probability: multinomial logistic regression results (Ref. = Middle-low fairness advocates)

Note: Please refer to Table A4 for detailed regression analysis results.
***p < 0.001, **p < 0.01, *p < 0.05, + p < 0.1.
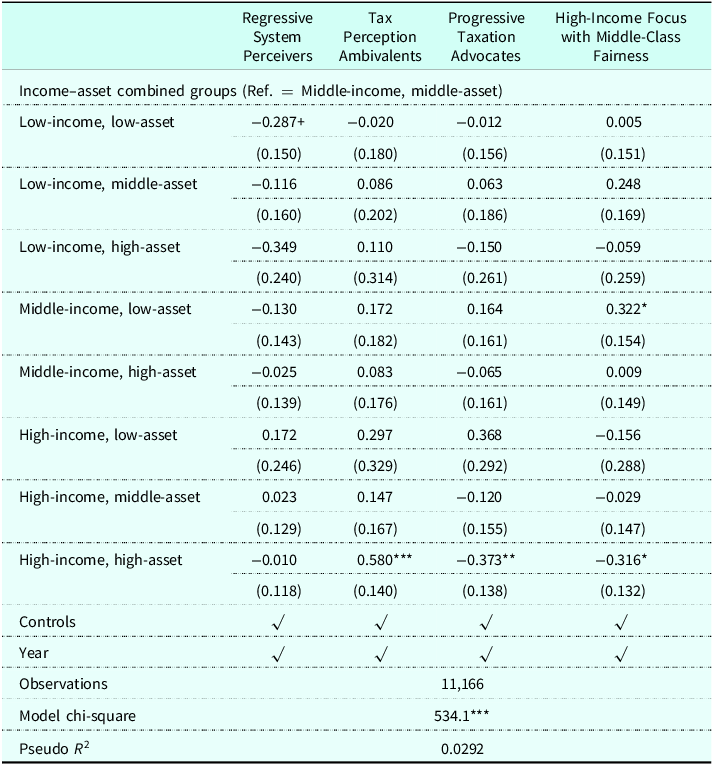
Table 6 presents the results of a multinomial logistic regression in which the combined income–asset status was defined using liquid assets. The high-income/high-asset group exhibits the same membership patterns observed in prior specifications, indicating that this cohort’s perceptions of tax burden remain consistent regardless of asset liquidity. In contrast, the middle-income/low-asset category is significantly more likely than both the middle-income/middle-asset reference group and the Middle-Low Fairness Advocates class to fall into the High-Income Focus with Middle-Class Fairness class. This finding suggests that, even at moderate income levels, households with limited asset accumulation perceive their tax burden as appropriate and are resistant to further increases. Moreover, the liquid-asset model yields fewer statistically significant associations compared to the total-asset and illiquid-asset specifications, underscoring the greater role of illiquid assets (e.g. real estate) in shaping tax-burden perceptions.
Association between income-liquid asset combined status and latent class membership probability: multinomial logistic regression results (Ref. = Middle-low fairness advocates)

Note: Please refer to Table A5 for detailed regression analysis results.
***p < 0.001, **p < 0.01, *p < 0.05, + p < 0.1.
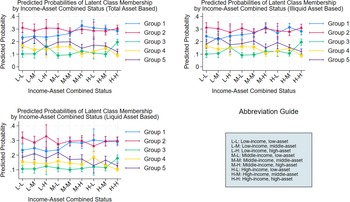
Figure 2 presents the predicted probabilities of membership in each of the five latent classes across income–asset combined statuses. Notably, the likelihood of belonging to the Regressive System Perceivers class is highest among the middle-income/high-asset group and, more generally, among all high-income categories regardless of asset level. This finding departs from Roosma et al. (Reference Roosma, Van Oorschot and Gelissen2016), who reported that lower-income individuals are more likely to favour progressive taxation, while higher-income respondents exhibit greater odds of dissatisfaction with the existing system or perceiving middle-class overburden. A plausible interpretation in the Korean context is that self-identification as ‘middle class’ requires relatively high income and asset thresholds (Koo, Reference Koo2022; Yang, Reference Yang2026). Consequently, affluent respondents perceive their own tax burden through the middle-class lens, positioning themselves as overtaxed relative to their reference group. This mismatch between objective economic status and subjective class identity intensifies when combined with illiquid asset holdings financed through high debt, which constrains actual liquidity and reinforces perceptions of unfair burden despite nominal wealth.
Latent class membership probabilities across income-asset combined statuses by asset type.
Note: Group 1: Regressive System Perceivers, Group 2: Middle-Low Fairness Advocates, Group 3: Tax Perception Ambivalents, Group 4: Progressive Taxation Advocates, Group 5: High-Income Focus with Middle-Class Fairness.

Figure 2. Long description
Three line graphs depict predicted probabilities of latent class membership by income-asset combined status for different asset types. Panel A: The line graph shows predicted probabilities of latent class membership by income-asset combined status based on total asset. The x-axis represents income-asset combined status with categories such as L-L, L-M, L-H, M-L, M-M, M-H, H-L, H-M, and H-H. The y-axis represents predicted probability ranging from 0 to 4. The graph includes five groups, each represented by a different color line: Group 1 in blue, Group 2 in pink, Group 3 in green, Group 4 in yellow, and Group 5 in purple. Panel B: The line graph shows predicted probabilities of latent class membership by income-asset combined status based on illiquid asset. The x-axis represents income-asset combined status with the same categories as Panel A. The y-axis represents predicted probability ranging from 0 to 4. The graph includes the same five groups with the same color coding as Panel A. Panel C: The line graph shows predicted probabilities of latent class membership by income-asset combined status based on liquid asset. The x-axis represents income-asset combined status with the same categories as Panels A and B. The y-axis represents predicted probability ranging from 0 to 4. The graph includes the same five groups with the same color coding as Panels A and B. An abbreviation guide is provided to explain the income-asset combined status categories.
Moreover, the pronounced effect of illiquid assets (primarily real estate) compared to liquid financial assets suggests that the ‘house poor’ phenomenon amplifies this perception of unfair burden. High asset values concentrated in illiquid real estate, often financed through substantial debt, constrain actual liquidity despite high nominal wealth. The significant positive association between debt-to-asset ratios and membership in tax-resistant classes (Table A3: β = 0.143*, p < 0.05) indicates that this liquidity crisis – where asset-rich households face cash flow pressures – intensifies tax resistance. Affluent respondents thus appear to perceive themselves not as wealthy but as constrained by illiquid assets and debt obligations, further reinforcing their sense of being overtaxed.
In contrast, the probabilities of membership in both the Progressive Taxation Advocates and the High-Income Focus with Middle-Class Fairness classes peak among respondents with lower combined income–asset status, consistent with evidence that lower-income groups prefer a more progressive tax structure (Bernasconi, Reference Bernasconi2006; Roosma et al., Reference Roosma, Van Oorschot and Gelissen2016). The Tax Perception Ambivalents class shows elevated membership probabilities in the low-income/high-asset and high-income/high-asset categories relative to other status combinations. Although this group is characterised by ambivalent fairness judgements across all income strata, its comparatively high rate of perceiving high-income earners as overburdened suggests that asset wealth shapes even its conflicted tax perceptions.
An examination of class-membership probabilities by asset type shows broadly similar patterns across the five latent classes, with only the high-income/low-asset group exhibiting slight deviations and no striking differences overall. From a combined income–asset coalition perspective, clear distinctions emerge between respondents at or below the middle-income/middle-asset threshold and those above it in their likelihood of affiliating with the Regressive System Perceivers, Progressive Taxation Advocates, and High-Income Focus with Middle-Class Fairness classes. These results suggest that coalition structures around tax-burden perceptions can form along combined income–asset lines. However, the Middle-Low Fairness Advocates class, whose members consistently view the current tax burden as appropriate, maintains similar predicted probabilities across all income–asset categories, indicating that this group’s stability warrants cautious interpretation.
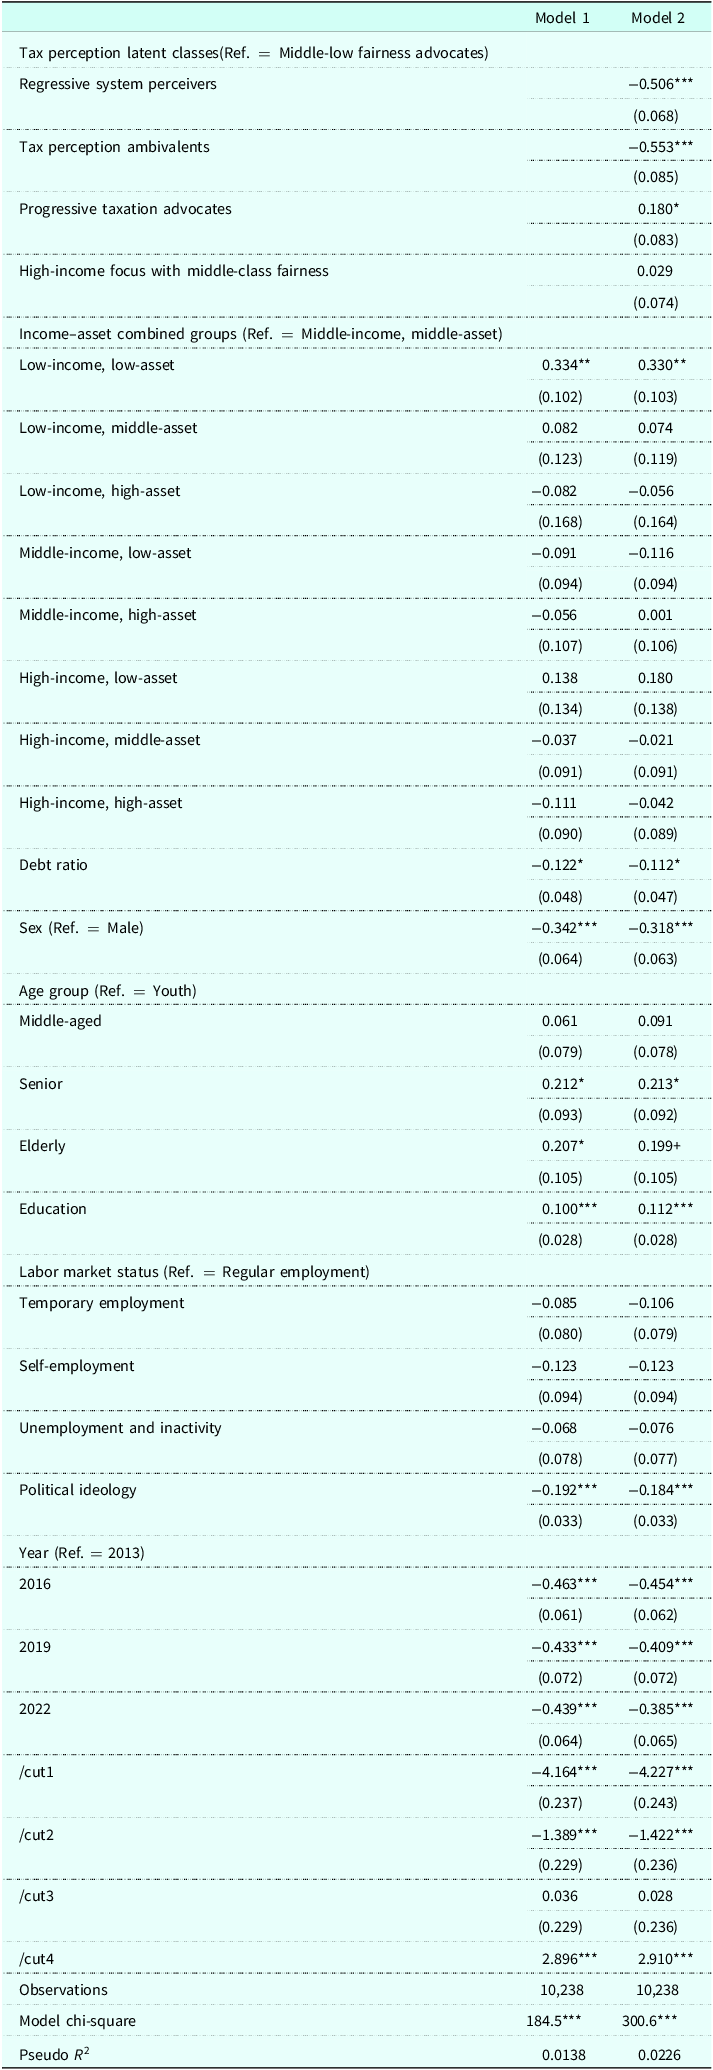
Finally, to assess how combined income–asset status and latent classes of tax-burden perception relate to support for tax increases to expand social welfare, we estimated an ordered logistic regression; the results are shown in Figure 3. Full regression tables, including control variables, appear in Table A6. First, regarding income–asset status (upper-left panel), only the low-income/low-asset group differs significantly from the middle-income/middle-asset reference group in its support for welfare-expanding tax increases. The low-income/low-asset cohort exhibits a more positive attitude toward such tax hikes than the middle-income/middle-asset group. The lower-left panel plots predicted probabilities of membership in each support category by income–asset status. For the relatively supportive fourth category, only the low-income/low-asset, low-income/middle-asset, and high-income/low-asset groups display marginally elevated probabilities, indicating no clear coalition based solely on combined economic position.
Effects of income-asset combined status and latent class membership on tax increase support: coefficient estimates and predicted probabilities.
Note: Group 1: Regressive System Perceivers, Group 2: Middle-Low Fairness Advocates, Group 3: Tax Perception Ambivalents, Group 4: Progressive Taxation Advocates, Group 5: High-Income Focus with Middle-Class Fairness. Please refer to Table A6 for detailed regression analysis results.

Figure 3. Long description
Panel A: Ordered Logit graph showing support for tax increase by income-asset combined status. The horizontal axis represents different income-asset combined statuses (L-L, L-M, L-H, M-L, M-H, H-L, H-M, H-H) and the vertical axis represents the log odds of supporting a tax increase. The graph includes error bars indicating confidence intervals and significance levels marked by asterisks. Panel B: Ordered Logit graph showing support for tax increase by latent class membership. The horizontal axis represents different latent classes (Class 1, Class 3, Class 4, Class 5) and the vertical axis represents the log odds of supporting a tax increase. The graph includes error bars indicating confidence intervals and significance levels marked by asterisks. Panel C: Line graph showing predicted probabilities of tax increase support by income-asset combined status. The horizontal axis represents different income-asset combined statuses (L-L, L-M, L-H, M-L, M-H, H-L, H-M, H-H) and the vertical axis represents the predicted probability. Different colored lines represent different outcomes (Outcome 1, Outcome 2, Outcome 3, Outcome 4, Outcome 5). Panel D: Line graph showing predicted probabilities of tax increase support by latent class membership. The horizontal axis represents different latent classes (Class 1, Class 2, Class 3, Class 4, Class 5) and the vertical axis represents the predicted probability. Different colored lines represent different outcomes (Outcome 1, Outcome 2, Outcome 3, Outcome 4, Outcome 5).
By contrast, the upper-right panel shows that, compared to the Middle-Low Fairness Advocates, the Regressive System Perceivers and Tax Perception Ambivalents classes are negatively disposed toward welfare-expanding tax increases, whereas the Progressive Taxation Advocates class is positively inclined. The lower-right panel presents the corresponding predicted probabilities by latent class: for the supportive fourth category, the Middle-Low Fairness Advocates, Progressive Taxation Advocates and High-Income Focus with Middle-Class Fairness classes all show high probabilities of endorsement, while the Regressive System Perceivers and Tax Perception Ambivalents classes register relatively low probabilities. These three supportive classes together comprise 62% of the sample, indicating that a majority of latent classes hold favourable views toward tax increases for welfare expansion.
Conclusion
This study employed latent class analysis to examine how income–asset status influences taxpayers’ fairness perceptions across income strata. We analysed total and separately liquid and illiquid asset measures. Five distinct perception classes emerged: (1) Regressive System Perceivers – viewing high earners as undertaxed and lower groups overburdened; (2) Middle-Low Fairness Advocates – deeming lower burdens appropriate and showing some support for higher taxes on the wealthy; (3) Tax Perception Ambivalents – whose judgements are inconsistent across income tiers; (4) Progressive Taxation Advocates – demanding stronger progressivity; and (5) High-Income Focus with Middle-Class Fairness – supporting top-end taxation while accepting middle-class fairness.
Multinomial logistic regressions demonstrate that membership probabilities in these classes differ systematically by combined income–asset status, with clear coalition patterns – particularly when illiquid assets define economic status – forming above and below the middle-income/middle-asset threshold. By contrast, support for welfare-financing tax increases aligns more closely with latent perception classes than with economic status alone. Only the low-income/low-asset group shows significantly stronger pro-tax attitudes relative to the middle-income/middle-asset baseline; however, three perception classes – the Middle-Low Fairness Advocates, Progressive Taxation Advocates and High-Income Focus with Middle-Class Fairness – comprise 62 per cent of respondents and exhibit robust support for welfare-expanding tax hikes.
These findings underscore integrating income and asset dimensions in tax policy design. Affluent respondents disproportionately belong to the Regressive System Perceivers class, reflecting Korean class identity tied to income and wealth, requiring policy tailoring. Strategic engagement with perceptual coalitions is crucial for legitimising welfare-financing tax measures. Resistance to means-tested welfare underscores universal programmes’ value in avoiding the redistribution paradox and enhancing efficacy. Identity mismatch, amplified by illiquid assets and debt constraints, drives unfair tax burden perceptions among the objectively wealthy. Tax resistance thus reflects how subjective class identity and liquidity constraints shape the taxation experience.
Future research should examine how perceptual classes view universal versus means-tested welfare programmes, linking tax burden perceptions to welfare preferences. Understanding these attitudes would illuminate welfare coalition dynamics and clarify whether tax resistance reflects opposition to welfare expansion or selective programmes perceived as inequitable. Such analysis would strengthen policy recommendations and advance understanding of coalition formation around welfare state design in high-inequality democracies.
Acknowledgements
None.
Funding statement
The work was supported by the Ministry of Education of the Republic of Korea and the National Research Foundation of Korea (NRF-2025S1A5A8007583).
Competing interests
None.
Ethical standards
None.
Appendix A
Information criteria and entropy index for latent class model comparison

AIC is the Akaike information criterion.
BIC is the Bayesian information criterion.
AICc is the corrected Akaike information criterion.
CAIC is the consistent Akaike information criterion.
BIC, AICc and CAIC use N = number of observations.
Lo-Mendell-Rubin likelihood ratio test results for latent class model comparison

Table A2. Long description
The table compares different income-asset groups across four tax perception categories: Regressive System Perceivers, Tax Perception Ambivalents, Progressive Taxation Advocates, and High-Income Focus with Middle-Class Fairness. The table has 10 rows and 5 columns. The columns are labeled as Regressive System Perceivers, Tax Perception Ambivalents, Progressive Taxation Advocates, and High-Income Focus with Middle-Class Fairness. The rows are labeled as Income-asset combined groups (Ref. = Middle-income, middle-asset), Low-income, low-asset, Low-income, middle-asset, Low-income, high-asset, Middle-income, low-asset, Middle-income, high-asset, High-income, low-asset, High-income, middle-asset, High-income, high-asset, and Controls. Each cell contains a value and a standard error in parentheses. Notable trends include significant values marked with asterisks indicating different levels of statistical significance.
LMR is the Lo–Mendell–Rubin-adjusted likelihood-ratio test statistic.
Likelihood-ratio tests compare the given model versus the same model with one less latent class.
Association between income-asset combined status and latent class membership probability: multinomial logistic regression results (Ref. = Middle-low fairness advocates)

***p < 0.001, **p < 0.01, *p < 0.05, +p < 0.1.
Association between income-illiquid asset combined status and latent class membership probability: multinomial logistic regression results (Ref. = Middle-low fairness advocates)

***p < 0.001, **p < 0.01, *p < 0.05, +p < 0.1.
Association between income-liquid asset combined status and latent class membership probability: multinomial logistic regression results (Ref. = Middle-low fairness advocates)

Table A5. Long description
The table presents the association between income-liquid asset combined status and latent class membership probability using multinomial logistic regression results. The reference group is Middle-low fairness advocates. The table has 18 rows and 5 columns. Column headers are Regressive System Perceivers, Tax Perception Ambivalents, Progressive Taxation Advocates, and High-Income Focus with Middle-Class Fairness. Row labels include various income-asset combined groups and controls such as Debt ratio, Sex, Age group, Education, Labor market status, Political ideology, and Year. Each cell contains values with standard errors in parentheses. Notable trends include varying probabilities across different income-asset groups and latent class memberships. The table also includes observations, model chi-square, and pseudo R-squared values at the bottom.
***p < 0.001, **p < 0.01, *p < 0.05, +p < 0.1.
Ordered logistic analysis of tax increase support: associations with income-asset combined status and tax perception latent classes

*** p < 0.001, ** p < 0.01, * p < 0.05, +p < 0.1.



 Open access

