


1. Introduction
Black carbon (BC), organic carbon (OC) and mineral dust (MD) are the three primary components of light-absorbing impurities (LAIs) in snow and ice. These components play an important role in regional and global climate change and the hydrological cycle by reducing snow and ice albedo and triggering positive feedback effects (e.g. Xu and others, Reference Xu2009; Bond and others, Reference Bond2013; IPCC, Reference IPCC, Stocker, Qin and Plattner2013; Ji and others, Reference Ji, Kang, Cong, Zhang and Yao2015; Qian and others, Reference Qian2015; Ji, Reference Ji2016; Zhang and others, Reference Zhang2018). Currently, BC is the second most important factor affecting global warming after carbon dioxide (Jacobson, Reference Jacobson2002; Hansen and Nazarenko, Reference Hansen and Nazarenko2004; Forsström and others, Reference Forsström, Ström, Pedersen, Isaksson and Gerland2009). Studies have shown that there are regional differences in spatial distributions of LAIs in snow cover. In the Arctic, BC concentration in snow cover varied from 3 to 127 ng g−1. The maximum and minimum concentrations appeared in Greenland and the Alert site in Canada, respectively (Clarke and Noone, Reference Clarke and Noone1985; Doherty and others, Reference Doherty, Warren, Grenfell, Clarke and Brandt2010). Research on LAIs in snow cover at mid-latitudes were mainly concentrated in North America (Grenfell and others, Reference Grenfell, Perovich and Ogren1981; Chýlek and others, Reference Chýlek, Kou, Johnson, Boudala and Lesins1999; Qian and others, Reference Qian, Gustafson, Leung and Ghan2009, Reference Qian2015; Doherty and others, Reference Doherty, Dang, Hegg, Zhang and Warren2014, Reference Doherty2016; Kaspari and others, Reference Kaspari, Skiles, Delaney, Dixon and Painter2015), Europe (Sergent and others, Reference Sergent, Pougatch, Sudual and Bourdelles1993, Reference Sergent, Leroux, Pougatch and Guirado1998; Painter and others, Reference Painter2013; Di Mauro and others, Reference Di Mauro2015; Gabbi and others, Reference Gabbi, Huss, Bauder, Cao and Schwikowski2015), high mountain regions of Asia, including the Tibetan Plateau (TP) and the Hindu-Kush Himalaya (Xu and others, Reference Xu, Yao, Liu and Wang2006; Ming and others, Reference Ming2009; Ménégoz and others, Reference Ménégoz2014; Qu and others, Reference Qu2014; Li and others, Reference Li2017; Zhang and others, Reference Zhang2018), and northern China (Huang and others, Reference Huang2011; Ye and others, Reference Ye2012; Wang and others, Reference Wang, Doherty and Huang2013; Pu and others, Reference Pu2017). Their results indicated that the closer to the human activity centres a location is, the higher the LAI concentration is.
Northern Xinjiang (NX) is the most abundant area of snow resources in China, which accounts for one-third of snowmelt water resource in the country (Li, Reference Li1999). Snowmelt runoff accounts for 50% of the total annual runoff in this region, and it is an important contributor to local agricultural irrigation and river recharge (Li, Reference Li1999). Compared with Northeast China, the concentration of BC in NX snow cover was lower with a median of 70 ng g−1 and decreased with elevation (Ye and others, Reference Ye2012). Studies on the concentrations of LAIs in snow cover mainly focused on BC, but few studies focused on OC and MD. In previous studies, short-term (one year or one winter) observational data were used to analyse. There has been a lack of fixed-point continuous observations of the distributions and variations of LAIs. Therefore, continuing and expanding snow cover sampling of LAIs is necessary.
LAIs deposit onto snow cover and significantly reduce snow albedo across the visible wavelengths and then absorb more solar irradiance and produce positive radiative forcing (RF) due to snow surface darkening. Flanner and others (Reference Flanner, Zender, Randerson and Rasch2007) found that the global annual mean RF caused by BC from fossil fuel and biofuel sources on snow surfaces was 0.043 W m−2, which indicated that the anthropogenic contribution to total forcing was at least 80%. In the site of Nam Co Lake (the lake is located in the Central TP and adjacent to the northern slope of Mt. Nyainqentanglha), BC and dust on snow surfaces reduced snow albedo by 11 and 28%, respectively (Ming and others, Reference Ming, Xiao, Du and Yang2013). The results from northern China indicated that changes in snow albedo were mainly caused by dust in Inner Mongolia, Qinghai and Gansu provinces (Huang and others, Reference Huang2011; Wang and others, Reference Wang, Doherty and Huang2013).
Positive radiation feedback caused by LAIs in snow can heat the snow surface temperature and lead to a fast snowmelt. BC, dust and other LAIs have become one of the main contributors in accelerating global snow and ice melting under climate warming (Flanner and others, Reference Flanner2009). Qian and others (Reference Qian, Gustafson, Leung and Ghan2009) simulated the effect of soot-induced snow albedo change on snowpack with the Weather Research and Forecasting model coupled with chemistry (WRF-Chem) model and found that the snow water equivalent (SWE) decreased 2–50 mm because of soot on snow in mountain regions during late winter to early spring in the western USA. Correspondingly, the simulated spring runoff decreased by 0.1–0.7 mm d−1 due to the reduction of snow accumulation (Qian and others, Reference Qian, Gustafson, Leung and Ghan2009). Ménégoz and others (Reference Ménégoz2014) simulated the effect of wet and dry BC depositions on the reduction of snow cover duration (SCD) by 1–8 d in the Himalaya. BC and MD reduced the average snowpack duration by 3.1 ± 0.1 to 4.4 ± 0.2 d on the TP (Zhang and others, Reference Zhang2018). Simulations suggested that SWE decreased by 5–25 mm on the TP due to a positive RF induced by BC in snow (Ji and others, Reference Ji, Kang, Cong, Zhang and Yao2015).
Previous studies have rarely examined the effects of LAIs on snow albedo and RF in NX. The quantitative relationship between LAIs and snow albedo is not clear. Additionally, quantitative assessments of the contributions of LAIs to snowmelt have not been carried out to date. The objective of this study is to (i) investigate the spatial distributions and variations of LAIs in snow cover by continuous and extensive observations. (ii) Quantify the effects of BC and MD on snow albedo and RF using the Snow, Ice, and Aerosol Radiative (SNICAR) model. (iii) Finally, assess the contributions of BC and MD to changes in the SCD via snowmelt. Additionally, the WRF-Chem is used to simulate emission sources and BC transport mechanisms. This study provides a basic dataset of LAI concentration in snow and its effect on snow albedo across NX, which can be used as an input parameter of the climate or hydrological model. These first-hand observations would help to perform simulating verification by clarifying the influence of LAIs on the changes in snow albedo.
2. Data and methodology
2.1. Study area
NX locates in the north of the Tianshan Mountains in the Xinjiang Autonomous Region and it lies between latitudes 41.67 and 49.19°N and longitudes 79.52 and 95.83°E. The total area of NX is 517 × 103 km2, and its elevation varies from 154 to 7009 m a.s.l. NX is a temperate continental climate zone, and westerly winds have an important impact on water vapour transport throughout the area. This zone is also one of the three major snow-covered areas in China. Snow cover exists from October to the following April (Zhong and others, Reference Zhong2018). The long-term mean snow depth was ~3 cm from 1971 to 2000 (Zhong and others, Reference Zhong2018), and it increased to more than 5 cm from 2000 to 2014 (Huang and others, Reference Huang2016). However, SCD has decreased significantly, and the final snow cover date presented an earlier ending trend in the most recent 50 years (Dai and Che, Reference Dai and Che2014; Huang and others, Reference Huang2016; Ke and others, Reference Ke2016; Zhang and Ma, Reference Zhang and Ma2018). As an important source of water resources, variation in snow cover can directly affect the water security and lives of NX residents.
2.2. Snow sampling
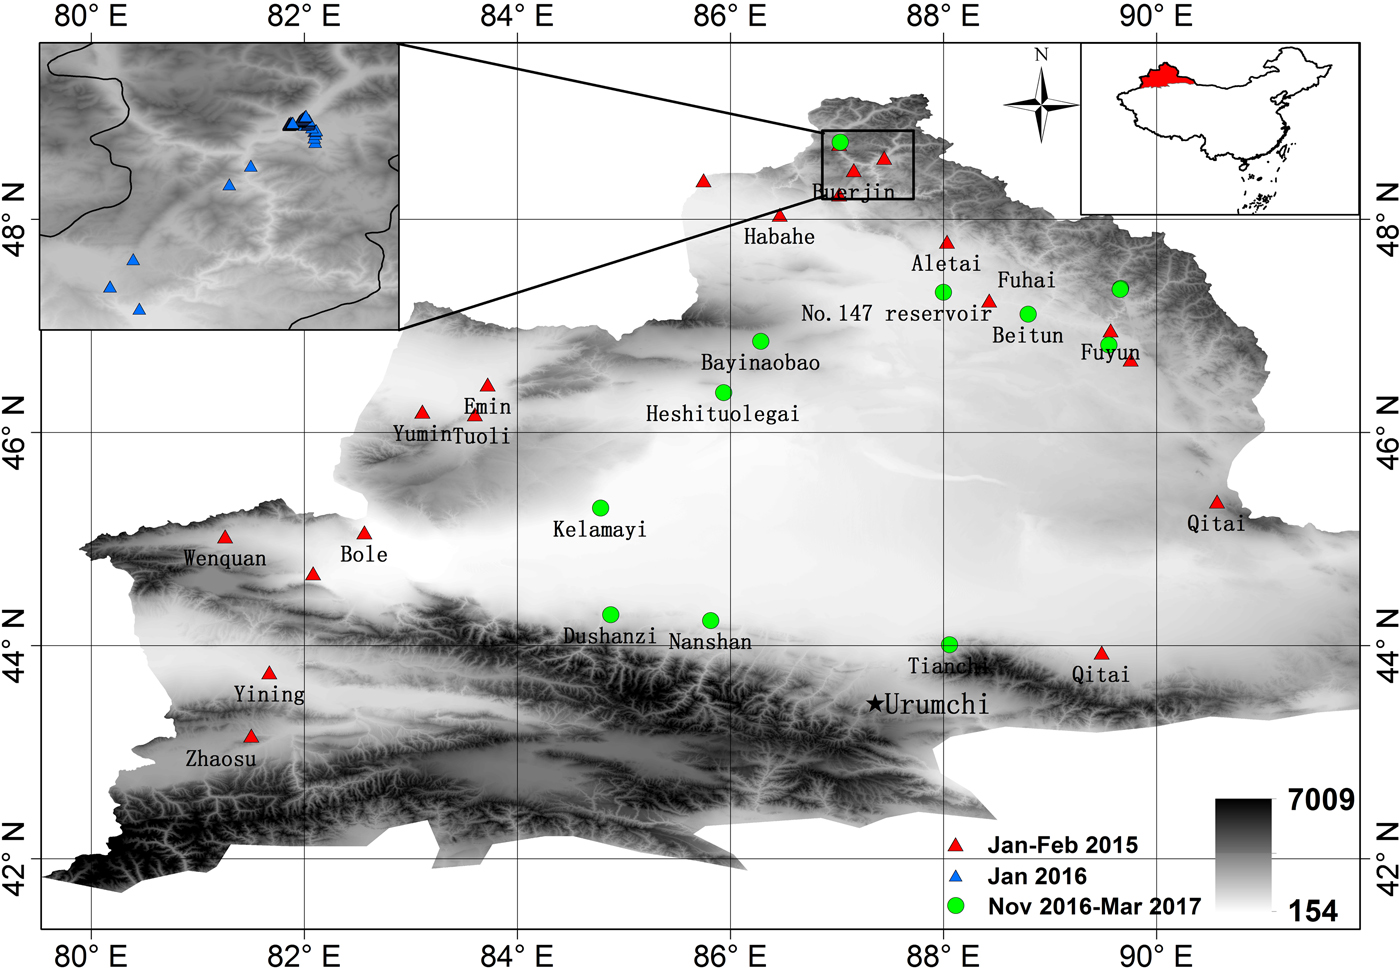
Snow samples were collected from 106 sites in the field from 2015 to 2017 across NX (Fig. 1). Twenty snow samples were collected in January and February of 2015. Sixty sampling sites were established in January 2016 in Hemu village. To analyse changes in the concentration of LAIs in different areas, ten sites were collected for fixed-point sampling in November 2016, and January and March 2017. There were four fixed points (Fuyun, Beitun, No. 147 Reservoir, Buerjin) to analyse the temporal changes of the LAI concentration in snow in the Altai Mountains in China. Three fixed points (Bayinaobao, Heshituolegai, Kelamayi) were set on the west side of the Junggar Basin to determine the deposition of LAIs in snow. Three fixed points (Dushanzi, Nanshan, Tianshan) were set up to monitor and analyse the LAI concentration in the Tianshan Mountains. Sample collection followed the ‘Clean Hands–Dirty Hands’ principle (Fitzgerald, Reference Fitzgerald and Davison1999). Sampler, who wore protective clothing and gloves, collected snow samples with a shovel that had been precleaned with distilled water. Snow samples were collected from the top 5 cm of the snowpack and stored in a Whirl-Pak® standard bag. All snow samples remained frozen until they were filtered in the laboratory. In addition, snow depth, snow density and snow grain size were observed in field surveys (Table S1). Snow depth was measured with a wooden ruler. Snow density was measured with a wedge snow density cutter. The volume is 250 cm−3, with a length, width and height of 10, 5 and 5 cm, respectively. The wedge snow density cutter was filled with snow. Snow mass was weighed by a balance, and then snow density was calculated by dividing the snow sample mass by the sample volume. Snow grain size was measured using a digital microscope with a camera function, and the measurement accuracy was 0.1 mm. Firstly, snow was sprayed on the MIG paper (each grid consists of 1 mm × 1 mm squares), photographed with the digital microscope, and then the major and minor axes were counted in the photograph. Snow grain size can be calculated by averaging the two axes. Although snow grain size was similar on snow surface across NX, to avoid the observation error, five snow grain particles still measured at each site. The average radius of the five snow grain size was taken as the snow grain effective radius at each site.
Geographical locations of surface snow sampling sites in snow cover across the Northern Xinjiang during the period from 2015 through 2017. The red triangles represent sites where snow samples were collected in January and February of 2015. The blue triangles show sites where snow samples were collected in January 2016. The green circles denote stations where sites where snow samples were collected for fixed-point sampling in November 2016, and January and March 2017.
2.3. LAIs measurements
In the laboratory, snow samples were melted, and the meltwater was immediately filtered through pre-dried (600°C for 6 h) and weighed quartz fibre filters (Whatman® QMA, diameter = 47 mm) using an electronic vacuum pump. We weighed the mass of the filtered filters using a microbalance with an accuracy of 0.1 mg. In the previous study, the filter capture efficiency for liquid samples has been tested by our team. The ratio of the BC concentrations in samples was 77 ± 17%, which indicated a fairly high degree of recovery (Li and others, Reference Li2016). The MD concentration was calculated by taking the difference in weight from before and after filtration. To analyse the concentrations of BC and OC (only water-insoluble OC), filtered quartz filters were measured by the Desert Research Institute (DRI) Model 2015 Thermal/Optical Carbon Analyser (Chen and others, Reference Chen2015; Zhang and Kang, Reference Zhang and Kang2018). This method performed an oxidation analysis on a filter of 0.5 cm2 under different temperature and environmental conditions. The filter sample was gradually heated from a low temperature to 580°C in an anaerobic environment, and then the OC was obtained by dissipation. Subsequently, BC was gradually heated and dissipated in an oxidizing environment containing 2% of oxygen. Both light-absorbing and non-absorbing OC are contained in the total OC in this analysis. A detailed method is provided by Zhang and Kang (Reference Zhang and Kang2018).
2.4. Weather Research and Forecasting model
The WRF-Chem (Version 3.6.1) was used to simulate the BC emission source and transport mechanism. The WRF-Chem model considers complex physical and chemical processes, such as the transport of chemical species, emissions and depositions of pollutants, gaseous and aqueous chemical transformations, parameterizations of aerosols, and photolysis (Grell and others, Reference Grell2005). Numerical experiments were performed with a 25 km spatial resolution. The simulated domain was centred at 44.5°N, 85°E, and had a 30-layer structure with a model top pressure of 50 hPa. The National Centers for Environmental Prediction (NECP) reanalysis data with a horizontal resolution of 1° × 1° at 6 h time intervals were used to determine the initial conditions for the meteorological field. The simulated period spanned from January 2015 through March 2017. An anthropogenic emission inventory was obtained from the Reanalysis of the TROpospheric chemical composition (RETRO, http://retro.enes.org/index.shtml) with a 0.5° × 0.5° resolution. We chose residential areas, industry, transportation and power as simulated emission sources. Surface wind data of the national weather stations from the National Meteorological Information Centre (NMIC, http://data.cma.cn) of China Meteorological Administration were used to simulate a 10 m above ground wind field by the WRF-Chem model.
2.5. Simulation of albedo and radiative forcing
The SNICAR model (Flanner and others, Reference Flanner, Zender, Randerson and Rasch2007) was applied in our study to simulate changes in snow cover albedo caused by BC and MD. This model combines impurity concentrations (BC, MD and volcanic ash), snow properties (snow depth, snow grain size and snow density) and the surface incident solar flux to calculate snow and ice reflectance (Flanner and others, Reference Flanner, Zender, Randerson and Rasch2007). The Maxwell–Garnett approximation was applied for combining indices of refractions. The absorption of iron oxide was not considered in the model. Detailed input parameters of the SNICAR model are shown in Table S1. In the simulation, the solar zenith angle was determined by the sampling time and location. Snow depth, snow grain size and snow density observed at each site in the field were used for model running. A mass absorption cross-section was set to a value of 1 for sulphate-coated and hydrophilic BC (Qu and others, Reference Qu2014). Based on the albedo calculation, RF caused by BC and MD on a snow cover surface was obtained by Eqn (1) (Kaspari and others, Reference Kaspari, Painter, Gysel, Skiles and Schwikowski2014):

where E is the spectral irradiance, λ is the wavelength (μm), θ is the solar zenith angle for irradiance (°), α is the simulated snow cover albedo in clean snow or with BC and/or MD impurities (imp), γ was the snow optical grain size (μm). The RF is sensitive to snow grain size (Flanner and others, Reference Flanner, Zender, Randerson and Rasch2007). It is the sum of instantaneous RF of LAIs in snow and the change in flux caused by snow grain size feedback. Due to the presence of LAIs, snow ageing is accelerated, accompanied by the snow grain size growth. The grain size growth leads to snow albedo decrease and snowmelt with increasing temperature. At the same time, the LAI concentration in snow increases. This LAIs–snow grain size feedback contributed to the RF calculation in the model.
2.6. Estimation of changes in SCD
Decreases in SCD are not only related to changes in air temperature and precipitation but are also affected by LAIs in snow cover. Schmale and others (Reference Schmale2017) constructed a model to quantify the impacts of BC and MD on snowmelt. This model considered the absorptivity of snow, incoming shortwave solar radiation obtained from local weather stations, and the number of days with the daily air temperature above 0°C. The amount of snowmelt was simulated by Eqn (2) (Schmale and others, Reference Schmale2017):

where N Tht0 is the number of days with a daily air temperature above 0°C, Δα is the albedo reduction (for clean snow and snow with BC and/or MD) and SW is shortwave radiation.
Based on this equation, we simulated the SCD of snowmelt (N Tht0) by assuming that the amount of snowmelt (SWE) was constant in low, medium and high scenarios with variations in snow cover albedo (Tables S3–S4). Then, changes in the SCD of snowmelt were calculated. We used the cluster analysis with the partitioning algorithm to classify the SWE, shortwave radiation, snow density and snow grain size data in spring across NX. Part of the SWE data across NX were obtained from the NMIC of the China Meteorological Administration, which was measured with Model VS-43 snow tube. The other part of the data were derived from the snow depth multiplied by snow density in situ. SWE data were clustered into 30 and 60 mm scenarios. The daily shortwave radiation data were obtained from NMIC, which was observed by net radiation sensor (Kipp&Zonen CNR4) in a weather station. The shortwave radiation data were determined with the criteria for 130 W m−2 in low scenario, 165 W m−2 in medium scenario and 200 mm W m−2 in high scenario. The snow density and snow grain size data were derived from field sampling during the melting period. Cluster analysis of the three scenarios is shown in Table S2.
3. Results and discussion
3.1. Spatial variation of LAI concentrations in snow cover surface
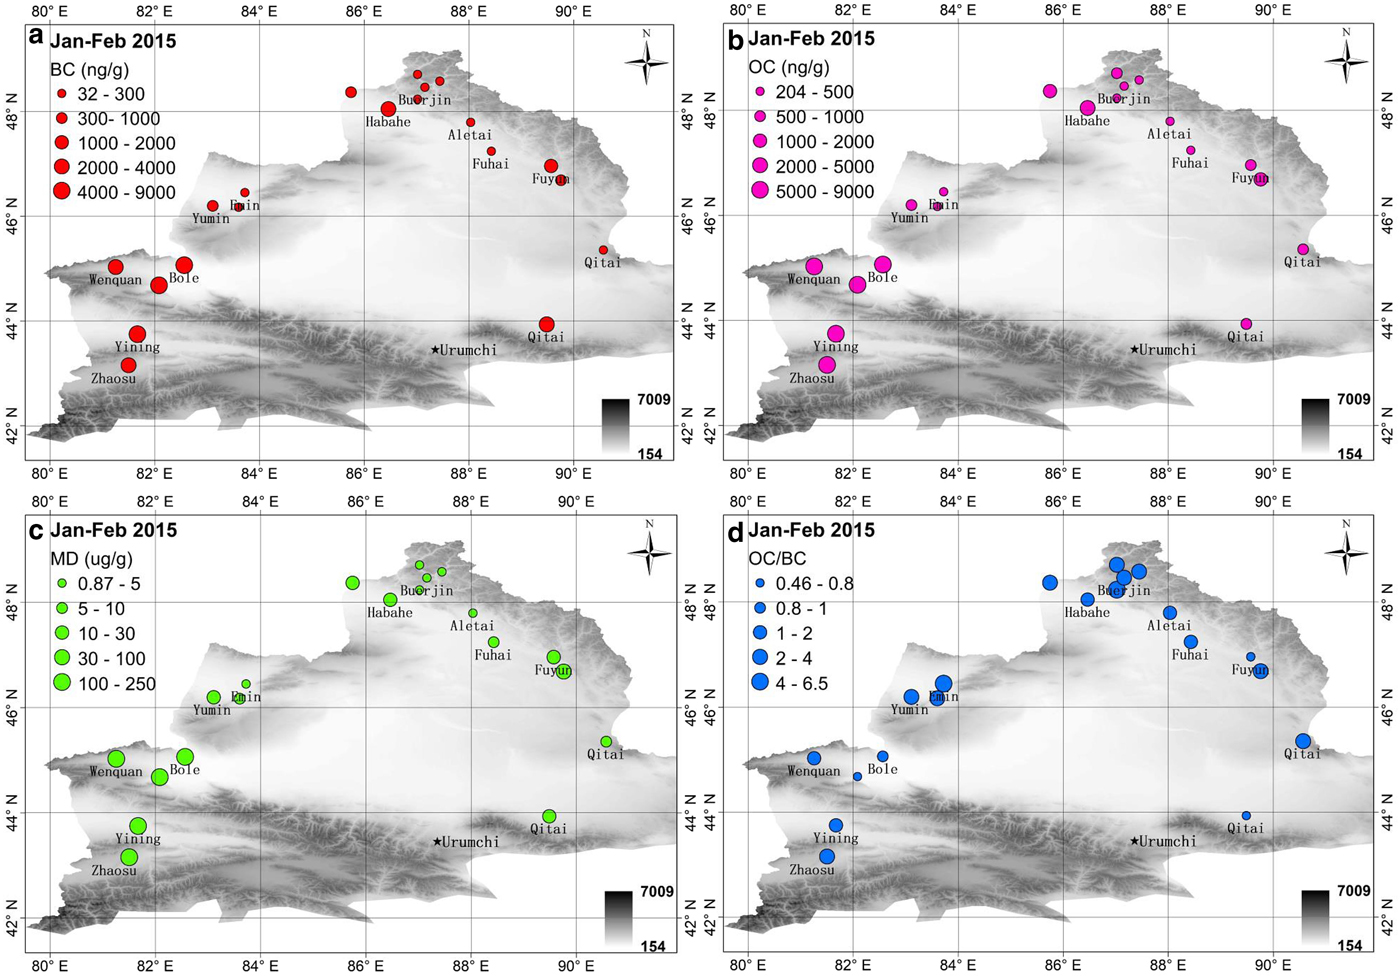
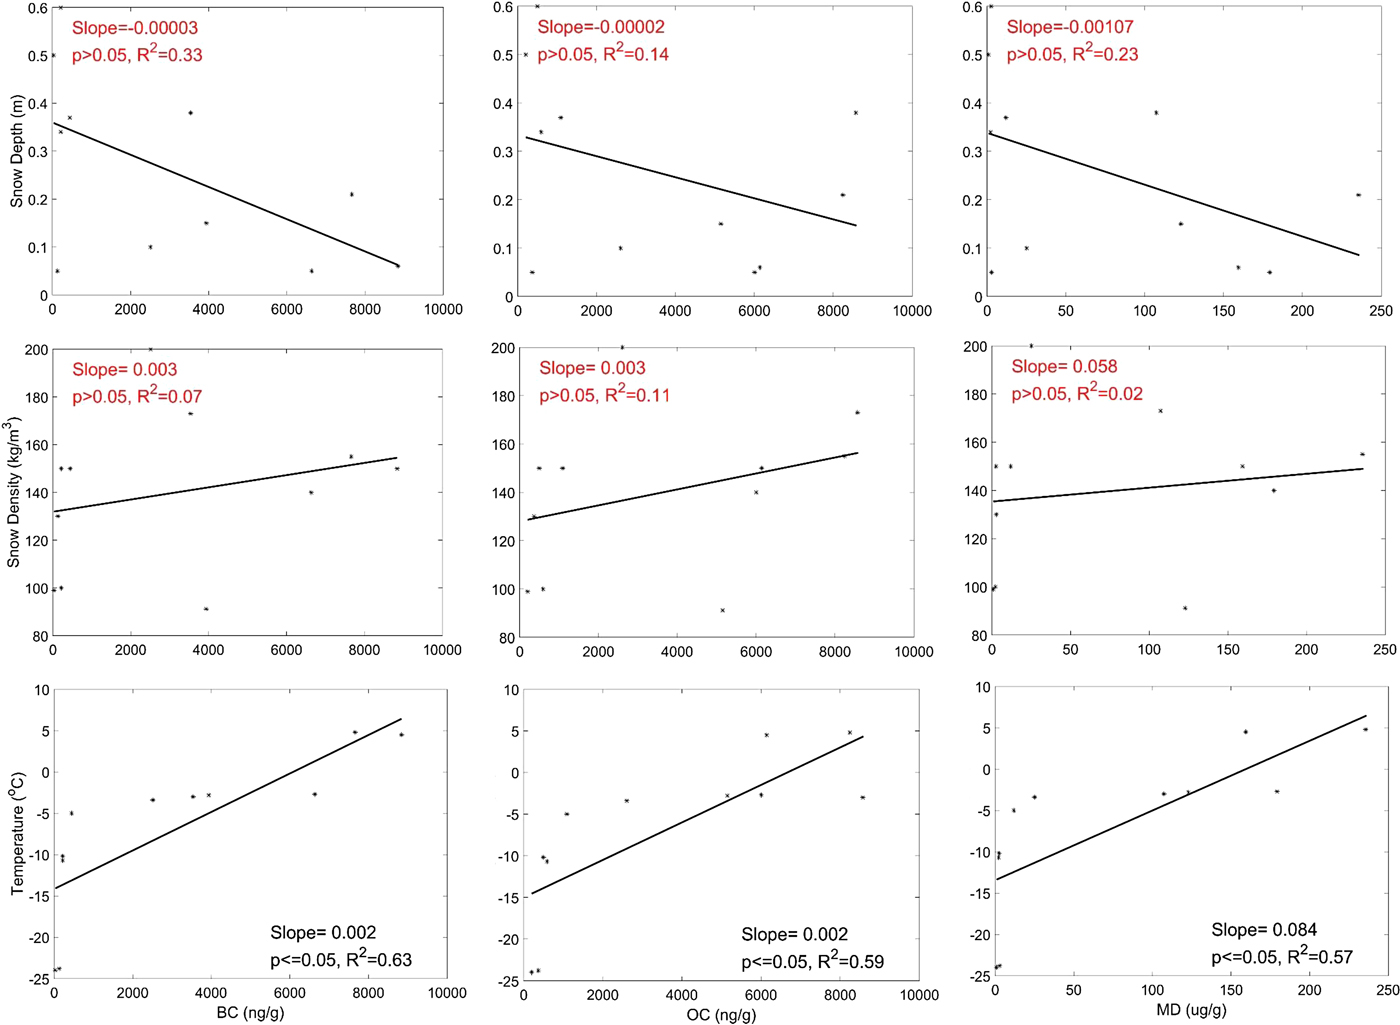
Distribution of LAI concentrations across NX indicated significant regional differences. Concentrations of BC, OC and MD ranged from 32 to 8841 ng g−1, 77 to 8568 ng g−1 and 0.46 to 236 µg g−1, respectively (Figs 2–6). Variations in LAI concentrations were even greater in the western areas (west of 83°E) of NX. Regions with the lowest concentrations of LAIs were located to the north of 48°N. There are two reasons to explain the difference in LAI concentrations. First, the western areas are close to cities with higher populations, industrial development and anthropogenic activities, thereby leading to higher depositions of LAIs. Second, the mean snow depth in the northern area was 0.33 m with a daily maximum temperature below 0°C. However, mean snow depth in the west was only 0.17 m, and daily maximum temperature in some regions exceeded 0°C during the same period. High temperature accelerated shallow snowmelting, and the snow meltwater was washed down through snow cover (even completely melted and the bare ground was exposed). Then LAIs remained on the snow surface because of their insolubility and large particles, or local soil was lifted which led to more deposited aerosols in snow (Bond and others, Reference Bond2013; Doherty and others, Reference Doherty2016). To explore the effects of snow and temperature on LAI concentrations, we conducted linear regression analysis of LAI concentrations with snow depth, snow density and daily maximum temperature at these sampling sites (Fig. 7). The concentrations of BC, OC and MD all showed a negative correlation with snow depth, but not statistically significant. It indicated that the thicker snow, the fewer LAI concentrations in snow. There were positive relationships between LAI concentrations and snow density and daily maximum temperature. Moreover, the correlation between LAI concentrations and temperature was statistically significant. It indicated that temperature may be a more important driving factor of LAI concentration in snow than snow depth and density in these areas. It also proved the second reason mentioned above. The increasing temperature accelerated snowmelting and promoted the increase in snow density. LAI concentration in snow increased with their influence.
Spatial distributions of light-absorbing impurities in snow cover for each sampling site across the Northern Xinjiang from January to February 2015. (a) BC (ng g−1), (b) OC (ng g−1), (c) MD (μg g−1), (d) the ratio of OC to BC (OC/BC).
Same as Figure 2 but for January 2016.

Same as Figure 2 but for November 2016.

Same as Figure 2 but for January 2017.

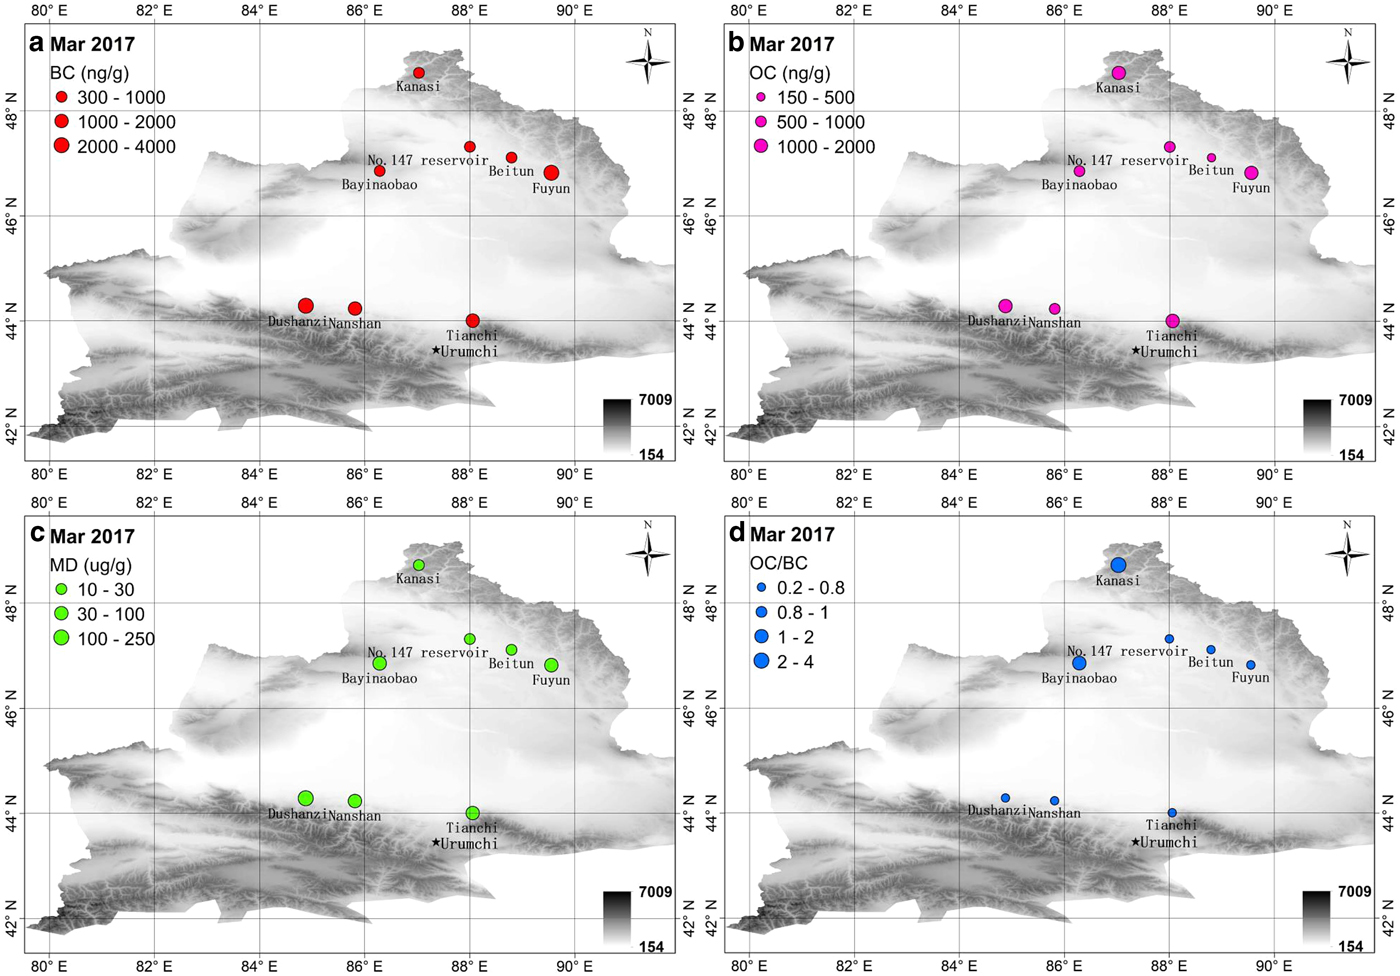
Same as Figure 2 but for March 2017.
Relationships between LAI concentrations and snow depth, snow density and daily maximum temperature in the western and northern areas across NX.
Compared with previous results in China, concentrations of LAIs across NX were lower than those on the TP and Northeast China (Wang and others, Reference Wang, Doherty and Huang2013; Zhang and others, Reference Zhang2018), but were barely higher than values in the Himalaya, Inner Mongolia and the border of Siberia in Northeast China (Wang and others, Reference Wang, Doherty and Huang2013; Lim and others, Reference Lim2014). However, we found that the standard deviations of BC average concentrations (795 ± 1657 ng g−1), OC (791 ± 1445 ng g−1) and MD (17.3 ± 38.1 µg g−1) were large. The high LAI concentrations in the west and the low values in the north were the main reason for the large standard deviations. This reflected a clear difference in sampling sites and indicated that there was a significant inhomogeneity and large spatial variability in LAI depositions across NX.
We selected ten sites to investigate the deposition processes of LAIs during the forming, stable and melt periods of snow cover. Concentrations of BC, OC and MD significantly decreased from November 2016 to January 2017 across the Altay Mountains (Figs 4–6). The decrease may be related to new snowfall during the sampling period in January 2017. The amount of LAIs in fresh snow is generally lower than that in aged snow with no wind or snowmelt (Zhang and others, Reference Zhang2017). Concentration values increased from January to March 2017 in this region, which might reflect LAI enrichments caused by snowmelt due to increasing temperature. In the north part of the Tianshan Mountains, the concentration of LAIs showed an increasing trend from November 2016 to March 2017, thereby suggesting a possible wind-induced snow redistribution and snowmelt resulting in the enrichment of LAIs.
The ratio of OC to BC (OC/BC) was calculated to indicate the possible emission source. A higher OC/BC ratio was considered to represent an emission source closely related to biomass burning, and a lower OC/BC ratio represented more fossil fuel emissions (Zhang and others, Reference Zhang2018). The OC/BC ratio in snow ranged from 0.22 to 6.41 across NX and decreased from north to south (Figs 2d–6d). Greater OC/BC ratios in the northern areas may be due to local biomass burning. In these regions, there was very little industrial production in winter. Emission sources mainly came from nearby human settlements, where residents burned straw (wood) for heating and cooking. The OC/BC ratios were <1 in the northern Tianshan Mountains, which might reflect a dominant source of fossil fuel burning. These sampling sites were near cities where industrial pollution was the main emission source. Similar results were also obtained by the positive matrix factorization model, which can provide attribution sources by identifying and quantifying priori sources (Pu and others, Reference Pu2017).
The OC/BC ratios represented decreasing trends at the sampling sites from January to March in 2017 across NX (Figs 5d, 6d). This might be attributed to the enrichment of BC and removal of OC (Niu and others, Reference Niu2017). Compared with BC, OC is expected to be more hydrophilic (Niu and others, Reference Niu2017). Therefore, more OC was washed out when snow melted in spring, which led to a decrease in the OC/BC ratio.
3.2. Potential sources and transport of BC
In order to determine the transport mechanism and potential source of LAIs in snow, the WRF-Chem model was applied to assess the source of BC in the atmosphere. The mean wind speed at 500 hPa in November 2016, and January and March 2017 was simulated by the WRF-Chem model over NX (Fig. S1). In November 2016 and March 2017, a strong westerly wind dominated this region. A northwesterly wind prevailed across the region in winter. The WRF-Chem model also simulated the monthly mean atmospheric BC concentration in different seasons in a 10 m wind field, which was calculated by averaging the BC concentrations of 0 and 1 layers in the near-surface atmosphere (Fig. 8). High concentrations occurred in urban areas in the northern Tianshan Mountains and the western part of NX. Due to the strong easterly winds, local BC cannot be transmitted northward with southerly winds in these regions, thus resulting in a significant increase in BC loads during winter. There was a low-concentration zone between the two high-value areas. The wind blew around to form a divergence airflow, which scattered BC throughout NX and maintained a low concentration of BC in this region. In general, the source of atmospheric BC was mainly derived from local emissions in NX. The spatial distribution and magnitude were similar to the BC concentration in snow. This indicated that most of the atmospheric BC may deposit directly on snow surface.
Monthly mean concentration of surface BC (μg m−3) simulated by WRF-Chem model with 10 m wind field across the Northern Xinjiang: November in 2016 (a), January in 2017 (b) and March in 2017 (c).

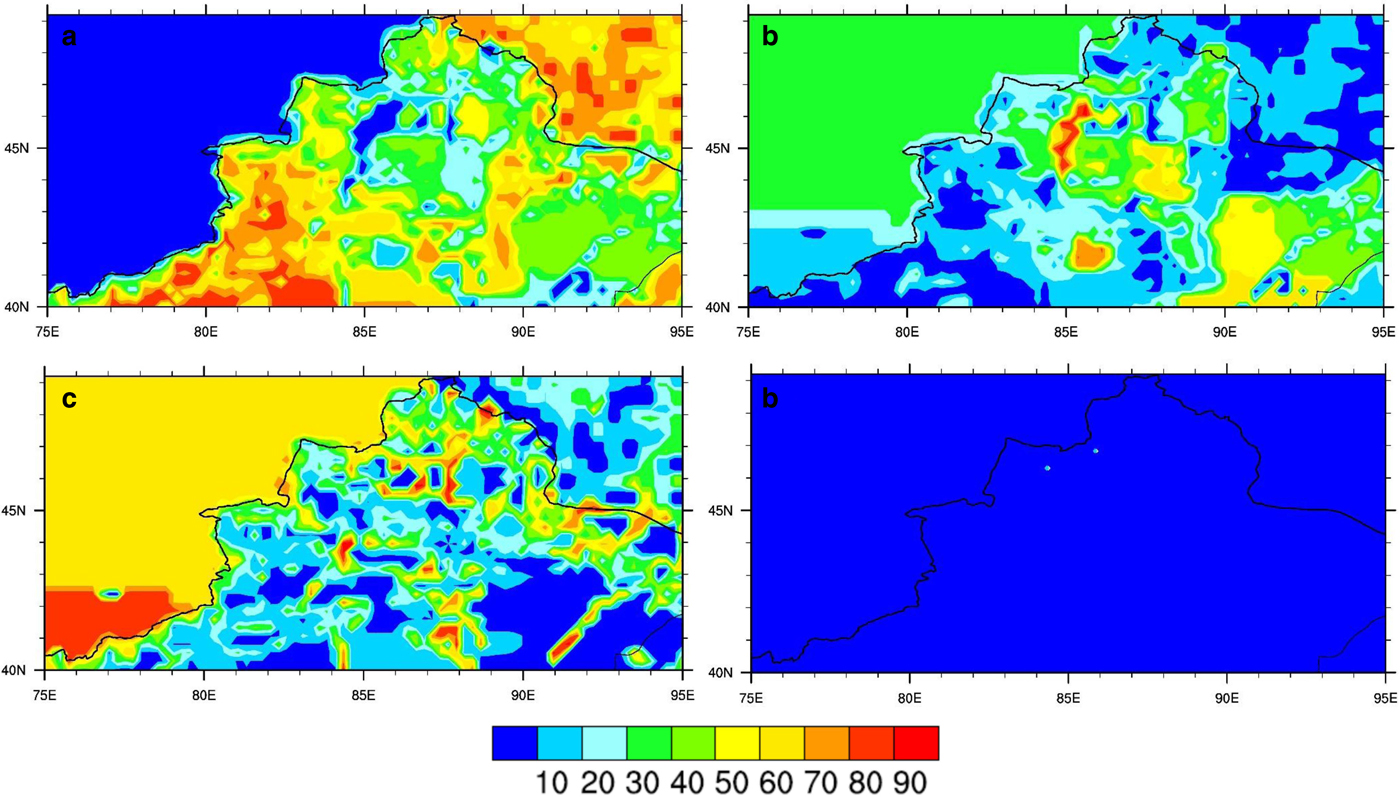
Figure 9 represents the spatial distribution of contributions from each emission source to the annual mean atmospheric BC concentration during the sampling period over the region, which may suggest the potential source of BC in snow. We used a two-way nested simulation in this study, in which multiple domains were running simultaneously and communicated with each other. The outer simulation domain covered our study area and its adjacent regions, while the inner domain only covered our study region. Then the contribution was calculated by the simulated results on gridscale. Residential emissions were the largest source of BC in NX. Higher BC depositions from residential sources appeared in the west part of NX, especially in populated areas such as Wenquan, Bole, Yining, Zhaosu and Yumin (located in Fig. 1); contribution ratios ranged from 53.2 to 85.4%. Industry was the second largest emission source of BC, which contributed more than 40% of BC to the northern slope of the Tianshan Mountains and Junggar Basin (e.g. sampling site of Heshituolegai, Kelamayi, Dushanzi, Nanshan and Tianshan). In addition, transportation was one of the main emission sources of BC across NX. However, its contribution to the BC concentration was regionally inconsistent. For sites (e.g. Bayinaobao, Aletai, Beitun, Fuhai and No. 147 reservoir) located at transportation hubs, the average contribution of transportation to the BC concentration in snow was higher (65.4%) than those in other samples, although total BC concentrations in these areas were lower (Figs 2a, 4a–6a). We also found that the BC concentration collected from Hemu village was mainly attributed to residential and transportation emission sources. These results are essentially consistent with previous suggestions by Yang and others (Reference Yang2019).
Contribution (%) of each emission source to the annual mean concentration of surface BC simulated by WRF-Chem model from residential (a), industry (b), transportation (c) and power (d) during the sampling period (January 2015–March 2017).
3.3. Impacts of LAIs on albedo reduction and RF
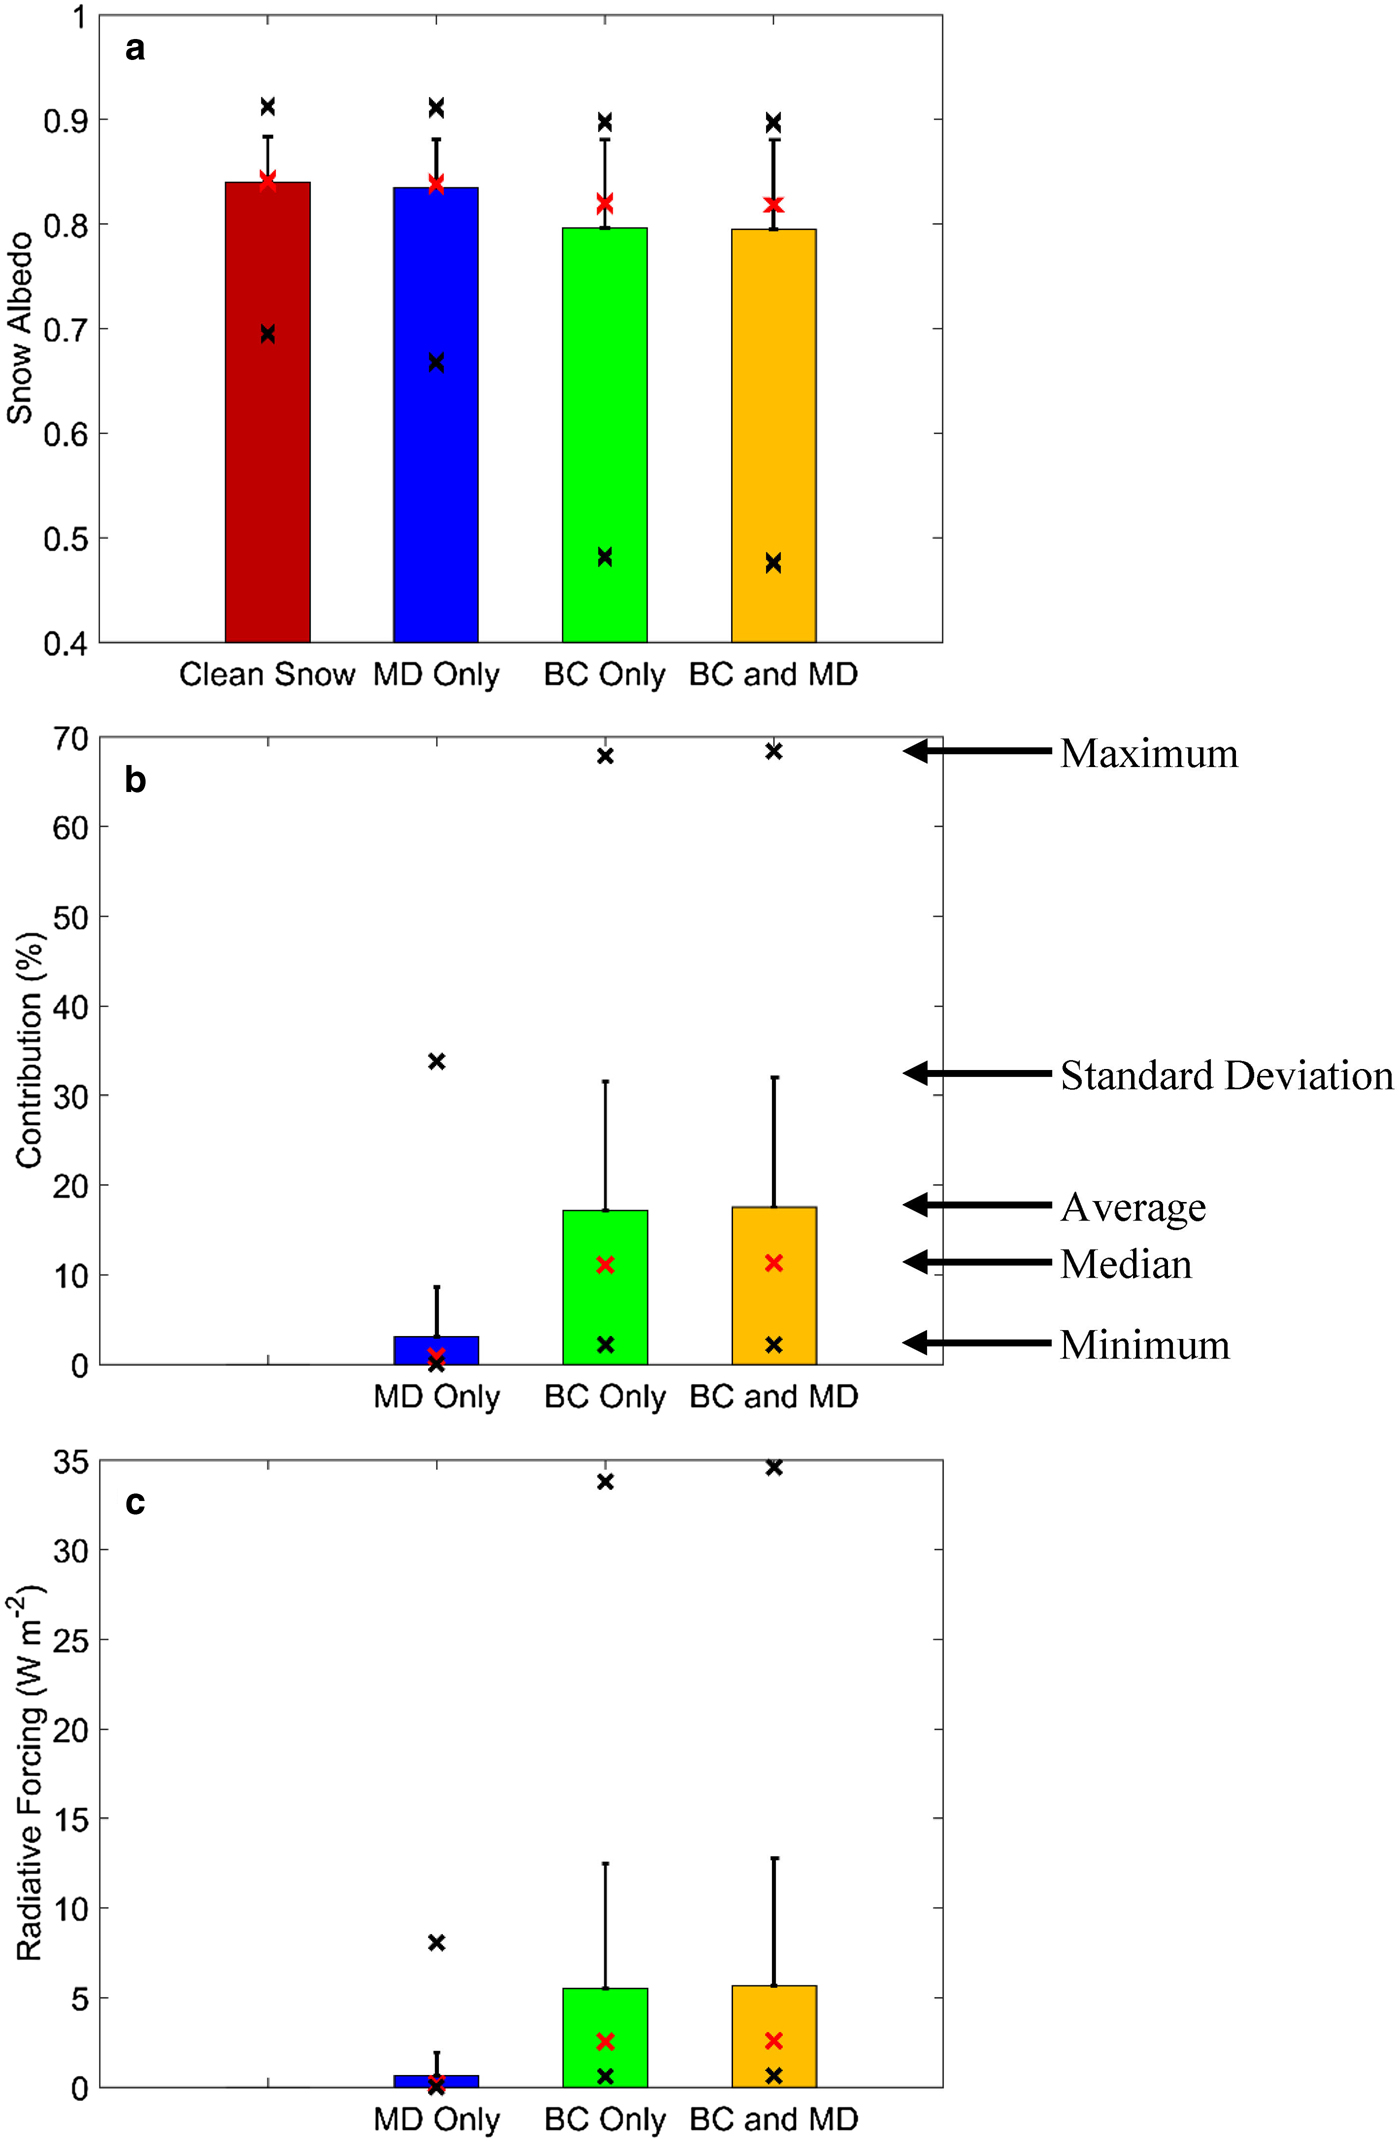
Simulated average snow albedo and RF caused by BC and/or MD for each snow sample are shown in Table 1. The average albedo of clean snow, and snow with MD, BC and BC and MD together were 0.8402 ± 0.0433, 0.8346 ± 0.0465, 0.7966 ± 0.0840 and 0.7954 ± 0.0852, respectively (Fig. 10). If BC or MD was present as the only impurity in snow cover, the average reductions in snow albedo of 0.0436 ± 0.0569 (17%) and 0.0056 ± 0.0111 (3%) occurred, respectively. If both BC and MD were present in snow cover, mean snow albedo decreased ~18%. The average RF caused only by MD was 0.66 ± 1.27 W m−2, and RF solely due to BC was 5.5 ± 6.96 W m−2. Meanwhile, the average RF induced by BC and MD together increased to 5.65 ± 7.12 W m−2. These results indicated that the effect of BC on albedo reduction in snow cover and the absorption of solar energy was greater than that of MD across NX. The lower impact of MD on albedo reduction may be mainly attributed to the low Fe content (Pu and others, Reference Pu2017) in MD, which led to the weakening of MD absorbance (Zhang and others, Reference Zhang2017).
Sensitivity analysis of simulated albedo (SA) and radiative forcing (RF) for BC and MD in snow cover with SNICAR model across the Northern Xinjiang

Column 1 is the code number of snow sampling, column 2 is the date of snow sampling, columns 3–5 are the site coordinate information, columns 6–9 are the SA of clean snow and snow with BC and/or MD, columns 10–12 are the contributions (%) of BC and/or MD to albedo reduction of snow cover, columns 13–15 are the RF caused by BC and/or MD in snow.
Average snow albedo of clean snow and snow with BC and/or MD (a), effects of BC and/or MD on albedo reduction of snow cover (b) and resulting daily mean radiative forcing (c). The solid rectangle denotes the average, the error bar represents one std dev., the upper black X represents the maximum value, the lower black X indicates the minimum value, and the red X denotes the median. MD Only means snow with only MD, BC Only means snow with only BC, BC and MD means snow with BC and MD.
Due to poor weather and instrument problems, snow albedo was not observed in situ during the sampling period. But the spectral albedo of snow was measured with a general-purpose spectroradiometer (Analytical Spectral Devices, FieldSpec 4, Inc., Boulder, United States) covering the wavelength ranging from 350 to 2500 nm in December 2017, November 2018 and January 2019, respectively. The result showed that the relative error between the observations and the simulations with the SNICAR model was −6.23 to 6.75% for the same wavelengths (Table 2). Other studies had similar results in other areas (Li and others, Reference Li2018; Zhang and others, Reference Zhang2018). This indicated that the results of the SNICAR model can well characterize the effect of LAIs on the snow albedo reduction.
Quantitative analysis of snow albedo in SNICAR model from 2017 through 2019 in NX

Measured albedo is snow albedo observation by ASD. SA clean snow represents the simulated snow albedo of clean snow. SA BC represents the simulated snow albedo of snow with BC. SA MD represents the simulated snow albedo of snow with MD. SA BC + MD represents the simulated snow albedo of snow with BC and MD.
Compared with the RF (0.5–6.5 W m−2) simulated by Flanner and others (Reference Flanner2009), RFs caused by BC and MD were greater in spring in our study (RF ranged from 0.72 to 29.5 W m−2). The reasons for the differences may be as follows: (1) Data source: Although both studies simulated RFs by the SNICAR model, the data sources of BC and MD concentrations as important parameters in the model were different. In our study, the data were derived from field collection. However, the data were linearly interpolated from a 5-year resolution historical inventory in the research of Flanner and others. (2) Period of data: Flanner and others investigated the surface RFs caused by BC and MD in snow spanning 22 years from 1979 to 2000, which were long-term mean values. While the present study covered only from 2015 through 2017. After several decades, the rapid development of local industry, transportation, residential life, etc., had a great influence on the increase of LAI concentrations. The more LAI contents led to increased simulated RFs. (3) RFs computed in the SNICAR model were instantaneous forcings (Flanner and others, Reference Flanner2009). These discrepancies may result from the simulated instantaneous results at different times. In addition, there were still uncertainties in estimating RF caused by LAIs through different simulation methods. The aerosol refractive index, shape, mixing state with other materials and aerosol size distribution all affected simulation results (Flanner and others, Reference Flanner, Liu, Zhou, Penner and Jiao2012; Zhao and others, Reference Zhao2014). In addition, the optical properties of BC and MD were mainly derived from the database rather than a specific observation area, which was one cause of simulation bias (Kaspari and others, Reference Kaspari, Painter, Gysel, Skiles and Schwikowski2014). Kaspari and others (Reference Kaspari, Painter, Gysel, Skiles and Schwikowski2014) also suggested that the proportion of dust from different source scales had not been constrained. Additionally, the contribution of dust from natural sources was still unclear compared to anthropogenic sources. These all resulted in uncertainties in estimations of RF caused by LAIs. By reviewing the distributions of RF caused by LAIs in snow from regional to global scales, Skiles and others (Reference Skiles, Flanner, Cook, Dumont and Painter2018) proposed that continuing and expanding local-scale observations, improving the spatial and/or temporal resolution of remote-sensing technology, and improving the representation of LAIs in climate models are beneficial in reducing the uncertainty in measuring RF caused by LAIs.
Due to lack of reliable OC optical properties in the SNICAR model, the effects of OC on albedo reduction and RF were not conducted in our study. However, Zhang and others (Reference Zhang2019) found that as a source of OC, dissolved organic carbon (DOC) played an important role in the absorption of solar energy during the melting period of snow across the Altai Mountains in China. In the future, we will further investigate the role of DOC in snow cover across NX.
3.4. Contributions of LAIs to the changes in SCD
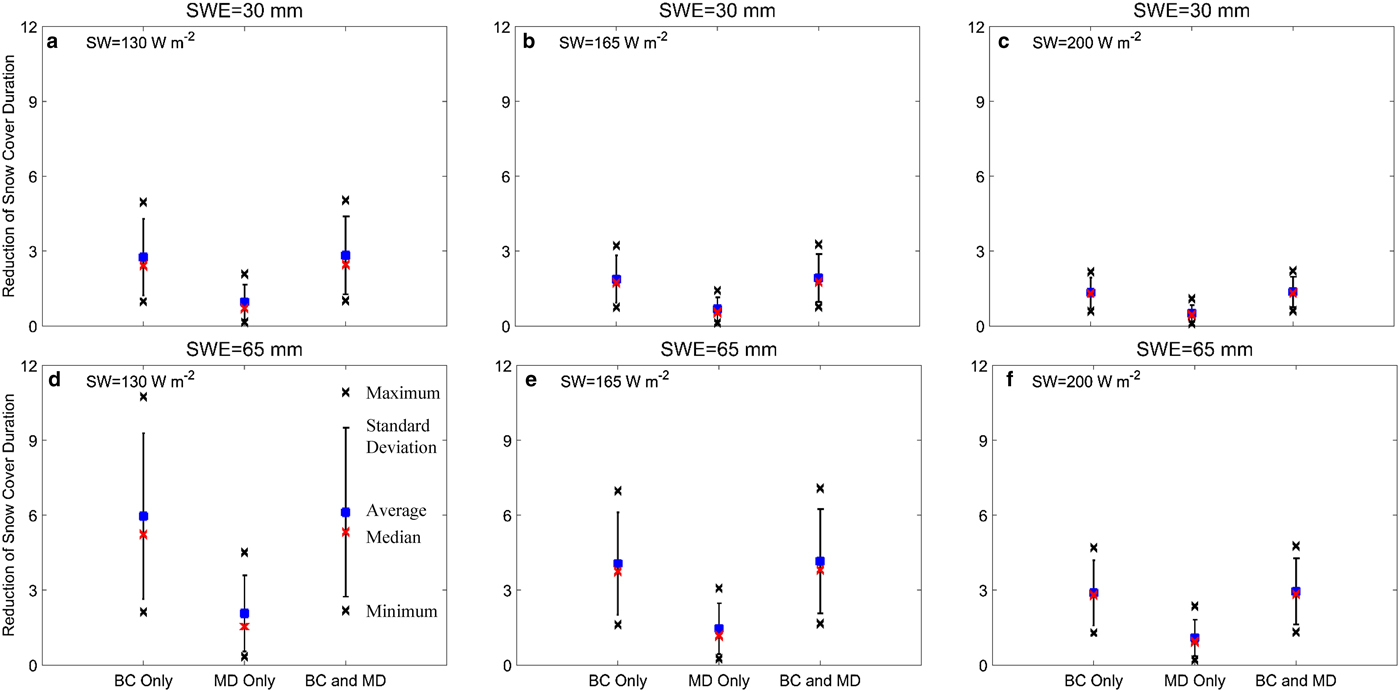
Using the model proposed by Schmale and others (Reference Schmale2017), variations in the SCD of snowmelt caused by BC and/or MD were simulated at low, medium and high scenarios across NX (Fig. 11 and Table 3). Meteorological and sampling data across NX were collected to determine the input parameters for the three scenarios (Table 3 and Table S2). Albedo reduction data for clean snow and aged snow with BC and/or MD, the snow grain effective radius and the snow density from eight sampling sites in spring were also used to calculate changes in SCD. Overall, the average reduction of SCD was most significant in the low scenario followed by the medium and high scenarios. When SWE was 30 mm, the reduction of SCD by BC and MD ranged from 1.36 ± 0.61 to 2.82 ± 1.56 d. The reduction value increased by twofold (from 2.95 ± 1.32 to 6.12 ± 3.38 d) when the SWE was 65 mm. All reductions in SCD attributed to MD were no more than 2 d. This indicated that the reduction of SCD related to LAIs was mainly attributed to BC. Among eight sampling sites, the greatest reduction of SCD by BC and MD was ~11 d in the low scenario with an SWE of 65 mm. Moreover, the minimum (0.6 d) appeared in the high scenario when the SWE was 30 mm. These results implied that SWE played an important role in the variation in SCD of snowmelt caused by LAIs. Compared with low shortwave radiation, an increase in shortwave radiation resulted in the shorter SCD of snowmelt under the same snow accumulation in both clean snow and snow with BC and/or MD (Tables S3 and S4). However, compared with clean snow, the reduction rate of SCD of snowmelt with LAIs was more significant in the low shortwave radiative scenario (Tables S3 and S4). There was a decreasing spatial trend in the reduction of SCD from south to north. Low concentrations of BC and MD in snow in the northern region led to the difference in distribution. Second, low air temperatures resulted in a slow melting duration of the same snow accumulation in the northern area.
Reduction of snow cover duration by BC and MD due to changes in snow albedo at different snow water equivalent (SWE is 30 and 65 mm, respectively) for low, medium and high scenarios. Daily shortwave radiation is 130 W m−2 in low scenario (a and d), 165 W m−2 in medium scenario (b and e) and 200 W m−2 in high scenario (c and f). The blue solid square denotes the average, the error bar represents one std dev., the upper black X represents the maximum value, the lower black X indicates the minimum value and the red X denotes the median. BC Only means snow with only BC, MD Only means snow with only MD, BC and MD means snow with BC and MD.
Average reduction of snow cover duration by BC and MD for different SWE and shortwave radiation

Although we had quantitatively evaluated the effects of LAIs on snowmelt in NX for the first time, there were still some limitations in the model. The model only used two meteorological elements of temperature and SW as the input parameters. However, wind speed, precipitation and evapotranspiration also have important influences on snowmelt which were not considered. We did not consider the latent heat flux at the interface of snow and land. The change in soil temperature also affects the snowmelt in spring. The distribution pattern of snow cover is strongly impacted by topography and vegetation. These two factors should also be considered for future application in the model simulation. Snow albedo reduction is a necessary parameter in this model. We used the simulated results from SNICAR model to calculate. Therefore, the effect of OC on snow albedo reduction was not conducted in our model. It is not yet possible to estimate the effect of OC on snowmelt. All of these limitations should be considered in future model improvement.
Based on observations and simulations, previous studies have suggested that LAIs deposited in snow can accelerate snowmelt and shorten SCD by reducing the snow albedo (Warren and Wiscombe, Reference Warren and Wiscombe1980; Hansen and Nazarenko, Reference Hansen and Nazarenko2004; Flanner and others, Reference Flanner, Zender, Randerson and Rasch2007; Bond and others, Reference Bond2013; Ménégoz and others, Reference Ménégoz2014; Ji, Reference Ji2016). NX is the main snow cover area in China, and snowmelt is an important source of local fresh water. Earlier end dates of snow cover and a shortening SCD have been confirmed in this region (Huang and others, Reference Huang2016; Ke and others, Reference Ke2016), which have great importance to ecological issues. In some areas, spring snowmelt floods have threatened the safety of local people and regional socio-economic development (Ablikim and others, Reference Ablikim, Chen, Abdula and Whap2015). In addition to the increasing air temperature, LAIs in snow may also be an important cause of the changes in snow cover. Therefore, future work must quantify the contribution of snowmelt caused by LAIs to watershed runoff during the ablation period in a specific basin in NX.
4. Conclusions
In this study, surface snow samples collected from 106 sites were used to investigate spatial variations in LAIs across NX from 2015 to 2017. Our results demonstrated that greater LAI concentrations were observed in the western areas of NX, and lower values were measured in the northern regions (e.g. Altai Mountains). Temperature was the main factor affecting LAI concentration in snow. LAI concentrations from ten sampling sites increased from January to March in 2017, which displayed an enrichment process of LAIs. The OC/BC ratio in snow ranged from 0.22 to 6.41 and decreased from north to south, thereby indicating the primary spatial emission contributions of biomass burning and fossil fuel burning. The WRF-Chem model simulated that the source of BC was mainly derived from local emissions across NX, in which residential areas comprised the largest BC emission source followed by industry and transportation. The SNICAR model simulation showed that BC had a greater impact on both the albedo reduction of snow cover and RF than MD. The average albedo reduction caused by BC and MD together was 17.53%, and the corresponding RF was 5.65 ± 7.12 W m−2. A reduction of SCD related to LAIs was mainly attributed to BC in low, medium and high scenarios. The average reduction of SCD caused by BC ranged from 1 d to nearly a week, while maximum reduction due to MD was only 2 d. There was a decreasing trend in the spatial distribution of the reduction of SCD by LAIs from south to north.
Supplementary material
The supplementary material for this article can be found at https://doi.org/10.1017/jog.2019.69
Acknowledgements
This work was funded by the National Natural Science Foundation of China (41701064, 41630754, 41801048, 41971083), Chinese Academy of Sciences (XDA20040501, QYZDJ-SSW-DQC039) and State Key Laboratory of Cryospheric Science (SKLCS-ZZ-2018). We thank the anonymous reviewers for their very insightful and constructive comments and suggestions.


 Open access