


1. Introduction
The Niagara Escarpment, an imposing geological feature that runs through the northeastern United States and southern Ontario, has long captured the attention of researchers in the fields of stratigraphy, geomorphology and engineering geology (Figure 1; Hewitt, Reference Hewitt1971; Moss & Milne, Reference Moss and Milne1998; Shepley & Worthington, Reference Shepley and Worthington2024). The exposure of numerous distinct Palaeozoic sedimentary formations along its length, including units of dolostone, limestone, shale and sandstone, each with unique characteristics, has resulted in extensive research on this unique landform (Figure 2; Armstrong & Dodge, Reference Armstrong and Dodge2007; Brunton & Brintnell, Reference Brunton and Brintnell2020). However, a significant data gap remains concerning geohazards associated with the escarpment face. The Niagara Escarpment bisects the city of Hamilton, Ontario, and is subject to extensive erosion due to processes such as block failure and rock falls (Figure 3; Mellies, Telesnicki & Sandoval, Reference Mellies, Telesnicki and Sandoval2016; Formenti et al. Reference Formenti, Peace, Eyles, Lee and Waldron2022). These geological hazards threaten human safety and jeopardize urban infrastructure (Formenti et al. Reference Formenti, Peace, Eyles, Lee and Waldron2022).
Simplified bedrock geology of southern Ontario showing features relevant to the current study. Study location in Hamilton (black star) is shown together with significant geological features such as the Niagara Escarpment, the Algonquin Arch, the Appalachian Basin and the Michigan Basin (Adapted from Al et al. Reference Al, Clark, Kennell, Jensen and Raven2015).

Geological formations exposed along the Niagara Escarpment in the Hamilton region, Ontario, highlighting the dominant lithologies present in the area (adapted from Formenti et al. (Reference Formenti, Peace, Eyles, Lee and Waldron2022). The present study focuses on the Irondequoit Formation, the Gasport Formation and the Ancaster Member of the Goat Island Formation, which were subjected to testing.

North-facing dolostone outcrop of the Gasport Formation at the Bruce Trail site (Site B) (43°14′38.9″N 79°53′12.3″W) showing recent loss of material through rockfall.

Early mitigation efforts by the Niagara Parks Commission in 1959, such as blasting overhangs, reduced, but did not eliminate these geohazards (Kelly & Larson, Reference Kelly and Larson2007). Previous work on slope stability and erosion highlights the need for more accurate assessments (Kelly and Larson, Reference Kelly and Larson2007; Moss & Nickling, Reference Moss and Nickling1980). In Hamilton, instability of the escarpment face has gained public attention due to infrastructure damage and road closures (Van Dongen, Reference Van Dongen2017). As a result, research was initiated on weathering, erosion and fracture patterns in response to the need for a more comprehensive understanding of factors and processes affecting geohazards along the escarpment (Formenti et al. Reference Formenti, Peace, Eyles, Lee and Waldron2022; Gage et al. Reference Gage, Eyles and Peace2022; Gauthier et al. Reference Gauthier, Wood, Hutchinson and Senior2015; Hayakawa and Matsukura, Reference Hayakawa and Matsukura2010; Maloney et al. Reference Maloney, Peace, Hansen, Hum, Nielsen, Pearson, Ramharrack-Maharaj, Schwarz, Papangelakis and Eyles2023; Mellies et al. Reference Mellies, Telesnicki and Sandoval2016). Detailed, location-specific investigations proved critical for enhancing understanding of these geohazards and included assessment of hazard potential via models, rating systems and systematic fracture surveys (Formenti et al. Reference Formenti, Peace, Eyles, Lee and Waldron2022; Gauthier et al. Reference Gauthier, Wood, Hutchinson and Senior2015; Mellies et al. Reference Mellies, Telesnicki and Sandoval2016). However, despite these studies, there is still a lack of knowledge regarding the physical properties, such as rock strength, of the lithological units exposed along the escarpment. These properties are extremely important when evaluating geohazard potential (Smart et al. Reference Smart, Ferrill, McKeighan and Chester2023), as previous research has primarily relied on observational assessments, such as visual inspections of surface features and the quantification of surface fractures (Formenti et al. Reference Formenti, Peace, Eyles, Lee and Waldron2022; Gauthier et al. Reference Gauthier, Wood, Hutchinson and Senior2015). Combining these observational assessments with quantitative measurements of physical properties, such as those obtained using the Schmidt hammer (SH), is essential for a comprehensive understanding of future geohazard potential (Porter et al. Reference Porter, Lato, Quinn and Whittall2019; Rafiei Renani et al. Reference Rafiei Renani, Martin, Varona and Lorig2019).
Traditional methods of determining rock strength commonly involve laboratory testing and are often not feasible due to their destructive or time-consuming nature and associated expense (Malkawi et al. Reference Malkawi, Rabab’ah, Sharo, Aldeeky, Al-Souliman and Saleh2023). As such, new techniques to obtain the mechanical properties of rocks using non-destructive, cost-effective field and in-situ methods have emerged (Karantanellis et al. Reference Karantanellis, Clark, Zekkos, Hughes, Gong, Kaseem and Blunts2022). Among these methods is the use of the SH, a non-destructive tool that has been adopted in geotechnical and geomorphological studies (Aydin, Reference Aydin and Ulusay2014; Goudie, Reference Goudie2006; Niedzielski et al. Reference Niedzielski, Migoń and Placek2009; Selby, Reference Selby1982; Viles et al. Reference Viles, Goudie, Grab and Lalley2011). The SH measures rebound hardness to estimate Uniaxial compressive strength (UCS) and elastic modulus in both laboratory and field conditions (Aydin, Reference Aydin and Ulusay2014; Daoud et al. Reference Daoud, Alshkane and Rashed2018). The SH impacts the rock surface, causing plastic deformation and the rebound distance measured by the tool indicates hardness on a 10–100 scale (Figure 4; Viles et al. Reference Viles, Goudie, Grab and Lalley2011). The SH can provide insight into weathering, the presence of discontinuities and rock strength, aiding geological research and rock classification (Duszyński et al. Reference Duszyński, Ford, Goudie and Migoń2022; Goudie, Reference Goudie2006; Přikryl & Snížek, Reference Přikryl and Snížek2023). In this work, we define weathering following Reference PricePrice (1995), who states, ‘Weathering is the irreversible response of soil and rock materials and masses to their natural or artificial exposure to the near surface geomorphological or engineering environment’ and is reflected in reduced rock strength and SH values.
Operation of the Schmidt Hammer: (A) The device is ready for testing in the initial position, perpendicular to the test surface. (B) The instrument is pressed against the test surface, compressing the spring. (C) The latch releases the hammer, allowing it to impact the surface. (D) Upon impact, the hammer rebounds, moving the indicator, and the indicator measures the rebound distance, resulting in a Schmidt hammer value from 10–100.

Despite the recognized utility of non-destructive tools such as the SH, its suitability for characterizing rock masses and stability along the Niagara Escarpment has received little attention. This study aims to provide valuable insights into the physical characteristics of lithological units exposed at selected locations along the Niagara Escarpment from SH values, which can be used to inform hazard mitigation strategies.
1.a. Geologic setting
Palaeozoic sedimentary rocks exposed in southern Ontario span from the Upper Cambrian to the Upper Devonian, and rest on the southern margin of the Canadian Shield (Brunton & Brintnell, Reference Brunton and Brintnell2020). The area is underlain by a crystalline basement composed of metamorphic rocks of the Proterozoic Grenville Province (Haeri-Ardakani et al. Reference Haeri-Ardakani, Al-Aasm and Coniglio2013). Precambrian and Palaeozoic tectonic events, including the formation of the Midcontinent Rift around 1.1 Ga and subsequent crustal deformation from the Cambrian through the Pennsylvanian periods, played critical roles in the development of the Michigan and Appalachian basins, the Algonquin Arch and unconformably positioned Palaeozoic sediments (Klein & Hsui, Reference Klein and Hsui1987). Now preserved as a series of near-horizontal strata, Palaeozoic sediment accumulation was most pronounced in the deeper parts of the Michigan and Appalachian basins, with minimal deposition above the Algonquin Arch (Haeri-Ardakani et al. Reference Haeri-Ardakani, Al-Aasm and Coniglio2013). South of Lake Ontario, the Niagara Escarpment follows the rim of the Appalachian Basin, while north of Lake Ontario, it traces the rim of the Michigan Basin (Figure 1; Tovell, Reference Tovell1992). These geological features have fundamentally shaped the Hamilton region (Figure 1), influencing the landscape and its associated geologic hazards (Barlow, Reference Barlow2002).
1.b. Niagara escarpment stratigraphy
The Niagara Escarpment, extending over 725 kilometres through southern Ontario and the Northeastern United States, manifests as a significant erosional feature (Formenti et al. Reference Formenti, Peace, Eyles, Lee and Waldron2022). In Hamilton, the top of the escarpment stands 190 metres above sea level on average. Glacial activity and differential erosion during the Cenozoic were critical factors in its development, and the escarpment now exposes a stratigraphy comprising shale, sandstone and carbonate-rich lithologies of Ordovician and Silurian age (Figure 2). Environmental conditions prevalent during these epochs facilitated the accumulation of both bioclastic and fine-grained carbonates (Armstrong & Dodge, Reference Armstrong and Dodge2007). Diagenetic processes subsequently transformed the carbonate accumulations into dolostone (Armstrong & Dodge, Reference Armstrong and Dodge2007).
Differential weathering and erosion have significantly shaped the escarpment face, particularly impacting the less durable Queenston and Rochester formations, which consist predominantly of shale (Figure 2). These processes lead to the undercutting of the overlying, more resistant, dolomitic lithologies found in the Irondequoit Formation and Lockport Group (Figure 2). As a result, pronounced overhangs form, which, being unsupported, are susceptible to failure (Figure 3). This stratigraphic relationship highlights the inherent instability of the escarpment face (Hewitt, Reference Hewitt1971; Moss & Milne, Reference Moss and Milne1998).
The Reynales Formation, consisting of fine-grained dolostone with interspersed shale interbeds, displays a gradational upward increase in shale content (Hewitt, Reference Hewitt1971; Moss & Milne, Reference Moss and Milne1998). Above the Reynales is the Irondequoit Formation, a homogeneous, fossiliferous and bioturbated dolostone layer. This is followed by the Rochester Formation, composed of grey, laminated shale with sporadic dolostone and limestone interbeds (Figure 2).
The Lockport Group forms the caprock of the Niagara Escarpment in the Hamilton region and is well exposed around the city. This group encompasses the Gasport Formation, consisting of fossiliferous dolostone with chert nodules and interspersed shale layers, and the Ancaster Member of the Goat Island Formation characterized by irregularly bedded, chert-rich dolostone (Ellis, Reference Ellis2022). The stratigraphic position of the Ancaster Member and its fractured nature are of particular significance, as they directly impact the erosional dynamics and the overall stability of the escarpment caprock (Cox & Larson, Reference Cox and Larson1993).
2. Methodology
2.a. Field data collection criteria
The study sites along the Niagara Escarpment were selected to complement existing data on fracture characteristics (Formenti et al. Reference Formenti, Peace, Eyles, Lee and Waldron2022) and to provide a more comprehensive understanding of the geological characteristics of lithological units exposed along the escarpment in the Hamilton area. The criteria established for site selection included minimum dimensions (2.5 m) for the length and height of the outcrop, safe accessibility for researchers, and access to specific geological formations as determined from available field notes (Formenti et al. Reference Formenti, Peace, Eyles, Lee and Waldron2022). Water presence in or on the rock face disqualified the area from the study due to the impact of moisture on SH values (Aydin, Reference Aydin and Ulusay2014). These selection criteria allowed the following sites to be identified: the Bruce Trail (Site B), the Chedoke Radial Trail (Site CR), Jolley Cut (Site JC) and the Sydenham Cut (Site SC; Figures 5 and 6).
Study site locations along the Niagara Escarpment in the Hamilton region. The regional geological context for this figure is shown in Figure 1.

Geographical representation of the scanline surveys conducted at various study sites along the Niagara Escarpment in Hamilton, Ontario. The maps display the scanline surveys’ location, surface water and inferred watercourse.

This study focused on the upper formations (Figure 2) of the Niagara Escarpment exposed at all four of the selected sites (Figure 5). Specifically, the Ancaster Member of the Goat Island Formation, the Gasport Formation and the Irondequoit Formation were chosen due to their wide exposure around the entire city, making rockfall events from these formations of particular interest for local geohazards (Formenti et al. Reference Formenti, Peace, Eyles, Lee and Waldron2022). The Reynales and Rochester formations were not included as they did not fulfil the minimum requirements due to exposure, accessibility and the presence of water/moisture (Niedzielski et al. Reference Niedzielski, Migoń and Placek2009).
In this study, the term ‘geological unit’ refers to distinct rock sections sampled within the larger formations, such as the Gasport Formation. A geological unit, in this context, represents specific rock masses that exhibit unique mechanical properties, lithological characteristics or other traits. When referring to the broader, mappable stratigraphic layers like the Gasport Formation or Irondequoit Formation, the term ‘formation’ is used to describe these larger rock layers.
In the Hamilton area, many of the Niagara Escarpment exposures have been modified for various anthropogenic reasons such as road and railway cuttings, and rock face stability improvement. However, no detailed records exist of the history of such modifications to specific locations. As such, we note that this aspect remains unconstrained, could impact rock strength values, and should form a focus for further study.
2.b. Study site locations
This study utilized the following sites: the Bruce Trail (Site B), the Chedoke Radial Trail (Site CR), Jolley Cut (Site JC) and the Sydenham Cut (Site SC; Figures 5 and 6). Scanline surveys were conducted on the Ancaster Member and Gasport and Irondequoit formations to assess their mechanical characteristics using the SH (Figure 7).
Data collection along scanline surveys. (A) Scanline survey of the Gasport Formation along part of the Chedoke Radial Trail (Site CR). (B) Scanline survey of the Ancaster Member at the Sydenham Cut (Site SC). (C) Scanline survey marker of the Gasport Formation at the Bruce Trail site (Site B), where the rock strata are differentially eroding in a forested area. (D) The Jolley Cut site (Site JC) with a researcher conducting SH testing on the Gasport. See Figures 5 and 6 for site locations.

Site B is located along a segment of the Bruce Trail near Queen Street in a forested location (Figure 6) with a northern orientation. This location showcases exposed rock from the Ancaster Member and Gasport and Irondequoit formations, characterized by thin to thickly bedded fossiliferous dolostone (Figure 7). Notably, there was evidence of recent rock falls near Ancaster and Gasport formation exposures (Figures 3 and 7).
Site CR is located along the Chedoke Radial Trail and comprises north-facing exposures of the Ancaster, Gasport, Rochester, Irondequoit and Reynales formations (Figures 5 and 6). This site receives significant sunlight and wind exposure, particularly to the upper formations (Ancaster and Gasport), while the lower formations are more vegetated and sheltered (Figure 7). The Ancaster Member was notable for its abundance of weak chert nodules, which frequently failed under the impact of SH testing. At this site, the Rochester Formation consists predominantly of laminated dark grey shale with interbedded dolostone and occasional sandstone beds and shows evidence of water seepage on the outcrop face, likely due to the proximity of the site to Chedoke Creek (Figure 6).
The escarpment face at site JC is oriented primarily to the west, nestled within brush and shrubby vegetation near the Jolley Cut, with some tree cover (Figures 5, 6 and 7). The site exposes the Ancaster, Gasport, Rochester, Irondequoit and Reynales formations. Within the Gasport Formation are beds that increase in thickness up section. Formation boundaries showed variations of up to 0.5 metres vertically across the site. Site JC exhibited water outflow from the Rochester Formation (Figure 6).
Site SC faces southeast, is located adjacent to Sydenham Lookout and shows significant signs of erosion (Figure 5). Site SC, positioned on the opposite side of the valley to the other study sites, is the most easterly and northerly site. Soil and eroded rock fragments were prevalent at the crest of the escarpment, with loose rock scattered at the base of the rock face (Figure 7). Vegetation was mainly confined to the upper regions of the rock face, with dusty conditions below that impeded visibility of the rock surface. This site exposes the Ancaster Member and Gasport Formation, as well as the upper part of the Rochester Formation.
2.c. Scanline survey methodology
Data collection occurred through field surveys using the scanline method (Torabi et al. Reference Torabi, Alaei and Ellingsen2018). Scanline surveys measure and describe discontinuities along a defined horizon on the rock surface, thereby allowing systematic, unbiased assessments of rock-mass quality (Chaminé et al. Reference Chaminé, Afonso, Ramos and Pinheiro2014). Using the scanline method, a horizontal line was drawn on the exposed rock surface with a tape measure across a single geological unit, ideally as far from the upper and lower boundaries of the unit as possible to mitigate transitional qualities affecting measured values (Viles et al. Reference Viles, Goudie, Grab and Lalley2011). The scanline surveys were each 10 m in length, with some exceptions due to accessibility constraints. Several properties were documented along the scanline, including estimates of surface weathering, fracture continuity, outflow of groundwater and intact rock strength determined from SH values. These properties were evaluated according to the rock mass strength scales detailed in Selby (Reference Selby1982), which provide a structured approach to estimating fracture continuity and gauging the extent of weathering on an outcrop.
Each scanline was positioned across a single geological unit. In units with thin bedding (e.g. the Ancaster Member), the transect intersected multiple beds, but sampling was conducted laterally to capture within-unit variability rather than vertical variation across units. Fracture continuity was recorded as the proportion of scanline length intersected by individual fractures, which represented their lateral persistence along the outcrop face. Weathering was estimated visually using Selby’s (Reference Selby1982) rock mass strength classification.
Although our primary focus was on the analysis of SH rebound measurements, we note that mechanical stratigraphy, including bed thickness, lithological composition and nature of bedding interfaces, is expected to exert a strong influence on rock strength. While these parameters were not measured systematically, they were observed qualitatively during fieldwork and are considered in the discussion of results.
2.d. Schmidt hammer guidelines
Utilizing the SH in rock testing to determine intact rock strength demands rigorous adherence to specific procedures, as per the guidelines set by the International Society for Rock Mechanics (Bamford et al. Reference Bamford, Van Duyse, Nieble, Rummel, Broch, Franklin, Atkinson, Tarkoy and Deere1978), to ensure the accuracy of results.
For a comprehensive analysis, the ISRM (International Society for Rock Mechanics and Rock Engineering) recommends a sample size of 20 rebound values from single impacts (Aydin, Reference Aydin and Ulusay2014). Previous work suggests a variety of ideal sample sizes of between 10 and 30 (Hansen et al. Reference Hansen, Meiklejohn, Nel, Loubser and Van Der Merwe2013). Spacing of each sample measurement, at least the diameter of the SH plunger, is essential to prevent interference from potential cracking and compression of the rock from the plunger impact (Aydin, Reference Aydin and Ulusay2014). Uniform distribution of data points across the outcrop section helps minimize bias, reduce sampling errors and ensure a representative analysis of rock mass characteristics (Poblet et al. Reference Poblet, Bulnes and Uzkeda2022). In this study, the SH was always positioned perpendicular to the testing surface to prevent skewed rebound values (Shobe et al. Reference Shobe, Hancock, Eppes and Small2017). Measurements that exhibited signs of crushing or penetration at the impact point were considered invalid, necessitating the selection of an alternative measurement location to maintain data integrity.
In adherence with these guidelines, the SH readings in the present study were systematically collected as scanline surveys (Figures 6 and 7), with data recorded every 0.25 m along the 10 m transect. This approach typically yielded approximately 41 individual readings per survey, exceeding the minimum required for reliable and accurate results. A single operator took all readings to reduce the operator bias (Viles et al. Reference Viles, Goudie, Grab and Lalley2011).
Aydin & Basu (Reference Aydin and Basu2005) highlighted the necessity of a fracture-free zone up to 6 cm deep to attain valid compressive strength measurements. However, subsurface fracturing and subsequent stress release, typically resulting from weathering, were deemed an integral part of the strength characteristics of the lithological units measured with the SH. Hence, sampling locations were only adjusted if the predetermined sampling location coincided with a significant fracture (>5 mm in width), with measurements being taken 15 cm to the right to ensure the integrity of the data collected (Aydin, Reference Aydin and Ulusay2014). No alterations were made when fractures were visible on the rock face or in close proximity to the testing site.
Lichen growth on the rock surface can also introduce error into SH measurements (Shobe et al. Reference Shobe, Hancock, Eppes and Small2017). Consequently, all rock surfaces in this study were required to be smooth and lichen-free. A carborundum stone was gently rubbed against the rock face to eliminate vegetation without removing surficial weathered rock (Tomkins et al. Reference Tomkins, Dortch, Hughes, Huck, Stimson, Delmas, Calvet and Pallàs2018). The complete removal of the surficial layer of organic or weathered material is often considered essential for accurately determining the strength parameters of a rock (Gupta et al. Reference Gupta, Sharma and Sah2009), but may yield higher values that overlook the effects of weathering processes (Matthews & Winkler, Reference Matthews and Winkler2022). In the present study, the weathered surface is considered an integral component for assessing strength parameters, particularly in slope stability analysis. Hence, only the surface layer of vegetation (lichen) was removed from the rock face.
The presence of water on or in the rock face was assessed through visual inspection and tactile examination. If any moisture was detected, the scanline survey was deemed invalid to ensure the accuracy of the SH readings. No data collection occurred within 24 hours of any precipitation event, allowing sufficient time for the rock to dry, to minimize the impact of residual moisture.
Although weathered surfaces can provide insight into near-surface geomorphological processes, SH measurements characterize only the outer few millimetres of the rock surface. As such, they do not capture deeper structural controls on slope stability, including fracture sets, bedding architecture or persistent discontinuities, which commonly exert a first-order influence on block detachment and failure susceptibility. Consequently, SH data should be interpreted as indicators of relative surface hardness and weathering state rather than direct measures of bulk rock mass behaviour.
2.e. Statistical analysis and data preparation
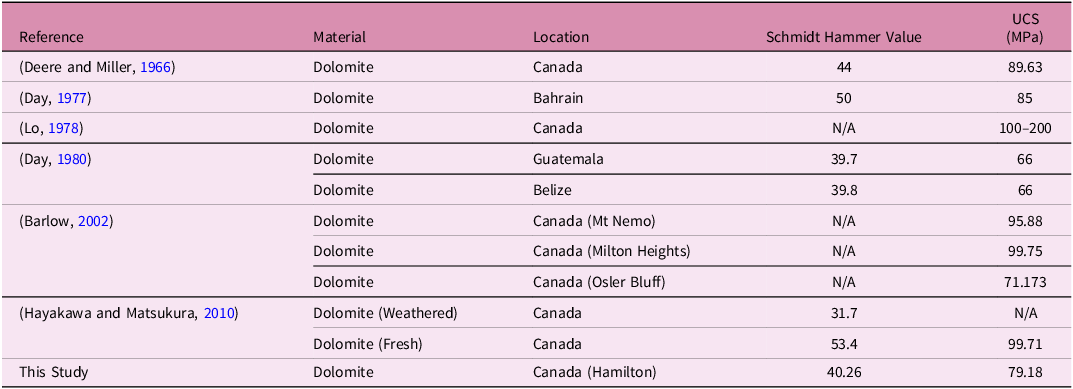
SH values from field-collected data were aggregated to generate overall statistics, including minimum, maximum, mean, median and quartile values. The standard methodologies proposed by the American Society for Testing and Materials typically exclude SH values that deviate by more than seven units from the average (Aydin & Basu, Reference Aydin and Basu2005). However, this study included all readings to capture spatial variations in surface hardness, as in some previous work (e.g. Aydin, Reference Aydin and Ulusay2014). The data were then analysed by site and geological unit to explore rock hardness variations and compared with relevant SH values from the literature (Table 1). Rebound values were carefully reviewed to ensure measurement accuracy and maintain data integrity. The Kruskal–Wallis test, a non-parametric method, was used to determine the statistical significance of variations in SH values between different sample sites and geological units. Post-hoc Dunn’s tests were conducted to identify pairwise differences where significant variations were found.
UCS and SH values for dolomite from various locations

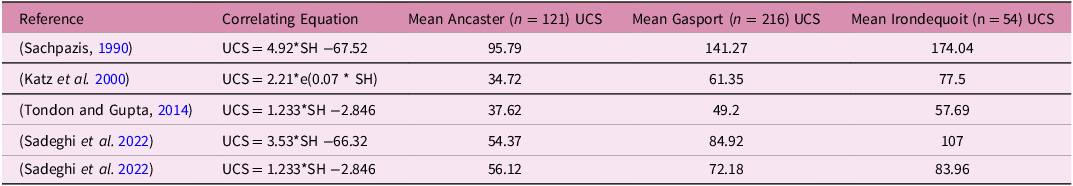
The UCS is an essential parameter for geotechnical investigations, as it provides crucial information about the mechanical strength of rock and soil (Sadeghi et al. Reference Sadeghi, Nikudel, Khamehchiyan and Kavussi2022). Understanding the relationship between SH values and factors such as fractures, weathering and joint continuity, along with mean UCS values, allows accurate assessment of rock mass strength in the study area. The UCS values of each geological unit were calculated based on the SH values recorded at the study sites and using correlating equations, detailed in Table 2, tailored for dolomitic rock (Sadeghi et al. Reference Sadeghi, Nikudel, Khamehchiyan and Kavussi2022). Mean UCS values for geological units further contextualize the data and enhance the accuracy of rock mass strength assessments.
Correlation equations and mean UCS values for different geological formations

However, because SH measurements reflect only the upper ∼2 mm of the rock surface, and because many testing locations included weathered surfaces and nearby fractures, the derived UCS values should be treated solely as approximate indicators of surficial hardness. These values do not represent intact laboratory UCS and cannot capture deeper-scale mechanical behaviour controlled by bedding, fracture sets or discontinuities. For these reasons, all interpretations emphasize rebound values (R) as the primary dataset, with UCS values retained only for contextual and comparative purposes.
UCS values reported here are estimates derived from empirical relationships between SH rebound values and UCS developed for carbonate rocks (citations included in Table 2). These estimates should be interpreted as relative indicators of field rock mass strength rather than absolute values for intact specimens, since our protocol intentionally included weathered and fractured surfaces.
Mechanical properties were further evaluated by integrating fracture density data mapped by Formenti et al. (Reference Formenti, Peace, Eyles, Lee and Waldron2022) to assess the effects of fracture density on SH values and overall rock mass strength. SH values were taken at locations corresponding to the mapped fracture data, allowing for direct comparison between SH values and fracture density. Kendall’s rank correlation tau test was used to evaluate the influence of fractures, weathering and fracture continuity on rock mass strength. Additionally, linear regression analyses were performed between SH values and fracture continuity, as well as between SH values and the estimated degree of weathering.
3. Results
Rebound values varied systematically by lithology and site. The Ancaster Member generally displayed lower values, consistent with its thin bedding and higher fracture continuity, while the Irondequoit Formation recorded higher values in massive dolostone beds. These broad lithological patterns provide the framework for the statistical analyses that follow, which test differences among sites and formations. All SH values collected from the Ancaster Member of the Goat Island Formation, the Gasport Formation and the Irondequoit Formation (Figure 2) were analysed statistically using a significance threshold of p < 0.05 (95% confidence).
3.a. Effect of site and geological unit
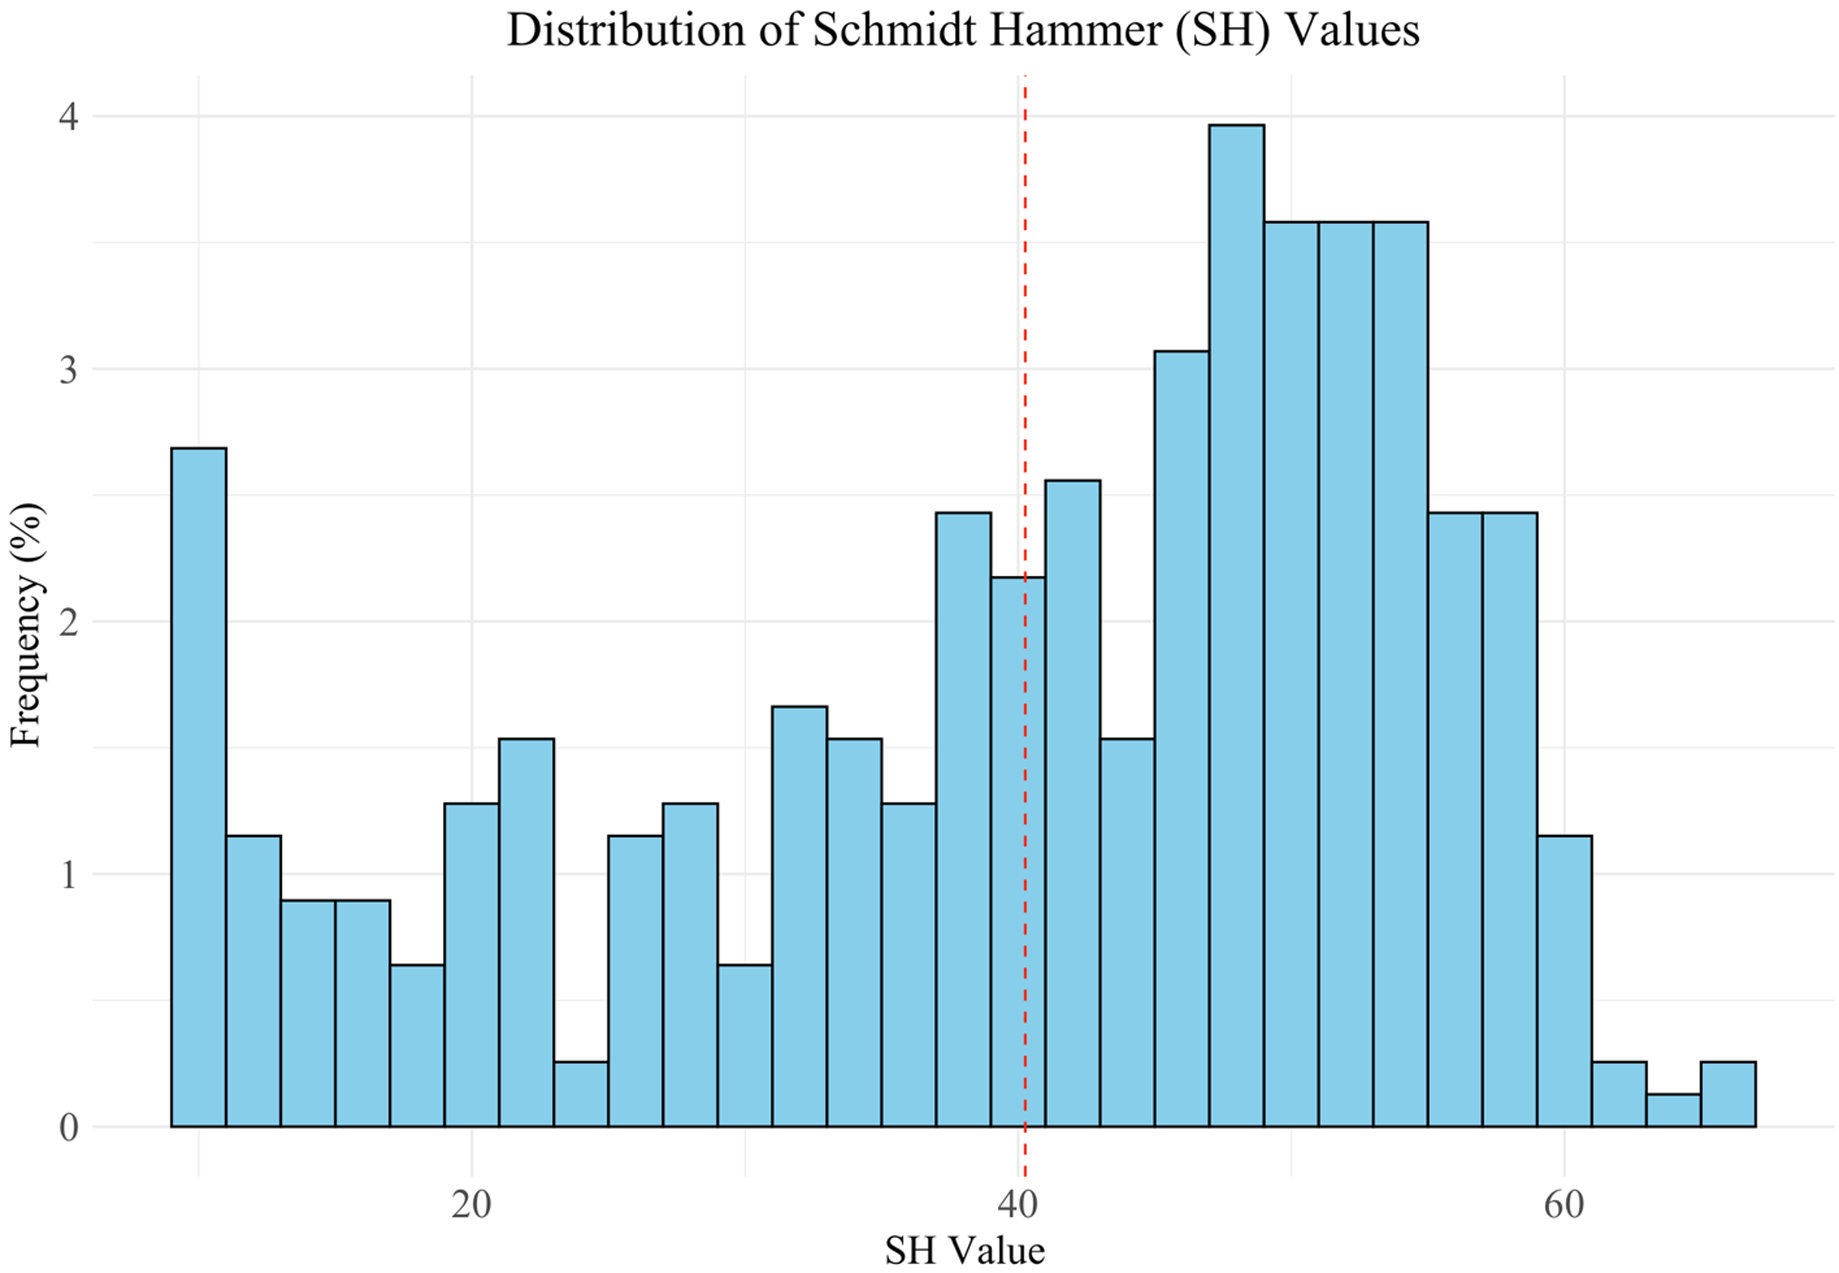
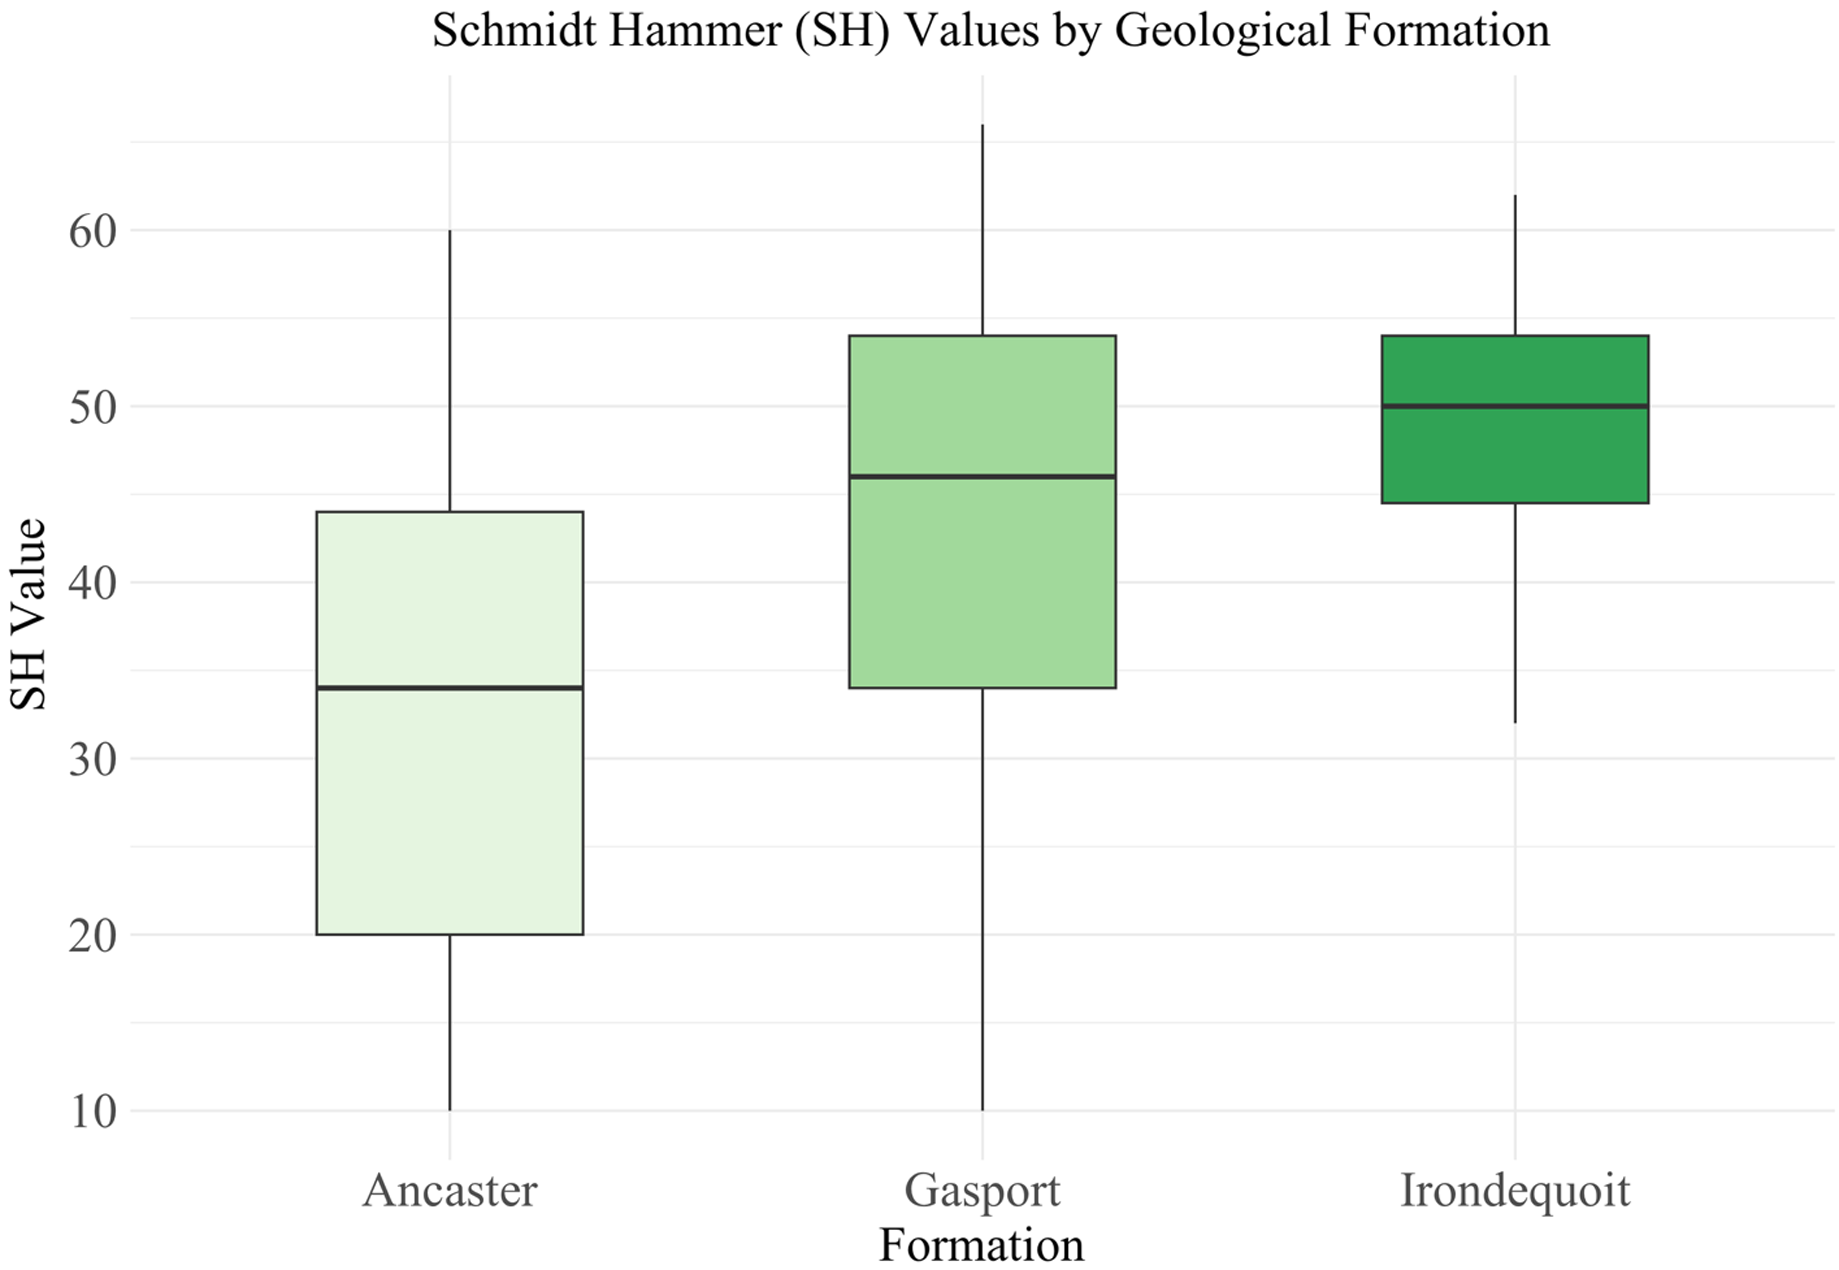
SH measurements obtained from different lithological units at the study sites along the Niagara Escarpment revealed SH values ranging from 10 to 66, with an average of 40.26 (Figure 8). The first and third quartiles, at 32 and 52, show that the central 50% of SH values span 20 rebound units, indicating moderate variation in rock hardness. Table 1 compares average SH values obtained in this study with those reported in relevant literature (Barlow, Reference Barlow2002; Day, Reference Day1980; Deere & Miller, Reference Deere and Miller1966; Hayakawa & Matsukura, Reference Hayakawa and Matsukura2010; Lo, Reference Lo1978). Average SH values reported here (Figure 8) clearly identify differences in mechanical properties among the dolomitic units in the upper escarpment. The Ancaster Member, Gasport Formation and Irondequoit Formation had respective mean SH values of 32.8, 42.2 and 49.1, with standard deviations (SD) of 14.5, 14.3 and 7.40 (Figure 9).
Histogram showing the distribution of all collected SH values, across various sites, expressed as a frequency (%), with a bin width of 2 units (n = 391). The red dotted line indicates the mean SH value of 40.26.

Percentage frequency distribution of SH values for the lithologic units tested within the Ancaster Member, Gasport and Irondequoit formations, with respective mean values of 32.8, 42.2 and 49.1 shown by red dotted lines, with a bin width of 2 units. Note the relatively low mean values measured in the thinly bedded Ancaster Member and much higher mean values in the massive Irondequoit Formation.

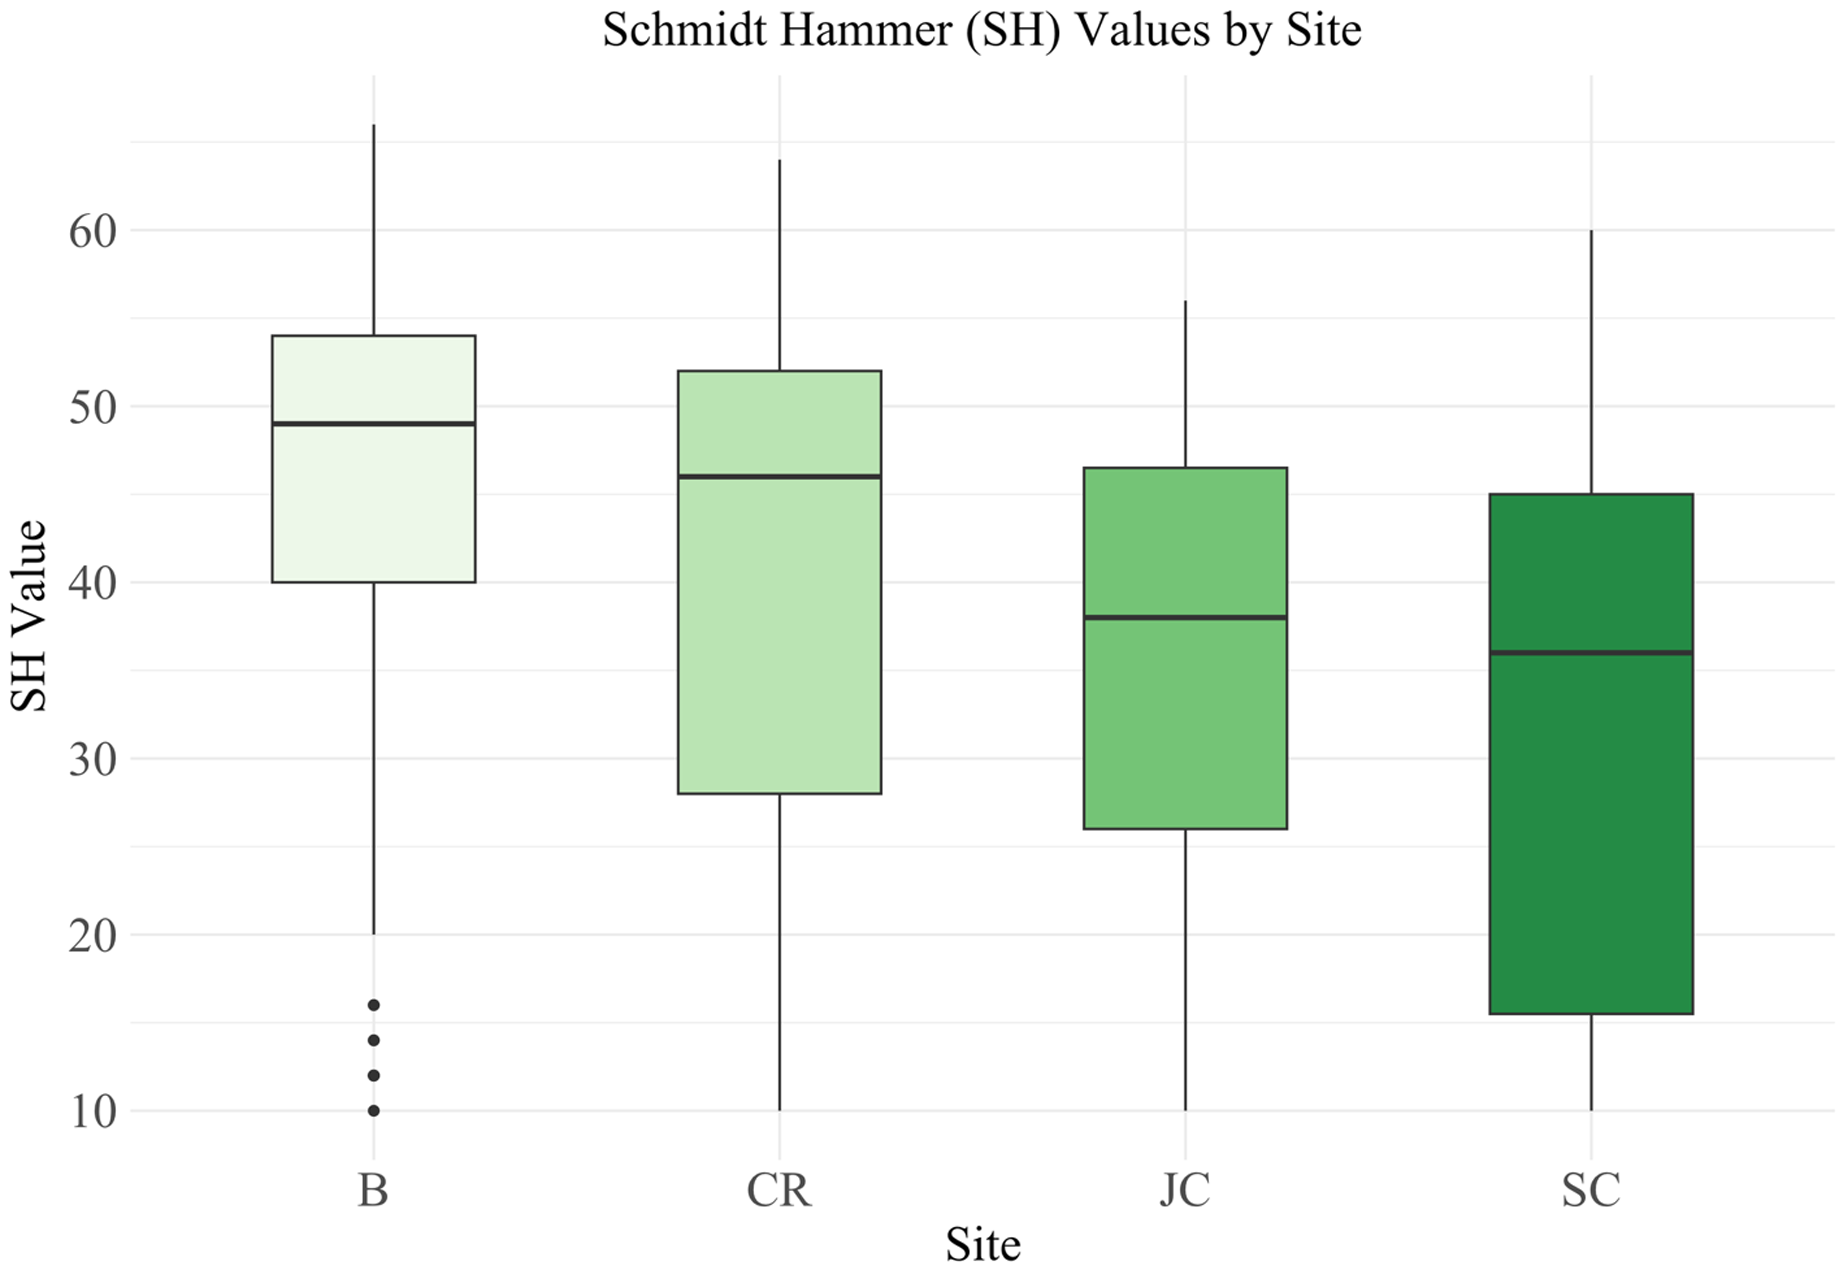
Using the Kruskal–Wallis test, statistically significant differences in mean SH values were identified between sites H(3) = 39.38, p = 1.44e-08 and geological units H(2) = 55.07, p = 1.10e-12 (Figures 10 and 11). These results indicate significant variability in rock strength across different sampling locations and geological units. Pairwise comparisons indicated that the Ancaster unit exhibited significantly lower SH values than the Gasport and Irondequoit units (z = −5.78, p = 5.62e-09 for Gasport; z = −6.74, p = 2.39e-11 for Irondequoit). The Gasport unit had significantly lower SH values compared to the Irondequoit unit (z = −2.94, p = 1.66e-03), consistent with the previously observed gradient in rock strength among these geological units.
Boxplot of SH values by site. The boxes represent the interquartile range of SH values for each site measured, with medians indicated by horizontal lines. The SH values were found to vary significantly in the different sites (Kruskal–Wallis test, p = 1.181e-06). Four site locations are designated as follows: the Bruce Trail (B), the Chedoke Radial Trail (CR), the Jolley Cut (JC) and the Sydenham Cut (SC).

Boxplot of SH values by lithologic unit. The boxes represent the interquartile range of SH values for each unit, with medians indicated by horizontal lines. The SH values were found to vary significantly with different lithologic units (Kruskal–Wallis test, p = 8.085e-10). The lithologic units tested at each site include dolostones and limestones with varying bedding characteristics. SH values shown are from the dolostones of the Ancaster member of the Goat Island formation, the Gasport formation and the Irondequoit formation.

Further comparisons using the Kruskal–Wallis test indicated that there were no significant differences in SH values for the Irondequoit Formation between sites (χ2 = 2.36, p = 0.12). However, significant differences between sites were found for the Ancaster Member (χ2 = 10.47, p = 0.01; Figure 12) and Gasport Formation (χ2 = 48.31, p = 1.83e-10; Figure 12). Additional pairwise comparisons identified Site B as significantly different from Sites CR (z = 3.298, p = 9.72e-04; Figure 12), JC (z = 4.805, p = 2.31e-06) and SC (z = 5.128, p = 8.77e-07). Site CR was significantly different from Site JC (z = 1.89, p = 3.50e-02) and SC (z = 2.47, p = 1.01e-02). However, Site SC showed a non-significant difference with Site JC (z = 0.667, p = 2.52e-01). These results indicate that while the Irondequoit Formation exhibits consistent SH values across sites, the Ancaster Member and Gasport Formation show significant variability in SH values depending on the site, with Site B consistently differing from the others.
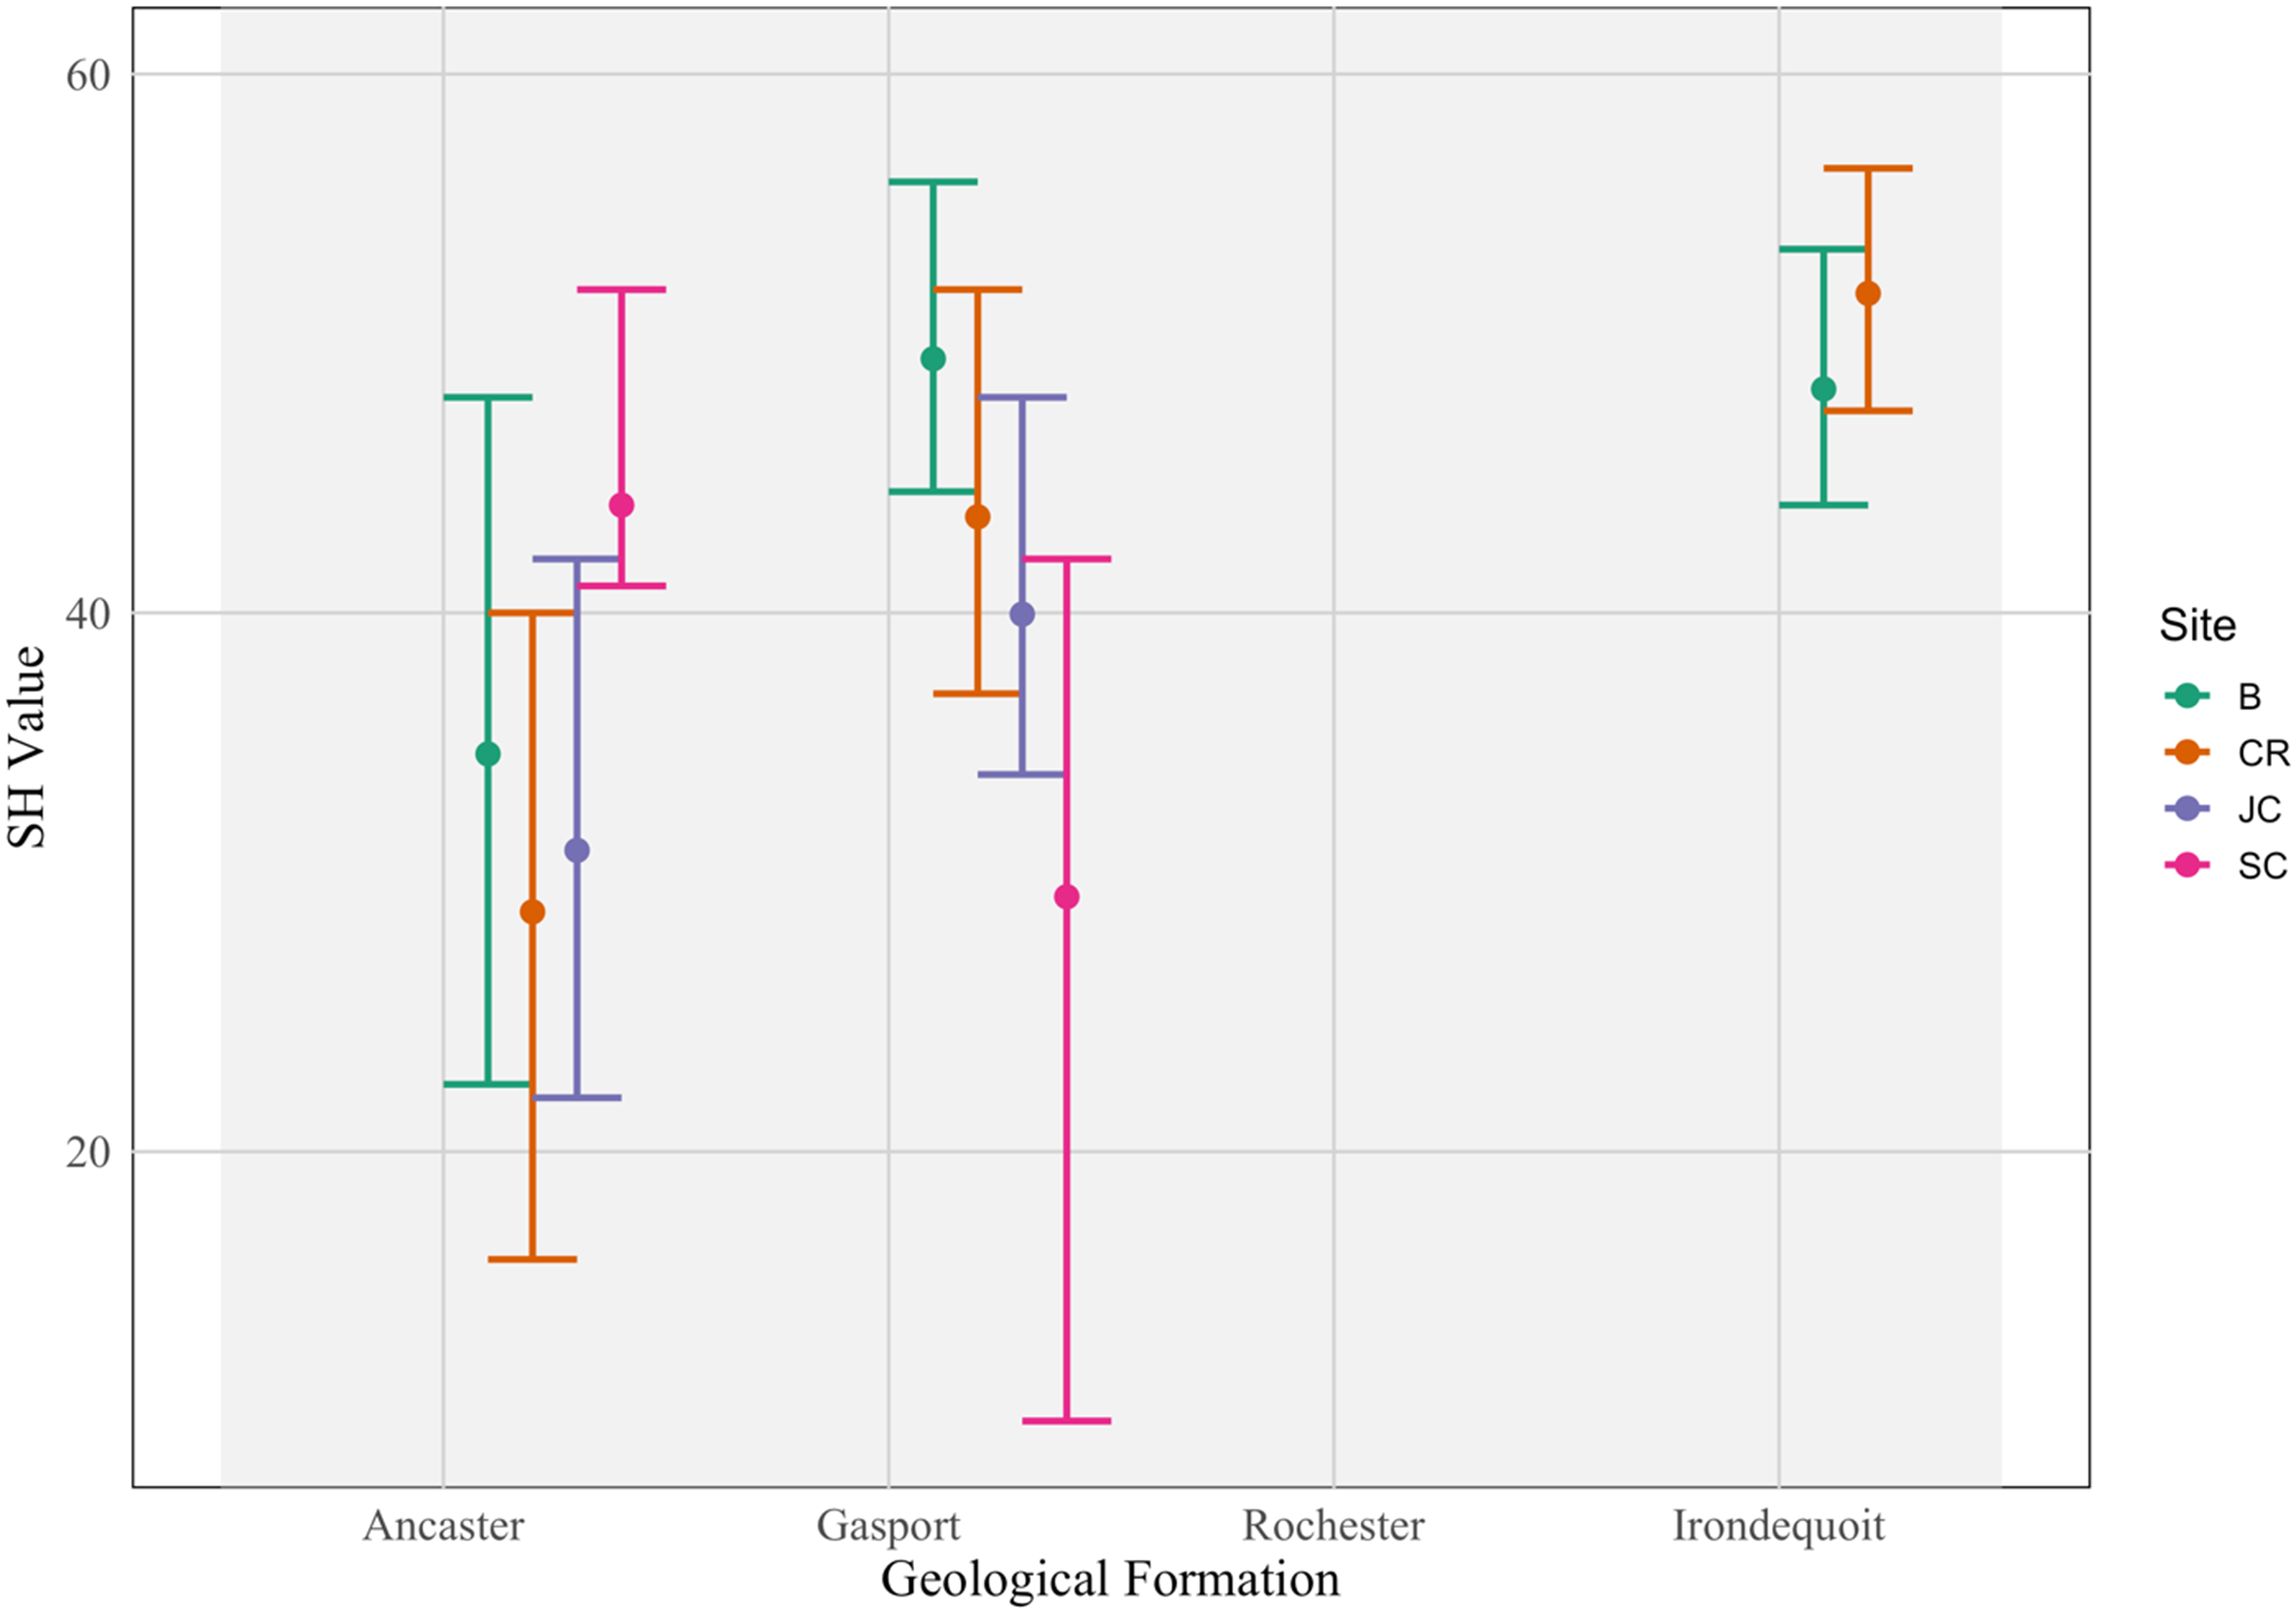
Average SH values and interquartile range (Q1–Q3) for four geological formations: Ancaster, Gasport, Rochester and Irondequoit. Each formation is represented as a distinct block along the x-axis, with sites (B, CR, JC and SC) displayed within each formation block. Mean SH values are shown as points, and interquartile ranges are displayed as horizontal error bars. The y-axis ranges from 10 to 60, representing SH values.

A two-factor Aligned Rank Transform Analysis of Variance (ANOVA) was performed to assess the effects of site and geological unit on SH values for the Ancaster Member and Gasport Formation. The analysis showed that both site (F(3, 329) = 10.15, p = 2.07e-06) and geological unit (F(1, 329) = 31.63, p = 3.99e-08) significantly affected SH values, with a notable interaction between the two factors (F(3, 329) = 11.38, p = 4.04e-07).
Further analysis confirmed that SH values were consistently influenced by stratigraphic units across sites, although the magnitude of this effect varied (Figures 13 and 14). The results suggest significant rock hardness differences within a single geological unit between several sites, particularly between CR and SC for the Ancaster Member, and B, SC and JC for the Gasport Formation. These variations suggest that local environmental factors, such as weathering or fracture patterns, play a crucial role in influencing rock strength across both the Ancaster Member and the Gasport Formation.
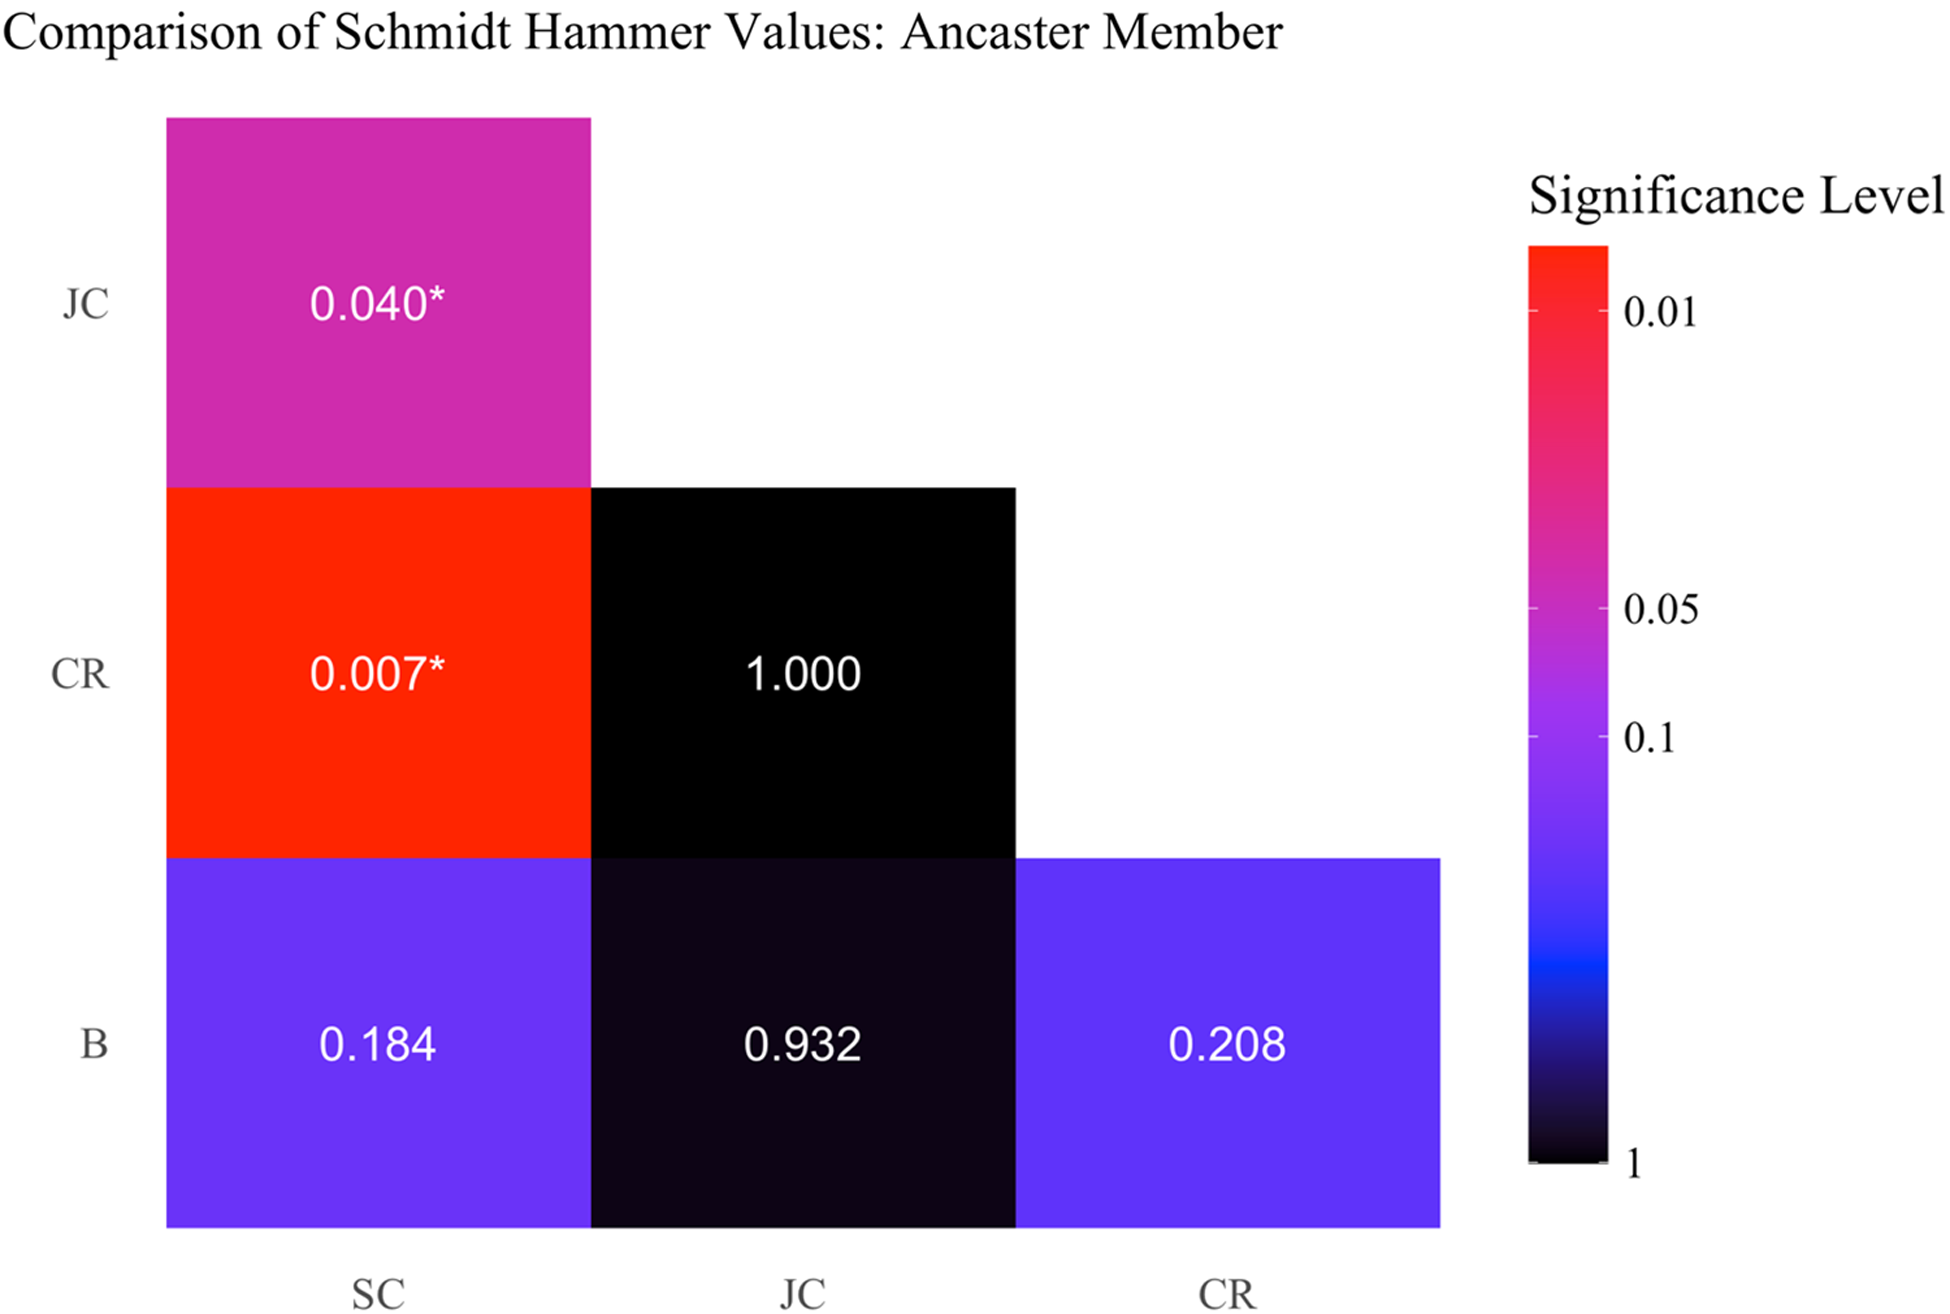
Heatmap of p-values from Dunn’s test comparing SH values for the Ancaster Member across different sites. Each cell displays the p-value for pairwise comparisons between two sites, with the colour gradient representing the -log10 of the p-value. Warmer colours (red) indicate more significant differences, while cooler colours (blue to black) suggest weaker or non-significant differences. Asterisks (*) mark comparisons where the p-value is below 0.05, indicating statistical significance. Sites compared include Sydenham Cut (SC), the Chedoke Radial Trail (CR), the Bruce Trail (B) and the Jolley Cut (JC).

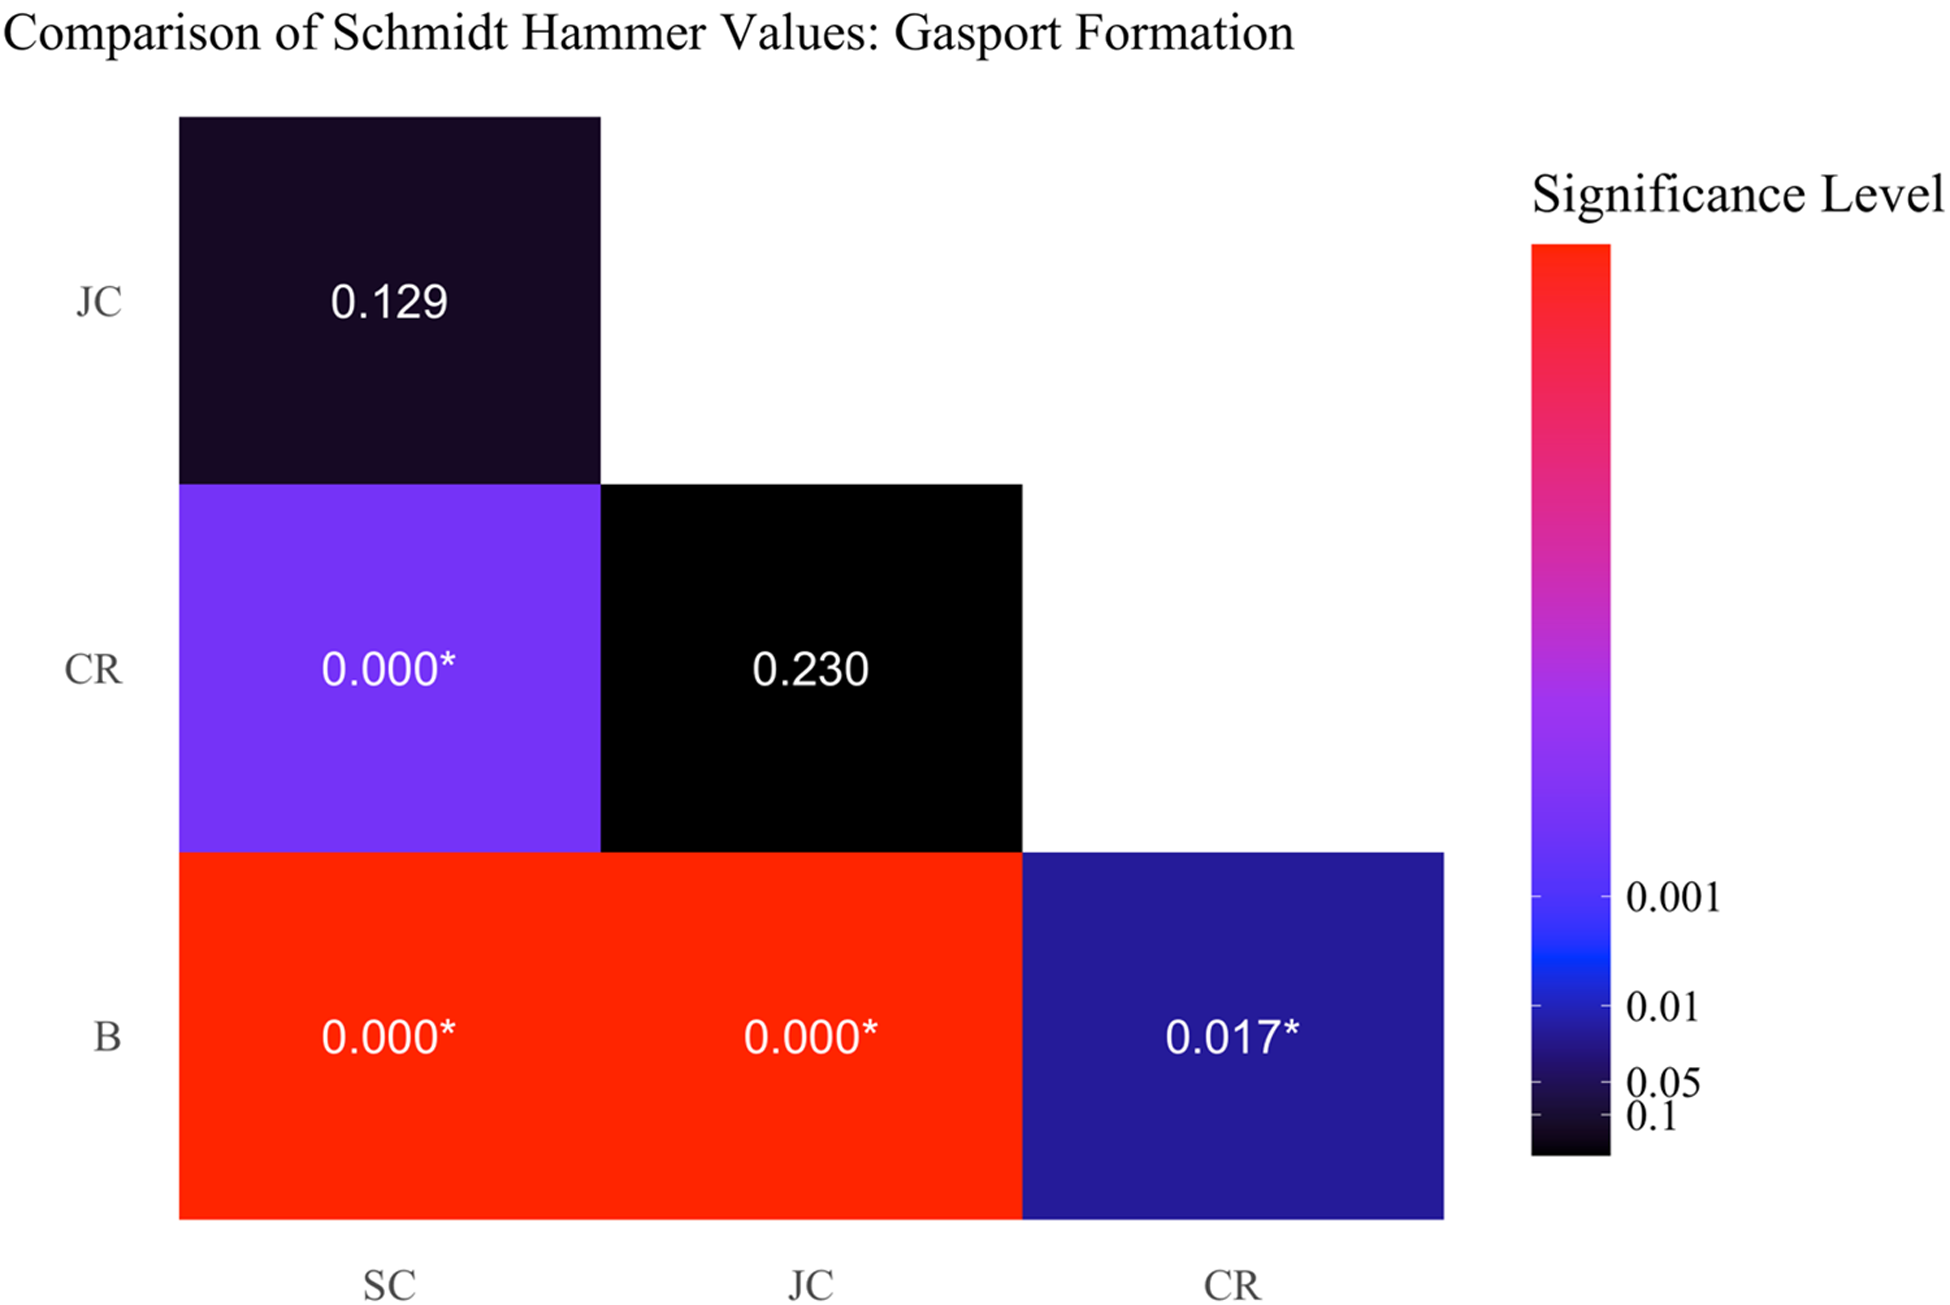
Heatmap of p-values from Dunn’s test comparing SH values for the Gasport Formation across different sites. Each cell displays the p-value for pairwise comparisons between two sites, with the colour gradient representing the -log10 of the p-value. Warmer colours (red) indicate more significant differences, while cooler colours (blue to black) suggest weaker or non-significant differences. Asterisks (*) mark comparisons where the p-value is below 0.05, indicating statistical significance. Sites compared include Sydenham Cut (SC), the Chedoke Radial Trail (CR), the Bruce Trail (B) and the Jolley Cut (JC).

In addition to SH values, scanline surveys documented fracture continuity and surficial weathering. The Ancaster Member generally exhibited the highest fracture continuity (commonly >40% of scanline length) and greater surficial weathering, consistent with its lower SH rebound values. The Gasport Formation showed moderate fracture continuity and weathering, while the Irondequoit Formation was characterized by more massive bedding, limited surface weathering and the highest rebound values. These qualitative observations support the interpretation that both fracture characteristics and weathering contribute significantly to the mechanical variability observed among formations.
The lower rebound values observed in the Ancaster Member correspond with its thin, fractured bedding, whereas the higher values in the Irondequoit Formation are associated with its massive dolostone beds. These patterns highlight the importance of mechanical stratigraphy in controlling SH results.
3.b. UCS, fractures, weathering and joint continuity
The Ancaster Member exhibited UCS values ranging from 34.72 to 95.78, while the Gasport Formation demonstrated UCS values between 61.35 and 141.27. These ranges represent the variation in the UCS equation used and the variation in the measured mechanical strengths of the respective geological units within the study area (Table 2). These UCS values reflect the combined effects of intact rock strength and surficial weathering. These values are generally lower than those reported in previous studies, but given the shallow sampling depth and influence of weathering and fractures, they should be regarded only as approximate reflections of surficial hardness. We therefore interpret mechanical trends primarily from the R-values, with these UCS estimates used only as supporting context.
Kendall’s rank correlation tau test was applied to three datasets to assess the strength and direction of association between average SH values and average fracture density. The relationship between variables was non-significant (T = 14, p = 0.1557, tau = −0.3778), indicating no clear association between these variables. Linear regression showed no significant association (p = 0.2234, R 2 = 0.1788), indicating that only 17.88% of the variability in SH values can be explained by fracture density (Figure 15). The correlation between SH values and fracture continuity yielded a significant result (z = 3.8721, p = 0.0001079, tau = 0.1638464). Linear regression confirmed this association (p = 0.0001151, R 2 = 0.04074). For SH values and weathering, the test showed a significant correlation (z = 3.4905, p = 0.0004821, tau = 0.156412), and linear regression analysis supported this finding (p = 7.525e-08, R 2 = 0.0838). These results identify significant correlations between SH values, fracture continuity and weathering.
Relationship between Schmidt Hammer values and fracture density across selected scanline surveys. Fracture density data are from corresponding sites reported in Formenti et al. (Reference Formenti, Peace, Eyles, Lee and Waldron2022), collected at the same outcrops where rebound measurements were made. This alignment ensures that comparisons reflect co-located datasets. Each point represents the average SH value and fracture density for a specific site-unit combination, with horizontal and vertical error bars indicating the standard error in SH values and fracture density, respectively. A linear regression line (blue) suggests the overall trend in the data (p = 0.2234, R 2 = 0.1788), indicating a weak, non-significant relationship.

4. Discussion
4.a. SH Measurement validation
Comparative analysis with existing literature (Deere & Miller, Reference Deere and Miller1966; Day & Goudie, 1977; Lo, Reference Lo1978; Day, Reference Day1980; Barlow, Reference Barlow2002; Hayakawa & Matsukura, Reference Hayakawa and Matsukura2010) reinforced the validity of the SH measurements obtained in this study (Table 1). The SH values reported here are comparable to those measured by Hayakawa & Matsukura (Reference Hayakawa and Matsukura2010) for the Amabel Formation (Lockport equivalent) in Niagara Falls. Hayakawa & Matsukura (Reference Hayakawa and Matsukura2010) recorded average SH values of 31.70 for ‘weathered dolomite’ and 53.40 for ‘fresh dolomite’ recently exposed due to hydrological processes. The mean SH value of 40.93 recorded in the present study and the individual mean for each geological unit (Ancaster Member, 32.8; Gasport Formation, 42.2; and Irondequoit Formation, 49.1) all fall within the range of the two values outlined in Hayakawa & Matsukura (Reference Hayakawa and Matsukura2010) (Figure 9; Table 2).
While the mean SH values reported here are consistent with previous studies, the range of values collected in the present study is quite broad. This broad range can likely be attributed to: (1) variability within the geological formation due to slight lateral changes in factors such as depositional environment (Memon et al. Reference Memon, Tunio, Memon, Mahesar and Abbas2023), (2) different post-depositional processes acting upon the rock (Gupta, Tandon & Sah, 2009) and (3) different study methodologies; fracture-free surfaces were not required in this study (Aydin & Basu, Reference Aydin and Basu2005), which likely led to the low minimum SH values measured (Figures 8 and 9). These variations highlight the importance of considering local geological nuances and study methodologies when interpreting SH values.
4.b. Derived uniaxial compressive strength
The UCS values reported here are derived from SH measurements and are therefore influenced by surface conditions and shallow subsurface features. As rebound values sample only the outermost ∼2 mm of the rock surface and many measurements were taken on weathered and fractured outcrops, these UCS estimates do not represent intact laboratory strength. They are best regarded as approximate, surface-based indicators that mirror the trends observed in R-values rather than as definitive mechanical parameters.
The UCS values derived from SH values exhibited a wide range (Table 2), with many values lower than those obtained from similar lithological units reported in the literature (Table 1). The UCS values are most similar to those reported by Lo (Reference Lo1978), the most recently published values for the Niagara Escarpment in Hamilton, Ontario. Based on the UCS values derived from SH measurements in the present study, the range of values, most noticeably in the Ancaster, is lower than that reported by Lo (Reference Lo1978). This may result from natural changes in rock mass properties, which are influenced by environmental and geological processes that decrease rock strength. For example, several studies have demonstrated that mechanical rock properties, such as UCS, can decrease with time, particularly with extreme weather conditions in winter (Walbert et al., Reference Walbert, Eslami, Beaucour, Bourges and Noumowe2015).
However, Aydin & Basu (Reference Aydin and Basu2005) analysed quantitative relationships between SH and UCS values, suggesting that while SH can serve as a valuable proxy for UCS, inherent inconsistencies can occur due to factors such as surface smoothness, weathering and moisture content (Kahraman et al. Reference Kahraman, Fener and Gunaydin2002). Attempts to offset surface deterioration and localized rock mass variations on SH results through mathematical adjustments have been made; however, Aydin & Basu (Reference Aydin and Basu2005) advise against adding supplementary variables in empirical correlations for practical purposes.
Practically, approximate UCS estimates derived from SH readings can provide useful context for geohazard management of the Niagara Escarpment, facilitating various geotechnical analyses, such as slope stability assessments, and other characteristics of the rock mass (Bieniawski, Reference Bieniawski1989; Brook & Hutchinson, Reference Brook and Hutchinson2008; Goudie, Reference Goudie2006; Moon et al. Reference Moon, Russell and Stewart2001). However, these applications should be approached with caution due to methodological limitations and the potential for site-specific variability in rock strength. We emphasize that the UCS values presented here are relative and field-based. They capture the integrated effects of intact rock, weathering and fracturing at the exposure surface, and are therefore not equivalent to laboratory measurements on unweathered cores.
4.c. Site-specific influences on SH values
This study uncovered disparities in SH values among different sites, with higher values observed at Site B and lower values at Site JC, likely due to variations in lithological characteristics and weathering (Figure 12). The literature indicates that variations in rock strength are often a consequence of lithological diversity and post-depositional processes such as chemical weathering, physical erosion or mineral cementation (Azarafza et al. Reference Azarafza, Ghazifard, Asasi and Rahnamarad2021; Shobe et al. Reference Shobe, Hancock, Eppes and Small2017). Interactions between water and rock can lead to alterations in surface hardness, which is detectable through changes in SH values even within the same rock type (Gupta et al. Reference Gupta, Sharma and Sah2009). The effect of water on SH values is not uniform, varying with the specific interaction between water, rock and environmental conditions (Poblet et al. Reference Poblet, Bulnes and Uzkeda2022; Shobe et al. Reference Shobe, Hancock, Eppes and Small2017). The significant variation in SH values across the study sites may result from the varying proximity of sites to bodies of water.
Mechanical alteration, such as from blasting, typically reduces SH values by creating more fragmented and weathered rock surfaces (Gupta et al. Reference Gupta, Sharma and Sah2009). Outcrops at Sites JC, CR and SC are located close to areas of former blasting activity and may, therefore, show altered SH values due to mechanical disruptions. In contrast, the Bruce Trail outcrop (Site B) was not directly subjected to blasting, potentially contributing to its distinctly higher SH values (Figure 10). However, records of blasting are inconsistent and incomplete in the Hamilton area, and the influence of this alteration at any site cannot be definitively assessed.
Increased weathering of rock directly correlates with reductions in SH values, with more weathered rocks typically exhibiting lower values (Borrelli et al. Reference Borrelli, Greco and Gullà2007; Day, Reference Day1980; Gupta et al. Reference Gupta, Sharma and Sah2009; Hansen et al. Reference Hansen, Meiklejohn, Nel, Loubser and Van Der Merwe2013; Larsen et al. Reference Larsen, Tabor and Smith2020; Matthews et al. Reference Matthews, Owen, Winkler, Vater, Wilson, Mourne and Hill2016; Matthews & Winkler, Reference Matthews and Winkler2022). Environmental conditions and geological variables, ranging from albedo and moisture content to slope angles and thermal environment, are implicated by Hansen et al. (Reference Hansen, Meiklejohn, Nel, Loubser and Van Der Merwe2013) as factors influencing rock mass strength. This multitude of variables complicates the assessment of rock stability, underscoring the challenge of drawing definitive conclusions from SH measurements alone. However, SH values decrease as weathering grade increases, and this may correlate with increased susceptibility to landslides (Borrelli et al. Reference Borrelli, Greco and Gullà2007).
Gage et al. (Reference Gage, Eyles and Peace2022) discussed the influence of thermal weathering on the Niagara Escarpment in Hamilton, Ontario. They suggest that temperature extremes found at Site SC could be a decisive factor in the weathering rate and stability of the rock face. Conversely, Site B, with its protective forest canopy, may be less affected by such weathering, which is evident by its higher SH values compared to more exposed sites.
Considering the variations in environmental conditions between the sites, a comprehensive evaluation is necessary to accurately assess and compare the weathering rates and other factors that have a specific impact on SH values. Variations in SH values may be used to identify not only the physical characteristics of a rock unit, but also its stability and susceptibility to erosion and other geohazard processes, providing a critical context for understanding the geotechnical dynamics at play (Day, Reference Day1980; Shobe et al. Reference Shobe, Hancock, Eppes and Small2017).
4.d. The effect of lithology on SH value
Detailed analysis of the SH values across different geological units reveals intrinsic variations that underscore the unique properties pertaining to each lithologic unit. These variations are attributed to distinct lithological characteristics and degrees of weathering encountered within each unit, which are indicative of the mechanical properties of the lithologic unit. Specifically, the Ancaster Member is characterized by thinly bedded dolostone and high fracture density, which generally result in lower SH values (mean = 32.8). In contrast, the Gasport Formation has thicker, more fossiliferous dolostone beds and tends to yield moderately high SH values (mean = 41.2), while the Irondequoit Formation, known for its massive and highly bioturbated dolostone, often records the highest SH values (mean = 49.1).
Fracture patterns and densities likely play a significant role in controlling these differences, as fractures can decrease SH values by reducing the intact strength of the rock mass (Aydin & Basu, Reference Aydin and Basu2005). A higher concentration of fractures in the Ancaster Member would be expected to contribute to lower SH values compared to the less fractured Gasport and Irondequoit formations.
Variability in SH values also reflects mechanical stratigraphy. Thinly bedded intervals in the Ancaster Member are mechanically weaker due to more frequent bedding interfaces and higher fracture density, while the massive dolostone of the Irondequoit Formation yields higher rebound values consistent with stronger intact rock. Although mineralogical and petrophysical factors such as porosity and cementation were not quantified here, they are important controls and represent a priority for future work. The significant variation in SH values recorded across lithologic units underscores the importance of assessing rock strength on a unit-by-unit basis. In the Niagara Tunnel Project, a water diversion tunnel in Niagara Falls, strength parameters were applied to the entire Lockport Group without distinguishing between the Ancaster Member and the Gasport Formation. While this generalization did not cause issues for the project (Perras et al. Reference Perras, Diederichs and Besaw2014), it can obscure important geological differences that may be critical in other contexts. A focused analysis that recognizes the unique properties of individual units is essential to avoid oversights and ensure a more accurate understanding of the strength of each lithological unit.
Integrating rebound data with stratigraphic observations will enable more refined geohazard models for the escarpment.
4.e. Combined impact of spatial and lithologic variation
The significant interaction effect observed in the two-factor ANOVA between sites and geological unit indicates that the impact of geological unit on SH values changes depending on the site. This suggests that rock strength varies within a particular lithologic unit due to vertical and lateral variations in lithological characteristics.
The observed variability in SH values within the tested geological units suggests that the broader geological formations are not spatially homogeneous. This heterogeneity is often observed in carbonate systems, where subtle, yet impactful, differences in depositional environment, diagenetic processes, tectonic activities and other post-depositional processes profoundly modify the physical attributes of a rock unit (Memon et al. Reference Memon, Tunio, Memon, Mahesar and Abbas2023). Variations in lithology were observed during data collection and were reflected in the varying presence of chert nodules, vugs and fossil content across different sites within the same lithologic unit. For example, dolostones at Site B had a high fossil content, while those at Site JC contained far less fossiliferous material.
Variations in SH values also reflect the complex geological history and current state of a rock mass, and SH values can be used, in some instances, to accurately determine the exposure age of rock faces (Matthews & Winkler, Reference Matthews and Winkler2022). This emphasizes the importance of considering both geological and temporal factors in interpreting SH measurements.
The heterogeneity measured in SH values within different geological units in this study suggests that using scanline surveys for this type of assessment may not be ideal. While scanline surveys provide an unbiased measurement of rock mass characteristics, they may not capture the full spectrum of complexity and variability inherent in any one lithologic unit. This limitation is particularly critical for geotechnical evaluations that demand a thorough understanding of rock mass rating and stability (Bieniawski, Reference Bieniawski1989). Interaction effects emphasize the need for site-specific evaluations, as averaged values for lithological units may not accurately reflect rock properties.
4.f. SH Values relationship to fracture density, weathering and joint continuity
Relationships between fracture density and decreased SH values have been widely noted (Katz et al. Reference Katz, Reches and Baer2003; Poblet et al. Reference Poblet, Bulnes and Uzkeda2022; Shobe et al. Reference Shobe, Hancock, Eppes and Small2017). However, these studies suggest that average fracture density does not have a strong, significant, linear or monotonic relationship with average SH values in the datasets examined. The relationship statistically derived in the present study indicates that about 18% of the variability in SH values can be attributed to fracture density, which is notably less than the 40% associated variance reported in Shobe et al. (Reference Shobe, Hancock, Eppes and Small2017). While there might be a slight tendency for SH values to decrease as fracture density increases, this pattern is not strong enough to be statistically confirmed by the data collected in this study.
The lack of a strong correlation between SH values and fracture density reported in this study implies that SH values are influenced by a broader set of rock mass characteristics than fracture density alone. However, as the fracture density data reported by Formenti et al. (Reference Formenti, Peace, Eyles, Lee and Waldron2022) was used to evaluate the relationship between fracture density and SH and did not include data on the density of microfractures, this relationship may be underestimated.
There appears to be a meaningful association between SH values and both fracture continuity and weathering across all sites and units within the data reported here (Figure 15; p = 0.0001151, R 2 = 0.04074 and p = 7.525e-08, R 2 = 0.0838, respectively). This significant correlation implies that when fracture propagations decrease or weathering lessens, there is a noticeable increase in SH values, suggesting that these geological factors hold a strong influence on the mechanical properties of the rock mass. The correlations highlight the necessity of integrating detailed geological evaluations with SH values in geotechnical analysis, ensuring that the influences of fracture continuity and weathering are adequately considered in assessing rock mass behaviour and stability.
4.g. Implications for geohazards along the Niagara escarpment
Although this study does not aim to undertake a formal geohazard assessment, the spatial variability in SH rebound values and fracture characteristics documented here provides useful context for understanding escarpment stability. Previous work in the Hamilton area has shown that block failures and rockfalls are strongly influenced by stratigraphic position, fracture networks and differential erosion, particularly where resistant caprock overlies weaker shale units (Formenti et al. Reference Formenti, Peace, Eyles, Lee and Waldron2022; Gage et al. Reference Gage, Eyles and Peace2022).
In this context, the lower mean R-values and greater variability observed within the Ancaster Member, especially at sites with high fracture continuity and chert-rich intervals, are broadly consistent with the mechanical conditions expected in sectors prone to block detachment. Conversely, the Irondequoit Formation generally exhibits higher and more uniform rebound values, in line with its more massive character and lower reported frequency of instability.
We stress that SH measurements reflect only surficial rock hardness and cannot capture deeper structural controls such as persistent discontinuities, bedding architecture or stress conditions that ultimately govern slope failure. As such, the results presented here should not be interpreted as direct predictors of failure location or magnitude. Rather, they provide a comparative dataset that highlights relative differences in near-surface rock mass condition between units and sites.
When combined with existing fracture surveys, stratigraphic information and geomorphic observations (e.g. Formenti et al. Reference Formenti, Peace, Eyles, Lee and Waldron2022; Gage et al. Reference Gage, Eyles and Peace2022; Lee, Reference Lee2022), these measurements can contribute to a broader understanding of escarpment behaviour and help guide future, more targeted geohazard investigations. A comprehensive spatial analysis linking rock resistance data to documented failure inventories remains an important avenue for future work but lies beyond the scope of this study.
4.h. Limitations and future recommendations
The SH testing method reported here is invaluable for characterizing rock mass hardness, but it has several limitations that should be acknowledged. Surface assessments using SH may not accurately represent internal conditions in fractured or crumbled rock masses (Brook & Hutchinson, Reference Brook and Hutchinson2008; Moon et al. Reference Moon, Russell and Stewart2001). This discrepancy can lead to underestimations or overestimations of the mechanical properties of the rock mass. Additionally, the UCS calculations in this study were derived using established equations (Table 2; Sadeghi et al. Reference Sadeghi, Nikudel, Khamehchiyan and Kavussi2022), which may not fully capture the range of possible UCS values, leading to potential inaccuracies.
The lack of comprehensive datasets from studies of similar lithologies also poses a limitation, restricting the ability to make direct comparisons and validate the findings against a broader range of data. Moreover, the accuracy of scanline surveys, which were utilized in this study, depends heavily on their length and location. These surveys might not fully capture the geological variability present in the study area, potentially leading to incomplete or skewed data.
To address these limitations and build on the current findings, future studies should prioritize the integration of SH measurements with other geotechnical parameters, such as fracture orientation, spacing and weathering profiles, to quantitatively evaluate site-specific slope stability (Bieniawski, Reference Bieniawski1989). Temporal monitoring using SH assessments is advised to observe the evolution of rock strength over time. Such tracking can identify areas where the rock condition is deteriorating, signalling increased instability risks. Incorporating seasonality and temperature variation could provide a more nuanced understanding of how environmental factors influence weathering, rock strength and stability (Gage et al. Reference Gage, Eyles and Peace2022).
Integrating SH testing with detailed geological characteristics and classification systems, such as Rock Mass Rating and Selby’s Geomorphological Rock Mass Strength, can enhance the effectiveness of categorizing rock units based on rock quality, structural features and mechanical properties (Duszyński et al. Reference Duszyński, Ford, Goudie and Migoń2022; Goudie, Reference Goudie2006). Further characterization of rock mass properties through non-destructive testing methods, such as SH and direct UCS measurements, would allow for a more accurate and comprehensive understanding of the geological and mechanical behaviour of rock masses.
5. Conclusions
This study presents an amalgamation of field investigations, comparative analysis through review of available literature and statistical evaluations aimed at elucidating the physical complexities of rock units exposed along the Niagara Escarpment in the city of Hamilton using the SH. These evaluations provide the groundwork for characterization of the escarpment’s caprock, its strength characteristics, and potential factors influencing its stability.
The primary conclusions of this investigation are as follows:
-
1) The SH has proven to be a reliable tool for assessing the mechanical properties of the caprock of the Niagara Escarpment. The SH measurements reported here are consistent with previous studies (Hayakawa & Matsukura, Reference Hayakawa and Matsukura2009), validating the use of SH for evaluating geological strength in this region. This consistency supports the broader application of SH testing in similar geological settings for reliable rock strength assessment.
-
2) This study documented a much wider range of rock hardness and UCS values than has been previously reported, including significantly lower UCS values in some lithologic units, suggesting variations in rock strength and integrity, as well as possible degradation over time. These findings indicate the necessity for further, more detailed testing to understand the underlying causes of this variability.
-
3) Distinct patterns of intact rock strength were observed among the three lithologic units studied. These variations underscore the importance of considering geological heterogeneity in geotechnical assessments, particularly in carbonate systems where such variability can impact stability assessments and engineering designs.
-
4) Significant site-specific differences in SH values highlight the influence of localized geological and environmental factors on rock strength. Factors such as microclimate variations, local hydrology and site-specific weathering processes appear to play important roles in determining the mechanical characteristics of rock masses.
-
5) Site characteristics, geological units, weathering processes and fracture continuity significantly affect variation in SH values through complex interactions. These interactions necessitate the incorporation of multiple geotechnical and geological parameters when evaluating rock mass stability.
-
6) The observed geological heterogeneity and the nuanced impact of fractures and weathering on SH values underscore the need for more detailed and site-specific geotechnical assessments. Tailored investigations can better inform the design and implementation of stability measures and remediation strategies.
-
7) Integrating detailed geological evaluations with SH measurements is essential for improving the accuracy and reliability of geohazard management strategies on the Niagara Escarpment. By combining these approaches, predictive models for rockfall risks and other geohazards can be used, leading to more effective mitigation strategies and reduced risk to infrastructure and public safety.
Acknowledgements
We would also like to thank Joseph Hansen for his invaluable assistance during fieldwork. The authors would like to thank the editor and reviewers for their valuable contributions to this work.
Financial support
AP acknowledges Natural Sciences and Engineering Research Council of Canada (NSERC) Discovery Grant number (RGPIN-2021-04011). CHE acknowledges Natural Sciences and Engineering Research Council of Canada (NSERC) Discovery Grant number (RGPIN-2019-06568).
Competing interests
The authors declare none.


 Open access