


The Mays Institute on Diverse Philanthropy (2021, p. 12) finds that “about two-thirds of Black and Hispanic households and nearly one-half of Asian households gave to charity in a given year.” Yet, we know little about the motivations of donors of color. This lack of understanding could be due to the misconception that communities of color are often seen as the recipients of giving efforts rather than part of the philanthropy movement (Chen, Reference Chen2023; Osili et al., Reference Osili, Banks, Bhetaria and Boddie2021a, Reference Osili, Bergdoll, Pactor, Ackerman and Houston2021b). Limited research finds that “identities (social and shared) were more frequently mentioned explanations for giving than motives that have traditionally been highlighted in philanthropic literature, such as values, benefits, and need” (Chapman et al., Reference Chapman, Masser and Louis2020, p. 1287), but current models of donor behavior remain underdeveloped when understanding the role that racial identity plays in donor behavior.
Even less is known about how shared identities drive donor behavior during crises. Previous research suggests that disasters, especially when natural, elicit donations, especially when donors empathize with affected individuals (Chapman & Lickel, Reference Chapman and Lickel2016; Kahneman & Ritov, Reference Kahneman and Ritov1994; Zagefka & James, Reference Zagefka and James2015). Given the increasing diversity of communities and donors, we explore the following question: How does congruence between a donor’s racial identity and social cause influence their giving patterns during crisis?
We argue that an individual’s social identity influences their patterns of giving. Specifically, we examine whether a donor’s racial identity and intention to benefit their racial and ethnic group with their donation increases the likelihood of their donations to particular social causes. We investigate this proposition by examining philanthropic giving during the dual crises of 2020, particularly among Black/African American and Asian individuals. The COVID-19 pandemic and racial injustice primed many Americans to think critically about their own identities and community. The sociopolitical context and rhetoric surrounding the COVID pandemic made a salient connection between this crisis and Asian racial identity. Simultaneously, the 2020 civil unrest due to decades of systemic racism and the killings of multiple Black individuals brought forth the Black identity. As one donor said: “I felt like this year really made me step up as a person and as a Black man” (Mento, Reference Mento2020). Our research builds on Chapman et al. (Reference Chapman, Masser and Louis2020) by exploring the effect of donors’ social identities, specifically their racial identity, on their giving patterns during a period of crisis. 2020 makes an interesting case study to examine identity-based giving given the salience of two racial identities during this time period. Pew reports that least 50% of individuals from each racial group report paying attention to issues of race and racial inequality during this time (Horowitz et al., Reference Horowitz, Parker, Brown and Cox2020).
To explore identity-based giving, we use new, individual-level survey data from the 2020 Collaborative Multiracial Post-Election Survey (CMPS). The CMPS survey oversamples minoritized populations and asks questions on political and social issues (Frasure et al., Reference Frasure, Wong, Vargas and Bareto2020). We included questions about respondents’ giving during 2020 and “who” respondents expected to benefit from their donations, and find that Black and Asian individuals are more likely than White individuals to donate to Black Lives Matter (BLM) and Covid-19 relief efforts, respectively. Additionally, our results highlight that these gifts are motivated by an intention to support members of an individual’s racial/ethnic group. These results suggest that social identity plays an important role in donor behavior.
This research contributes to a growing literature on understanding the motivations of donors of color. Theoretically, we combine traditional donor models, social identity theory, and disaster philanthropy theory to understand how a donor’s salient social identity influences donations during sociopolitical crises. This research helps move toward understanding communities of color as part of the philanthropy movement and not solely as recipients of generosity. Empirically, we engage with new survey data that oversamples non-white respondents, allowing us to glean insights into overlooked groups of donors. Practically, our findings hold implications for nonprofit practitioners on engaging with donors of color.
The Importance of Social Identity to Giving
Understanding what motivates donors to give remains a critical discussion for scholars and practitioners (Kumar & Chakrabarti, Reference Kumar and Chakrabarti2023, Chapman et al., Reference Chapman, Masser and Louis2020; Bekkers & Wiepking, Reference Bekkers and Wiepking2011a, Reference Bekkers and Wiepking2011b; Wiepking & Bekkers, Reference Wiepking and Bekkers2012; Osili et al., Reference Osili, Bergdoll, Pactor, Ackerman and Houston2021b). Scholars find that gift-giving behaviors can be motivated by personal characteristics such as race, gender, marital status, sexual orientation, and income (Kumar & Chakrabarti, Reference Kumar and Chakrabarti2021; Bekkers & Wiepking, Reference Bekkers and Wiepking2011b, Wiepking & Bekkers, Reference Wiepking and Bekkers2012; Drezner, Reference Drezner2018, Gravey & Drezner, Reference Garvey and Drezner2019, Dale et al., Reference Dale, Ackerman, Mesch, Osili and Garcia2018, Dula, Reference Dula2022, Drezner, Reference Drezner2009, Bennett, Reference Bennett2012; Osili et al., Reference Osili, Bergdoll, Pactor, Ackerman and Houston2021b). Additionally, scholars have studied how external factors (Erlandson & Dickert, Reference Erlandsson and Dickert2024) influence giving, such as social peer pressure (Meer, Reference Meer2011), political narratives and stereotypes (Tremblay-Borie et al., Reference Tremblay‐Boire, Prakash and Calderon2023; Tremblay-Boire & Prakash, Reference Tremblay-Boire and Prakash2019), and affirming organizational experiences (Drezner, Reference Drezner2018; Drezner & Garvey, Reference Drezner and Garvey2016; Garvey & Drezner, Reference Garvey and Drezner2019).
Donors hold a multitude of identities, playing a large role in their motivation to donate and to whom they decide to donate (Chapman & Lickel, Reference Chapman and Lickel2016; Chapman et al., Reference Chapman, Masser and Louis2020; Andrenoi & Payne, Reference Andreoni and Payne2013). The influence of identity as a motivator of philanthropic giving has been heavily studied in higher education by Drezner and colleagues. They find that positive and inclusive experiences as a student promote collective identity and motivate giving among Black and LGBTQ alumnx (Drezner, Reference Drezner2009, Reference Drezner2018; Drezner & Garvey, Reference Drezner and Garvey2016; Garvey & Drezner, Reference Garvey and Drezner2019). Drezner and Garvey (Reference Drezner and Garvey2016, Reference Garvey and Drezner2019) find that collegiate experiences with affirming campus climate and inclusive spaces for affinity groups helped bond alumnx and their alma mater. These experiences served as catalysts for lifetime giving to their campus community. Conversely, negative student experiences did not lead to philanthropic donations of alumnx. Importantly, Drezner (Reference Drezner2009) finds that Black alumni expressed knowing the type of experiences that their donations would help support other Black students was critical to their decision to give. Likewise, Dale et al. (Reference Dale, Ackerman, Mesch, Osili and Garcia2018) find that gender identity (specifically women’s identity) is linked to significant motivators in giving to women and girls’ causes. In recalling lived experiences such as becoming a mother or the amplification of “womanhood” in the workplace, a woman is more motivated to give to organizations that provide for women’s and girls’ causes.
In these cases, a shared collective identity strengthened the need to make philanthropic gifts to organizations that serve similar individuals who share an identity with the donor. In short, these donors view their giving as investing in their community because they understand the experiences and effects the programs they support will have on people like themselves; social identity as it relates to the collective is an important driver of donations.
Giving During Crises
Research in the nonprofit community rarely centered on how political or social crises changed the giving landscape until the 2016 Presidential Election resulted in “rage giving” (Chapman et al., Reference Chapman, Lizzio-Wilson, Mirnajafi, Masser and Louis2022; Mesch et al., Reference Mesch, Osili, Bergdoll, Skidmore, Ackerman and Han2020), wherein individuals donated to nonprofits in response to the election of President Trump. Unlike the study of environmental disasters (Zagefka & James, Reference Zagefka and James2015) and the mechanisms that traditionally garner an uptick of donations for survivors and recovery efforts, social crisis giving at the individual level has not been widely studied within the USA. One reason for this might be that in recent decades, no major crisis garnered the same media attention and political rhetoric within the USA as did the COVID pandemic and racial justice movement of 2020.
However, research on giving in the wake of natural disasters provides some insights into how social crises may influence charitable donations. Zagefka and James (Reference Zagefka and James2015) systematic review illustrates how donors perceive and engage in helping victims of human and natural disasters. Empathy motivates donations for disaster victims unless donors view victims as part of the problem. When donors feel that the crisis victims are partially to blame—a phenomenon that occurs more often in the context of a human disaster than a natural disaster—donors are less likely to engage in giving. Natural disasters often lead to blameless victims, whereas victims of sociopolitical events, such as civil war, can be thought of as having a role in their situation (Zagefka et al., Reference Zagefka, Noor, Brown, de Moura and Hopthrow2011). Donors are motivated by empathy and a sense of efficacy in their donation, especially when considering multiple causes among which to donate (Kahneman & Ritov, Reference Kahneman and Ritov1994). This motivation can be diluted if there is any possibility the donor feels that the causes of the disaster do not align with their sociopolitical views (Chapman & Lickel, Reference Chapman and Lickel2016). For example, Chapman and Lickel (Reference Chapman and Lickel2016) identify that when disaster aid was solicited following a natural disaster caused by climate change, climate change skeptics were less likely to donate than individuals who believed in climate change.
These findings suggest that social identity may play a role in crisis giving. First, individuals who share an identity with crisis victims may be more likely to empathize with victims and thus, be less likely to assign blame to those victims. Second, as was the case with climate change skeptics (Chapman & Lickel, Reference Chapman and Lickel2016), social identities influence how individuals view and respond to particular social causes.
Case: The 2020 Crises in the USA
In 2020, Americans experienced two crises: the COVID-19 pandemic and racially motivated violence leading to a reignited racial justice movement. During this time, the philanthropic community received gifts estimating about $5.8 billion for COVID-19 relief efforts and over $220 million for racial justice (Mento, Reference Mento2020). Both of these crises were associated with specific racial/ethnic communities through the nature of the crises, media, and political rhetoric.
While many Americans died or were infected by Covid-19, communities of color were disproportionately affected by the hardships of the pandemic (Tyson et al., Reference Tyson, Lipka and Deane2025). The COVID–19 pandemic backlash was largely associated with the Asian community. For example, Shaw (Reference Shaw2021) highlighted that “for Asian Americans, managing risks around violence and the virus cannot be decoupled from each other.” In general, individuals of Asian descent faced increased discrimination in the U.S. during the COVID-19 pandemic (Ong & Zhang, Reference Ong and Zhang2021; Dai et al., Reference Dai, Gao and Radford2024; Arora & Kim, Reference Arora and Kim2020). Over 11,000 hate incidents against Asian Americans and Pacific Islanders were reported to Stop AAPI Hate (2023). The association between Asians and COVID-19 was in part driven by political rhetoric; President Trump famously referred to COVID-19 as the “kung flu” (BBC, 2020) and other racialized labels such as the “Chinese Virus” were used by media outlets (Han et al., Reference Han, Riddell and Piquero2023). This directing of blame created a sociopolitical crisis for the Asian community that extended beyond individuals of Chinese descent (Han et al., Reference Han, Riddell and Piquero2023; Wong, Reference Wong2020). Backlash and anti-Asian discrimination led to increased feelings of community and kinship among Asian individuals, as noted by one individual (Ruiz et al., Reference Ruiz, Im and Tian2023, 63–64):
“… I think it was just at that specific moment when I saw the Asian hate, Asian hate crimes, and I realized, ‘Oh, they’re targeting my people.’ I don’t know how to explain it exactly. I never really referred to myself just plainly as an Asian American, but when I saw it in that media and I saw people who looked like me or people who I related with getting hurt and mistreated, I felt anger for that community, for my community.”
Simultaneously, racially motivated violence during 2020 highlighted the racism faced by the Black/African American community. The deaths of George Floyd, Breonna Taylor, and Jacob Blake by local law enforcement and the death of Ahmaud Arbery received nationwide media coverage, reigniting the racial justice movement, which highlighted one underlying issue in generations of systemic political oppression: the racial disparity in the use of force by local police departments. Mapping Police Violence (2025) reports Black Americans were 2.8 times more likely than White Americans to be killed at the hands of police.
In response, the Black Lives Matter (BLM) movement garnered increased media attention and public support for its work in fighting for racial equality (Parker, Reference Parker2022).Footnote 1 Donations quickly poured into GoFundMe campaigns and nonprofit organizations like BLM, who were already experiencing an uptick of donations due to COVID (Williams-Pulfer & Osili, Reference Williams-Pulfer and Osili2020). Black, Hispanic, Asian, and White donors supported BLM in 2020, with the most consistent support coming from the Black community (Thomas & Horowitz, Reference Thomas and Horowitz2020).
In short, both 2020 crises had strong associations with particular racial/ethnic groups: the COVID-19 pandemic with the Asian community and racially motivated violence toward the Black community. These associations allow us to test our expectations about social identity’s role in giving during a particular context.
Social Identities, Crisis, and Donations
Individuals who identify with a community in crisis will be more likely to donate to causes focused on relief or recovery efforts. Social identity theory tells us that individuals who identify with a particular group can engage in behaviors that protect their group or choose to distance themselves if the group is being targeted (Tajfel and Turner, 1979/Reference Tajfel and Turner2024; Chapman et al., Reference Chapman, Masser and Louis2020). Furthermore, donors are more likely to engage in philanthropic behavior if donations are made with their group as the beneficiaries (Chapman et al., Reference Chapman, Masser and Louis2020). We argue that a social crisis may trigger protective action among group members through donations to organizations that support their collective identity group’s relief and recovery efforts.
In general, we expect donors with an identity under crisis will support their communities because they identify or understand their experiences, especially when identities are primed. Racial priming literature suggests that “intertwined issue-group connections also increase the likelihood that calling attention to certain issues can prime racial group considerations without ever mentioning the group explicitly” (Valenzuela & Reny, Reference Valenzuela and Reny2020, 451). In 2020, two racial identities were primed by political rhetoric and media. If social identity is primed by crisis, then we expect that:
H1: Donors will be more likely to donate to social causes that match their social identity.
In particular, we have strong expectations over certain groups given the 2020 crises:
H1A: Individuals identifying as Black/African American will be more likely than White donors to donate to BLM causes.
H1B: Individuals identifying as Asian American will be more likely than White donors to donate to COVID-related causes.
Additionally, individuals with a shared identity are less likely to assign blame to their community (Erlandsson & Dickert, Reference Erlandsson and Dickert2024; Zagefka et al., Reference Zagefka, Noor, Brown, de Moura and Hopthrow2011) and want to benefit their group’s recovery efforts directly. While these reactions may be true for all, we expect these reactions to be strongest among folks who share identities with crisis victims. This intention closes the social distance between the beneficiary under crisis and the individual’s identity group with the donor understanding how their donation could assist the beneficiary (Drezner, Reference Drezner2009). In general, we expect that:
H2: Donors are more likely to make donations that benefit their own racial and ethnic groups.
As before, we have strong expectations over certain groups:
H2A: Individuals who identify as Black or African American will be more likely than White donors to identify their donations were made in support of their racial and ethnic group.
H2B: Individuals who identify as Asian Americans will be more likely than White donors to identify their donations were made in support of their racial and ethnic group.
Lastly, we expect communities of color to be most likely to empathize with victims who share their group identity under crisis, thinking about protecting their community and fellow beneficiaries as suggested by social identity theory. Those motivated to protect and benefit their community will be more likely to donate to crisis efforts than individuals who do not view their collective identity group as a beneficiary of their donation. We expect the following:
H3: Individuals who indicate their racial/ethnic group as a beneficiary of their donation are more likely than individuals who do not identify their racial/ethnic group as a beneficiary to donate to social causes that match their social identity.
With regards to the 2020 case, we expect that:
H3A: Black/African American individuals who indicate their donations will benefit their racial and ethnic group are more likely than Black/African American individuals who do not indicate their racial/ethnic group as a beneficiary to donate to BLM.
H3B: Asian American individuals who indicate their donations will benefit their racial and ethnic group to benefit from their donations are more likely than Asian American individuals who do not indicate their racial/ethnic group as a beneficiary to donate to COVID-19 relief efforts.
Data and Research Design
To test our identity-based giving hypotheses, we use individual-level survey data from the 2020 Collaborative Multiracial Post-Election Survey (CPMS) (Frasure et al., Reference Frasure, Wong, Vargas and Bareto2020). The 2020 CMPS interviewed over 17,000 White, Hispanic/Latinx,Footnote 2 Black, and Asian respondents in various languages using a self-administered, web-based platform. This collaborative survey oversamples minority respondents and asks a broad range of questions related to politics and policy, with the intention of creating larger group samples to support investigations of underrepresented groups (Frasure et al., Reference Frasure, Wong, Vargas and Barreto2025).Footnote 3 By using the CMPS data, we are able to analyze giving both between and within racial/ethnic communities. Further, the 2020 CMPS survey was administered from April 2, 2021, to October 4, 2021, allowing us to assess how individual and beneficiary identities relate to donations made during the 2020 crises.
Independent Variable
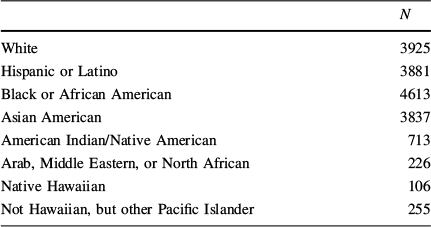
Our independent variable is a respondent’s primary racial/ethnic identity. We use the CMPS’s primary race variable, which measures if a respondent primarily self-identifies as “White,”Footnote 4 “Hispanic or Latinx,” “Black or African American,” “Asian American,” “American Indian/Native American,” “Arab, Middle Eastern or North African,” “Hawaiian,” or “Not Hawaiian, but other Pacific Islander.” Given our focus, we do not include “American Indian/Native American,” “Arab, Middle Eastern, or North African,” and “Not Hawaiian, but other Pacific Islander” respondents in our analyses. The frequencies of each primary racial/ethnic category in our sample are provided in Table 1 and Appendix Table 7 provides the breakdown of full primary racial/ethnic categories.
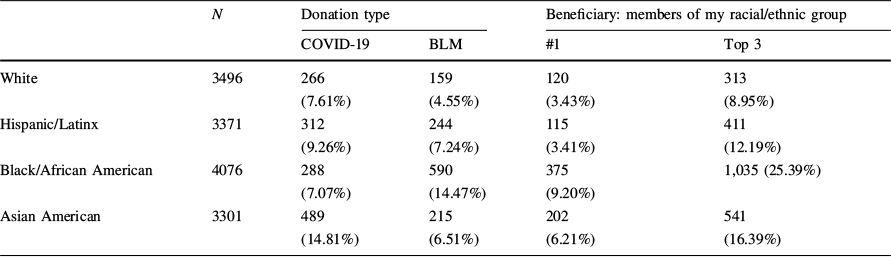
Dependent variables by race/ethnicity of respondent
|
N |
Donation type |
Beneficiary: members of my racial/ethnic group |
|||
|---|---|---|---|---|---|
|
COVID-19 |
BLM |
#1 |
Top 3 |
||
|
White |
3496 |
266 (7.61%) |
159 (4.55%) |
120 (3.43%) |
313 (8.95%) |
|
Hispanic/Latinx |
3371 |
312 (9.26%) |
244 (7.24%) |
115 (3.41%) |
411 (12.19%) |
|
Black/African American |
4076 |
288 (7.07%) |
590 (14.47%) |
375 (9.20%) |
1,035 (25.39%) |
|
Asian American |
3301 |
489 (14.81%) |
215 (6.51%) |
202 (6.21%) |
541 (16.39%) |
% of respondents based on total n per racial/ethnic group
Dependent Variables
We included questions in the CMPS to measure whether respondents gave to particular causes and who the intended recipient, or target beneficiary, was of the respondents' donation(s). Our first question asked the respondent, “In the past year, have you made a monetary donation of at least $20 to any of the following organizations, please select all that apply.” Respondents were given the following list of causes: religious organization, political party or candidate, social/human services organization, COVID relief efforts, Black Lives Matter, police association, political civic group (not a political party). Respondents were also given the opportunity to select “No, none of these.” Respondents were asked to identify all groups to whom they gave more than $20. We created a binary variable for each type of organization: 0 if the respondent did not give to that particular social cause, and 1 if the respondent did give to this cause during 2020. Table 1 displays the counts of these variables by race/ethnicity of respondents.
Our second dependent variable is who respondents believe their donations are most likely to support. We asked: “Who do you expect to benefit from your largest donations, please rank the top 3 groups you expect to benefit the most with the numbers 1, 2, 3.” Respondents ranked their top 1, 2, and 3 beneficiaries from this list: Children/youth, Low-income individuals/families, Women, Members of my racial/ethnic group, Immigrants, Asylum Seekers, Refugees, Formerly Incarcerated Individuals, Military Families/Veterans, Environment/Animals, Police Officers/Fraternal Orders of Police, Individuals affected by COVID Pandemic, Small Businesses, Scientists/Research, Gun Owners, Political/Local Campaign/Super PAC. Children/youth, low-income individuals/families, and members of my racial/ethnic group were consistently ranked highly among survey respondents (Fig. 1). Within our sample, higher percentages of Black (9.89%) and Asian (6.44%) respondents selected “my racial/ethnic group” as their top beneficiary. However, White respondents (3.29%) were not statistically different from Hispanic individuals (3.38%) in their selection of “members of my racial/ethnic group” as their top beneficiary (t = − 0.2190, p = 0.8266), suggesting White individuals willingly selected this beneficiary category.
Comparison of primary beneficiaries by race/ethnicity of respondent. Frequency of top (#1) beneficiary by race/ethnicity of respondent
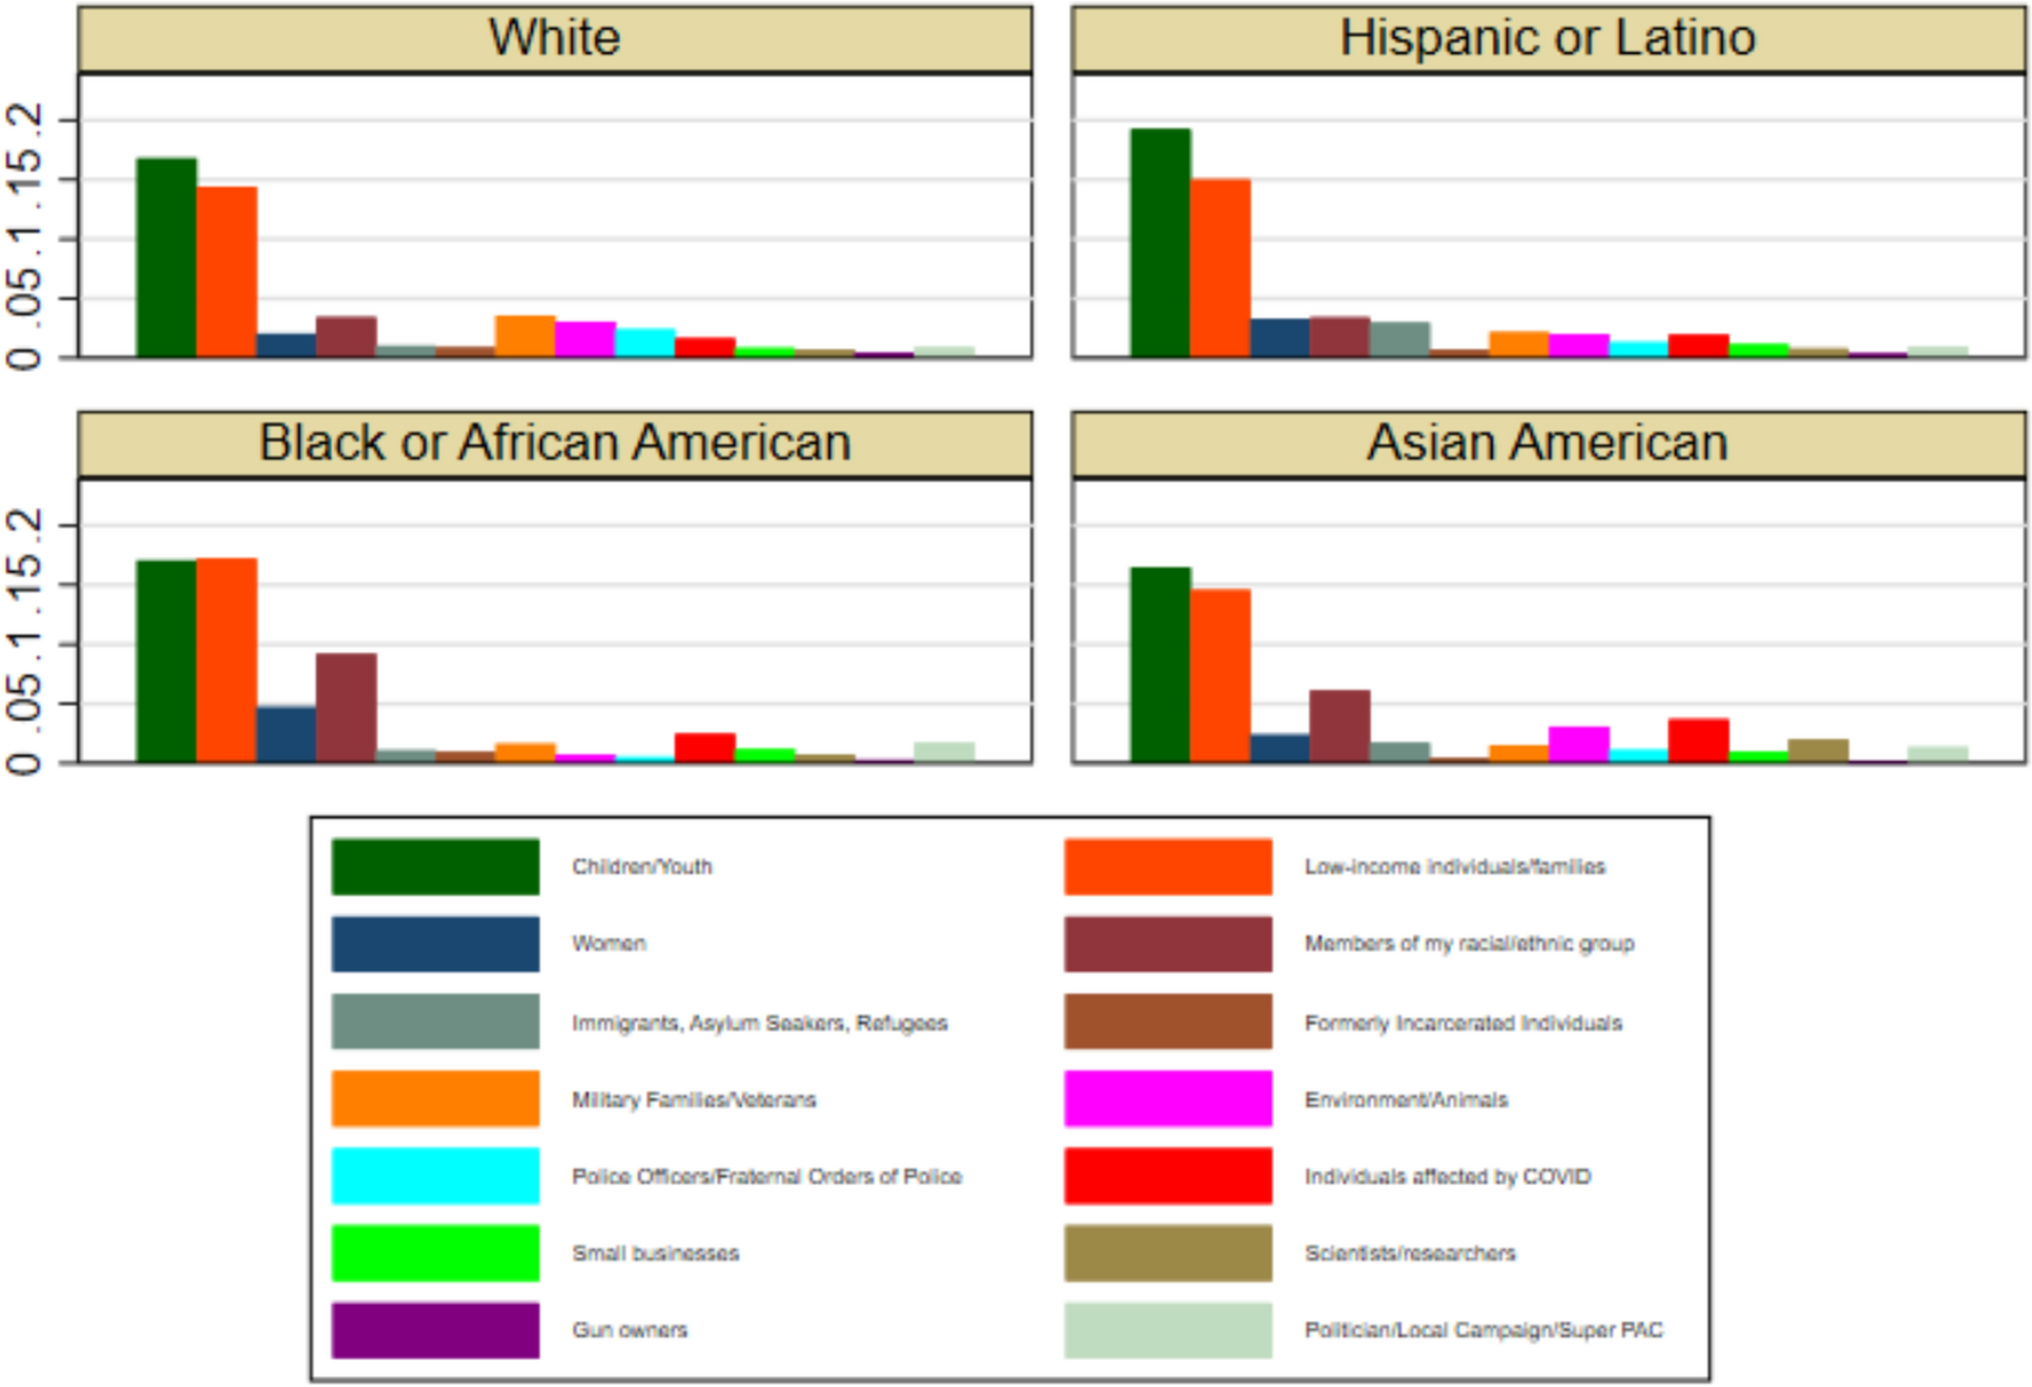
Critically, this question measures the intended beneficiary of a respondent’s largest donation, as indicated by the donor. In asking this question, we do not have to assume the intended beneficiary or the donor’s intentions based on organizational type, therefore bypassing concern over relying on an organization’s mission to infer donor intentions. From these beneficiary data, we created two binary variables. If a respondent ranked “members of my racial/ethnic group” within their top 3 choices of beneficiaries, we assigned this variable a value of 1, and 0, otherwise. Similarly, if a respondent selected “members of my race/ethnicity” as their top, or number one, beneficiary, then this variable assumes a value of 1, and 0, otherwise.
Control Variables
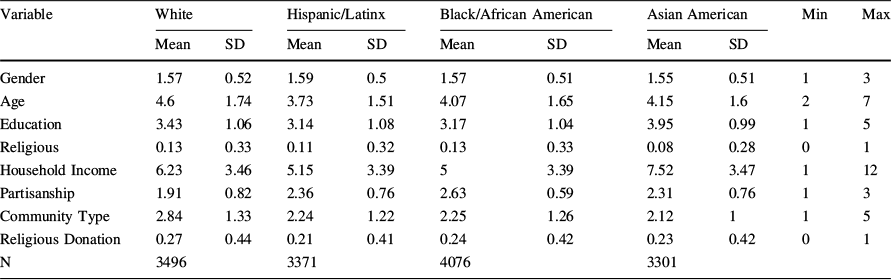
To isolate how racial identity impacts giving behavior, we employ a host of control variables shown to increase the likelihood of giving, as well as variables that have well-documented relationships to race/ethnicity: gender, age, education level, and household income, whether or not an individual considers themselves to be religious, political partisanship, and information about the respondent’s community context.Footnote 5 Gender is measured categorically, wherein respondents self-identify as male, female, or nonbinary or another gender identity. We measure political partisanship as respondents’ self-identified political party: Republican, Independent, or Democrat. Respondents could indicate they belong to “another” political party. Because no further information on what party individuals belong to is available, we drop these “other party” observations from the analysis. Community type is an ordinal variable that asks respondents to indicate whether they live in a large urban area, a large suburb near a large city, a small suburb near a small city, a small town or small city, or a rural area. We include information on a respondent’s community type instead of broader measures of geographic variation (e.g., state fixed effects), given how BLM and COVID affected different types of communities. For instance, these crises affected rural and urban communities differently, but we expect similarities among rural and urban communities to be relatively similar across state lines. Finally, we measure religiosity as whether a respondent indicated their religious identity was important to them. We also include a control for whether a respondent indicated they donated to a religious organization to account for a type of giving that is robust to crisis. Given the importance of religious giving to racial/ethnic communities (Yasin et al., Reference Yasin, Adams and King2020), we feel that this is good baseline control for individuals’ giving during times of non-crisis. Our analysis drops observations with missing control data, such as respondents who did not provide their household income. This resulted in a final sample size of 14,244 respondents. See Table 2 for summary statistics for control variables by racial/ethnic subgroup.
Summary statistics of control variables by racial/ethnic subgroup
|
Variable |
White |
Hispanic/Latinx |
Black/African American |
Asian American |
Min |
Max |
||||
|---|---|---|---|---|---|---|---|---|---|---|
|
Mean |
SD |
Mean |
SD |
Mean |
SD |
Mean |
SD |
|||
|
Gender |
1.57 |
0.52 |
1.59 |
0.5 |
1.57 |
0.51 |
1.55 |
0.51 |
1 |
3 |
|
Age |
4.6 |
1.74 |
3.73 |
1.51 |
4.07 |
1.65 |
4.15 |
1.6 |
2 |
7 |
|
Education |
3.43 |
1.06 |
3.14 |
1.08 |
3.17 |
1.04 |
3.95 |
0.99 |
1 |
5 |
|
Religious |
0.13 |
0.33 |
0.11 |
0.32 |
0.13 |
0.33 |
0.08 |
0.28 |
0 |
1 |
|
Household Income |
6.23 |
3.46 |
5.15 |
3.39 |
5 |
3.39 |
7.52 |
3.47 |
1 |
12 |
|
Partisanship |
1.91 |
0.82 |
2.36 |
0.76 |
2.63 |
0.59 |
2.31 |
0.76 |
1 |
3 |
|
Community Type |
2.84 |
1.33 |
2.24 |
1.22 |
2.25 |
1.26 |
2.12 |
1 |
1 |
5 |
|
Religious Donation |
0.27 |
0.44 |
0.21 |
0.41 |
0.24 |
0.42 |
0.23 |
0.42 |
0 |
1 |
|
N |
3496 |
3371 |
4076 |
3301 |
||||||
Min and max are consistent across racial/ethnic groups. Gender: (1) Male, (2) Female, (3) Non-binary or other gender; Age: (2) 18–29, (3) 30–39, (4) 40–49, (5) 50–59, (6) 60–69, (7) 70+; Education: (1) Less than HS degree, (2) HS degree, (3) Some college or Associate’s degree, (4) Bachelor’s degree, (5) Post-graduate degree; Religious: (0) Not religious, (1) Religious; Household Income: (1) Less than $20,000 (2) $20,000–$29,999 (3) $30,000–$39,999 (4) $40,000–$49,999 (5) $50,000–$59,999 (6) $60,000–$69,999 (7) $70,000–$79,999 (8) $80,000–$89,999 (9) $90,000–$99,999 (10) $100,000–$149,999 (11) $150,000–$199,999 (12) $200,000+; Partisanship: (1) Republican, (2) Independent, (3) Democrat; Community Type: (1) Large urban area, (2) Large suburb near large city, (3) Small suburb near small town or city, (4) Small town or small city, (5) Rural area; Religious Donation: (0) Did not make a religious donation of at least $20 in the past year, (1) Made a religious donation of at least $20 in the past year
Research Design
To test Hypotheses 1 and 2, we estimate a series of binomial logit models against our measure of whether an individual indicated they donated to a particular cause or whether an individual indicated their top or top three donations would benefit a member of their racial/ethnic group. Our tests of Hypotheses 1 and 2 are regressed against the entire sample of respondents, allowing us to compare donation behavior between racial and ethnic identities. In these analyses, the referent category is “White.” Hypothesis 3 examines our proposed mechanisms of identity giving, again estimating a binomial logit model against our measure of whether an individual indicated they donated to a particular cause. We estimate this model against a subset of our sample (e.g., Black/African American or Asian respondents) to examine within-group variation and include our beneficiaries measure as a predictor within the model as a proxy for our proposed mechanism. This design allows us to assess whether Black or Asian individuals who expected their donation to benefit their racial/ethnic contemporaries were more likely than Black or Asian individuals who did not expect their donation to benefit their racial/ethnic contemporaries to donate to a particular cause. Given the nonlinear estimates produced by binary logit models, we present our results as a series of marginal effect plots. The Appendix contains a series of robustness checks in Tables A2-A6, all producing results consistent with those presented below.
Results
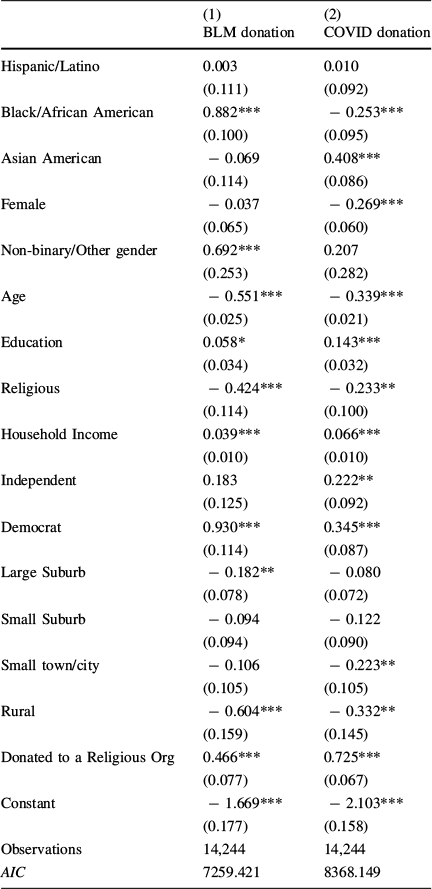
Hypothesis 1 states that donors will be more likely to donate to social causes that reflect their social identity. We expect that individuals who identify as Black/African American will be more likely than White donors to donate to Black Lives Matter (BLM) (Hypothesis 1A), and individuals who identify as Asian American will be more likely than White donors to donate to COVID relief efforts (Hypothesis 1B). In general, we find support for Hypothesis 1 (Table 3).
Binary logit estimates testing Hypothesis 1 (donation types)

|
(1) |
(2) |
|
|---|---|---|
|
BLM donation |
COVID donation |
|
|
Hispanic/Latino |
0.003 |
0.010 |
|
(0.111) |
(0.092) |
|
|
Black/African American |
0.882*** |
− 0.253*** |
|
(0.100) |
(0.095) |
|
|
Asian American |
− 0.069 |
0.408*** |
|
(0.114) |
(0.086) |
|
|
Female |
− 0.037 |
− 0.269*** |
|
(0.065) |
(0.060) |
|
|
Non-binary/Other gender |
0.692*** |
0.207 |
|
(0.253) |
(0.282) |
|
|
Age |
− 0.551*** |
− 0.339*** |
|
(0.025) |
(0.021) |
|
|
Education |
0.058* |
0.143*** |
|
(0.034) |
(0.032) |
|
|
Religious |
− 0.424*** |
− 0.233** |
|
(0.114) |
(0.100) |
|
|
Household Income |
0.039*** |
0.066*** |
|
(0.010) |
(0.010) |
|
|
Independent |
0.183 |
0.222** |
|
(0.125) |
(0.092) |
|
|
Democrat |
0.930*** |
0.345*** |
|
(0.114) |
(0.087) |
|
|
Large Suburb |
− 0.182** |
− 0.080 |
|
(0.078) |
(0.072) |
|
|
Small Suburb |
− 0.094 |
− 0.122 |
|
(0.094) |
(0.090) |
|
|
Small town/city |
− 0.106 |
− 0.223** |
|
(0.105) |
(0.105) |
|
|
Rural |
− 0.604*** |
− 0.332** |
|
(0.159) |
(0.145) |
|
|
Donated to a Religious Org |
0.466*** |
0.725*** |
|
(0.077) |
(0.067) |
|
|
Constant |
− 1.669*** |
− 2.103*** |
|
(0.177) |
(0.158) |
|
|
Observations |
14,244 |
14,244 |
|
AIC |
7259.421 |
8368.149 |
Standard errors in parentheses. Reference categories: White (Race/Ethnicity), Male (Gender), Republican (Partisanship), Urban (Community Type). * p < 0.10, **p < 0.05, ***p < 0.01
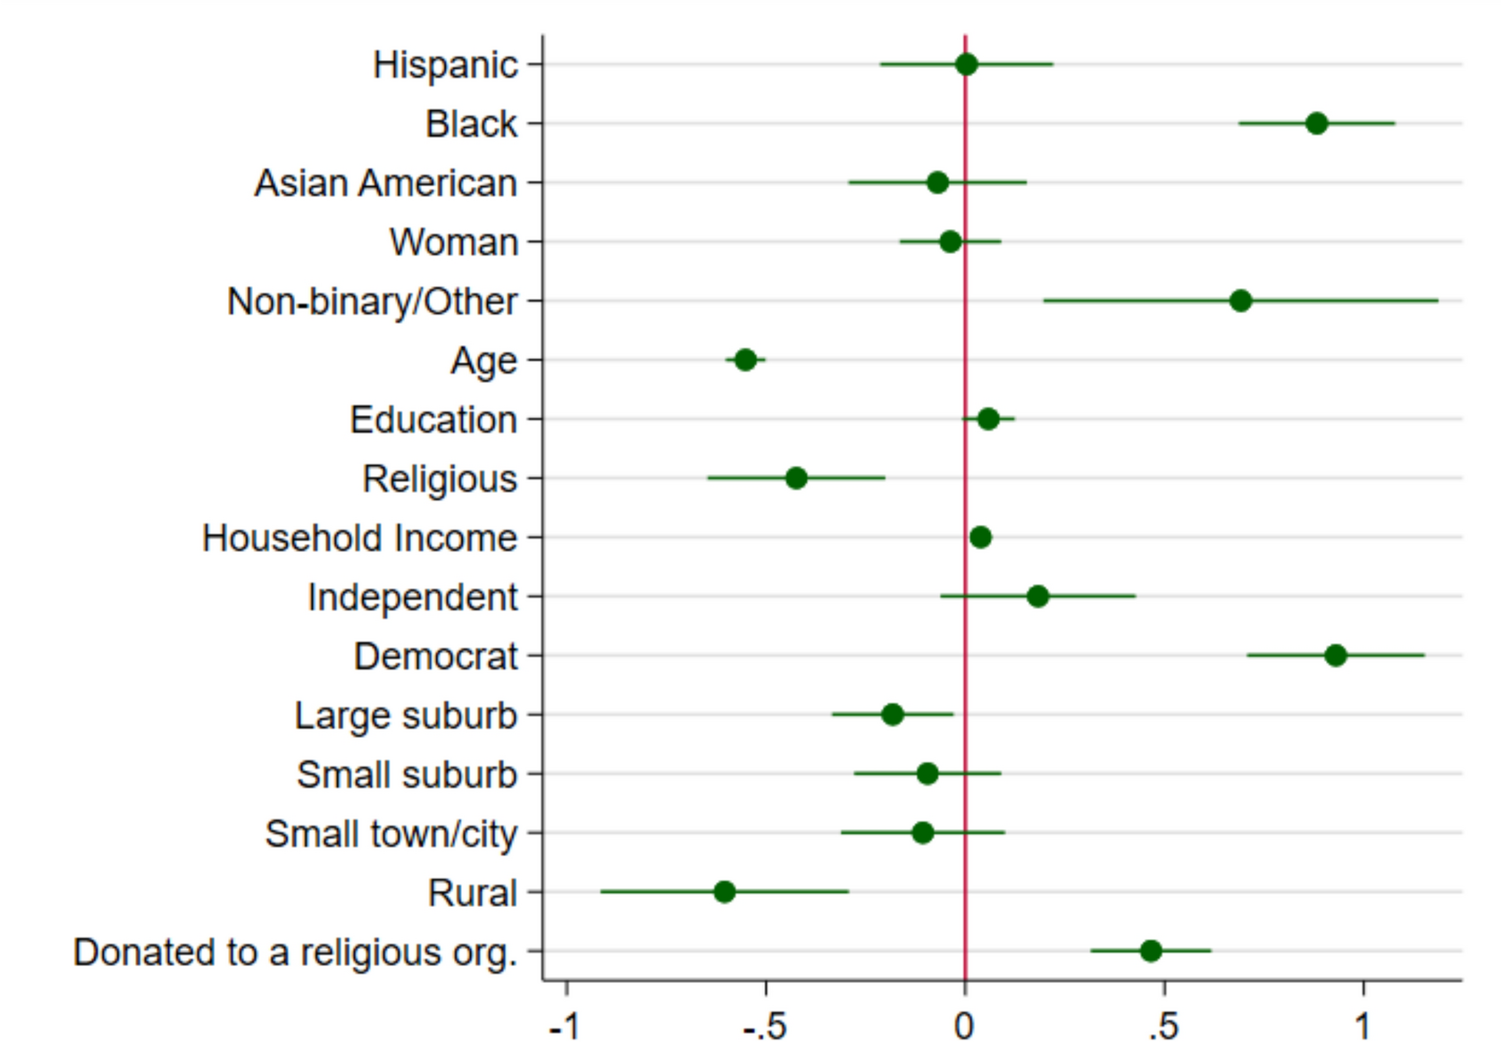
Individuals identifying as Black are more likely than White individuals to indicate that they donated to BLM causes (Model 1). Figure 2 displays the marginal effects of a 1-unit change in the variables in Model 1 on the probability of donating to a BLM relief effort. Figure 2 should be interpreted as the marginal effect of an individual primarily identifying as Black compared to a White individual donating to BLM. Black-identifying individuals are 7% more likely than White individuals to donate to BLM relief efforts (AME = 0.070, p < 0.000).
Marginal effect of variables on donations to black lives matter (BLM). Based on Model 1 (Table 3) estimates. Thin bars represent 95% confidence intervals

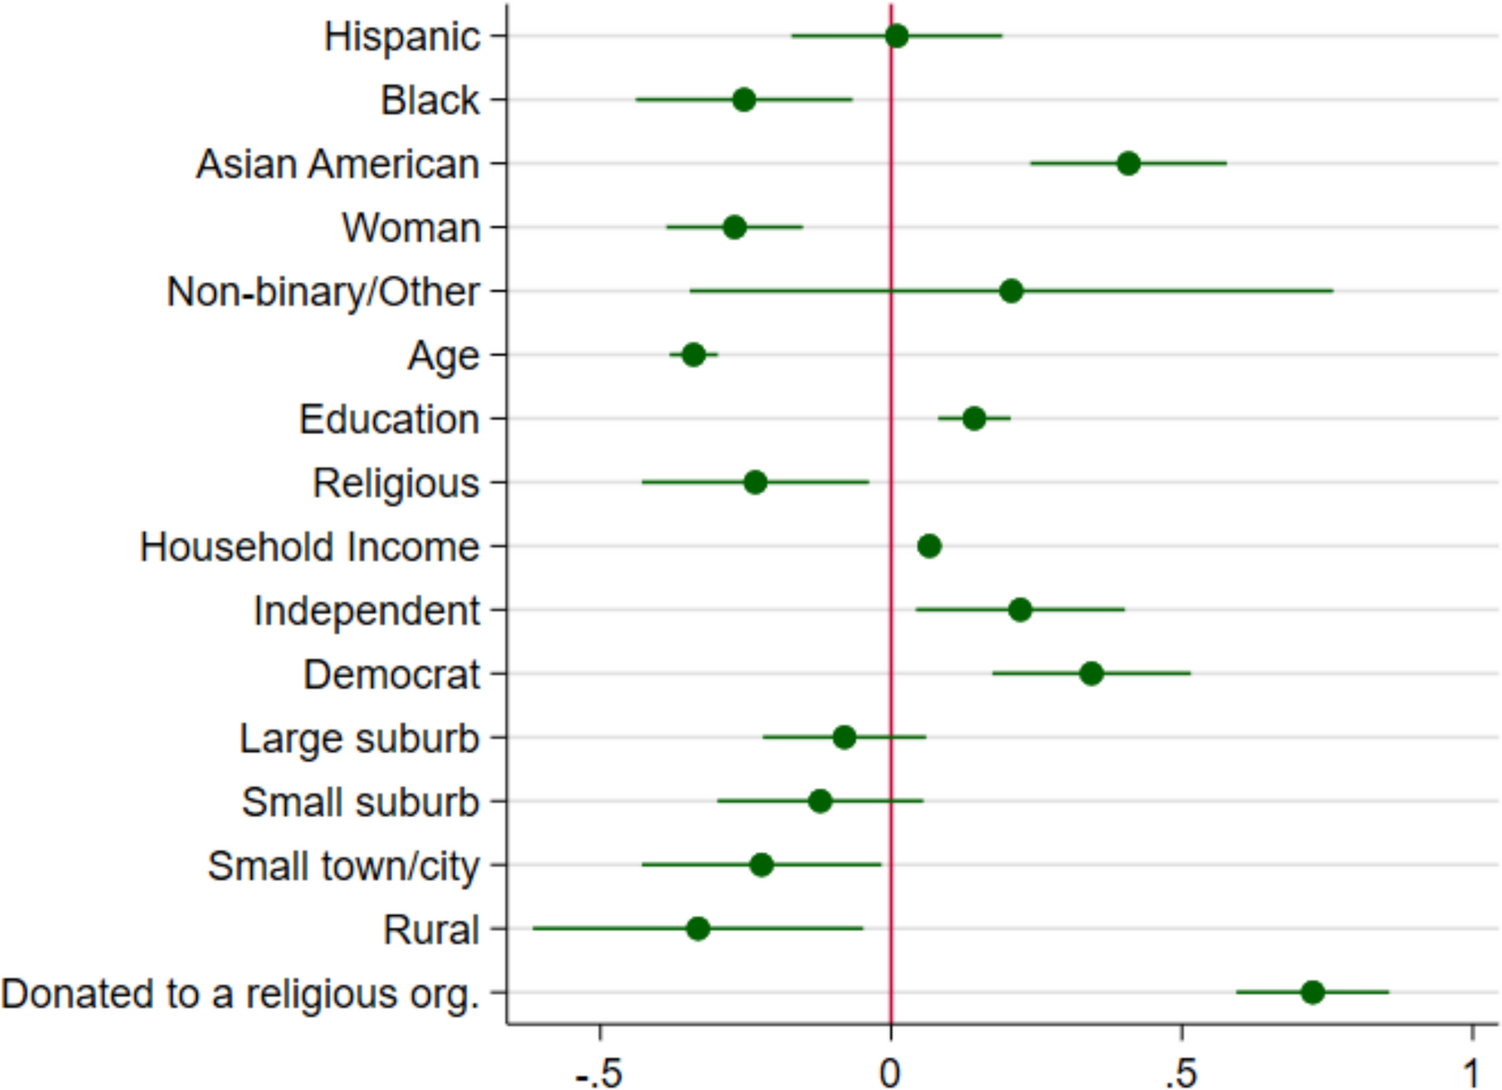
Individuals identifying as Asian are more likely than White individuals to indicate donating to COVID-19 relief efforts (Model 2). Figure 3 displays the marginal effects of a 1-unit change in the variables in Model 2 on the probability of donating to a COVID relief effort organization. Figure 3 should be interpreted as the marginal effect of an individual primarily identifying as Asian, compared to a White individual, on donating to a COVID relief effort. Individuals who primarily identify as Asian are 4% more likely than White individuals to donate to a COVID relief effort (AME = 0.038, p < 0.000).
Marginal effect of variables on donations to Covid relief efforts. Based on Model 2 (Table 3) estimates. Thin bars represent 95% confidence intervals

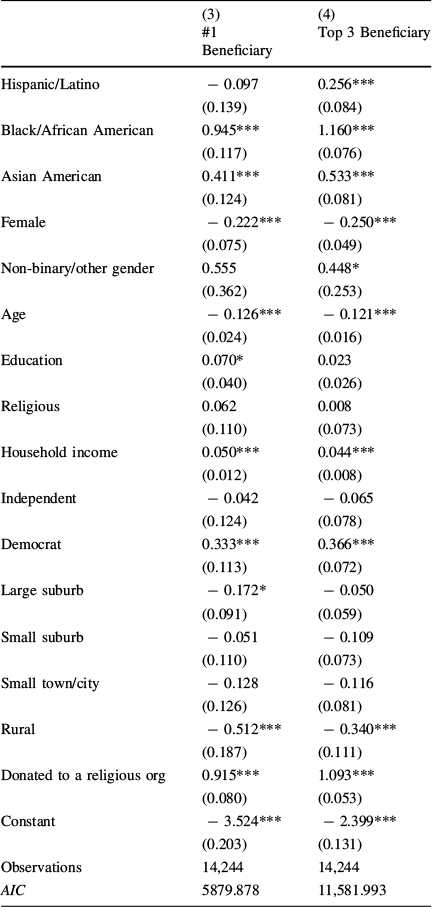
Hypothesis 2 states that donations are made intentionally to benefit a donor’s racial/ethnic group. We expect that individuals who identify as Black will be more likely than White donors to identify their donations were made in support of their racial and ethnic group (Hypothesis 2a), and individuals who identify as Asian will be more likely than White donors to identify their donations were made in support of their racial and ethnic group (Hypothesis 2b). In general, we find support for Hypothesis 2 (Table 4).
Binary logit estimates testing Hypothesis 2 (beneficiaries of donations)
|
(3) |
(4) |
|
|---|---|---|
|
#1 Beneficiary |
Top 3 Beneficiary |
|
|
Hispanic/Latino |
− 0.097 |
0.256*** |
|
(0.139) |
(0.084) |
|
|
Black/African American |
0.945*** |
1.160*** |
|
(0.117) |
(0.076) |
|
|
Asian American |
0.411*** |
0.533*** |
|
(0.124) |
(0.081) |
|
|
Female |
− 0.222*** |
− 0.250*** |
|
(0.075) |
(0.049) |
|
|
Non-binary/other gender |
0.555 |
0.448* |
|
(0.362) |
(0.253) |
|
|
Age |
− 0.126*** |
− 0.121*** |
|
(0.024) |
(0.016) |
|
|
Education |
0.070* |
0.023 |
|
(0.040) |
(0.026) |
|
|
Religious |
0.062 |
0.008 |
|
(0.110) |
(0.073) |
|
|
Household income |
0.050*** |
0.044*** |
|
(0.012) |
(0.008) |
|
|
Independent |
− 0.042 |
− 0.065 |
|
(0.124) |
(0.078) |
|
|
Democrat |
0.333*** |
0.366*** |
|
(0.113) |
(0.072) |
|
|
Large suburb |
− 0.172* |
− 0.050 |
|
(0.091) |
(0.059) |
|
|
Small suburb |
− 0.051 |
− 0.109 |
|
(0.110) |
(0.073) |
|
|
Small town/city |
− 0.128 |
− 0.116 |
|
(0.126) |
(0.081) |
|
|
Rural |
− 0.512*** |
− 0.340*** |
|
(0.187) |
(0.111) |
|
|
Donated to a religious org |
0.915*** |
1.093*** |
|
(0.080) |
(0.053) |
|
|
Constant |
− 3.524*** |
− 2.399*** |
|
(0.203) |
(0.131) |
|
|
Observations |
14,244 |
14,244 |
|
AIC |
5879.878 |
11,581.993 |
Standard errors in parentheses. Reference categories: White (Race/Ethnicity), Male (Gender), Republican (Partisanship), Urban (Community Type)
*p < 0.10, **p < 0.05, ***p < 0.01
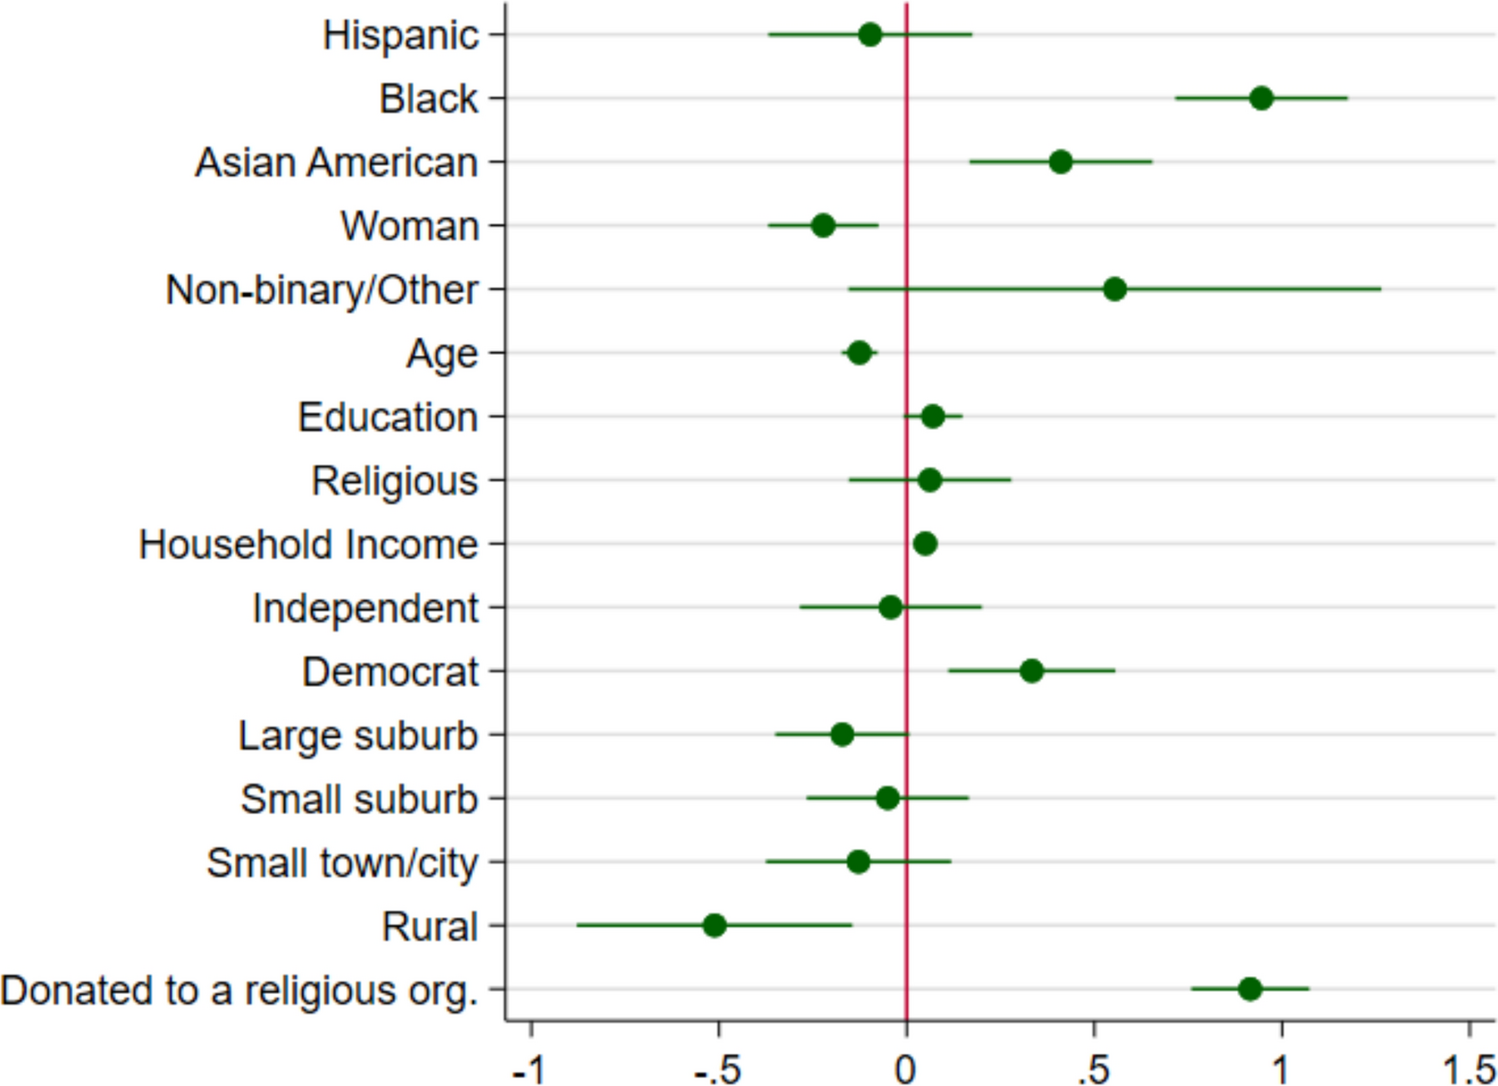
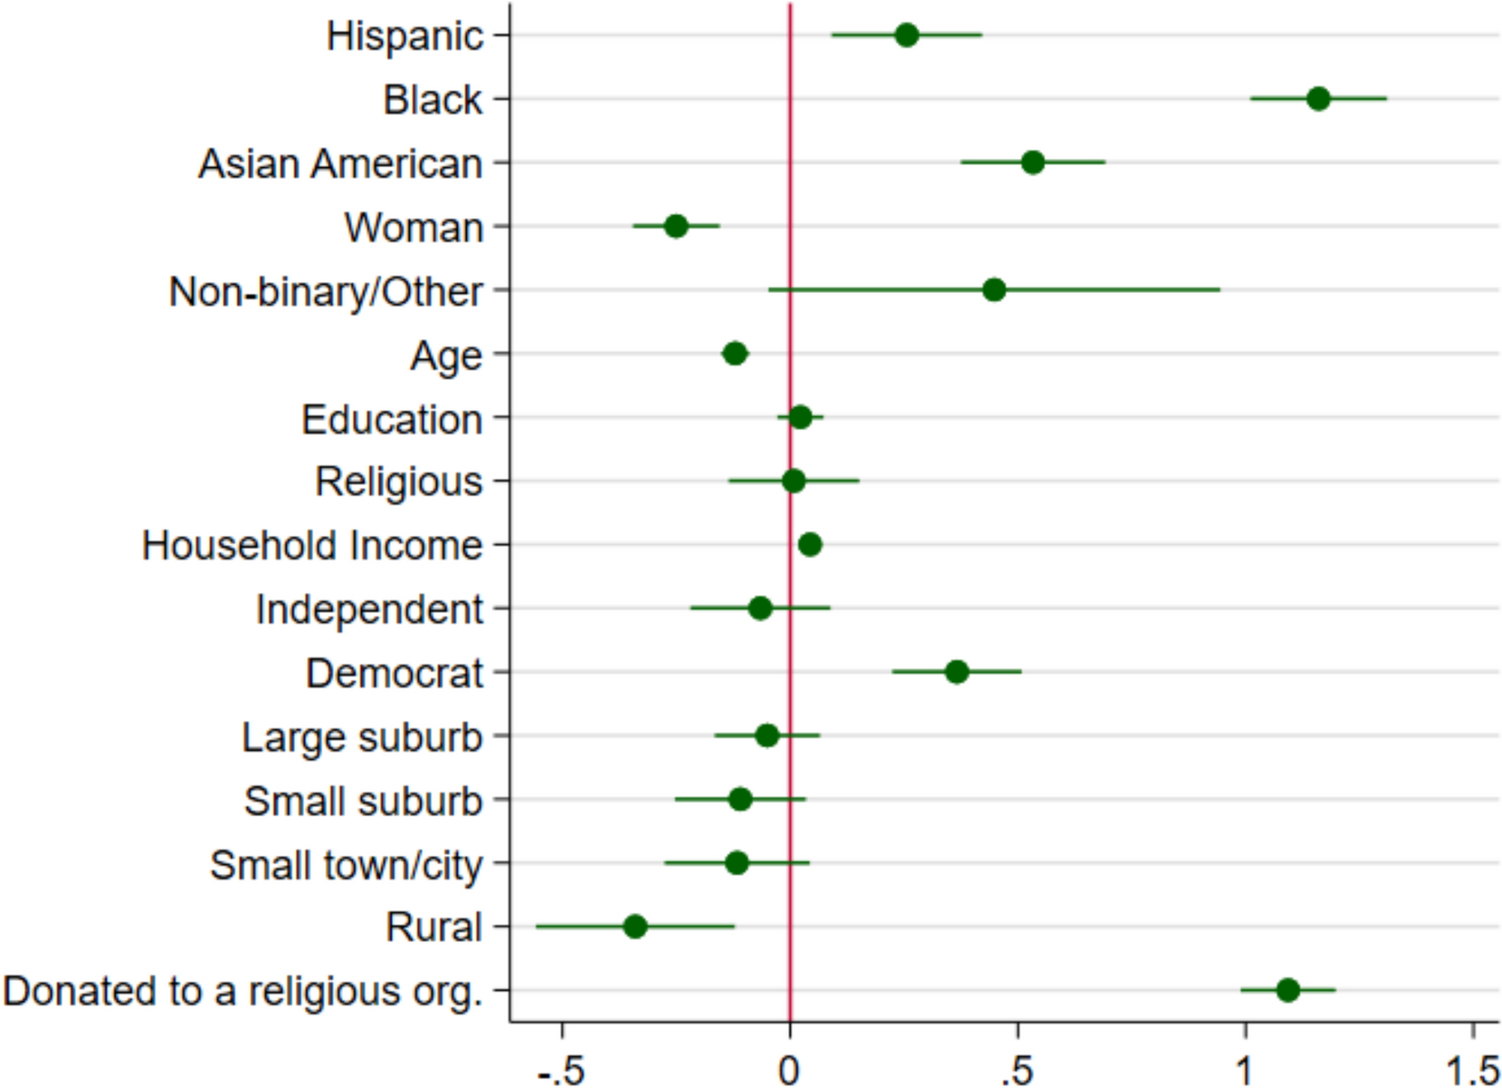
Individuals identifying as Black and Asian are more likely than White individuals to indicate “members of my racial/ethnic group” as the top (e.g., #1) beneficiary and within the top three beneficiaries of their 2020 donations. Figure 4 displays the marginal effects of 1-unit change in the variables in Model 3 on the probability of a survey respondent identifying “members of my racial/ethnic group” as the top beneficiary of their 2020 donations. Black-identifying individuals are 5% more likely than White individuals to identify members of their racial/ethnic group as the top beneficiary (AME = 0.053, p < 0.000). Asian-identifying individuals are 2% more likely than White individuals to identify members of their racial/ethnic group as the top beneficiary (AME = 0.018, p < 0.01). These probabilities increase when examining the top 3 beneficiaries (Fig. 5). Taken together, these results suggest that Asian and Black individuals were more likely than White individuals to donate to relief efforts for crises associated with their racial identities in 2020.
Marginal effect of variables on #1 intended beneficiary. Based on Model 3 (Table 4) estimates. Thin bars represent 95% confidence intervals
Marginal effect of variables on top 3 intended beneficiary recipients. Based on Model 4 (Table 4) estimates. Thin bars represent 95% confidence intervals

These patterns exist while controlling for other correlates of giving. As income and education increase, the likelihood of donating to BLM, COVID-19, or identifying racial/ethnic co-members as beneficiaries increases. Older individuals and individuals living in rural areas are less likely to make these types of donations or to identify racial/ethnic co-members as beneficiaries. Females are less likely than males to donate to COVID relief causes or indicate the beneficiary of their gift is someone who shares their racial/ethnic identity. Non-binary or other gendered individuals are more likely than males to donate to BLM efforts. Independents and Democrats are more likely than Republicans to donate to COVID-19 relief efforts, but only Democrats are more likely than Republicans to donate to BLM causes or to indicate their gift benefits racial/ethnic co-members. Religious individuals are less likely than non-religious individuals to donate to BLM or COVID causes. Finally, individuals who donate to a religious organization are more likely to make these other types of donations and to identify beneficiaries as members of their racial/ethnic group.
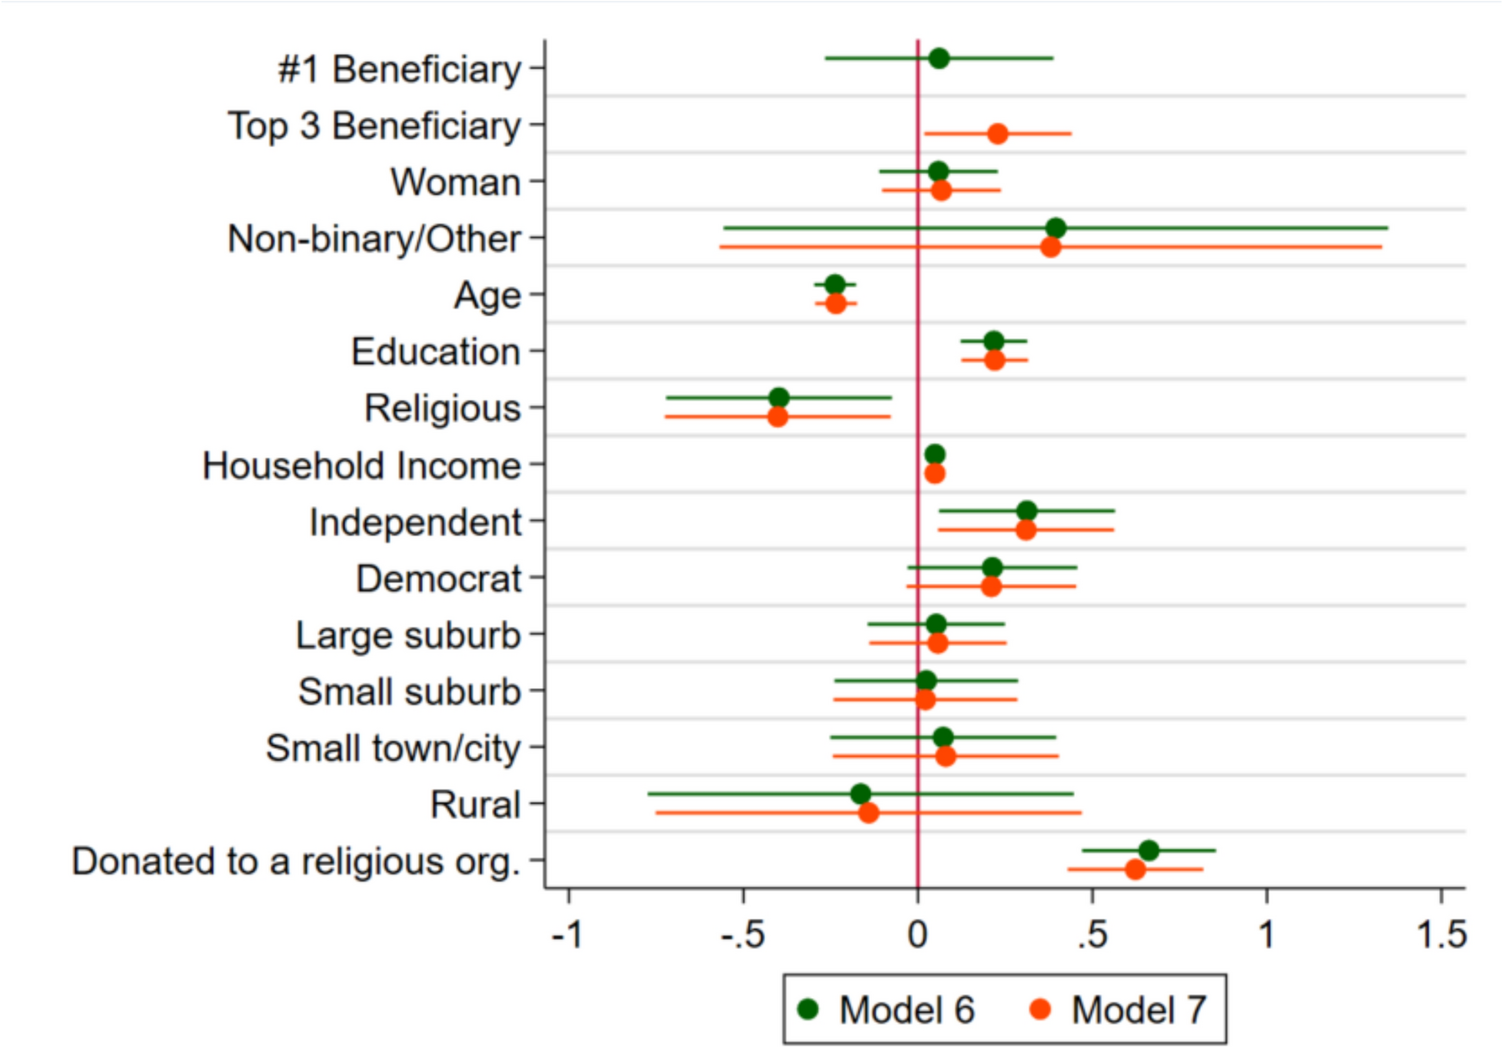
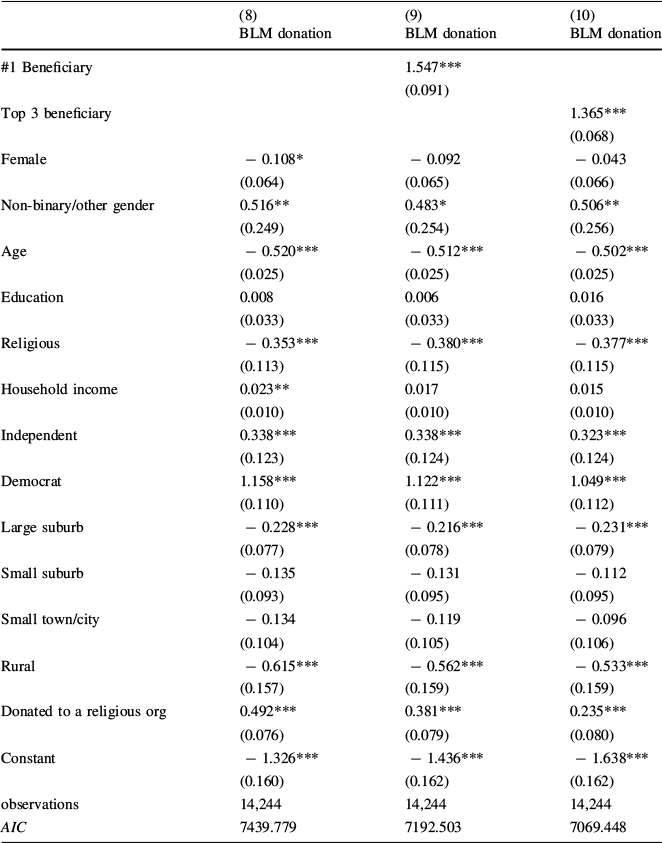
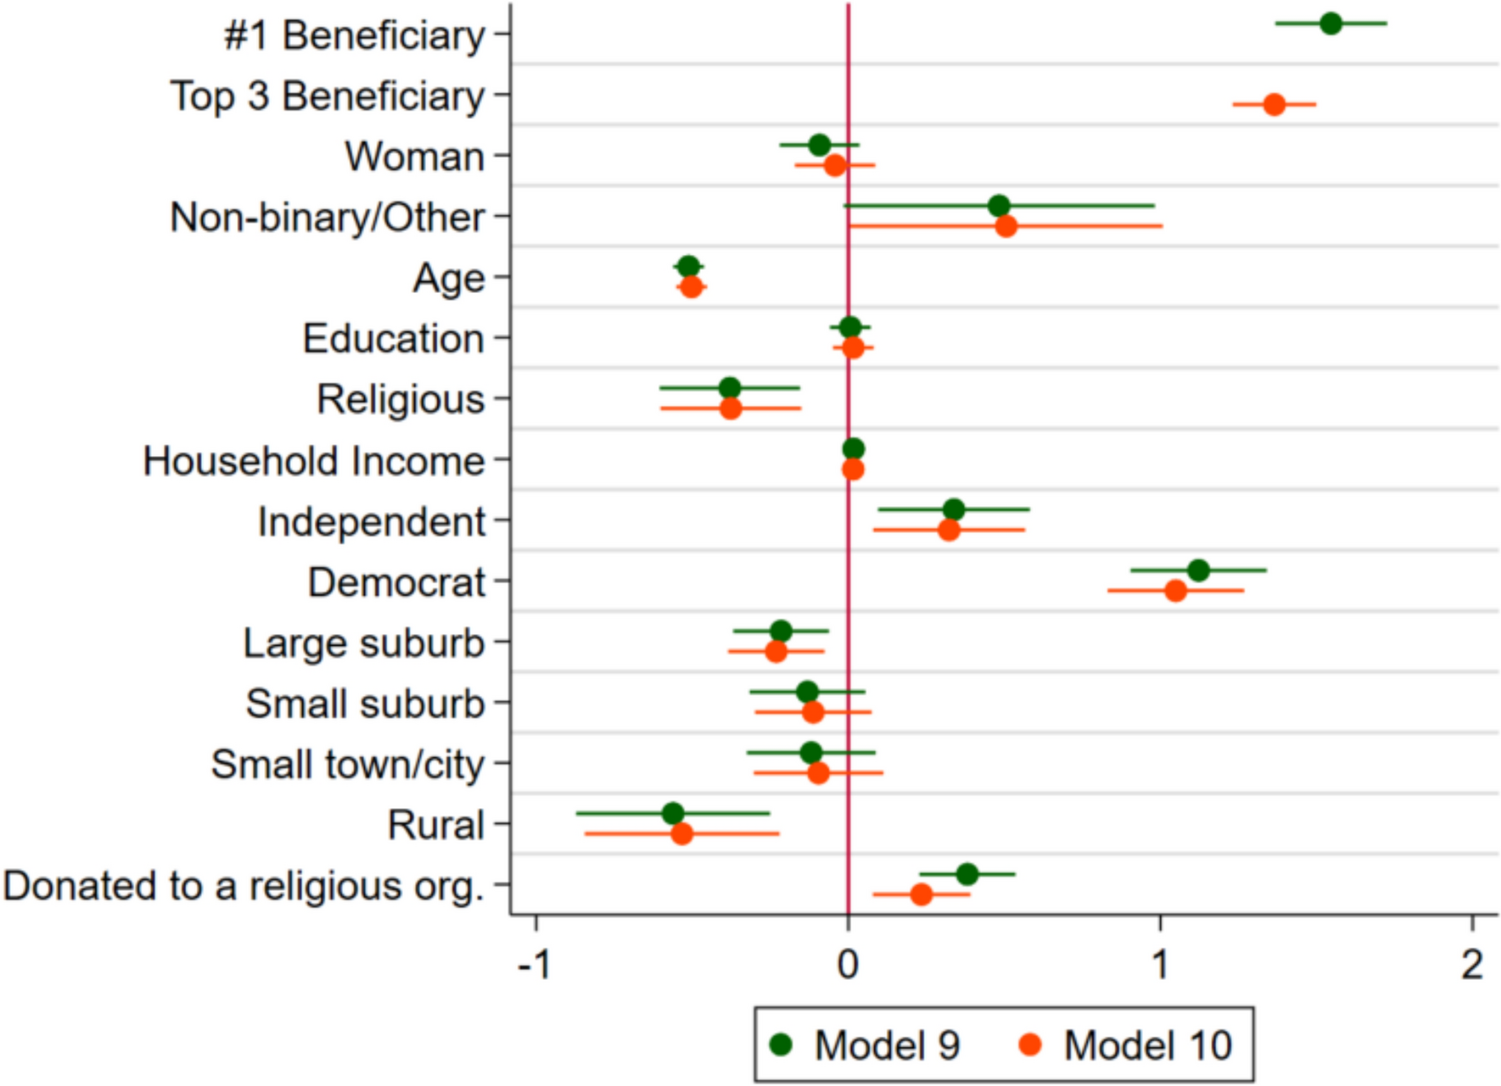
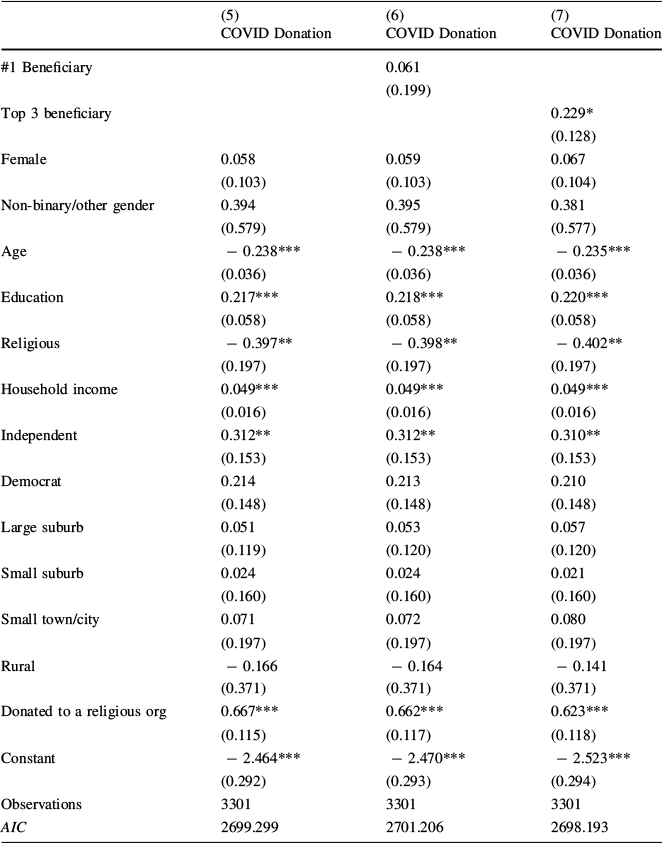
We also test our proposed mechanism: that Black/Asian individuals give to BLM/COVID causes, respectively, because gifts to these organizations benefit members of their racial/ethnic groups. We find that Asian individuals who identify members of their racial/ethnic group as a top beneficiary are not statistically significantly different from those who do not select their racial/ethnic group as their top beneficiary (Table 5). However, Asian individuals who select members of their racial/ethnic group within their top three beneficiaries are 3% more likely than those who did not select this beneficiary to donate to COVID relief (AME = 0.028, p < 0.10) (Fig. 6). We see a similar, but stronger, pattern among Black individuals (Table 6). Black individuals who select members of my race/ethnicity as the top or a top three beneficiary are 11% (AME = 0.108, p < 0.000) or 9% (AME = 0.094, p < 0.000) more likely than those who did not select this beneficiary to donate to BLM (Fig. 7).
Binary logit estimates testing Hypothesis 3 (Asian Individuals)

|
(5) |
(6) |
(7) |
|
|---|---|---|---|
|
COVID Donation |
COVID Donation |
COVID Donation |
|
|
#1 Beneficiary |
0.061 |
||
|
(0.199) |
|||
|
Top 3 beneficiary |
0.229* |
||
|
(0.128) |
|||
|
Female |
0.058 |
0.059 |
0.067 |
|
(0.103) |
(0.103) |
(0.104) |
|
|
Non-binary/other gender |
0.394 |
0.395 |
0.381 |
|
(0.579) |
(0.579) |
(0.577) |
|
|
Age |
− 0.238*** |
− 0.238*** |
− 0.235*** |
|
(0.036) |
(0.036) |
(0.036) |
|
|
Education |
0.217*** |
0.218*** |
0.220*** |
|
(0.058) |
(0.058) |
(0.058) |
|
|
Religious |
− 0.397** |
− 0.398** |
− 0.402** |
|
(0.197) |
(0.197) |
(0.197) |
|
|
Household income |
0.049*** |
0.049*** |
0.049*** |
|
(0.016) |
(0.016) |
(0.016) |
|
|
Independent |
0.312** |
0.312** |
0.310** |
|
(0.153) |
(0.153) |
(0.153) |
|
|
Democrat |
0.214 |
0.213 |
0.210 |
|
(0.148) |
(0.148) |
(0.148) |
|
|
Large suburb |
0.051 |
0.053 |
0.057 |
|
(0.119) |
(0.120) |
(0.120) |
|
|
Small suburb |
0.024 |
0.024 |
0.021 |
|
(0.160) |
(0.160) |
(0.160) |
|
|
Small town/city |
0.071 |
0.072 |
0.080 |
|
(0.197) |
(0.197) |
(0.197) |
|
|
Rural |
− 0.166 |
− 0.164 |
− 0.141 |
|
(0.371) |
(0.371) |
(0.371) |
|
|
Donated to a religious org |
0.667*** |
0.662*** |
0.623*** |
|
(0.115) |
(0.117) |
(0.118) |
|
|
Constant |
− 2.464*** |
− 2.470*** |
− 2.523*** |
|
(0.292) |
(0.293) |
(0.294) |
|
|
Observations |
3301 |
3301 |
3301 |
|
AIC |
2699.299 |
2701.206 |
2698.193 |
Standard errors in parentheses. Reference categories: Male (Gender), Republican (Partisanship), Urban (Community Type). *p < 0.10, **p < 0.05, ***p < 0.01
Marginal effect of variables on Covid donations (Asian Individuals). Based on Table 5 estimates. Thin bars represent 90% confidence intervals
Binary logit estimates testing Hypothesis 3 (Black/African American Individuals)
|
(8) |
(9) |
(10) |
|
|---|---|---|---|
|
BLM donation |
BLM donation |
BLM donation |
|
|
#1 Beneficiary |
1.547*** |
||
|
(0.091) |
|||
|
Top 3 beneficiary |
1.365*** |
||
|
(0.068) |
|||
|
Female |
− 0.108* |
− 0.092 |
− 0.043 |
|
(0.064) |
(0.065) |
(0.066) |
|
|
Non-binary/other gender |
0.516** |
0.483* |
0.506** |
|
(0.249) |
(0.254) |
(0.256) |
|
|
Age |
− 0.520*** |
− 0.512*** |
− 0.502*** |
|
(0.025) |
(0.025) |
(0.025) |
|
|
Education |
0.008 |
0.006 |
0.016 |
|
(0.033) |
(0.033) |
(0.033) |
|
|
Religious |
− 0.353*** |
− 0.380*** |
− 0.377*** |
|
(0.113) |
(0.115) |
(0.115) |
|
|
Household income |
0.023** |
0.017 |
0.015 |
|
(0.010) |
(0.010) |
(0.010) |
|
|
Independent |
0.338*** |
0.338*** |
0.323*** |
|
(0.123) |
(0.124) |
(0.124) |
|
|
Democrat |
1.158*** |
1.122*** |
1.049*** |
|
(0.110) |
(0.111) |
(0.112) |
|
|
Large suburb |
− 0.228*** |
− 0.216*** |
− 0.231*** |
|
(0.077) |
(0.078) |
(0.079) |
|
|
Small suburb |
− 0.135 |
− 0.131 |
− 0.112 |
|
(0.093) |
(0.095) |
(0.095) |
|
|
Small town/city |
− 0.134 |
− 0.119 |
− 0.096 |
|
(0.104) |
(0.105) |
(0.106) |
|
|
Rural |
− 0.615*** |
− 0.562*** |
− 0.533*** |
|
(0.157) |
(0.159) |
(0.159) |
|
|
Donated to a religious org |
0.492*** |
0.381*** |
0.235*** |
|
(0.076) |
(0.079) |
(0.080) |
|
|
Constant |
− 1.326*** |
− 1.436*** |
− 1.638*** |
|
(0.160) |
(0.162) |
(0.162) |
|
|
observations |
14,244 |
14,244 |
14,244 |
|
AIC |
7439.779 |
7192.503 |
7069.448 |
Standard errors in parentheses. Reference categories: Male (Gender), Republican (Partisanship), Urban (Community Type). *p < 0.10, **p < 0.05, ***p < 0.01
Marginal effect of variables on BLM donations (Black/African American Individuals). Based on Table 6 estimates. Thin bars represent 95% confidence intervals
Discussion
Our findings align with previous work (Chapman & Lickel, Reference Chapman and Lickel2016; Chapman et al., Reference Chapman, Masser and Louis2020), illustrating that a donor’s identity and the beneficiary’s identity matter when making donations. Furthermore, our work illustrates that donors of color do not all donate in the same way. The influence of a donor’s identity matters across and within groups. We observe that donors who self-identify as Black are more likely than White donors to donate to Black Lives Matter. Donors who self-identify as Asian are more likely than White donors to donate to COVID-19 relief causes. We believe this supports that donations by individuals identifying with a group under crisis reflect a community aid-based response to racism and backlash amid the 2020 crises.
Our findings also illustrate that donors intend to support their collective social group along racial/ethnic lines. We find Black and Asian donors are more likely than White donors to identify their racial/ethnic group as the intended beneficiary of their donation. We believe this shows that donors are targeting their donations to ensure they serve similarly situated recipients, in this case, individuals of their racial/ethnic group, given all groups’ willingness to select “members of my racial/ethnic group” (Table 1). However, future research should causally identify whether crisis giving or reticence to identify with a racial/ethnic group drives these results.
To further test the mechanism of donor’s racial identity and beneficiary intention on donating, we focused our analysis to only focus differences among Black and Asian respondents. Oversampled data from the 2020 CMPS make this within-group analysis possible (Frasure et al., Reference Frasure, Wong, Vargas and Barreto2025). Within the Black community, the most likely donors to BLM are those who intend for their gift to support members of their racial/ethnic community. Within the Asian community, the relationship is not as strong. We find that Asian individuals who select “my racial and ethnic group” as one of their top three beneficiaries of their donations are more likely than Asian respondents who do not indicate their donation benefits their group to donate to COVID relief efforts. This difference between Black and Asian donors is possibly due to differences in the linked fate phenomenon between Black and Asian American communities. Linked fate, originally developed to explain Black group consciousness, explores the idea that individuals within a racial group may feel a sense of collective identity and group consciousness, particularly when faced with shared challenges or adversity (Dawson, Reference Dawson1995; Gay et al., Reference Gay, Hochschild and White2016). Junn and Masuoka (Reference Junn and Masuoka2008) find that the Asian American community’s linked fate is context dependent and not as strong as the Black community’s linked fate, a pattern we see reflected in our findings. This difference could stem from variations in the potency of linked fate within each community’s experience of a 2020 crisis. More work is needed to understand the causal mechanisms underlying differences between and within these communities, with consideration for how communities’ unique histories and cultures may produce different donation patterns and motivations.
Our results support our hypotheses that identity-based giving occurs during crisis, with donors seeking to provide for their community under crisis, but this study is not without its limitations. Empirically, our results are limited in generalizability as we only have 1 year of data during an exceptional year. As such, these findings may not extend to crisis events that happen with a more regular frequency or less severity. Future work should continue to examine how donors of color react to other types of crises and build theory specific to donor of color behavior. Likewise, we are unable to assess the causal effect of crises, given both crises were actively ongoing during survey data collection. Other research designs may give more leverage over the exact causal mechanisms between social identity and crisis events. Here, we have examined how an individual's identity may be primed by crisis, but identities may also be primed through smaller events (e.g., negative or positive encounters with individuals and organizations). Future work should investigate how identity shapes individual giving practices on large and small scales and how long these priming effects may shape donations.
It is important to remember that the “traditional” donor profile is shifting as our population diversifies and social issues arise. We encourage researchers to design data collection efforts to understand and build new theoretical understandings of donors of color. Traditional models on giving “controlling” for race do not tell a holistic picture about donors of color. It is important to understand donors of color as independent communities with respect to their diversity, not just in comparison to white donors. For example, Asian, Latinx, and African communities comprise diverse pan-ethnic groups. We are unable to get at these specific pan-ethnic influences due to data limitations, but this research is a starting point for exploring racial group giving.
Of course, Hispanic and White individuals were also affected by the COVID-19 pandemic, and the Hispanic community has shared experiences with the Black community of police brutality and political oppression. However, these two groups were not the primary racial/ethnic groups associated with racism or backlash concerning the 2020 crises. Our results indicate no difference between the donations of White and Hispanic individuals to BLM and COVID-19 efforts or in their intended support of people who share their racial/ethnic identity. Our results also indicate that Black and Asian donors are less likely to donate to causes that did not prime their social identity during the 2020 crises: Black donors are less likely than White donors to give to COVID-19 relief efforts, and Asian Americans are less likely to donate to BLM. However, further research is needed to continue developing and testing identity-based arguments in other contexts. Future work should account for differences within racial/ethnic groups, such as pan-ethnic identities, and intersectional identities, how community dynamics are conditioned by other important relationships like trust in government and immigration status, and whether the ideas presented here travel to international contexts.
Conclusion
Times of crisis can be breaking points for communities. For donors from these communities, these times can serve as catalysts for giving and uplifting their communities. Beyond its theoretical and empirical contributions, our research on identity-based giving during times of crisis provides important implications for the nonprofit community.
First, our study supports that donations are personal and intentional regarding crisis giving. The causes and beneficiaries of donations align with donors' perspectives and motivations. These relationships tell a story about how their giving can provide aid and change for the beneficiaries of their donations. For nonprofit organizations wanting to elicit donations from donors of color, their messaging should connect to the donor’s racial and ethnic identity and highlight their work for the donor’s racial and ethnic group.
Second, it is unfortunate that the communities in crisis are often seen uplifting themselves. In 2020, members of communities in crisis were the ones most likely to support their communities’ relief efforts. When communities of color fund their uplifting, it can hinder their recovery and progress. Nonprofits and foundations should be aware of this pattern and consider how other donors, and funding can proactively support communities to alleviate the “double-burden” facing them as both donors and impacted persons.
This research contributes to theory building on donor characteristics for giving, particularly among donors of color, by extending the theory of identity-based giving to new sociopolitical contexts. More research and data are needed to understand how race/ethnicity shapes the role of philanthropy between and within the Black and Asian communities, as well as the Latinx/Hispanic community and other racial/ethnic communities. With individual donations being an important funding source, understanding the complexity of donors is a first step to ensuring support from the community, especially in the face of social, political, and natural crises.
Acknowledgements
A previous version of this manuscript was presented at the ARNOVA 2024 Annual Meeting.
Author Contributions
Authors listed in alphabetical order; equal authorship implied. Securing funding: MACC; Survey questionnaire design: MACC, SZ; Theory: MACC, SZ; Literature Review: MACC; Modeling: SZ; Interpretation of Results: MACC, SZ; Writing of paper, edits, and final revision: MACC, SZ.
Declarations
Conflict of interest
The authors declare that they have no conflict of interest.
Appendix
See Appendix Tables 7 for full breakdown of primary race/ethnicity frequencies and 8-12 for robustness checks.
Race/ethnicity respondent frequencies breakdown within 2020 CMPS data
|
N |
|
|---|---|
|
White |
3925 |
|
Hispanic or Latino |
3881 |
|
Black or African American |
4613 |
|
Asian American |
3837 |
|
American Indian/Native American |
713 |
|
Arab, Middle Eastern, or North African |
226 |
|
Native Hawaiian |
106 |
|
Not Hawaiian, but other Pacific Islander |
255 |
Source: 2020 CMPS Survey
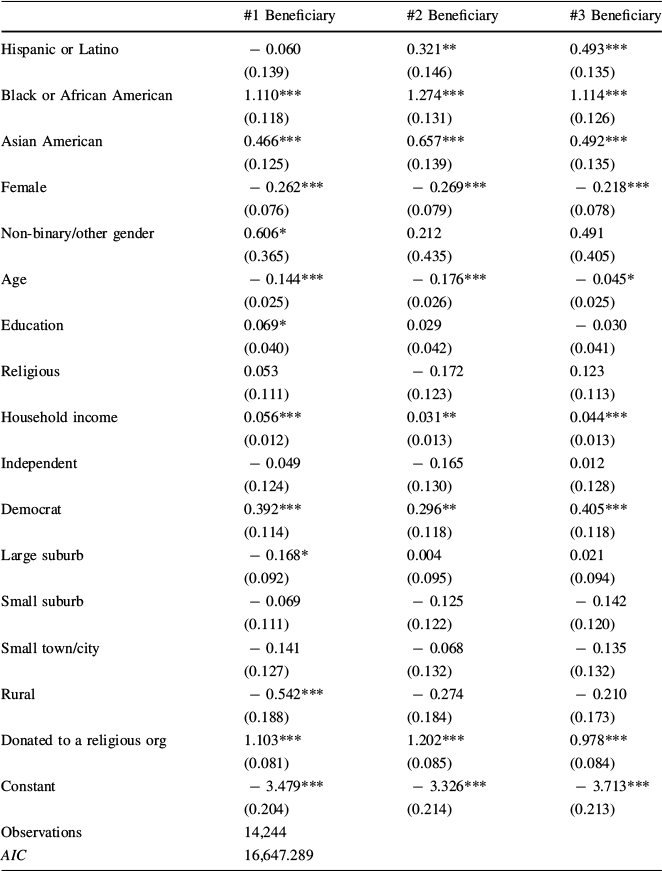
Multinomial analysis of hypothesis 2

|
#1 Beneficiary |
#2 Beneficiary |
#3 Beneficiary |
|
|---|---|---|---|
|
Hispanic or Latino |
− 0.060 |
0.321** |
0.493*** |
|
(0.139) |
(0.146) |
(0.135) |
|
|
Black or African American |
1.110*** |
1.274*** |
1.114*** |
|
(0.118) |
(0.131) |
(0.126) |
|
|
Asian American |
0.466*** |
0.657*** |
0.492*** |
|
(0.125) |
(0.139) |
(0.135) |
|
|
Female |
− 0.262*** |
− 0.269*** |
− 0.218*** |
|
(0.076) |
(0.079) |
(0.078) |
|
|
Non-binary/other gender |
0.606* |
0.212 |
0.491 |
|
(0.365) |
(0.435) |
(0.405) |
|
|
Age |
− 0.144*** |
− 0.176*** |
− 0.045* |
|
(0.025) |
(0.026) |
(0.025) |
|
|
Education |
0.069* |
0.029 |
− 0.030 |
|
(0.040) |
(0.042) |
(0.041) |
|
|
Religious |
0.053 |
− 0.172 |
0.123 |
|
(0.111) |
(0.123) |
(0.113) |
|
|
Household income |
0.056*** |
0.031** |
0.044*** |
|
(0.012) |
(0.013) |
(0.013) |
|
|
Independent |
− 0.049 |
− 0.165 |
0.012 |
|
(0.124) |
(0.130) |
(0.128) |
|
|
Democrat |
0.392*** |
0.296** |
0.405*** |
|
(0.114) |
(0.118) |
(0.118) |
|
|
Large suburb |
− 0.168* |
0.004 |
0.021 |
|
(0.092) |
(0.095) |
(0.094) |
|
|
Small suburb |
− 0.069 |
− 0.125 |
− 0.142 |
|
(0.111) |
(0.122) |
(0.120) |
|
|
Small town/city |
− 0.141 |
− 0.068 |
− 0.135 |
|
(0.127) |
(0.132) |
(0.132) |
|
|
Rural |
− 0.542*** |
− 0.274 |
− 0.210 |
|
(0.188) |
(0.184) |
(0.173) |
|
|
Donated to a religious org |
1.103*** |
1.202*** |
0.978*** |
|
(0.081) |
(0.085) |
(0.084) |
|
|
Constant |
− 3.479*** |
− 3.326*** |
− 3.713*** |
|
(0.204) |
(0.214) |
(0.213) |
|
|
Observations |
14,244 16,647.289 |
||
|
AIC |
|||
We estimated a multinomial logit with four categories (top beneficiary, second beneficiary, third beneficiary, or not noted). The reference category “not noted”, meaning a respondent did not note “members of my racial/ethnic group” within their top three beneficiaries. Results are consistent with those provided in the main text
Standard errors in parentheses
*p < 0.10, **p < 0.05, ***p < 0.01
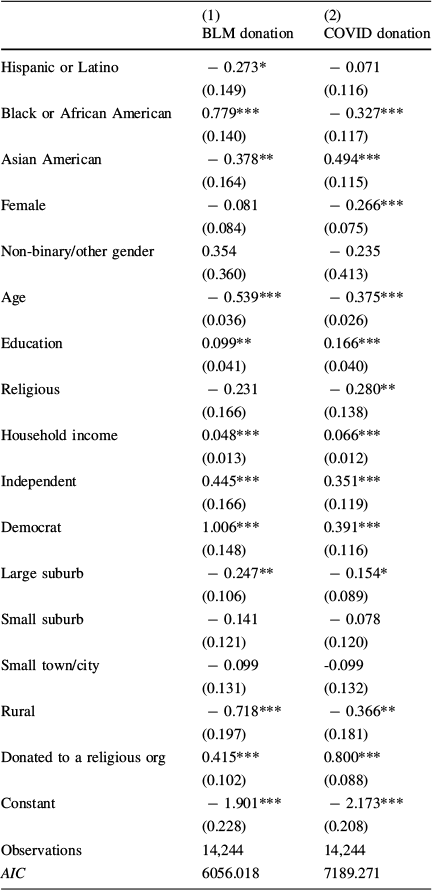
Analyses Incorporating Survey Weights
The 2020 CMPS data are weighted within each racial group for age, gender, education, nativity, and ancestry. We conducted our analyses with and without weights, and the results are the same under both specifications. The non-weighted results are presented in the main text, and the weighted results are presented here (Tables 9, 10, 11 and 12).
Hypothesis 1 weighted analysis

|
(1) |
(2) |
|
|---|---|---|
|
BLM donation |
COVID donation |
|
|
Hispanic or Latino |
− 0.273* |
− 0.071 |
|
(0.149) |
(0.116) |
|
|
Black or African American |
0.779*** |
− 0.327*** |
|
(0.140) |
(0.117) |
|
|
Asian American |
− 0.378** |
0.494*** |
|
(0.164) |
(0.115) |
|
|
Female |
− 0.081 |
− 0.266*** |
|
(0.084) |
(0.075) |
|
|
Non-binary/other gender |
0.354 |
− 0.235 |
|
(0.360) |
(0.413) |
|
|
Age |
− 0.539*** |
− 0.375*** |
|
(0.036) |
(0.026) |
|
|
Education |
0.099** |
0.166*** |
|
(0.041) |
(0.040) |
|
|
Religious |
− 0.231 |
− 0.280** |
|
(0.166) |
(0.138) |
|
|
Household income |
0.048*** |
0.066*** |
|
(0.013) |
(0.012) |
|
|
Independent |
0.445*** |
0.351*** |
|
(0.166) |
(0.119) |
|
|
Democrat |
1.006*** |
0.391*** |
|
(0.148) |
(0.116) |
|
|
Large suburb |
− 0.247** |
− 0.154* |
|
(0.106) |
(0.089) |
|
|
Small suburb |
− 0.141 |
− 0.078 |
|
(0.121) |
(0.120) |
|
|
Small town/city |
− 0.099 |
-0.099 |
|
(0.131) |
(0.132) |
|
|
Rural |
− 0.718*** |
− 0.366** |
|
(0.197) |
(0.181) |
|
|
Donated to a religious org |
0.415*** |
0.800*** |
|
(0.102) |
(0.088) |
|
|
Constant |
− 1.901*** |
− 2.173*** |
|
(0.228) |
(0.208) |
|
|
Observations |
14,244 |
14,244 |
|
AIC |
6056.018 |
7189.271 |
Standard errors in parentheses. Reference categories: White (Race/Ethnicity), Male (Gender), Republican (Partisanship), Urban (Community Type). Weights: os_weights
*p < 0.10, **p < 0.05, ***p < 0.01
Hypothesis 2 weighted analysis
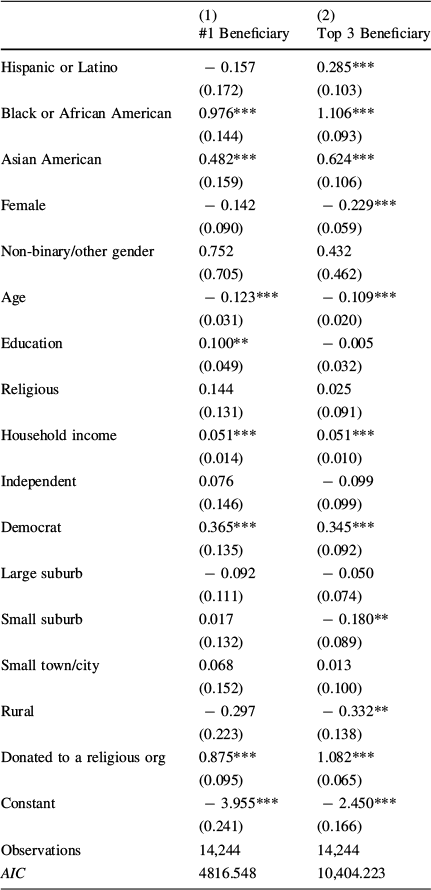
|
(1) |
(2) |
|
|---|---|---|
|
#1 Beneficiary |
Top 3 Beneficiary |
|
|
Hispanic or Latino |
− 0.157 |
0.285*** |
|
(0.172) |
(0.103) |
|
|
Black or African American |
0.976*** |
1.106*** |
|
(0.144) |
(0.093) |
|
|
Asian American |
0.482*** |
0.624*** |
|
(0.159) |
(0.106) |
|
|
Female |
− 0.142 |
− 0.229*** |
|
(0.090) |
(0.059) |
|
|
Non-binary/other gender |
0.752 |
0.432 |
|
(0.705) |
(0.462) |
|
|
Age |
− 0.123*** |
− 0.109*** |
|
(0.031) |
(0.020) |
|
|
Education |
0.100** |
− 0.005 |
|
(0.049) |
(0.032) |
|
|
Religious |
0.144 |
0.025 |
|
(0.131) |
(0.091) |
|
|
Household income |
0.051*** |
0.051*** |
|
(0.014) |
(0.010) |
|
|
Independent |
0.076 |
− 0.099 |
|
(0.146) |
(0.099) |
|
|
Democrat |
0.365*** |
0.345*** |
|
(0.135) |
(0.092) |
|
|
Large suburb |
− 0.092 |
− 0.050 |
|
(0.111) |
(0.074) |
|
|
Small suburb |
0.017 |
− 0.180** |
|
(0.132) |
(0.089) |
|
|
Small town/city |
0.068 |
0.013 |
|
(0.152) |
(0.100) |
|
|
Rural |
− 0.297 |
− 0.332** |
|
(0.223) |
(0.138) |
|
|
Donated to a religious org |
0.875*** |
1.082*** |
|
(0.095) |
(0.065) |
|
|
Constant |
− 3.955*** |
− 2.450*** |
|
(0.241) |
(0.166) |
|
|
Observations |
14,244 |
14,244 |
|
AIC |
4816.548 |
10,404.223 |
Standard errors in parentheses. Reference categories: White (Race/Ethnicity), Male (Gender), Republican (Partisanship), Urban (Community Type). Weights: os_weights
*p < 0.10, **p < 0.05, ***p < 0.01
Hypothesis 3 weighted analysis (Asian Individuals)
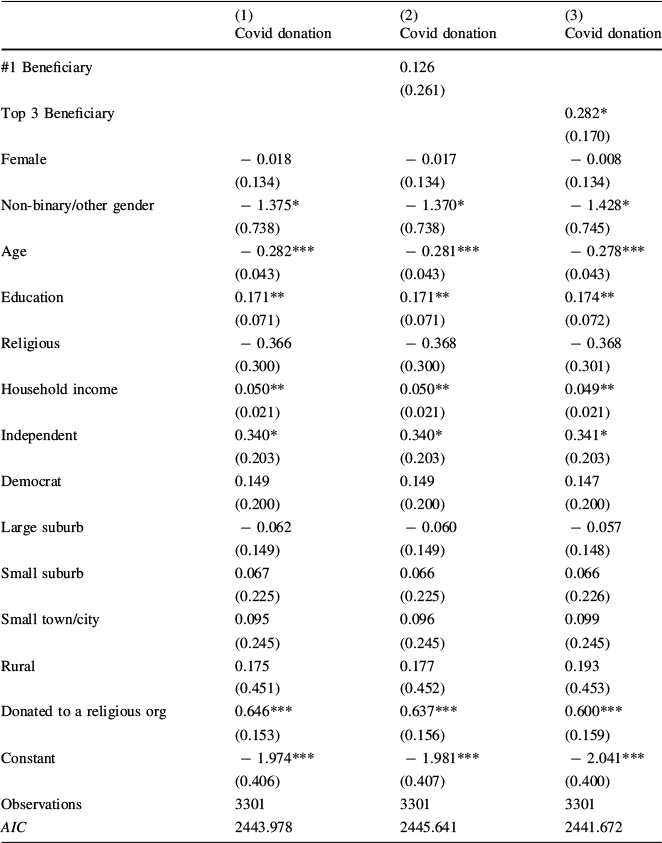
|
(1) |
(2) |
(3) |
|
|---|---|---|---|
|
Covid donation |
Covid donation |
Covid donation |
|
|
#1 Beneficiary |
0.126 |
||
|
(0.261) |
|||
|
Top 3 Beneficiary |
0.282* |
||
|
(0.170) |
|||
|
Female |
− 0.018 |
− 0.017 |
− 0.008 |
|
(0.134) |
(0.134) |
(0.134) |
|
|
Non-binary/other gender |
− 1.375* |
− 1.370* |
− 1.428* |
|
(0.738) |
(0.738) |
(0.745) |
|
|
Age |
− 0.282*** |
− 0.281*** |
− 0.278*** |
|
(0.043) |
(0.043) |
(0.043) |
|
|
Education |
0.171** |
0.171** |
0.174** |
|
(0.071) |
(0.071) |
(0.072) |
|
|
Religious |
− 0.366 |
− 0.368 |
− 0.368 |
|
(0.300) |
(0.300) |
(0.301) |
|
|
Household income |
0.050** |
0.050** |
0.049** |
|
(0.021) |
(0.021) |
(0.021) |
|
|
Independent |
0.340* |
0.340* |
0.341* |
|
(0.203) |
(0.203) |
(0.203) |
|
|
Democrat |
0.149 |
0.149 |
0.147 |
|
(0.200) |
(0.200) |
(0.200) |
|
|
Large suburb |
− 0.062 |
− 0.060 |
− 0.057 |
|
(0.149) |
(0.149) |
(0.148) |
|
|
Small suburb |
0.067 |
0.066 |
0.066 |
|
(0.225) |
(0.225) |
(0.226) |
|
|
Small town/city |
0.095 |
0.096 |
0.099 |
|
(0.245) |
(0.245) |
(0.245) |
|
|
Rural |
0.175 |
0.177 |
0.193 |
|
(0.451) |
(0.452) |
(0.453) |
|
|
Donated to a religious org |
0.646*** |
0.637*** |
0.600*** |
|
(0.153) |
(0.156) |
(0.159) |
|
|
Constant |
− 1.974*** |
− 1.981*** |
− 2.041*** |
|
(0.406) |
(0.407) |
(0.400) |
|
|
Observations |
3301 |
3301 |
3301 |
|
AIC |
2443.978 |
2445.641 |
2441.672 |
Standard errors in parentheses. Reference categories: White (Race/Ethnicity), Male (Gender), Republican (Partisanship), Urban (Community Type). Weights: os_weights
*p < 0.10, **p < 0.05, ***p < 0.01
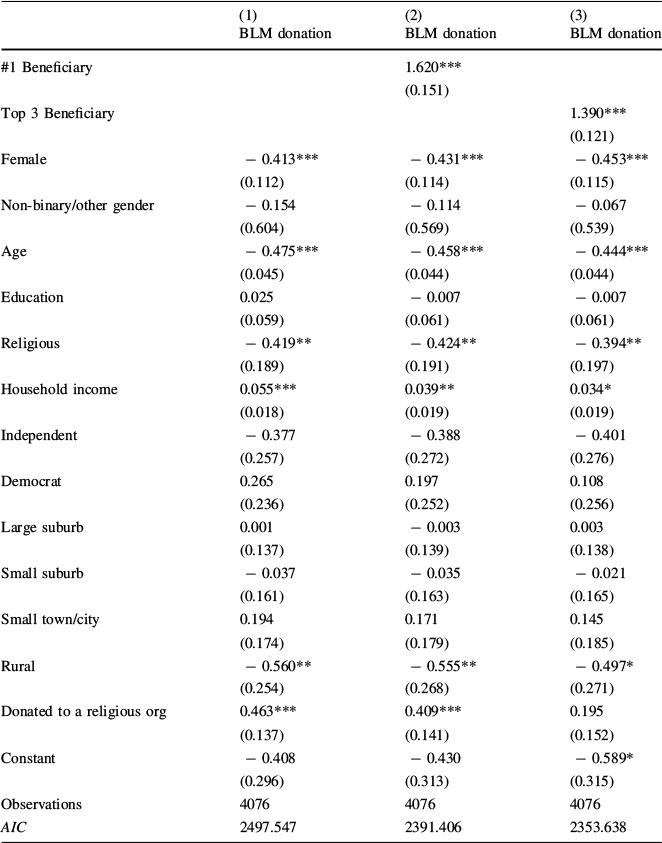
Hypothesis 3 weighted analysis (Black)

|
(1) |
(2) |
(3) |
|
|---|---|---|---|
|
BLM donation |
BLM donation |
BLM donation |
|
|
#1 Beneficiary |
1.620*** |
||
|
(0.151) |
|||
|
Top 3 Beneficiary |
1.390*** |
||
|
(0.121) |
|||
|
Female |
− 0.413*** |
− 0.431*** |
− 0.453*** |
|
(0.112) |
(0.114) |
(0.115) |
|
|
Non-binary/other gender |
− 0.154 |
− 0.114 |
− 0.067 |
|
(0.604) |
(0.569) |
(0.539) |
|
|
Age |
− 0.475*** |
− 0.458*** |
− 0.444*** |
|
(0.045) |
(0.044) |
(0.044) |
|
|
Education |
0.025 |
− 0.007 |
− 0.007 |
|
(0.059) |
(0.061) |
(0.061) |
|
|
Religious |
− 0.419** |
− 0.424** |
− 0.394** |
|
(0.189) |
(0.191) |
(0.197) |
|
|
Household income |
0.055*** |
0.039** |
0.034* |
|
(0.018) |
(0.019) |
(0.019) |
|
|
Independent |
− 0.377 |
− 0.388 |
− 0.401 |
|
(0.257) |
(0.272) |
(0.276) |
|
|
Democrat |
0.265 |
0.197 |
0.108 |
|
(0.236) |
(0.252) |
(0.256) |
|
|
Large suburb |
0.001 |
− 0.003 |
0.003 |
|
(0.137) |
(0.139) |
(0.138) |
|
|
Small suburb |
− 0.037 |
− 0.035 |
− 0.021 |
|
(0.161) |
(0.163) |
(0.165) |
|
|
Small town/city |
0.194 |
0.171 |
0.145 |
|
(0.174) |
(0.179) |
(0.185) |
|
|
Rural |
− 0.560** |
− 0.555** |
− 0.497* |
|
(0.254) |
(0.268) |
(0.271) |
|
|
Donated to a religious org |
0.463*** |
0.409*** |
0.195 |
|
(0.137) |
(0.141) |
(0.152) |
|
|
Constant |
− 0.408 |
− 0.430 |
− 0.589* |
|
(0.296) |
(0.313) |
(0.315) |
|
|
Observations |
4076 |
4076 |
4076 |
|
AIC |
2497.547 |
2391.406 |
2353.638 |
Standard errors in parentheses. Reference categories: White (Race/Ethnicity), Male (Gender), Republican (Partisanship), Urban (Community Type). Weights: os_weights
*p < 0.10, **p < 0.05, ***p < 0.01


 Open access