


Politicians can use career control tools to co-opt bureaucrats. Chapter 4 demonstrated that in Ghana, the primary means by which local politicians attempt to influence bureaucratic actions is through interfering in transfers: relocating (or threatening to relocate) bureaucrats to other locations. Demonstrating the potency of this form of career control, I find that bureaucrats who perceive that their mayor can easily interfere in transfers are more likely to report corruption in their local government.
Chapter 5 builds on those findings to further examine how career control affects public procurement. As outlined in Chapter 2, politicians’ motivations to control bureaucrats’ careers are driven by their desire to either engage in non-programmatic distribution or capture funds for election campaigns. These objectives are often intertwined: campaign funds are fungible and can be used to provide private benefits to voters during elections. Interference in public procurement is attractive to politicians due to the large sums of money involved, such that capturing a small percentage of these funds can yield significant political or personal benefits. Understanding financial malfeasance requires a closer look at how public procurement operates.
Public procurement can be defined as the awarding of public funds to private firms in return for goods, services, and the construction of public infrastructure. In all polities, public procurement represents a significant share of public spending, accounting for 10–25% of public spending globally, and 50% of government spending in African countries.Footnote 1 Public procurement is an area that is particularly vulnerable to corruption. This susceptibility is partly the result of the multi-stage nature of procurement processes, and the difficulty in eliminating human discretion from the evaluation of competing bids.Footnote 2 Politicians and bureaucrats can exploit this discretion to steer contracts toward favored contractors.
Chapter 5 focuses specifically on procurement contracts issued by local governments to firms for the construction of new public infrastructure. Such construction is local governments’ primary activity.Footnote 3 Drawing on qualitative, observational, and experimental data, I document high levels of political interference in public procurement. Such malfeasance typically involves mayors accepting kickbacks from firms in return for contracts or distributing contracts to firms owned by partisan elites, irrespective of whether these companies have the required equipment or experience to perform the task.
The findings of Chapter 5 align with the theoretical expectations outlined in Chapter 2. Specifically, I demonstrate that politicians are more likely to interfere in procurement processes in electorally competitive districts or districts where the mayor aspires to become an MP. These patterns reinforce the argument that electoral financing pressures are a key driver of procurement-related corruption.
Chapter 5 has four sections. Section 5.1 uses data from interviews with bureaucrats to provide a descriptive account of the precise ways in which mayors and bureaucrats manipulate the public procurement process. In all contexts, the aim of manipulation in public procurement is to steer the contract to the favored bidder.Footnote 4 The qualitative data I collected shows that the favored bidder is typically a firm selected by the mayor. Bureaucrats administer procurement processes and adopt discreet strategies to make the tendering process appear competitive to external observers or auditors.
Section 5.2 provides evidence that these processes undermine competition in the awarding of contracts. I use contract-level data to show that local governments award contracts to a fragmented and geographically concentrated set of contractors. Despite the fact that districts in Ghana are geographically small – the average distance between district capitals is 12 miles – 80 percent of firms only win contracts in a single district. These analyses suggest that contractors require strong connections to politicians and bureaucrats within a district to secure contracts.
In Section 5.3, I investigate the types of firms that local governments typically favor. I argue that firms that either give donations to politicians (donating firms) or are owned by party executives (party firms) are more likely than independent firms to win contracts. I assess this claim using contract-level observational data and data from a survey experiment with bureaucrats. Consistent with my theory, the contract data suggest that interference in contracting is more likely in districts that are electorally competitive and when mayors are politically ambitious. In these districts, mayors have a greater incentive to use contracts as part of a quid pro quo with donating or party firms. Results from a survey experiment with bureaucrats also show that bureaucrats expect partisan firms to be favored, even when these firms do not have significant experience in construction. When combined, the qualitative, observational, and experimental data indicate highly politicized and non-competitive public procurement processes.
Section 5.4 considers the consequences of corruption in public procurement on the quality of public infrastructure.
5.1 How to Manipulate Public Procurement
While mayors may want to predetermine the result of public procurement processes, they will still want bureaucrats to ensure that the process appears competitive. For example, multiple firms must bid for a contract to satisfy the basic tenants of the relevant procurement legislation. An extensive literature on procurement in regions beyond Africa highlights that politicians and bureaucrats use various techniques to undermine competitive procurement, and that these methods vary in how observable they are to onlookers.
Public procurement is a multi-stage process, and manipulation can occur at any stage. Figure 5.1 displays the four main stages of any procurement process: (i) project identification, (ii) pre-bid, (iii) bid evaluation, and (iv) post-bid. The precise stage and methods through which actors manipulate procurement processes vary across contexts. In the pre-bidding stage, interference can occur when advertising the tender and when firms submit their documents. Malfeasance can also occur when a contractor is selected in the bid evaluation stage; for example, certain firms may be unfairly disqualified. In the post-bidding stage, corruption can occur through budget renegotiations, overpayment, or the under-provision (or no provision) of infrastructure. Table 5.1 overviews various methods and provides empirical examples of countries where such manipulation has been documented to occur. I provide further details of some of these strategies below, highlighting some of these examples.
Main stages and activities in public procurement
Note: Figure adapted from Rose-Ackerman and Palifka (Reference Rose-Ackerman and Palifka2016, 104) and Ware et al. (Reference Ware, Moss, Campos, Noone, Campos, Pradhan and Washington2007).
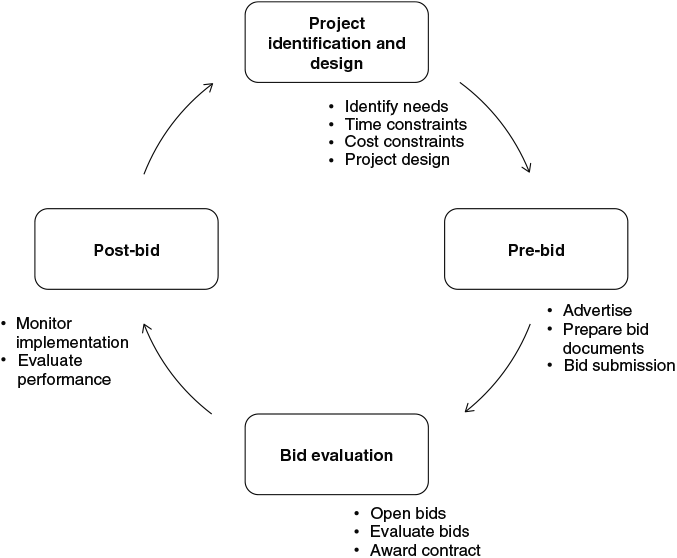
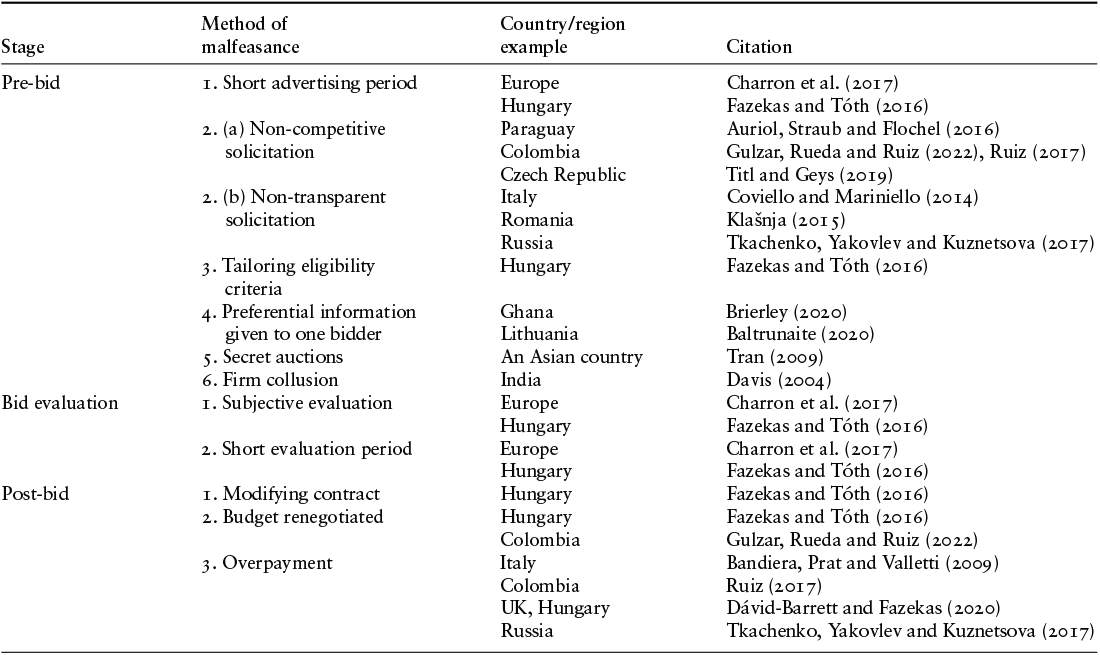
Table 5.1 Long description
Table organizes examples of procurement malfeasance across three stages: pre-bid, bid evaluation, and post-bid. Columns include method of malfeasance, country or region examples, and corresponding citation. Pre-bid issues include short advertising periods, non-competitive or non-transparent solicitation, tailored eligibility criteria, preferential information, secret actions, and firm collusion. Bid evaluation covers subjective evaluation and short evaluation periods. Post-bid includes contract modification, budget renegotiation, and overpayment.
In the pre-bid stage, favoritism can occur in five main ways. Some of these strategies are reflected in formal procedures. In contrast, others are informal ways where politicians or bureaucrats can influence which firms submit bids or the information that firms submit. First, beginning with formal procedures, advertising periods can be set short. Short advertising periods limit the number of firms that are likely to find out about the contract. Politicians and bureaucrats can use this to their advantage by informing well-connected companies about upcoming contracts ahead of time.Footnote 5
Second, the solicitation of firms can take non-competitive or non-transparent forms. For example, aiming to limit competition between firms, politicians in Colombia often opt to use “minimum value” contracting.Footnote 6 This option is available in Colombia when contracts are below 10 percent of the municipal budget. Minimum value contracts also only need to be advertised for a single day, which results in few applicants. Similarly, it is reported that in Paraguay, corruption occurs through the “systematic use of an “exceptional” purchase mechanism, which bypasses legally required minimum standards of transparency and competition.”Footnote 7
Third, advertisements can be tailored to limit the number of firms who are eligible to apply. In the most extreme cases, only one firm may fulfill the eligibility criteria, effectively dictating that this firm will win the contract. Tailoring is documented as a widely used means of limiting competition in public procurement in Hungary.Footnote 8 The authors of the study note that “Tailoring the conditions to a single company is one of the most widely quoted means for corruptly limiting competition. Overly complex, hence lengthy, criteria are a typical sign that criteria were “overspecified,” most likely excluding competitors.”Footnote 9
Fourth, a more informal way politicians and bureaucrats can manipulate the pre-bid stage is to leak information to a particular firm, which will favor them in the selection stage. Leaked information can include the identities and number of other bidders and the prices offered by competing firms. For example, as I describe below, politicians and bureaucrats in Ghana provide detailed information on project requirements to selected firms, which helps them submit low-cost and technically favorable bids to beat competitors. Information sharing is the primary way politically connected firms are favored in Lithuania.Footnote 10 Leaked information in Lithuania includes information on the number of participants or the identities of competitors.Footnote 11
Fifth, in the pre-bid period, there may be collusion between groups of firms or between business-owners and public officials. For example, officials may run secret auctions before official auctions to identify which firms are willing to pay the largest bribes. After doing so, they then design tender requirements to suit that firm.Footnote 12 Secret auctions are noted to operate in an undisclosed Asian country where public servants solicit informal bids from firms, and firms indicate how much they are willing to bribe.Footnote 13 Once a firm is selected, the firm and procurement official tailor the tender advertisement to include “extremely specific requirements in the call for tenders to scare off or disqualify competing firms.”Footnote 14 This example also shows how officials can combine malfeasance methods: in this example, a secret auction is combined with advert tailoring. Collusion may also occur across groups of firms to undermine competition. For example, in India, contractors explained that: “A group of [contractors] meet on the weekend in the office. We have a list of contracts being offered by [the public W&S [Water and Sanitation] agency]. We draw names out of a bag to see who will be the winner for each contract. That person decides what he will bid for the contract, and everyone else bids something higher than that.”Footnote 15 The result is overpriced public infrastructure because competition does not drive costs down to the market rate.
Once bids have been submitted, manipulation can also occur at the bid evaluation stage. Two methods of manipulation are standard. First, evaluation criteria may be subjective. Subjective criteria promote discretion in selection, which can lead to politically favored firms being awarded contracts. Second, as with advertising, evaluation periods can be short. Short evaluation periods can signal that snap decisions are being made, which suggests that decisions are premeditated.Footnote 16 Thus, quick evaluation periods may be more a signal of corruption as opposed to a method of it.
Finally, manipulation can occur in the post-bid period. Three common methods are the (i) modification of contract conditions, (ii) budget renegotiation, and, relatedly, (iii) overpayment. There is evidence of overpayment to politically connected firms in Colombia. Specifically, when firms that donate to politicians receive public contracts, they provide goods under contract at above-average costs.Footnote 17 This suggests a quid pro quo between firms and politicians. Budgets can also be renegotiated or terms of the contract changed, which can allow for extra profits on behalf of the firm.
5.1.1 Public Procurement Legislation
Before describing how politicians and bureaucrats manipulate procurement processes in Ghana, it is important to outline how procurement processes should operate according to existing legislation. This discussion helps to understand why politicians and bureaucrats manipulate procurement processes in the ways they do. In most cases, the methods they adopt are invisible, and the resulting transactions appear to comply with legislation.
Public procurement is guided by detailed legislation set out principally in the Public Procurement Act of 2003 (Act 663) and the Public Procurement (Amendment) Act of 2016 (Act 914). My focus is on procurement transactions undertaken by local governments. However, procurement processes at the local level are similar to the processes used at the national level. The main difference is the size of contracts that national ministries versus local governments can authorize without approval from a higher procurement entity.Footnote 18 Below, I describe the steps of an open and competitive procurement process as per existing legislation. Most tenders for infrastructure projects (or “works”) follow the process of national competitive tendering.
Local governments place an advertisement in a national daily newspaper with details of the infrastructure they plan to construct.Footnote 19 Contractors are given a minimum of two weeks and a maximum of six weeks to respond to the ad.
Contractors purchase standard tender documents from the local government. These documents cost approximately USD 35–50. Firms usually buy these documents from the district procurement officer. Before the close of the tender period, firms submit their bids in sealed envelopes. The proposals include details of the project specifications and costs, accompanied by the required certificates and documents. These certificates include one that verifies company registration (Company Registration Certificate), a bond securityFootnote 20, labor and tax clearance certificates, and a contractor certificate from the Ministry of Works and Housing (MWH), which classifies the contractor’s grade. In theory, firms are graded by the MWH based on the equipment they own and the value and success of previous contracts they have fulfilled. In practice, there is corruption in the process of firms registering with the MWH. It has been noted that the “complex, opaque and costly nature of the classification procedures increases opportunities for corruption.”Footnote 21
Upon delivery of a firm’s bid, a bureaucrat at the local government gives the firm owner a receipt showing the date and time when the tender was received. On the advertised day, tender proposals are opened in a meeting at the local government. Company owners (or their representatives) are allowed to be present at these meetings. Firms’ names, addresses, and quotes are read out at this meeting and immediately recorded. Before the Procurement Act was amended, evaluation criteria focused on the lowest price. However, the amended legislation provides a 10-item list that procurement entities may consider when evaluating bids, including price.Footnote 22 Whatever criteria the local government chooses must be documented in the tender documents.Footnote 23
Upon opening each proposal, bureaucrats confirm that the required documents and certificates are enclosed. Firms that fail to submit the required documents should be disqualified. In terms of evaluating the submitted bids, the mayor serves as the chair of the District Tender Committee. The secretary is the head of the procurement unit. The other seven members include the district budget officer, DCD, a legal officer, two heads of departments, and two committee chairs.
As I note, this is the formal process of how all contracts should be awarded. In practice, genuinely open and competitive contracting by local governments is rare. A local bureaucrat who was interviewed as part of another study stated unequivocally, “In all my years in the public service, I have never seen a contract awarded on merit.”Footnote 24 The selection of contractors is often personalized and politicized. Local mayors often go to great lengths to use public procurement to reward particular firms or individuals.
5.1.2 How to Manipulate Public Procurement in Ghana
Table 5.1 presents a range of methods that politicians and bureaucrats can use to manipulate procurement. To determine which, if any, of these methods occur, I conducted in-depth, semi-structured interviews with local bureaucrats and contractors who had previously won contracts from local governments.Footnote 25 To encourage honesty, these interviews were not recorded. Typically, I took notes using a laptop and typed respondents’ responses verbatim where possible. I also typed up further notes at the end of the interview.
Almost all bureaucrats who I interviewed agreed that abuse in public procurement was a significant issue, and that interference was led by local mayors who attempt to steer outcomes toward a favored contractor. Hand-picking which contractor will win a contract violates the principles of transparency and competition that legislation sets out. Discussing the topic of corruption in public procurement, a senior regional level bureaucrat I interviewed asserted:
It is a very deep concern. The Procurement Act is there, the process is there, but the abuse is huge. We know the processes and the regulations, but the abuse is too much  You don’t get value for money, and on top of that you get an incompetent contractor. (Interview with author, February 16, 2016)
Such remarks were common during interviews, but these responses beg the question of how manipulation actually occurs in practice. The methods in Table 5.1 differ in how visible they are to outsiders. This visibility will depend on the specificities of the legislation that operates in each country. For example, Ghana’s procurement laws mandate that local governments place adverts for new tenders in at least one national newspaper. If a local government sets the window of submission to be very short, this is highly visible; both contractors and bureaucrats who work in monitoring institutions, such as the country’s Public Procurement Authority, can observe this behavior. Similarly, detailed and restrictive eligibility criteria visibly restrict competition. Because public procurement is inherently administrative, most strategies to limit competition require the co-operation of bureaucrats. Bureaucrats may only be willing to participate in corrupt behavior if it is invisible. My interviews demonstrated that politicians and bureaucrats use discreet methods to undermine competitive procurement. The two most common methods they use I call restricted sales and secret information.
Restricted sales involve mayors unofficially controlling which firms can purchase tender application documents. To restrict sales, bureaucrats print only three copies of the application documents and sell them to a single contractor that is favored by the mayor.Footnote 26 When other firms attempt to purchase application documents, bureaucrats inform them that the materials are unavailable. The favored contractor then submits all three bids either in the name of three companies they owns or in collusion with firms owned by their friends. In the latter case, the contractor would ask their colleague to submit an incomplete application or to inflate the project budget to ensure they would not win the contract. As one Planning Officer that I interviewed explained when discussing the sale of forms to contractors:
DCEs [mayors] are the most powerful people when it comes to selection. They sell three or four copies [of the application documents], and then they get finished, and if I don’t know the DCE, they [the contractor] won’t go in for it [buying the form]. And then contractors do their own thing behind the scenes. (Interview with author, February 2, 2016)
Secret information involves an open tendering process. However, politicians tip the field in favor of their preferred contractor by providing them with non-disclosed information to ensure they submit the lowest bid. Usually, the favored contractor gets access to internally produced cost estimates for the project. This allows the contractor to submit a low-cost budget in line with the estimate provided by the engineering department of the local government. Contractors who do not have access to official estimates present higher bids, as they are unsure of the exact specifications required by the local government; erring on the side of caution, they pad their budgets. As one Internal Auditor that I interviewed explained:
Before they start bidding, [the district] engineer will come out with the engineer’s estimates  even before they start the publication [of the tender advertisement], they know who will get the contract
  They will give you [the preferred contractor] the engineer’s estimate; the rest will not have access to this information
  It’s like you are going to write an exam, and one knows the questions coming. (Interview with author, February 4, 2016)
If contracts are awarded to the lowest bidder, one may assume that this method results in value for money and limits the size of the kickback that politicians receive. However, in practice, this is usually not the case. While the contracted sum may be low, once the preferred firm has won the contract, the contractor renegotiates the contract sum with the local government. For example, the contractor may claim that prices for raw materials have increased and ask for additional funds. Projects can end up costing more than three times the original contracted sum.
5.2 Evidence of Favoritism in the Awarding of Contracts
To investigate potential personalism and the politicization of procurement contracts, in Section 5.2, I analyze individual-project-level data published by local governments. As I describe below, I analyze two complementary datasets. The first data set I constructed myself. It is restricted to the eighty local governments that I sampled to be part of this study and covers projects commissioned between 2008 and 2016. The second dataset includes projects from a nationwide sample of local governments but covers fewer years. This nationwide dataset was compiled by Martin Williams.Footnote 27
Using these data, I construct two proxies of manipulation: market fragmentation and geographic concentration. I calculate market fragmentation as the number of contracts awarded by a local government divided by the number of unique firms that win these contracts. This indicator tells the average number of contracts won by a single firm. Higher numbers suggest less fragmentation, with each firm winning more projects. A market fragmentation level of one shows that every contract is awarded to a distinct firm. Low levels of market fragmentation are a good proxy for malfeasance because, over multiple years, we would expect to see market consolidation around reputable companies with a good track record in completing projects. If it is typical for firms to win only one contract, this can suggest that projects are awarded to small firms and potentially not based on past accomplishments. It may be argued that firms only have the financial capital to conduct one project at a time. However, given that the timeline for most projects is less than six months, across multiple years, we should see firms able to win multiple contracts.
It could also be argued that limited access to private finance, as opposed to political interference, restricts the number of contracts that a single contractor bids for and can win. While private finance constrains firm development in Ghana, firms do not need to show that they can access the entire proposed contract sum when bidding for a project. Local governments also give contractors a “mobilization fund” – usually 15 percent of the contract sum – once the project is awarded so they can purchase the required startup materials. After the mobilization fund is dispersed, firms continue building up to a certain level (e.g. 50%) and then ask for payment from the local government up to that value. Given these arrangements, access to private finance is unlikely to be an adequate explanation for the levels of market fragmentation shown in the data.
To measure geographic concentration, I calculate the number of distinct local governments where firms win contracts. Lower numbers suggest greater concentration; at minimum, firms are only awarded contracts by one local government. In an open and competitive market, if a private company was to submit bids for the same project to Districts A and B, the firm should have an equal chance to secure the contract at either. In other words, firms should be able to win contracts across geographic space. However, where firm owners need personal connections to win contracts, we would see geographic concentration. When it is common for firms to win contracts from only one local government, we can question whether procurement transactions are competitive.
Other scholars have used similar geographic indicators to signal malfeasance, for example, noting whether a contractor is from the region that awarded the contract or from outside the region.Footnote 28 The logic here is the same: when contracts are awarded to firms from outside the region, it suggests that personal connections are not necessary to win a public contract. Thus, in India and Indonesia, the introduction of an e-procurement system was partly judged to be effective because it resulted in firms from outside of regions winning public contracts.Footnote 29
Geographic concentration is a relevant proxy for potential malfeasance in Ghana given the way political parties are structured. This structure can help to understand why firms only winning contracts in one district points to political interference. Each district represents either one or two electoral constituencies from which Members of Parliament are elected. Both of Ghana’s two major parties operate constituency-level committees of party executives. If each mayor is incentivized to award contracts to a distinct set of constituency-level executives, we would expect to see firms only winning contracts in a single district. This structure also suggests why market fragmentation is a good proxy – mayors have an incentive to give contracts to each of the individual constituency-level party executives. As discussed further below, many interviewees note this strategy.
In terms of geographic concentration, it is also important to note that it is not the case that it would be financially inefficient for firms to work across multiple districts because of potentially vast distances between them. On average, the distance between a district capital and the next nearest district capital is 12 miles (19 km) or roughly 30 minutes in a car driving at 24 miles per hour.Footnote 30
5.2.1 Dataset of Projects Compiled Across Local Governments in the Sample
I compiled an original dataset of infrastructure projects awarded by local governments across eighty local governments.Footnote 31 These projects were awarded between 2008 and 2016. This information is contained in documents called “Annual Progress Reports” (APR) that local governments submit each year to the country’s national planning body. In terms of accuracy, there is little reason to think there is purposeful bias in the information that local governments submit. Local bureaucrats compile the APR and submit it to the National Development Planning Commission. This planning body does not scrutinize the content of the APRs. While it would be misleading to suggest that APRs are always comprehensive – for example, projects may be missed – there is no reason to expect that omissions are purposeful but instead result from human error. Furthermore, a project(s) accidentally missed off the list in one year will likely enter the report in the subsequent year. Thus, eventually, most projects will enter the data.
The dataset that I constructed includes 5,204 projects. These projects have a median expected time of completion of five months. Not all projects in the progress reports record the name of the contractor who won the contract. In my data, only 3,837 (73.7%) projects recorded include the name of the firm.Footnote 32 Of these projects, 105 (2.74%) note the contractor as the local government itself, as opposed to a private company.Footnote 33 This leaves 3,732 unique projects where the local government contracted with an identifiable private firm.Footnote 34
5.2.2 Dataset of Projects Compiled Across All Local Governments
I also analyze an alternative dataset. This dataset was constructed by Martin Williams using the same reports. Williams’ data has the advantage of covering local governments located in all regions in the country: his dataset includes projects across 162 districts. There are two disadvantages of his dataset. First, it covers a shorter period (2011–13) than the dataset I constructed. Second, in the data, contractor names are anonymized (assigned a numerical identification number). This meant that I could not independently verify whether each contractor was truly distinct.Footnote 35
Given the advantages and disadvantages of both datasets, for most of the analyses below I present parallel analyses using both sets of data. In Williams’ dataset, numerical firm IDs are available for 7,755 entries, corresponding to approximately 6,912 unique projects.Footnote 36
Table 5.2 uses both datasets to display the types of projects that local governments typically execute.Footnote 37 By far the most common type of project is the construction of new school classrooms. Classroom projects represent 37 percent of all projects in both datasets. The next most common type of projects are the construction of administrative offices and staff housing, which represent between 13% and 16% of projects. After this, common projects include the construction of new toilets (10–12%), health clinics (4–8%), roads (6–10%), and boreholes and water projects (5%).
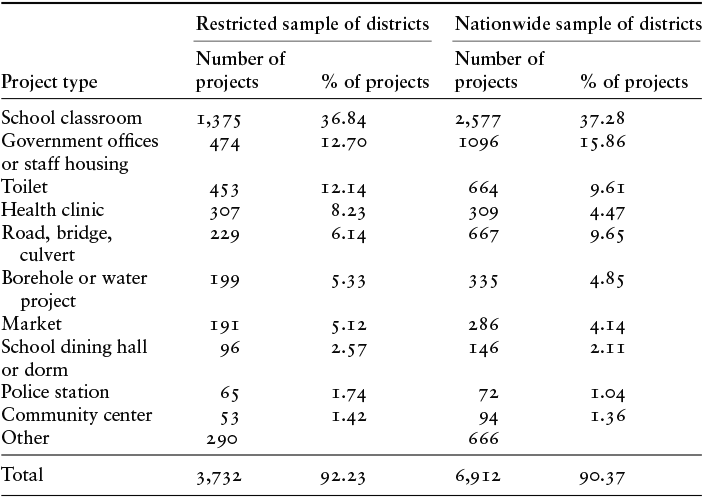
Table 5.2 Long description
Table compares project types between a restricted sample of districts and a nationwide sample, with columns for number of projects and percentage of projects in each sample. Categories include school classroom, government offices or staff housing, toilet, health clinic, road/bridge/culvert, borehole or water project, market, school dining hall or dorm, police station, community center, and other. School classroom projects are the largest category in both samples (1,375; 36.84% and 2,577; 37.28%). Government offices or staff housing follow (474; 12.70% and 1,176; 15.86%). Remaining categories have smaller shares, generally below 10%. Totals are 3,732 projects in the restricted sample and 6,912 in the nationwide sample.
Note: I use project descriptions to classify projects. I use the “projtype” variable in the nationwide dataset to guide classification. To match my coding, I add two additional categories: (i) police and (ii) community center projects. I also collapse (i) road and culvert projects, (ii) borehole and water projects, and (iii) government offices and staff housing projects into single categories, as shown in this table.
5.2.3 Market Fragmentation
Analysis of the two datasets displays evidence of high levels of market fragmentation. Across the 80 local governments in my sample, 1,820 firms were awarded the 3,732 contractor-identified projects. In other words, firms received an average of 2.05 projects. In the dataset that uses the nationwide sample, 6,912 projects were awarded to 4,051 firms, which is equivalent to 1.71 projects per firm.
However, across both datasets, the median number of projects awarded to a firm is one. Indeed, the data show that between 60 and 70 percent of firms only win a single project during the periods considered. In general, the data suggests that local governments award contracts to small contractors who undertake a single project. As noted, this is not because projects are excessively time-consuming: the average (median) project is contracted to last a total of five months.
I also consider whether levels of market fragmentation are similar across different project categories. For example, it could be argued that fewer firms would have the necessary equipment to engage in road construction. Therefore, there may be greater market consolidation for projects in this category. Table 5.3 displays market fragmentation in each project category.Footnote 38 The figures in Table 5.3 show some variation in market fragmentation. Specifically, market fragmentation is between 1.13 projects per firm and 1.58 projects per firm across project categories. However, overall, there is little evidence of market consolidation across any type of project.
| Project type | Restricted sample of districts | Nationwide sample of districts |
|---|---|---|
| School classroom | 1.58 | 1.50 |
| Government offices or staff housing | 1.32 | 1.36 |
| Toilet | 1.53 | 1.37 |
| Health clinic | 1.32 | 1.25 |
| Road, bridge, culvert | 1.38 | 1.49 |
| Borehole or water project | 1.51 | 1.44 |
| Market | 1.28 | 1.23 |
| School dining hall or dorm | 1.28 | 1.15 |
| Police station | 1.25 | 1.18 |
| Community center | 1.20 | 1.13 |
5.2.4 Geographic Concentration
To construct the indicator of geographic concentration, I aggregate project-level data to the level of individual firms. Table 5.4 displays the number of local governments that each firm wins contracts from. The first row shows that, across the districts in my sample, 82 percent of firms receive contracts from only one local government. In the nationwide dataset, 88 percent of firms receive projects from a single local government. The increase in this figure may partly be a product of the shorter time period considered. These figures also make sense given that most firms only win one project. A minority of firms won contracts from two local governments (the second row): 11.65% of firms across the eighty districts in my sample, and 8.91% of companies in the nationwide sample. Very few firms win contracts at more than two local governments: about 5%.
| Number of local govts. | Restricted sample Number of firms | % | Nationwide sample Number of firms | % |
|---|---|---|---|---|
| 1 | 1,496 | 82.20 | 3,571 | 88.15 |
| 2 | 212 | 11.65 | 361 | 8.91 |
| 3 | 71 | 3.90 | 65 | 1.60 |
| 4 | 21 | 1.15 | 27 | 0.67 |
| 5+ | 20 | 0.80 | 27 | 0.67 |
| Total | 1,820 | – | 4,051 | – |
Focusing on contractors who were awarded more than one contract,
Figure 5.2 displays the median number of (i) local governments (districts) and (ii) regions where firms win projects. The plot on the left displays these statistics across eighty local governments, while the right-hand plot presents the data from the national sample. The  -axes end when there is only a single firm that won this many projects.
Geographic distribution of contracts awarded to firms
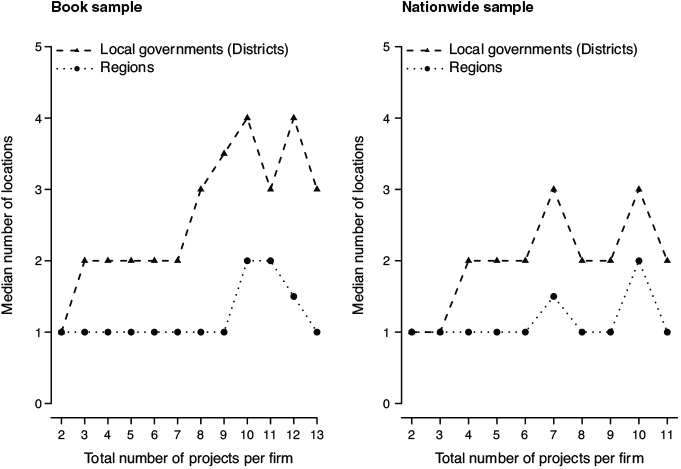
Figure 5.2 displays two important findings. First, the vast majority of firms win contracts in only one region. The left-hand plot of Figure 5.2 shows that only firms that win ten or more contracts work across multiple regions. The right-hand plot of Figure 5.2 shows that even when firms win up to nine contracts, these are typically in a single region.
Second, considering districts, most firms are awarded contracts from at most two local governments. The left-hand plot shows that even when firms win up to seven contracts, these are from two local governments. The right-hand plot shows that even firms that win up to eleven do so at only two local governments. Overall, these data display high levels of geographic concentration in awarding contracts, which suggests that the distribution of contracts is not competitive and that firms need to develop personal connections within politicians and bureaucrats at a local government to win contracts.
5.2.5 What Type of Districts See the Highest Levels of Interference in Public Procurement?
Mayors who face stronger electoral pressures may be more likely to award contracts to firms in exchange for party donations or kickbacks. I re-analyze the contract-level data to assess whether personal connections appear more important in some districts than others. Mayors who operate in more electorally competitive districts are likely to be expected to raise more campaign funds during election campaigns than mayors in non-competitive constituencies. Accordingly, the incentive to reward firms that are politically connected may be stronger in competitive districts. Because mayors need additional funds to run in parliamentary primaries, the incentives for personalism in contracting should also be higher in districts where mayors are ambitious to become the local MP candidate.
As discussed earlier, the fact that a firm only wins contracts in one district may imply that these firm owners are personally connected to politicians and bureaucrats in that district. In other words, winning contracts in a single district may serve as a proxy for personal connections. I investigate whether projects are more likely to be allocated to “single-district firms” in electorally competitive districts. I interpret a positive association between electoral competition and contracts being awarded to single-district firms as evidence that competition incentivizes manipulation in public procurement.
I code a district as competitive when the electoral margin in the prior presidential election was less than 12 percent. This was the original operationalization of competition that I used to stratify districts to select the sample of districts. The dependent variable is the likelihood that a local government awards a contract for an infrastructure project to a single-district firm. For these analyses, I use the data from the nationwide sample of projects because it includes data from more local governments, which gives me greater leverage to analyze variation across different types of districts.
As a first analysis, I calculate the mean share of contracts awarded to single-district firms in competitive and non-competitive districts. In these calculations, I classify districts as competitive or non-competitive using the election results in the prior elections, distinguishing between projects commissioned after the December 2008 election (in 2011 and 2012) and those commissioned after the December 2012 election (in 2013). Table 5.5 displays the mean share of projects awarded to single-district firms in competitive and non-competitive districts in each electoral period.
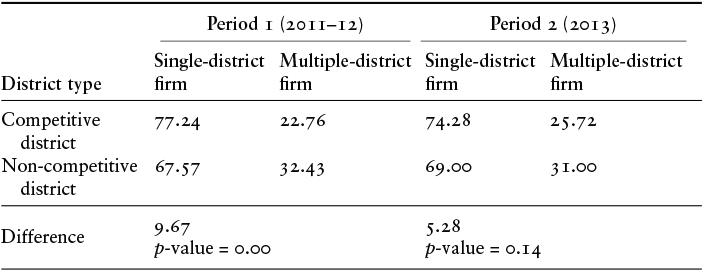
Table 5.5 Long description
Table presenting percentages of single district firms and multiple district firms across competitive and non competitive districts during two periods: 2011 to 2012 and 2013.
The table is divided into two major sections by time period. Each period contains two columns labeled Single district firm and Multiple district firm. Rows are organized by district type, including Competitive district, Non competitive district, and Difference.
For the 2011 to 2012 period, competitive districts contain 77.24 percent single district firms and 22.76 percent multiple district firms. Non competitive districts contain 67.57 percent single district firms and 32.43 percent multiple district firms. The reported difference for single district firms is 9.67 percentage points with a p value of 0.00, indicating statistical significance.
For the 2013 period, competitive districts contain 74.28 percent single district firms and 25.72 percent multiple district firms. Non competitive districts contain 69.00 percent single district firms and 31.00 percent multiple district firms. The reported difference for single district firms is 5.28 percentage points with a p value of 0.14, indicating the difference is not statistically significant at conventional levels.
Within each district type and time period, the percentages for single district firms and multiple district firms sum to 100 percent.
Table 5.5 shows that in the first period, on average 77.24 percent of projects were awarded to single-district firms in competitive districts. This number drops to 67.57 percent of contracts awarded to single-district firms in non-competitive districts. The difference between these two means is 9.67 and is statistically significant at less than the 1 percent level. These results support the idea that procurement is more likely to be politicized in competitive districts.
In the second period, I find that 74.28% of contracts were awarded to single-district firms in competitive districts and 69.00% in non-competitive districts. While the difference in these two means (5.28%) is not statistically significant at conventional levels ( -value of 0.14), the results point in the same direction. Overall, this initial analysis suggests that there is a positive association between electoral competition and contracts being awarded to single-district firms, and suggest that high levels of competition induce personalism in public contracting.
This difference-in-means analysis above does not consider potential confounding variables that may obscure the results. For example, competitive districts may also be more remote, which may account for the differences we see. To account for potential confounders, I next conduct a multivariate regression analysis. As firms may be less likely to bid for and win contracts in multiple districts when they are based in a rural locations, I control for how remote each district is using two proxies: (i) the distance to the nearest district capital and (ii) the share of houses in the district with electricity. This analysis also controls for region and project sector, and include funding-source fixed effects.
My theory suggests that independent of district-level electoral competition, mayors’ individual political ambitions may also increase their incentive to manipulate public procurement. I classify mayors as politically ambitious when they competed in the parliamentary primary. In the analysis, I also interact electoral competition and political ambition to see whether the combination of these two factors further perpetuates personalism in contracting. Again, in the regression analysis, I disaggregate projects between the two electoral periods, measuring district-level competition using results from the prior election.
Table 5.6 displays the results of the first set of linear probability models. This table includes projects awarded in 2011 and 2012, classifying competitive versus uncompetitive districts using the December 2008 election results. Column 1 is a bivariate regression and, similar to the difference-in-means analysis, demonstrates a positive relationship between electoral competition and the likelihood of a contract being awarded to a single-district firms. Moving from a non-competitive to a competitive districts increases the likelihood by 9.9 percentage points. Column 2 includes the two proxies for remoteness, and fixed-effects for region, project type, and funding source. Again, the results show a positive relationship between competition and single-district firms winning contracts, with competition increasing the likelihood by 7.6 percentage points. Columns 3 and 4 include the indicator for political ambition. In these two columns again, the positive relationship between electoral competition and contracts to single-district firms remains. The results in column 4, which includes the fixed effects and holds constant proxies for remoteness also suggests an interactive effect between competition and mayoral ambition: when districts are both competitive and the mayor runs for a parliamentary seats the likelihood of contracts being awarded to single-district firms increases by 12.5 percentage points. Compared to districts that are not electorally competitive and the mayor is not politically ambitious. This suggests that political ambition interacts with electoral competition and further increases the likelihood of personalism in public procurement.
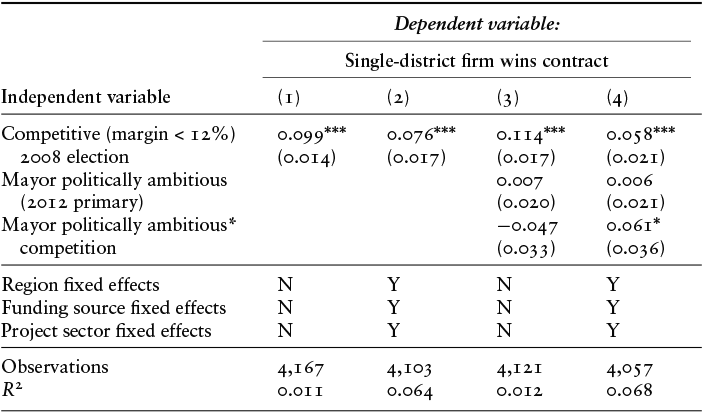
Table 5.6 Long description
Table presents regression results with the dependent variable indicating that a "single-district firm" won the contract. Independent variables include competitive elections with margin less than 12 percent in 2008, mayor politically ambitious in the 2012 primary, and their interaction. Competitive elections show positive and statistically significant coefficients in all models, ranging from 0.058 to 0.114. Mayor political ambition alone is small and not statistically significant, while the interaction term is negative in model (3) and positive with weak significance in model (4). Fixed effects for region, funding source, and project sector vary across models. Observations range from 4,057 to 4,167.
Note: This table includes projects awarded in 2011 and 2012.
* p < 0.1; **p < 0.05; ***p < 0.01.
Table 5.7 displays the results of the next set of linear probability models. This table includes projects awarded in 2013, using the December 2012 election results to classify districts as electorally competitive or not. Column 1 displays a positive relationship between competition and the likelihood of a single-district firm being awarded a contract. This persists in column 2 with the inclusion of controls. The results are similar to those presented in Table 5.6 with the likelihood of a single-district firm being awarded a contract increasing by 9.0 percent. Columns 3 and 4 include a variable that indicates whether a mayor ran for the primary in 2015, which is taken as an indicator of political ambition. Once this variable is included, competition is no longer independently associated with single-district firms winning contracts. However, these analyses show that when districts are both electorally competition and the mayor is politically ambitious it is much more likely that contracts will be awarded to single-district firms. The average marginal effect (AME) of this interaction term signifies a 17.2 percentage point increase in the likelihood of contracts being awarded to single-district firms.
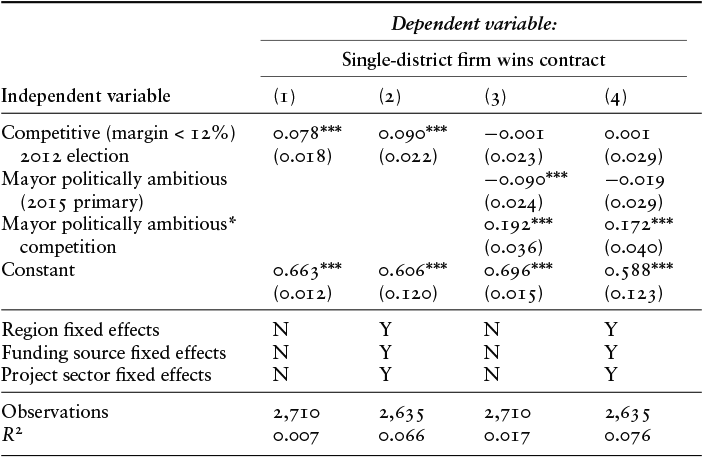
Table 5.7 Long description
Table presents regression results examining factors influencing whether a single-district firm wins a contract across four models labeled (1) to (4). Independent variables include competitive elections with margin less than 12 percent in 2008, mayor politically ambitious in the 2012 primary, and the interaction between political ambition and competition. Competitive elections show positive and statistically significant effects across all models, with coefficients ranging from 0.058 to 0.114. Mayor political ambition alone is small and not statistically significant in models where it appears. The interaction between political ambition and competition is negative in model (3) and positive with weak statistical significance in model (4), indicating mixed moderating effects.
Models (2) and (4) include fixed effects for region, funding source, and project sector, while models (1) and (3) do not. Observations range from 4,057 to 4,167 across models.
Note: This table includes projects awarded in 2013.
* p < 0.1; **p < 0.05; ***p < 0.01.
Overall, the analyses in Section 5.2 demonstrate the validity of using geographic concentration as a proxy for malfeasance in public procurement. Proxying personalism with the share of contracts awarded to single-district firms, I find that district-level electoral competition and mayoral ambition are positively associated with personalism. The districts with the highest levels of personalism in public procurement are those that are both electoral competitive and where the mayor is politically ambitious. An important question remains in terms of the types of connections that single-district firms may have, and to whom. Section 5.3 investigates the type of firms that typically win contracts issued by local governments.
5.3 What Types of Firms Win Contracts?
The project-level data presented above suggests that firm owners need to develop personal connections to local politicians and bureaucrats to win contracts, and that typically firm owners only build the required connections at a single local government. In Section 5.3, I further consider the characteristics of firms that typically win public procurement contracts awarded by local governments. Above, I proposed that mayors seek to interfere in public procurement processes to ensure that two types of firms win contracts: donating firms and party firms. I discuss each type of firm in turn.
5.3.1 Donating Firms
Donating firms are contractors who donate either money or goods to a mayor or her party. Politicians have been shown to reward firms who donate to party coffers with public contracts across a range of contexts.Footnote 39 In Ghana, mayors use donations from companies to support presidential or parliamentary primary campaigns (or both), and to secure their appointment as mayor. Alongside money, donations can be in-kind. For example, common goods include campaign posters, food for party agents, or fuel for party vehicles. In addition to covering campaign costs, donations from firms can help mayors engage in relational clientelism, allowing them to assist voters and polling station executives who experience personal hardships. Indeed, mayors often give money to individuals for expenses such as hospital bills, family funeral costs, or their children’s school fees.
Most of the bureaucrats who I interviewed said that financiers had usually already donated to the party when they receive a contract from the local government. Thus, contracts are a way for politicians to pay them back for their prior contributions. Given that local firms cannot be sure which party will win the election, this suggests that financiers may donate to both major parties, or they may donate to a single party, confident that in the not-so-distant future this party will eventually win the presidency.
Explaining the awarding of contracts to donating contractors, one DCD that I interviewed claimed that:
The Procurement Act gives us every step we need to take  [But] they [mayors] tell you “give it to this contractor.” They don’t think about development, they think about how to win elections, and they need funds. The contractor needs to recoup what he has spent on the party. They [winning contractors] are all party financiers. (Interview with author, February 19, 2016)
Another interviewee spoke about mayors repaying businesspeople who had supported their mayoral nomination. As noted in Chapter 3, while mayors are appointed by the president, they must receive the support of two-thirds of the members of the local council. Sometimes, mayoral nominees have to exchange money with local councilors to win their support. Thus, one bureaucrat noted: “When the DCE is nominated [by the president] they have to go through the mill. You have a businessman who has financed you. [When you become mayor] It is payback time for your sponsors” (Interview with author, February 16, 2016).
In short, as in other contexts, public contracts are often awarded as part of a quid pro quo between politicians and private companies. An alternative scenario is that contracts are awarded not to private businesspeople, but to companies that are headed by affiliates of the governing party.
5.3.2 Party Firms
Party firms are companies that local political party executives operate. Ghana’s two major parties are organized hierarchically, with nearly identical organizational structures.Footnote 40 Standing committees of internally-elected executives serve at the national, regional, parliamentary constituency, and polling station levels.Footnote 41 Local party elites organize and engage in multiple voter mobilization events, including rallies, community meetings, and house-to-house canvassing. Each level of the party is tied to the one above through the internal promotion process. For example, local party executives form the selectorate in parliamentary primaries. Rising in either party relies on the formal (i.e. electoral) and informal support of party officials serving at lower levels in the party. Mayors’ reliance on local party executives to advance in their careers often gives them an incentive to award contracts to local elites.
Most mayors seek to award contracts to constituency party executives, rather than polling station executives. This is because constituency executives are more powerful than polling station executives, and because there are fewer of them. Granting public contracts to constituency executives is an easy way for mayors to curry favor with them. Awarding contracts to constituency party executives can have three positive effects. First, considering campaign finance, awarding contracts to party officials often means putting money in the hands of the ruling party. Party executives will likely allocate a portion of the contract sum to party activities or donate directly to the mayor.
Second, awarding contracts to constituency party executives can buy and reward their activism. Awarding contracts to party executives can serve as a reward for prior activism and an incentive to work hard in-between elections. Constituency party executives are also organizational nodes connected to hundreds of polling station executives. Polling station executives are often the day-to-day face of the party that citizens see and interact with. Politicians thus distribute contracts to constituency party executives to gain access to their networks of polling station executives.
Third, mayors distribute contracts to constituency party executives to foster their loyalty. Conditional on the president being re-elected, the mayor needs the support of constituency executives to ensure that their name is put forward to the president for re-selection. Further, these constituency party executives help mayors mobilize the support of polling station executives during parliamentary primaries. Summarizing the trend for local government to award contracts to party executives, one senior bureaucrat noted:
The party people have companies – the [Constituency] Chairman, Secretary, the Organizers  They use the money for themselves and for the party organization. DCEs [mayors] are under pressure from the party. If they don’t yield to their demands, they will agitate to get them removed. (Interview with author, February 16, 2016)
Another senior bureaucrat noted:
The executives of political parties have to be rewarded, and the easy way to reward them is to give them projects. First, they can take on the projects themselves. If they have the resources, they register a company and turn into contractors overnight. Second, they take the project and give it to a qualified contractor, a brother, or a friend. The DCE [mayor] is a political person from among the government party, and these party executives organize and campaign for the party to come to power. The contract is a reward, and second, the DCE wants to win the support of party members because they will be removed. Most DCEs who are removed are a product of agitation from among the party. (Interview with author, February 17, 2016)
As discussed earlier, awarding contracts to local party executives explains why the vast majority of companies only win contracts awarded by a single local government because constituency-party executives only operate within a single district.
5.3.3 Empirical Evidence That “Party Firms” Are More Likely Than Non-party Firms to Win Contracts
To further investigate the potential role that firms owners’ involvement in party politics plays in determining whether they win contracts, I conducted a survey experiment with local bureaucrats. The survey experiment manipulated two characteristics of firms: their status as party firms (firms owned by party executives) or not and their experience in the construction industry. I investigate whether these characteristics influence bureaucrats’ perceptions regarding the likelihood of firms being awarded contracts. Specifically, the survey experiment followed a two-by-two design. Table 5.8 shows the four treatment conditions. I varied construction experience by stating whether the firm has a lot of experience or not a lot of experience. I signaled a firms partisan status by telling bureaucrats whether it was owned by a local executive of the ruling party or whether the firm owner was politically independent.
| Firm type | No construction experience | Construction experience |
|---|---|---|
| Party firm | Treatment 1 | Treatment 2 |
| Independent | Treatment 3 | Treatment 4 |
I administered the survey experiment as part of the survey with local bureaucrats that I discuss in Chapter 1. The sample includes bureaucrats working in local governments in highly-ranked positions ( ). The treatment was randomized at the level of individual bureaucrats.Footnote 42
The treatment sentences were embedded in a roughly fifty-second conversation between two bureaucrats who were hypothetical colleagues working at a local government. To promote privacy, respondents listened to this conversation using headphones. During the conversation, the two bureaucrats discussed bids from firms to build a new school classroom block (the most common type of project). The script stated that three contractors were bidding on the contract, each had submitted the required certificates, and their budgets were similar. One of the bureaucrats in the script says that they know a little more about one of the firms. At this point, the treatment sentences are included, noting the firms’ (non) partisan ties and their (lack of) experience in construction. After listening to the conversation, bureaucrats were asked: How likely is the contractor that is being discussed to receive the project? Responses were on a seven-point scale from “very likely” (7) to “very unlikely” (1). To solicit honest responses, respondents input their answers privately on a cell phone.
Results of the Survey Experiment with Bureaucrats
Table 5.9 displays the mean outcome response in each treatment condition. Figure 5.3 displays the same means graphically. The results show that for firms with both high and low levels of construction experience, being a party firm has a statistically significant positive effect on bureaucrats’ perceptions of likelihood of selection. The positive effect is 1.97 points for contractors without construction experience, and 0.57 points for firms with construction experience. Pooling across conditions, the AME of being a party firm is 1.23 ( <0.001).Footnote 43 Regarding construction experience, the means in Table 5.9 show that the average treatment effect of construction experience for party firms is 0.29 points, however, this is not statistically significant. In other words, bureaucrats perceive party firms as equally likely to receive a contract whether they have experience in construction or not. The same is not true for politically independent firms. Independent firms experience a significant positive increase when they have construction experience, with an average treatment effect of 1.69 points. Accordingly, pooling across conditions, the AME of construction experience is 0.97 points (
 <0.001).
| No construction experience | Construction experience | Average treatment effect | |
|---|---|---|---|
| Party firm | 5.07 | 5.37 | 0.29 |
| Independent | 3.11 | 4.80 | 1.69*** |
| Average treatment effect | 1.97*** | 0.57** | – |
Note: The dependent variable is out of seven with higher numbers representing a higher likelihood of contractor selection. ** 0.05; ***
 0.01
0.01
The mean outcome response in each treatment condition
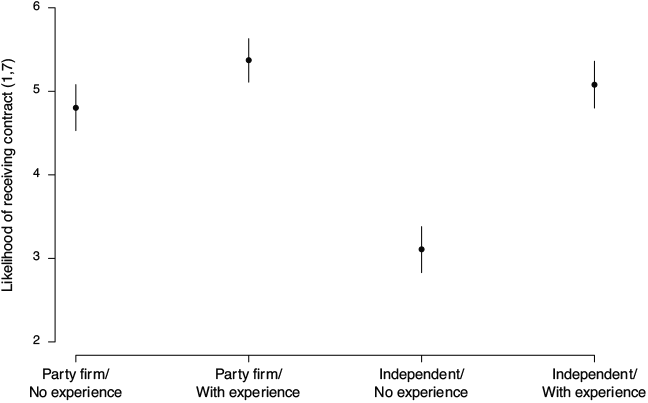
To summarize, the firms that bureaucrats perceive as the most likely to receive contracts are party firms, independent of these firms’ construction experience. There is no penalty for party firms that do not have construction experience. Further, the fact that the AME is higher for partisanship than for construction experience, suggests that in general, partisan cronyism overrides construction experience in determining contractor selection.
I next focus on party firms, and consider whether bureaucrats who work in districts that are highly competitive or in districts where the mayor is politically ambitious are more likely to expect party-affiliated firms to win contracts. In this analysis, I calculate the AME of partisanship, subsetting the data across four types of districts. I estimate political ambition using a variable that indicates that the mayor ran for the parliamentary primary in 2015. Figure 5.4 presents the AMEs of the party firm treatment across each district.
The AME for party firms in different types of districts
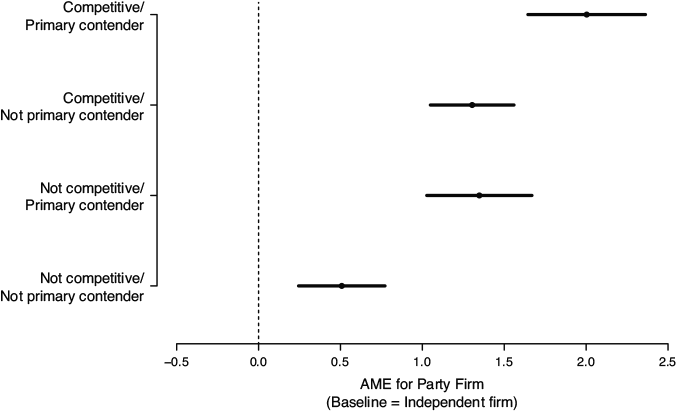
Figure 5.4 shows the AME for party firms is positive and significant in every type of district, which suggests that bureaucrats expect some level of partisan contracting in every district. This is consistent with the results in Tables 5.6 and 5.7 which show a high share of contracts being awarded to single-district firms in all types of districts. However, the results below display important heterogeneity across districts. Bureaucrats are less likely to expect partisanship contracting in districts that are neither competitive nor where the mayor is politically ambitious. Figure 6.3 shows that when either of these conditions is true, bureaucrats are more likely to expect partisan bias in contracting. These results also demonstrate an interactive effect: partisan contracting is most likely in districts that are both competitive and where the mayor is ambitious. Again, this is consistent with the results in Tables 5.6 and 5.7. Taken together, these analyses provide compelling evidence that mayors’ incentives drive public procurement outcomes. When mayors operate in competitive districts, they are compelled to capture public funds to help secure an electoral majority for their party’s presidential candidate. These incentives interact with their own incentives to capture funds to support their parliamentary primary campaigns. While we see evidence of personalism in all districts, evidence of personalism is highest in districts that are both competitive and where the mayor themselves has ambitions to rise in politics.
How Do Firms with Limited Construction Experience Win Contracts?
The results from the survey experiment imply that local governments often award contracts to firms that have no experience or limited experience in construction. An important question to ask if how such firms win contracts given that contractors are required to present up-to-date certificates – including registration with the MWH – when they bid for projects?
The first possibility is that local governments turn a blind eye when firms do not present all the required certificates. Prior work has noted that local governments often award contracts to firms that do not submit the necessary certificates.Footnote 44 In this study, the author compiled an original dataset of 7,700 local government projects using APR from 2012. He found that approximately half of all projects were awarded to uncertified firms.Footnote 45 Furthermore, this data showed that in no district in the country where more than 25 percent of projects awarded to firms that were officially registered with the Ministry of Water Resources, Works and Housing, as required.Footnote 46 It should be noted that these figures may overestimate the share of contracts given to unregistered firms as they assume that the data obtained from the Ministry was truly a comprehensive record of all registered firms.
A second way for inexperienced firms to win contracts is for these firms to borrow documents from experienced firms. For example, a mayor might promise a project to a local party executive, irrespective of whether they operate a construction company or not. This individual will then pay a certified contractor to borrow their certificates. The tender application will be made in the name of the experienced firm, and payments will be made to their bank account. Bureaucrats are likely to know when this occurs, and thus know, in effect, that contracts are being awarded to inexperienced contractors. In the interviews that I conducted with contractors, many said that there have been occasions where they had been approached by individuals to lend them their certificates. Some contractors said that they had done so. A minority of contractors that I interviewed said that they are unwilling to lend out their certificates because they did not want their firm’s name to be associated with low-quality work.
5.4 The Consequences of Corruption in Public Procurement on Infrastructure Quality
In Section 5.4, I consider the downstream costs of corruption and personalism in public procurement decisions. All said and done, it is hard to overstate the implications of non-competitive procurement practices on local development outcomes. There are at least four ways in which manipulated procurement leads to inferior outcomes, including low-quality public infrastructure and a disrupted local economic market.
First, when personalism influences selection, hired contractors – experienced or inexperienced – immediately deduct the money they pay in bribes to politicians or bureaucrats from the contract sum. Thus, personalism in selection reduces the money available to spend on building materials and equipment. Across local governments, it is typical for firms to pay kickbacks to the value of 10 percent of the contract sum to local politicians, typically to mayors. If a firm owner was awarded the contract via a web of political connections, this 10 percent share may be repeated across multiple individuals. Accordingly, as much as 30% to 50% of the final contract sum can be spent on kickbacks alone.Footnote 47 To recover these expenses, contractors will are likely to use less expensive materials or instead of renting equipment will go ahead without it. For example, rather than hire a professional cement mixer they may mix cement manually. The size of projects may also be scaled down, for example, the size of school classrooms will be scaled down, or fewer kilometers of roads will be paved.
Referring to the need to pay bribes to secure a contract, one contractor I interviewed asserted that: “If they stopped taking this ‘percentage-percentage,’ maybe you will get a good job. This percentage, it leads to shoddy work” (Interview with author, February 27, 2018).
Second, manipulation can lead to inexperienced firms winning public contracts. This is obviously undesirable, because firms with no or limited experience in construction will struggle to do high-quality work independent of the financial resources that they dedicate to the project. Furthermore, these firms are unlikely to have the necessary tools or equipment to construct the new infrastructure to a high standard. The results will be low-quality infrastructure which can deteriorate quickly, but more alarmingly, it can lead to serious injuries: for example, school pupils have been killed while at school when classrooms have collapsed, or have died while using public toilets.
Third, it is difficult for bureaucrats to hold politically-connected contractors to account. Contractors can report bureaucrats to mayors if they complain of their workmanship, and local politicians may punish (or attempt to punish) bureaucrats for such behavior. In exchange for the kickback, a mayor has essentially given their protection to the firm that they award the contract. Should a bureaucrat complain either to the firm owner, other bureaucrats, or the politicians themselves of the low-quality of work, they can suffer negative consequences. As one Planning Officer noted: “Once the person has political linkages, when he is doing something substandard, it becomes very difficult to bring him to book, as then you become a political opponent and you are kicked out the district.” (Interview with author, February 5, 2016).
Fourth, and finally, by increasing market uncertainty, personalism in public procurement decisions can lead rational firm owners to under-invest in their companies.Footnote 48 In a competitive marketplace firms rely on their professional reputation and track record to obtain future contracts. Firm owners have direct control over work quality. However, when firms win public contracts based on their personal connections there is uncertainty in terms of the firms future revenue stream. The biggest source of uncertainty results from changes in governments. Uncertain whether the party they are associated will remain in office in the future, firm owners underinvest in, for example, equipment, through fear that their future revenue streams will dry up. The result is a shortage of high-quality firms in the marketplace.
In summary, personalism in contracting has severe consequences on both individual project outcomes, and the broader health and growth of local economic marketplaces. These implications become more serious when personalism is the norm rather than the exception, and can lead to significant overall waste in public resources. One senior bureaucrat who I interviewed estimated that 60 percent of local government budgets would be saved if there was a competitive procurement process. In other words, personalism can lead to more public resources being diverted to personal and political purposes than dedicated to development.
5.5 Conclusion
The results in Chapter 5 lead to several important conclusions. Data on actual contractor selection shows a highly fragmented and geographically localized market of contractors. Local governments award the majority of contracts to firms whose operations are limited to one or two districts. Most contractors win a single contract over the years studied. The results from the survey experiment with bureaucrats shed light on the types of firms that win contracts. These results suggest that partisan ties are very influential in determining which firms are awarded contracts. Bureaucrats believe that firms with partisan ties can win contracts with local governments irrespective of whether these firms have experience in construction. The implications for non-competitive procurement on development are the provision of low-quality public infrastructure.
Public procurement offers mayors an opportunity to line their campaign chests and advance their political careers. The evidence presented above suggests higher levels of interference in competitive districts and in districts where mayors have ambitions to rise in the internal party hierarchy to run for national political office. Local politicians use public contracts to capture campaign finance and to buy the support of local party elites.
Chapter 5 examined how politicians’ control over bureaucrats influences which firms win public contracts and how this, in turn, affects the cost and quality of infrastructure. Chapter 6, I shift focus from who builds infrastructure to where infrastructure is placed. Specifically, I investigate how career control can shape the within-district allocation of new public infrastructure across communities.
As discussed in previous chapters, a key distinction in how public resources are distributed lies between programmatic and non-programmatic approaches. Programmatic distribution occurs when public resources are allocated according to pre-defined, public criteria.Footnote 1 In contrast, non-programmatic distribution is discretionary, with resources awarded to individuals or communities based on non-transparent, and often political, criteria.
A large literature has examined how politicians attempt to politicize the placement of public infrastructure, including roads, water wells, and electricity.Footnote 2 More recently, scholars have turned to explaining variation in the degree to which politicians can successfully target public goods to selected voters. One important constraint is local demography: specifically, the extent to which co-partisan (or opposition) voters live in distinct (segregated) versus mixed (non-segregated) communities. Low levels of partisan segregation (i.e. high levels of partisan heterogeneity) make it impossible for politicians to use local public goods to reward their electoral supporters, due to the non-exclusive nature of such goods.Footnote 3
Another, less studied factor that may constrain politicians is bureaucratic insulation. High levels of bureaucratic autonomy can result in bureaucrats constraining politicians’ attempts to target public resources to particular communities.Footnote 4 When bureaucrats have the autonomy to implement policies programmatically, they may be unwilling to engage in partisan favoritism on politicians’ behalf. Instead, they can apply objective criteria to allocate projects based on factors such as current infrastructure levels, local demand, and communities’ relative level of deprivation.
Chapter 6 assesses the degree to which infrastructure allocation within districts is politicized and whether bureaucrats can effectively resist political interference in Ghana. It is organized into three sections. Section 6.1 provides a comprehensive overview of the formal process through which local governments plan new infrastructure within districts. I then discuss prior research that explains why the actual allocation of projects can deviate from local governments’ plans. One important reason, consistent with the larger body of research highlighted above, is that politicians seek to direct resources to particular communities. Comments I received from bureaucrats during interviews support this conclusion, with many bureaucrats claiming that mayors frequently attempt to interfere with the allocation of projects to communities.
Section 6.2 presents observational data on project placement across districts in Ghana’s Central Region. Working in collaboration with local bureaucrats, I identify the precise locations of projects constructed between 2013 and 2016 and link these locations to historical election results. The regression analysis I conduct reveals a positive association between the incumbent party’s vote share in a community in the prior election and the number of projects they receive. Importantly, the results also highlight the role of community needs in allocation, with poorer communities more likely to receive projects than wealthier ones. This pattern suggests a potential tug-of-war: politicians try to reward co-partisan communities, while bureaucrats push for allocations based on need.
In Section 6.3, I complement this observational analysis with experimental evidence. Specifically, I conduct a survey experiment with local bureaucrats across eighty local governments, which pits community needs directly against community partisanship and randomizes the levels of each to assess the extent to which local bureaucrats perceive these factors as important in determining project allocation. The experimental results support the observational analysis from the Central region and suggest that villages that voted for the ruling party are more likely to receive projects than non-aligned communities. This remains true even when co-partisan communities are not among the most needy.
Taken together, these findings suggest that political criteria play a significant role in shaping the allocation of infrastructure within districts. Despite some responsiveness to community need, both interview and empirical evidence indicate that local bureaucrats often lack the autonomy to fully insulate project allocation from political interference. In summary, the career control tools that politicians can exert on bureaucrats can influence both which companies construct new infrastructure, and where this infrastructure gets placed.
6.1 Planning Local Public Goods Projects in Ghana
The primary task of local governments in Ghana is to construct new public infrastructure. Local governments present their plans for new infrastructure projects in reports called MTDP, which cover five-year periods. Local governments also write Annual Action Plans (AAPs) to aid the implementation of these medium-term plans. A final primary document that local governments produce is an annual budget. The projects and activities in these budgets are supposed to adhere to the AAP. To facilitate transparency in project planning and budget allocation, local governments must submit their plans to a national development planning body (the National Development Planning Commission) and their annual budgets to the Ministry of Finance.
Local governments are also evaluated each year using a tool known as the District Performance Assessment Tool (DPAT). An essential requirement within this evaluation is to check that local governments are implementing projects in line with their AAP. Indeed, one criterion within DPAT is that all projects in local governments’ annual budgets are from their AAP. Financial punishments can come as a result of low scores on the DPAT. As discussed in Chapter 3, the DACF is the primary funding source for local governments. In 2020, 10 percent of the DACF funds were based on DPAT performance.Footnote 5 In part, these rules have evolved to minimize mayors’ ability to interfere ex-post in formalized plans.
Despite these arrangements, one long-standing concern of observers of local politics is that the projects that local governments undertake are not guided by published plans.Footnote 6 At least three key reasons have been identified to explain why local governments fail to follow their multi-year plans: (i) low levels of citizen participation, (ii) land and chieftaincy disputes, and (iii) politicization.Footnote 7
The first reason for a mismatch between local governments’ written plans and their actions is low levels of citizen participation. Limited citizen participation results in low local knowledge of what projects are in the final plans, which grants local governments discretion in what to provide. Limited participation results partly from the fact that consultations are costly and local governments have limited funds to solicit the views of a wide cross-section of citizens across their districts. Local bureaucrats I interviewed complained that they did not have adequate funds to fuel cars or vans to travel to communities to discuss new projects. Transport problems are replicated at the level of local councilors, whose task it is to speak with citizens and communities and report their problems back during local government Assembly meetings.Footnote 8 Many councilors do not have the financial resources to solicit views from their constituents.Footnote 9 Limited public involvement and, consequently, lack of public knowledge gives local governments flexibility in what they eventually implement.
Land issues and chieftaincy disputes are the second reason for deviations from published plans. Traditional authorities serve as trustees to all customary land in Ghana – about 78 percent of total lands.Footnote 10 Accordingly, local governments must get the permission of chiefs to provide them with land to build new public infrastructure. In some cases, and particularly when there is a poor relationship between mayors and local chiefs, chiefs are unwilling to permit local governments to build.
Finally, the politicization of plans involves politicians rewarding some communities and punishing others depending on the community’s vote choice in the last election. Observers have noted that “political considerations were paramount in development decision making.”Footnote 11 Political considerations can lead to projects being implemented that are outside of the original plans or changing the locations of the planned projects to fulfill political aims. Political considerations can also lead to local governments starting projects but never completing them.Footnote 12
While there is a perception that local governments distribute projects according to partisan criteria, this has received limited empirical attention.Footnote 13 One recent study investigates the within-district distribution of capital projects across three local governments.Footnote 14 This study finds evidence that the NDC government was less likely to allocate projects to communities with a high share of Akans.Footnote 15 These results lend initial support to claims that communities that provide electoral support to the incumbent party are more likely to receive projects.Footnote 16
6.1.1 How to Manipulate Project Placements in Ghana
Bureaucrats I interviewed confirmed that local governments sometimes allocate projects to communities based on political criteria – typically, voting for the incumbent party. Interviewees asserted that this was predominantly the result of lobbying by mayors. Indeed, bureaucrats identified interference by mayors in the placement of local projects as a constant and significant problem to their work, and sometimes even the most significant challenge they encounter. One DCD said:
The biggest challenge we face is adherence to the AAP [Annual Action Plan]. Before the beginning of the year, we draw up the AAP, but during the year, the political head [mayor] visits a village, and they [the villagers] say, “We want this.”  our AAP is thrown off with new projects and new costs. (Interview with author, February 19, 2016)
An Internal Auditor made a similar comment, linking the actions of mayors to political considerations:
Every day there is pressure [on bureaucrats] because of the politician. You have to amend the plan [Annual Action Plan]. You wasted your time and energy; you bounded it [the plan], but when the chief [mayor] makes utterances, they will take away the project. At the end of the day, it’s politics. The politician will divert it to a different community. (Interview with author, February 4, 2016)
Through these candid conversations with bureaucrats, I also learned how mayors can tilt projects toward certain, typically co-partisan, communities. Bureaucrats noted three main processes.
First, the allocation of projects to co-partisan communities can be built into development plans from the start. For example, local governments can hold more community meetings in co-partisan communities within the district. Lists of projects will then be steered toward these communities. Potential projects are also brought to the attention of the mayor and district planning unit via local councilors. The success of councilors’ lobbying attempts can vary by their perceived partisanship. Although local councilors are elected in non-partisan elections, their partisanship is typically common knowledge because councilors are often active party members within local party branches. Mayors may be more inclined to listen to councilors who represent co-partisan EA within their district.
A second approach to favoring specific communities is to change the site of a project after the medium-term and annual plans have been published. This is a subtler way of favoring co-partisan communities compared to planning a disproportionate number of projects in co-partisan communities. Residents of EA who lose projects may not be told of the change in plans. Many bureaucrats said that it was common for project locations to change between project planning and implementation. One planning officer noted:
The DCE [mayor] can change the location. First, we decide on community A, and he can take it to community B. FOAT [annual compliance monitoring]Footnote 17 doesn’t have a problem with that  We review the plan every quarter, and we will provide some documentary evidence for why we had to change locations. We put it in the minutes, and definitely, we wouldn’t say it was the chief executive [mayor]. We give justification. The motivation for changing location is political: in the last elections these people didn’t vote for us. (Interview with author, February 19, 2016)
Third, new infrastructure can be built in co-partisan communities even when this project is not part of the published plans. In general, bureaucrats stated that this is quite rare because local governments are required to stick to their plans. As noted above, not doing so can have financial repercussions because the DPAT assessment requires that “at least 90% of activities implemented [during a year] are from the approved Annual Action Plan.”Footnote 18 Bureaucrats said that this formal requirement helped them to limit the extent to which new, generally political, projects gained traction. However, one planning officer I interviewed asserted that if a project outside the plan was what the mayor wanted, there was little bureaucrats could do to push back. He said:
When the political head [mayor] wants something to be done, and it’s not in the plan, by all means it will be done. We just have to make sure when we do a review of the plan that we include it. It’s not fine. Once we have drawn a plan we should be able to follow through the plan. (Interview with author, March 2, 2016)
While the data I collected from interviews are very informative and suggest that mayors have significant discretion in determining where new projects are located within districts, it remains challenging to ascertain whether politicization is widespread or rare. To determine how common it is, I next turn to quantitative data on project placements from across districts in the Central region.
6.2 Evidence of Favoritism in the Awarding of Projects
As discussed in Chapter 5, I compiled an original dataset of infrastructure projects undertaken by sampled local governments. In Chapter 6, I only analyze projects conducted by the fifteen local governments within the Central region that are in the sample (see Figure 6.1). I restrict the sample in this way because of the difficulty in obtaining reliable information on the exact placement of public goods projects within a district. The analysis also relies on obtaining localized census information and election results at the polling station level.
Map of sampled local governments in the Central region
Note: The map displays the boundaries of the country’s sixteen regions. I display the boundaries of each district in the Central region. Sampled districts are shaded.
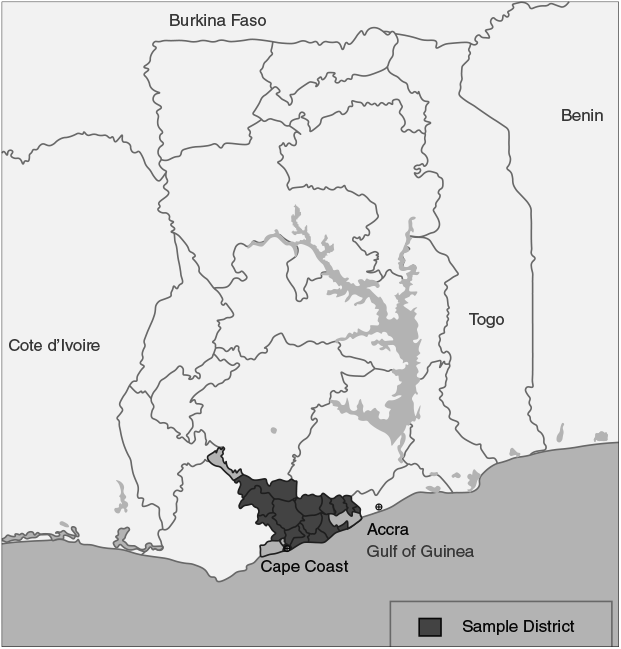
Working closely with local bureaucrats, primarily planning officers, I assigned projects to specific communities. This process was particularly important in cases where party supporters and non-supporters lived in separate communities within the same town or village. In most cases, published documents would include the name of the town or village, but not the exact location.
The units that I link projects to are EAs which are sub-district political units.Footnote 19 Each EA elects a (non-partisan) local councilor who serves on the local government’s political body. On average, districts in the Central region have twenty-nine EAs.Footnote 20 Electoral areas have an average population of roughly 2,000 adults.Footnote 21
An advantage of focusing the analysis on the Central region is that the region provides a hard test of the theory that incumbent mayors will favor co-partisan communities. Ghana’s Central region lies on the southern coast. At the time of the study, there were twenty-two districts in the region, nine of which are coastal (see Figure 6.1).Footnote 22 The region is ethnically relatively homogenous: 82 percent of residents are Akans, most of whom are Fantes – an Akan sub-group. Unlike other Akan sub-groups, the Fante population is not politically aligned. Instead, they switch their allegiance between the two major parties.Footnote 23 Since the 1992 elections, the NDC has obtained the majority of Presidential votes in the Central region five times (in 1992, 1996, 2008, 2012, and 2024), and the NPP has also obtained a majority four times (in 2000, 2004, 2016, and 2020). High levels of competition are also seen in parliamentary races.
High levels of electoral competition in the Central region make it a hard case to test the hypothesis of co-partisan favoritism because in a highly competitive context, politicians may target swing voters with public goods, rather than reward incumbent party supporters. This suggests that if evidence of co-partisan favoritism is found in the Central region, it is likely to also occur in other regions of Ghana.
Within the fifteen districts I study, 709 projects were started during the term that I consider (see Table 6.1). The most common project was the construction of a school classroom block/s (27%). The next most common category of projects was the construction roads, bridges, and culverts (13%), followed by administrative office buildings or accommodation for local bureaucrats (12%). Other projects include toilet blocks (11.2 %), health clinics (7.7%), market stalls (4.3%), and community centers (2.7%).
| # of projects | Percent | |
|---|---|---|
| Classroom block | 192 | 27.08 |
| Road, bridge, culvert | 90 | 12.69 |
| Admin. office/staff housing | 85 | 11.99 |
| Toilet block | 72 | 10.16 |
| Health clinic | 62 | 8.74 |
| Borehole | 52 | 7.33 |
| Market-stalls | 43 | 6.06 |
| Community center | 19 | 2.68 |
| Other | 94 | 13.26 |
| Total | 709 |  |
Note: Projects in the “Other” category include the construction of abattoirs, police stations, libraries, school dining rooms, as well as electricity and sanitation projects. Individually these project categories account for less than two percent of total projects. Project dates correspond to when the project commenced.
6.2.1 Public Goods Projects per Electoral Area
Using these data, I construct two dependent variables. The first is a binary variable that equals 1 when an EA received a positive number of projects. Half of the EAs received one or more projects, while the remaining did not receive any. The second variable considers the total number of projects allocated to an EA. Here, there is significant variation, ranging from 0 to 16. On average, most EAs received 1.1 projects (with a standard deviation of 1.73). Because this is a count variable, I model the outcome using a negative binomial distribution.Footnote 24 The regressions include district fixed effects because my focus is on how projects are distributed within districts. The unit of analysis is the EA.
In calculating both outcomes, I exclude projects related to refurbishing local government offices and accommodation for local government bureaucrats or the mayor. I do so for two reasons. First, politicians and bureaucrats have no discretion over where to place these projects. Instead, they are located next to local government offices. Second, these projects do not benefit citizens.
6.2.2 Explanatory Variables
The primary explanatory variable in the analysis is the ruling party’s vote share in the EA. During the term I consider (2013–16), the NDC was the ruling party. If mayors did reward party supporters with projects, we expect that communities in EAs that voted strongly for the NDC in the last election will receive more projects compared to communities that supported the opposition party. To measure NDC support, I aggregate the presidential election results for polling stations from the December 2012 election. Within the study EAs, this variable ranged from 10% to 94%, with an average of 53%. Electoral results are first announced across individual polling stations. It is typical for politicians and local party officials to know which polling stations voted in favor of the party.
A second key explanatory variable is whether the Member of Parliament or the mayor hails from or has a house in the EA. This follows from empirical research that politicians disproportionately reward towns and districts they hail from.Footnote 25 The dummy variables Mayor home and MP home take the value of one when these political figureheads come from the EA.
An important rival hypothesis is that projects are allocated on the basis of need. Need may relate to the number of people who stand to gain from a project. I use the population of the EA to measure this factor. There is significant variation in EA population, with a maximum of 16,801 people and a minimum of 134 people. I log transform this variable as it is right-skewed.
Need may also relate to the relative wealth of the community. I measure relative deprivation using national census data (collected in 2010) and calculate the share of homes made from mud or earth within an EA. Earth walls are a visible measure of deprivation. The visibility of low incomes is important because local politicians and bureaucrats typically do not have access to detailed, within-district poverty statistics. They must, therefore, rely on visible proxies of deprivation, which they obtain during visits to communities. Because politicians do not operate with fine-grained information, I dichotomize this variable. Electoral areas are coded as deprived when over 70 percent of homes are made from mud, which corresponds to the 3rd quartile of the distribution.Footnote 26
6.2.3 Results
Table 6.2 displays the results. Columns (1) and (2) present the bivariate relationship between incumbent party vote share (NDC) and the number of projects and prediction of whether an EA receives a project, respectively. The coefficient on NDC vote share is positive and significant in both columns. The models in columns (3) and (4) introduce the control variables. The positive and significant relationship persists between NDC vote share and the two dependent variables in these analyses. The coefficients on NDC vote share in columns (3) and (4) are also substantively large. Considering the number of projects (column 3), moving from one standard deviation below to one standard deviation above the mean NDC vote share increases the number of projects an EA receives by roughly one-third of a project. Alternatively, the results in column 4 show that going from one standard deviation below to above the mean for NDC vote share moves the dependent variable from 0.45 to 0.55 (a 22 percent increase).
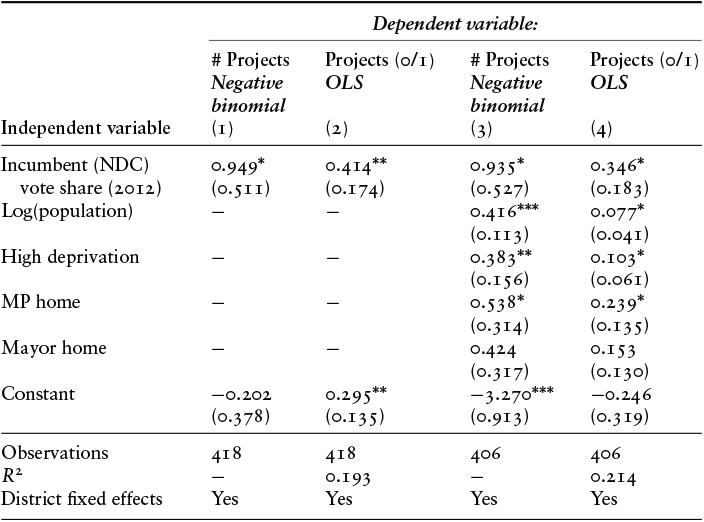
Table 6.2 Long description
Table presenting results from four regression models analysing how political and demographic factors influence development project allocation. The main variable, incumbent vote share, shows a positive and statistically significant effect across all models. Additional variables include population, deprivation, and whether political representatives are from the area. Population and deprivation have positive significant effects, while MP home shows a positive effect and mayor home is not significant.
Note:
* p < 0.1; **p < 0.05; ***p < 0.01.
The coefficients on many of the control variables are also positive and significant. Importantly, the results show a positive association between both need measures and the dependent variables. For example, moving from a non-deprived to a deprived EA increases the number of projects by 0.46. The results also display a positive association between the EAs that include the MP’s home community and the number of projects. This suggests that MPs can interfere in the allocation of projects and can direct projects to their home communities. Conversely, I do not find a positive association between mayors’ home communities and the number of projects, which suggests that mayors do not push projects to their home communities.
The positive correlation between incumbent party vote share and projects indicates that local governments allocate projects to communities based, at least in part, on political criteria. This finding underscores the influence of political factors in the decision-making process of local governments. The results also demonstrate the significance of community need, indicating that political criteria are only one of the factors considered by politicians and bureaucrats when selecting communities to receive new local public goods.
While this analysis is informative as it is based on the actual allocation of real (rather than hypothetical) projects, it is not without limitations. One concern – shared with all observational analyses – is that a confounding variable may be missing from the regression equation. If this is the case, the positive relationship between NDC vote share and project allocations may be biased or spurious. Additionally, these data only provide evidence from one region of the country. This makes it unclear whether a similar pattern would be found in different regions. Finally, these data do not allow me to assess the effect of electoral competition on political targeting because there is little variation across districts in levels of competition: I classify eleven of the fifteen districts as electorally competitive. To overcome these challenges, I conducted a survey experiment in the full sample of districts, asking bureaucrats where they expect projects to be located and varying different attributes of potential locations.
6.3 Evidence from a Survey Experiment with Bureaucrats
I conducted a survey experiment with bureaucrats who hold senior positions in local governments to further investigate the influence of electoral partisanship on project allocation and assess the potential causal effect of this variable on project allocation. On average, respondents had worked in local government administration for sixteen years. I describe the sample of local bureaucrats who took part in the survey in detail in Chapter 1.
6.3.1 Experimental Design
The survey randomly assigned bureaucrats to one of four treatment conditions (see Table 6.3). The treatments consisted of audio vignettes. Each vignette entailed a conversation between two (hypothetical) bureaucrats discussing where to locate a new project. The project under consideration is constant across all treatment conditions, namely, constructing a three-unit classroom block for a primary school. In the conversation, I randomly varied the partisanship and poverty level of the village being described (see Table 6.3).
| Deprived | Not deprived | |
|---|---|---|
| Pro-incumbent (NDC) | Treatment 1 | Treatment 2 |
| Pro-opposition (NPP) | Treatment 3 | Treatment 4 |
To proxy for partisanship, the vignette noted whether the community “voted strongly in favor” of either the incumbent party (NDC – treatments 1 and 2) or opposition party (NPP – treatments 3 and 4) in the last election. To proxy for poverty, bureaucrats were told whether the village was among the “most deprived” in the local area.Footnote 27
The enumerators were blind to the treatment, and the respondents listened to the conversation with headphones. After hearing the conversation, the respondents were asked to rate the likelihood of the community receiving a project on a seven-point scale. They inputted their responses on a cell phone without disclosing them to the survey enumerator. These steps ensured the confidentiality of the treatment and responses, thereby reducing concerns of survey response bias and enhancing the credibility of the findings.
Results of the Survey Experiment with Bureaucrats
The results from the survey experiment show that bureaucrats perceive that communities that are aligned with the ruling party are more likely to receive projects than communities aligned with the major opposition party. First, I regress the outcome variable pooling the partisanship and deprivation treatments. Given the factorial design, I run the long regression, which includes the interaction term for the two treatments.Footnote 28 Table 6.4 presents the results.
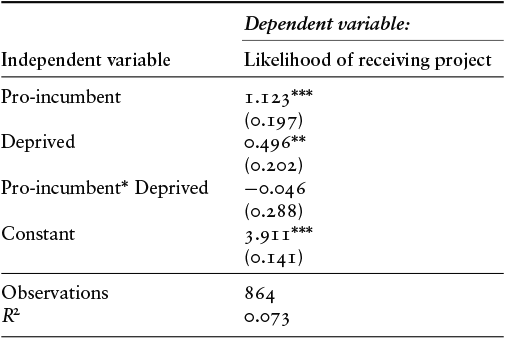
Table 6.4 Long description
Table presenting regression results for a statistical model estimating the likelihood of receiving a project. The table reports coefficient estimates with standard errors shown in parentheses below each coefficient. Statistical significance is indicated using asterisks.
The dependent variable is labeled likelihood of receiving project. The model is based on 864 observations and reports an R squared value of 0.073.
The variable Pro incumbent has a positive coefficient of 1.123 with a standard error of 0.197 and is statistically significant at a high level, indicated by three asterisks.
The variable Deprived also has a positive coefficient of 0.496 with a standard error of 0.202 and is statistically significant, indicated by two asterisks.
An interaction term labeled Pro incumbent multiplied by Deprived has a coefficient of negative 0.046 with a standard error of 0.288. This coefficient is not statistically significant.
The constant term has a coefficient of 3.911 with a standard error of 0.141 and is statistically significant, indicated by three asterisks.
Note:
* p < 0.1; **p < 0.05; ***p < 0.01.
Table 6.4 shows that the treatment effects for the pro-incumbent and deprivation treatments are both positive and statistically significant. The average treatment effect for pro-incumbent communities is 1.1 on a 7-point scale.Footnote 29 The average treatment effect of deprivation is 0.50 on a 7-point scale. These results are consistent with the observational analysis and show that bureaucrats expect a community’s level of need and partisan status to influence the likelihood that it receives a local public goods project. Moreover, these results suggest that the relationship I identify in the observational analysis above is causal. Finally, comparing the size of the two treatment effects suggests that partisanship is more important than deprivation in explaining which communities receive new projects.
Figure 6.2 displays the mean of the outcome variable disaggregating across the four treatment conditions. Figure 6.2 again makes it clear that bureaucrats perceive partisanship to be more important than deprivation in determining projects. This is shown by the higher mean for villages that are pro-incumbent and not deprived (mean = 4.41) compared to communities that are pro-opposition and deprived (mean = 5.03).Footnote 30 Figure 6.2 also shows that the effect of deprivation is constant across a community’s partisan status: communities that are either pro-incumbent or pro-opposition are more likely to receive projects if the community is deprived than if they are not deprived.Footnote 31
The mean outcome response in each treatment condition
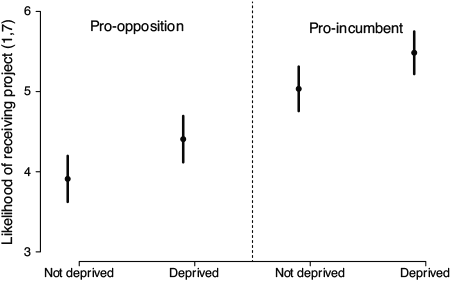
I next focus on the pro-incumbent treatment and consider whether bureaucrats who work in highly competitive districts or districts where the mayor is politically ambitious are more likely to expect partisan targeting. In this analysis, I again run the long regression and subset the data across four types of districts. I proxy for political ambition using a variable that indicates whether the mayor ran for the parliamentary primary in 2015. Figure 6.3 presents the ATE of the pro-incumbent treatment across the four types of districts.
The ATE for pro-incumbent communities in different types of districts
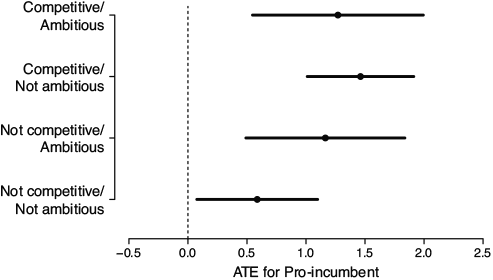
Figure 6.3 shows the ATE for pro-incumbent communities is positive and significant in every type of district. The results suggest that bureaucrats expect some level of partisan targeting in all kinds of districts. However, the results display important heterogeneity. Bureaucrats perceive targeting as less likely to occur in districts that are neither competitive nor where the mayor is not politically ambitious. Figure 6.3 shows that targeting is more likely when either of these conditions is true. These results also suggest no interactive effect: I do not find evidence that targeting is more likely in competitive districts and where the mayor has political ambition.
Overall, the results suggest that local bureaucrats believe that both need and partisanship affect where local public goods projects get placed. The communities that are most likely to receive projects are those that are relatively poorer and voted strongly for the incumbent party. Wealthier communities that voted for the opposition party are the least likely to receive new projects. The critical difference is between the two middle categories: bureaucrats perceive that political factors are more important than deprivation in determining allocation. Finally, contextual factors of the district matter. Bureaucrats working in electorally competitive districts are more likely to expect partisan targeting. The same is true when bureaucrats work under mayors who are politically ambitious.
6.4 Conclusion
The main task of local government in Ghana is to construct local public infrastructure for communities. In Chapter 6, I investigate the within-district allocation of these projects. Overall, the evidence suggests that while community needs influence where new projects get located – with more projects in more populous and poorer communities – so do political factors. The observational data from the Central region show that within districts, there is a positive correlation between the ruling party’s vote share and the number of projects allocated to communities. The results from a survey experiment with local bureaucrats across multiple regions also show that bureaucrats perceive community partisanship to influence the likelihood that a community receives a project strongly. The experiment also establishes a causal link between these two variables and demonstrates that bureaucrats expect partisanship to trump deprivation in determining project allocation. Importantly, this analysis also shows that electoral competition makes partisan targeting more, rather than less, likely.
The interviews I conducted with bureaucrats highlight how projects get allocated to co-partisan communities. These discussions make it clear that mayors are the main actors who drive partisan targeting. The methods I describe also show that bureaucrats must engage in deliberate actions for targeting to occur. For example, bureaucrats may have to justify why the location of a planned project changes between the planning and implementation stage or why a new project is built that was not part of the original budget. Bureaucrats express frustration in doing these activities – most want to allocate projects based on community need and follow the local government’s published plans. As with public procurement decisions, bureaucrats typically help mayors engage in partisan targeting because they know the leverage they can have over their careers. The results of Chapter 6 support the idea that mayors engage in non-programmatic distribution and confirm the theoretical prediction laid out in Chapter 2 that politicians are more likely to engage in such distribution in electorally competitive districts.

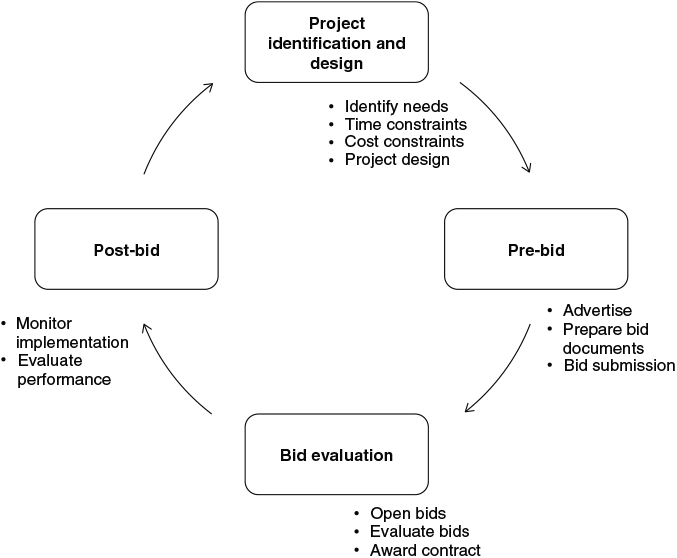
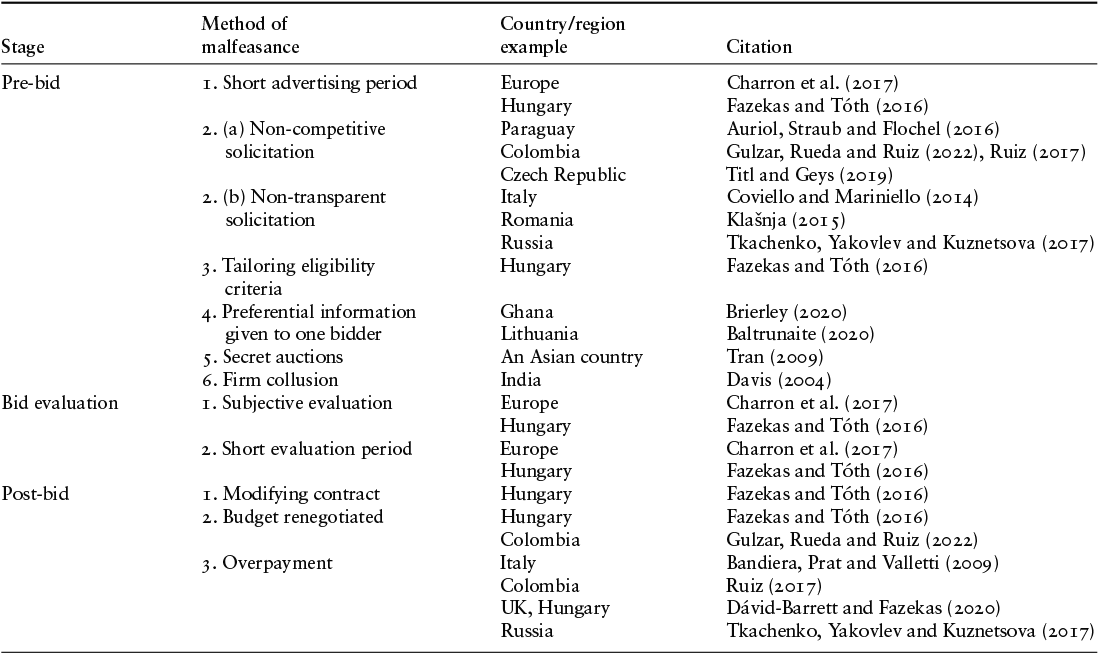
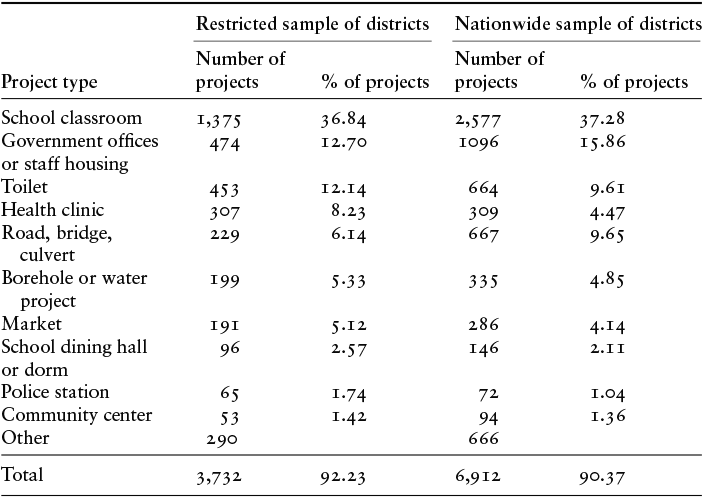
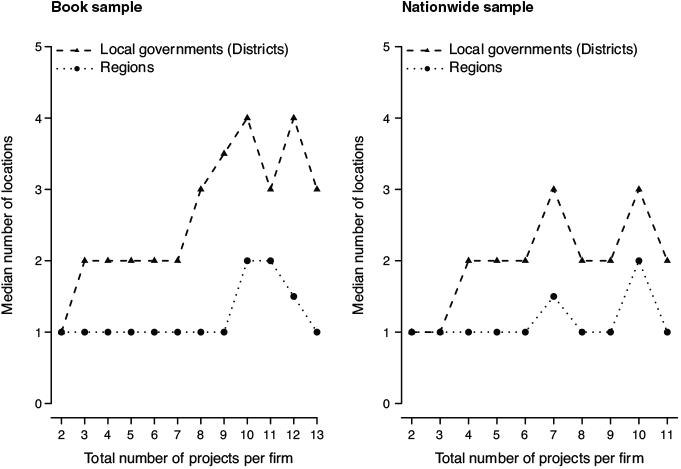
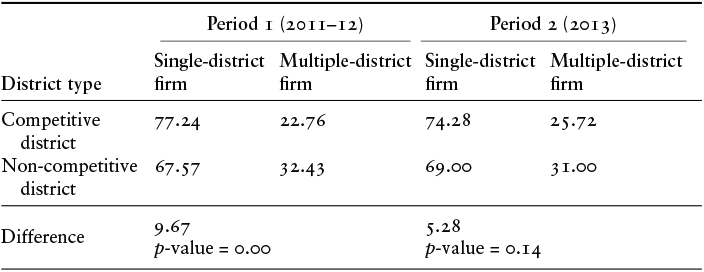
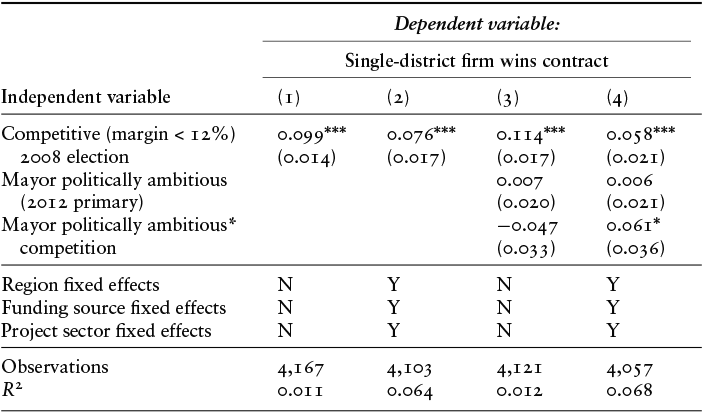
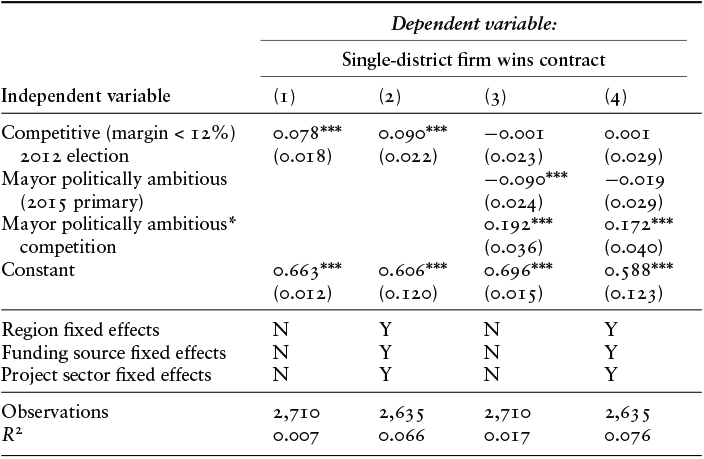
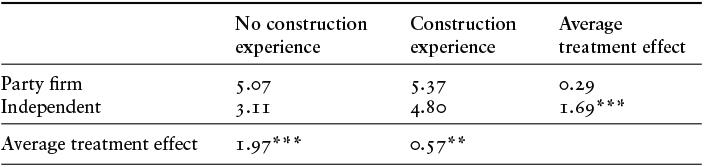
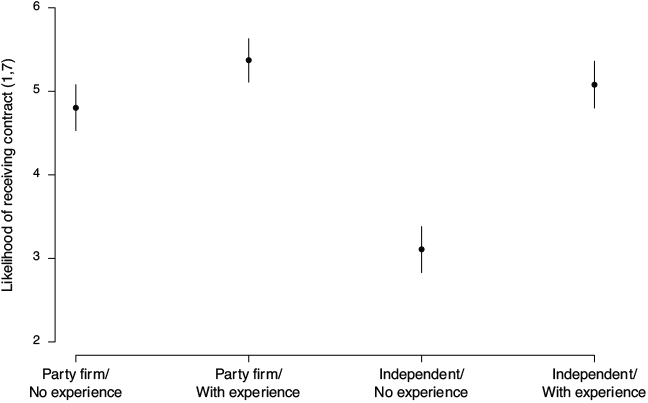
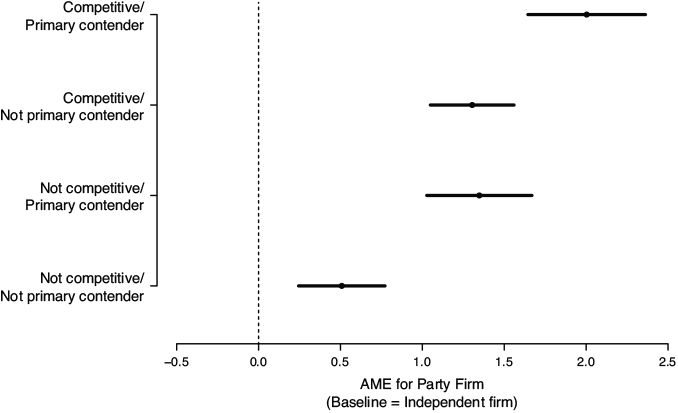
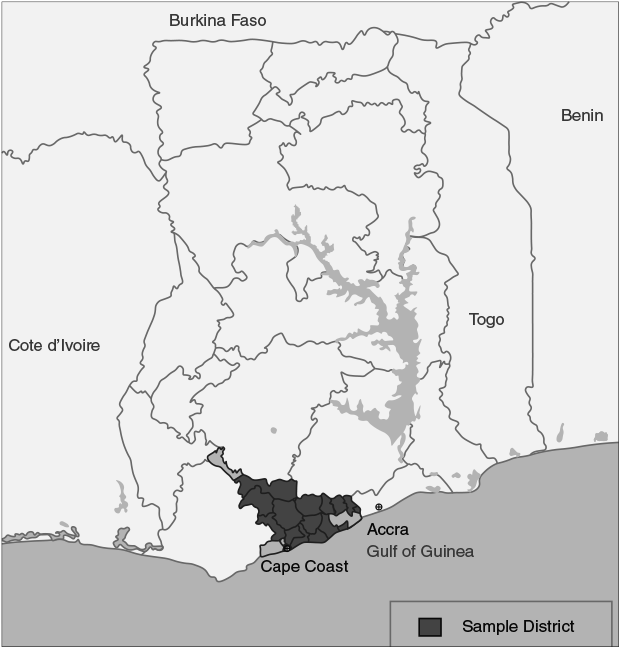
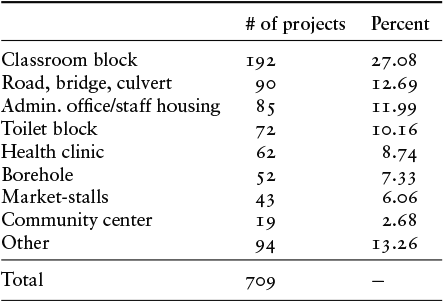
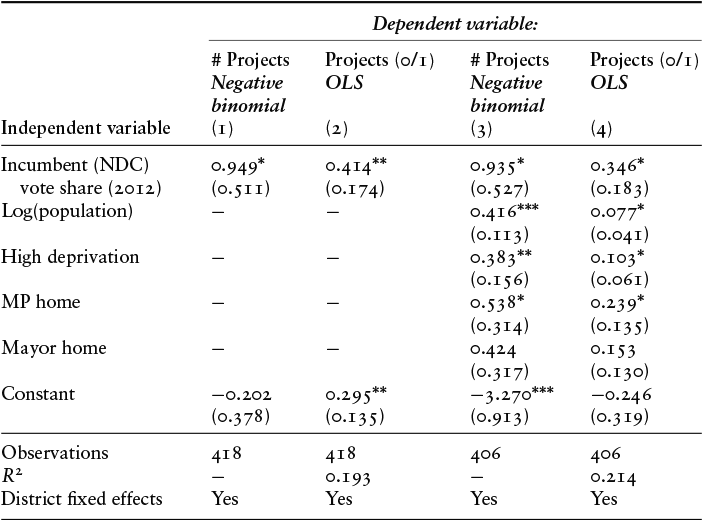
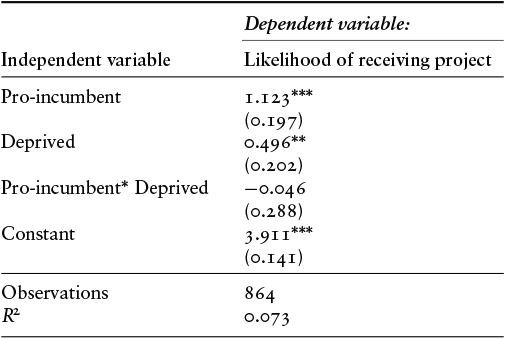
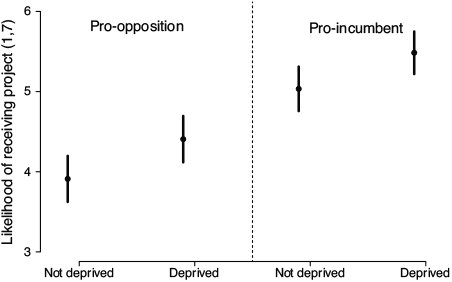
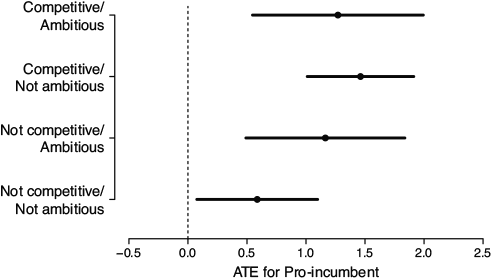

 Open access