


Impact Statement
Mathematical models are used to understand and improve nutrient transport to cells and waste product removal in a bioreactor, for applications in growing organs and tissue for transplantation. Typically, the nutrient concentration that cells experience depends on the location along the porous membrane wall on which they are seeded. This can result in cells growing at different rates, depending on how much nutrient they receive. Furthermore, under certain operating conditions, some cells may receive too little nutrient and die as a result. We show that by spatially varying the permeability of the membrane scaffold, advective nutrient delivery can be controlled to ensure that all cells receive the same amount of nutrient and grow at a constant rate, regardless of where they are located. Our model also provides mechanistic insight into how transport mechanisms change throughout the system, and guides experimental strategies to maximise nutrient delivery to, and removal of waste products from, the cells.
1. Introduction
Tissue engineering aims to circumvent the challenges associated with organ donation by synthetically repairing and replacing damaged organs and tissue (Reference Vacanti and VacantiVacanti & Vacanti 1991). One approach to tissue engineering is to use autologous cells taken from individual patients and grow tissue that avoids immune rejection and bio-compatibility issues. These issues have historically been significant bottlenecks in translating tissue engineering approaches into the clinic (Reference Sarkar, Bhumiratana, Geris, Papantoniou and GraysonSarkar et al. 2023). To meet the clinical demand for the treatment of damaged or diseased organs, we must develop quick and efficient methods of engineering functional three-dimensional tissue for transplantation.
Cell growth is very sensitive to the local chemical and mechanical environment, which affects cell signalling pathways that promote cell proliferation and differentiation (Reference Vance, Galley, Liu and DonahueVance et al. 2005). Hollow fibre membrane bioreactors (HFMBs) offer the ability to carefully control the local cell environment via fluid flow, and allow careful tuning of factors such as the pH, metabolite (e.g. cell nutrients, growth factors and waste products) concentration and mechanical stress. Experimentally, cells are seeded on the outer surface of one or several porous hollow fibre membrane scaffolds, which are then cultured in a bioreactor, as shown in figure 1. Nutrient and growth factors are delivered to the system via flow into the fibre lumen(s), where they transport to the cells by advection and diffusion through the porous membrane wall. Flow of fresh culture media can also be introduced into the extra-capillary space to wash away unused nutrient, alongside waste metabolites produced. The porous hollow fibre scaffolds protect cells from excess shear stress from the fluid flow through the lumen, while also offering a large surface area–volume ratio for efficient nutrient delivery to the cell population (Reference Wung, Acott, Tosh and EllisWung et al. 2014). These HFMBs have shown promise across a wide range of applications, such as in the development of bio-artificial livers and in bypass surgeries (Reference Sachlos and CzernuszkaSachlos & Czernuszka 2003; Reference Seifu, Purnama, Mequanint and MantovaniSeifu et al. 2013).
Schematic of HFMB adapted from Reference Burova, Wall and ShipleyBurova, Wall & Shipley (2019). The nutrient-rich medium enters the lumen inlets, which can transport along the lumen or across the porous membrane walls (grey) to cells seeded externally (pink). An external flow of culture medium (blue) in the extra-capillary space washes away excess nutrient alongside any waste metabolites produced by the cells.

Complementary to experimental work, mathematical models of HFMBs are used to improve experimental design by efficiently identifying parameter regimes that maximise tissue growth and bioreactor efficacy (Reference O'Dea, Byrne and WatersO'Dea, Byrne & Waters 2012). Such models typically use steady Stokes and Darcy equations in a two-dimensional axisymmetric geometry to describe the fluid flow, coupled to advection–diffusion–reaction equations to describe metabolite transport and uptake on time scales where time-dependent cell layer growth can be neglected (Reference Piret and CooneyPiret & Cooney 1991; Reference Ye, Das, Triffitt and CuiYe et al. 2006; Reference Shipley, Davidson, Chan, Chaudhury, Waters and EllisShipley et al. 2011). In order to generate a mechanistic understanding of the underlying system, significant simplifications or model reductions are often employed that limit the applicability of the models. For example, radial advection across the membrane and extra-capillary space (ECS) is often neglected in the analysis of metabolite transport (Reference Piret and CooneyPiret & Cooney 1991; Reference Ye, Das, Triffitt and CuiYe et al. 2006; Reference Pearson, Shipley, Waters and OliverPearson et al. 2014), despite promotion of advective mass transport via fluid flow being widely recognised as necessary for maximising nutrient delivery in bioreactor systems (Reference Schonberg and BelfortSchonberg & Belfort 1987; Reference O'Dea, Byrne and WatersO'Dea et al. 2012).
Additionally, assumptions of constant metabolite uptake in cells assuming excess nutrient availability have been used to simplify nutrient uptake kinetics (Reference Shipley, Davidson, Chan, Chaudhury, Waters and EllisShipley et al. 2011; Reference Chapman, Whiteley, Byrne, Waters and ShipleyChapman et al. 2017). For example, nutrients such as oxygen are a key requirement for cellular respiration and oxidative phosphorylation, and growth factors such as fibroblast growth factors and vascular endothelial growth factors are essential for promoting cell signalling pathways for proliferation and differentiation into functional tissue. In practice, however, it is not always feasible to provide these nutrients in excess due to their significant cost and limited availability. Models that can account for a full range of inlet nutrient concentrations by utilising e.g. Michaelis–Menten uptake kinetics usually rely on computationally expensive numerical methods to solve the resulting transport problem, prohibiting detailed resolution of the metabolite field and the ability to comprehensively explore parameter space (Reference Davidson, Ellis and ChaudhuriDavidson, Ellis & Chaudhuri 2010; Reference Mohebbi-Kalhori, Behzadmehr, Doillon and HadjizadehMohebbi-Kalhori et al. 2012).
Given the long thin geometry inherent to HFMBs, a key challenge is ensuring all cells receive enough nutrient to grow and proliferate irrespective of their position along the bioreactor. Therefore, significant effort has been placed on determining optimal structural and operating parameter values such as inlet concentration, flow rate and membrane permeability, that ensure all cells receive sufficient nutrient to avoid the formation of hypoxic cell regions (Reference Schonberg and BelfortSchonberg & Belfort 1987; Reference Shipley, Davidson, Chan, Chaudhury, Waters and EllisShipley et al. 2011; Reference Chapman, Shipley, Whiteley, Ellis, Byrne and WatersChapman et al. 2014). These hypoxic regions are typically found at the furthest point from the lumen inlet i.e. near the ECS outlet, where nutrient has the furthest distance to travel. While mass transport limitations can be overcome by promoting advective mass transport via an increase in flow rate into the lumen or decrease in fluid flow resistance across the membrane wall, this comes at a cost of increased mechanical shear stress to the local cell environment. Furthermore, such solutions also do not eliminate the heterogeneity in nutrient delivery to cells, with cells receiving different amounts of nutrient depending on where they are located. This is a particular issue when seeking to engineer homogeneous tissue, as spatial differences in nutrient delivery will lead to non-uniform uptake and thus non-uniform tissue growth (Reference Chapman, Whiteley, Byrne, Waters and ShipleyChapman et al. 2017).
In this paper, we systematically derive and analyse a formal reduced framework for modelling advection, diffusion and reaction of cellular metabolites in a single-fibre HFMB with nonlinear nutrient uptake and waste metabolite production. Specifically, we utilise physiologically relevant Michaelis–Menten reaction kinetics which are parameterised by cell-specific parameters and depend on the local metabolite concentration. We exploit the small thickness of the cell layer and the long thin bioreactor geometry to systematically reduce the model complexity, and introduce a non-trivial coordinate transformation to simplify the governing equations further. This approach generates significant savings in computational time compared with full numerical simulations, and facilitates quick and efficient exploration of parameter space. Importantly, our asymptotic reduction reveals mechanistic insights into nutrient transport mechanisms through HFMB systems, and identifies the existence of interfacial concentration boundary layers in the lumen and ECS which capture key transitions in dominant metabolite transport mechanisms. Similar to Reference Dalwadi, Griffiths and BrunaDalwadi, Griffiths & Bruna (2015) and Reference Köry, Krupp, Please and GriffithsKöry et al. (2020), who considered heterogeneous membrane permeabilities for different membrane filtration applications, we consider heterogeneous membrane permeability distributions as a method to ensure uniform nutrient flux to cells via advection, which is the dominant transport mechanism across the membrane wall.
We begin in § 2 with a description of our model set-up for nutrient and waste metabolite transport in a single-fibre bioreactor system. In § 3 we non-dimensionalise, and systematically reduce and simplify our model. Utilising typical parameter values for HFMB operation from literature, we consider the transport of oxygen and carbon dioxide in a bioreactor culturing human endothelial cells. In § 4 we discuss our model results by exploring the impact of varying key operating and structural parameters, such as inlet/outlet pressures (relating to inlet fluid flux), membrane permeability and thickness, on metabolite transport. We then compare nutrient delivery in bioreactors with homogeneous and heterogeneous membrane permeabilities. Finally in § 5 we discuss the impact of this work on experimental design, and suggest future work.
2. Model description
2.1 Model set-up
We consider solute transport in a viscous Newtonian fluid through a long thin bioreactor of length  $L^*$, with geometry illustrated in figure 2 and typical parameter values given in table 1. In cylindrical coordinates ( $r^*, \theta ^*,z^*$) with the longitudinal axis coinciding with the cylinder axis, we define $\hat {\boldsymbol {e}}_r, \hat {\boldsymbol {e}}_\theta, \hat {\boldsymbol {e}}_z$ as unit vectors in the radial, azimuthal and axial directions, respectively. The bioreactor geometry is axisymmetric around the cylinder axis. Motivated by this, we neglect azimuthal components and derivatives, and simplify our problem to a two-dimensional axisymmetric set-up. We define a lumen of radius $R^*_{l0}$ surrounded by a porous membrane of uniform annular cross-section that extends the entire length of the bioreactor, with internal and external radii $R^*_{l0}$ and $R^*_{m0}$, respectively. A cell layer is seeded to the external membrane wall at $r^*=R^*_{m0}$ with an outer radius at $r^* = R^*_{c0}$. A rigid wall surrounds the bioreactor at $r^*=R^*_{e0}$, thus bounding our four key domains: the lumen ( $l$), membrane ( $m$), cell layer ( $c$) and ECS ( $e$). The nutrient and waste metabolite concentration in region $i$ are denoted by $c^*_i$ and $w^*_i$, respectively, and the fluid velocity vector is denoted by $\boldsymbol {U}^*_i = U^*_i\hat {\boldsymbol {e}}_r + W^*_i\hat {\boldsymbol {e}}_z$, where $i=l,m,c,e$. Although we present a model for a general flow field $\boldsymbol {U}^*_i$, for definiteness, when presenting results in § 4 we consider the flow field due to pressure-driven lubrication flow in the lumen and ECS coupled to Darcy flow in the membrane, the details of which are discussed in Appendix A.
Axial (a) and radial (b) cross-section of the bioreactor set-up. The fibre lumen ( $l$) is enclosed by a porous fibre membrane wall ( $m$) denoted by the grey region, with a cell layer ( $c$) seeded to its outer surface represented by the pink region. The ECS ( $e$) surrounds this, enclosed by an outer wall. Nutrient is introduced through the lumen inlet as indicated by the direction of the blue lines, denoting the different pathways available.

Typical model parameters.
 $^{{\dagger}}$ Parameters determined from internal unpublished experimental data for growth of human endothelial cells.
A nutrient-rich culture medium enters the bioreactor at the lumen inlet, driven by an axial pressure drop across the length of the lumen. Nutrient can transport along the fibre lumen and out through the lumen outlet, or across the membrane wall via advective and diffusive mass transport. Cells seeded at the outer membrane wall consume the nutrient and produce waste metabolite, which are transported away through the ECS along with excess nutrient, again via pressure-driven advection and diffusion. We consider the transport of both nutrient and waste products with typical parameter values outlined in table 1. Motivated by the longer time scales for cell proliferation relative to advection, diffusion, uptake and production, we neglect cell proliferation and focus on determining the quasi-steady nutrient distribution.
2.2 Governing equations
We model the concentration of nutrient  $c^*_i$ in the lumen, membrane and ECS using the steady advection–diffusion equations. In the cell layer, we also introduce Michaelis–Menten reaction kinetics to account for nutrient uptake and waste metabolite production. We non-dimensionalise by setting
 \begin{equation} ( r^ * , z^ * ) = L^ * ( r, z), \quad (U^ * _i, W^ * _i ) = \bar{W}^ * (U_i, W_i), \quad (c^ * _i,w^ * _i) = C^ * _{in}(c_i, w_i). \end{equation}
Here, spatial coordinates are scaled with the length of the bioreactor  $L^*$, and velocity components are scaled relative to the typical axial lumen fluid velocity $\bar {W}^*$, which is set by the typical operating conditions defined in table 1 and remains constant in our analysis. Concentrations are scaled with the inlet nutrient concentration in the lumen, $C^*_{in}$. The scaled nutrient transport governing equations in the lumen, membrane and ECS are given by
 \begin{equation} \mathcal{P}_i\boldsymbol{U}_i\boldsymbol{\cdot}\boldsymbol{\nabla} c_i = \nabla^{2}c_i, \quad i = l,m,e, \end{equation}
where  $\mathcal {P}_l = \mathcal {P}_e = \bar {W}^*L^*/\mathcal {D}^*$ is the Péclet number representing the ratio between advective and diffusive nutrient transport effects in the lumen and ECS bulk flow regions, and $\mathcal {D}^*$ is the dimensional diffusivity of the nutrient in the culture medium. We assume that the diffusivity of nutrient in the porous membrane and cell layer regions is proportional to the volume fraction, $\phi _i$, of the culture medium (i.e. $\mathcal {D}^*_i = \phi _i \mathcal {D}^*$ for $i=m,c$). The effective Péclet number in each porous region is then $\mathcal {P}_i = \mathcal {P}_l/{\phi _i}$.
The governing equations in the cell layer are
 \begin{equation} \mathcal{P}_c\boldsymbol{U}_c\boldsymbol{\cdot}\boldsymbol{\nabla} c_c = \nabla^{2}c_c - \mathcal{R}(c_c), \end{equation}
where
 \begin{equation} V_{max} = \frac{V^ * _{max}{L^ * }^{2}}{\phi_c C^ * _{in}\mathcal{D}^ * }, \quad K_M = \frac{K^ * _M}{C^ * _{in}}, \quad \mathcal{R} = \frac{V_{max} c_c}{K_M + c_c}. \end{equation}
Here,  $V^*_{max}$ is the maximum uptake rate and $K^*_M$ is the Michaelis constant, which denotes the nutrient concentration at which the uptake rate is half of $V^*_{max}$. Therefore, $V_{max}$ denotes the ratio between reaction and diffusion time scales, and $K_M$ denotes the dimensionless Michaelis constant.
2.3 Boundary conditions
To determine the nutrient concentration in each domain, we require interfacial conditions and boundary conditions. At the lumen–membrane, membrane–cell and cell–ECS interfaces, respectively, we prescribe continuity of concentration and concentration flux
 \begin{gather} c_l = c_m, (\mathcal{P}_l c_l\boldsymbol{U}_l - \boldsymbol{\nabla} c_l) \boldsymbol{\cdot} \hat{\boldsymbol{e}}_r = \phi_m(\mathcal{P}_l c_m\boldsymbol{U}_m - \phi_m\boldsymbol{\nabla} c_m) \boldsymbol{\cdot} \hat{\boldsymbol{e}}_r \quad \mbox{at} \ r = \varepsilon, \end{gather}
 \begin{gather}c_m = c_c, \phi_m(\mathcal{P}_l c_m\boldsymbol{U}_m - \phi_m\boldsymbol{\nabla} c_m) \boldsymbol{\cdot} \hat{\boldsymbol{e}}_r = \phi_c(\mathcal{P}_l c_c\boldsymbol{U}_c - \phi_c\boldsymbol{\nabla} c_c) \boldsymbol{\cdot} \hat{\boldsymbol{e}}_r \quad \mbox{at} \ r = \varepsilon R_{m0}, \end{gather}
 \begin{gather}c_c = c_e, \phi_c(\mathcal{P}_l c_c\boldsymbol{U}_c - \phi_c\boldsymbol{\nabla} c_c) \boldsymbol{\cdot} \hat{\boldsymbol{e}}_r = (\mathcal{P}_l c_e\boldsymbol{U}_e - \boldsymbol{\nabla} c_e) \boldsymbol{\cdot} \hat{\boldsymbol{e}}_r \quad \mbox{at}\ r = \varepsilon R_{c0}, \end{gather}
where  $R_{i0} = R^*_{i0}/R^*_{l0}$ denotes the non-dimensional radius of domain $i$, and $\varepsilon = R^*_{l0}/L^*$ denotes the lumen aspect ratio. Exploiting axisymmetry, we prescribe no diffusive flux at the lumen centreline
 \begin{equation} \boldsymbol{\nabla} c_l\boldsymbol{\cdot} \hat{\boldsymbol{e}}_r = 0 \quad \mbox{at } r = 0, \end{equation}
and at the solid outer bioreactor wall we prescribe a no-flux condition
 \begin{equation} (\mathcal{P}_e c_e\boldsymbol{U}_e - \boldsymbol{\nabla} c_e)\boldsymbol{\cdot} \hat{\boldsymbol{e}}_r = 0 \quad \mbox{at} \ r = \varepsilon R_{e0}. \end{equation}
At each of the axial ends we prescribe no flux in the membrane and cell layer regions
 \begin{equation} (\mathcal{P}_l c_i\boldsymbol{U}_i - \phi_i\boldsymbol{\nabla} c_i)\boldsymbol{\cdot} \hat{\boldsymbol{e}}_z = 0 \quad \mbox{at} \ z = 0,1, \quad i = m,c. \end{equation}
Given the bioreactor operating conditions, we introduce fresh nutrient through the lumen inlet but not through the ECS inlet, which we capture via the following constant inlet concentration conditions:
 \begin{equation} c_l = 1, \quad c_e = 0 \quad \mbox{at} \ z = 0. \end{equation}
Finally, as solute exits the bioreactor via the lumen or ECS, we prescribe no diffusive flux
 \begin{equation} \boldsymbol{\nabla} c_i\boldsymbol{\cdot} \hat{\boldsymbol{e}}_z = 0 \quad \mbox{at} \ z = 1, \quad i = l,e. \end{equation}
We model the transport of waste metabolite  $w_i$ in the lumen, membrane and ECS using the advection–diffusion equation (2.2), replacing $c_i$ with $w_i$, and $\mathcal {P}_i$ with $\mathcal {P}_{w,i}$. We define $\mathcal {P}_{w,l} = \mathcal {P}_{w,e} = \bar {W}^*L^*/\mathcal {D}^*_w$ as the Péclet numbers for waste metabolite transport in the lumen and ECS, where $\mathcal {D}^*_w$ denotes the diffusivity of the waste metabolite in the culture medium. We let $\mathcal {P}_{w,i} = \mathcal {P}_{w,l}/\phi _i$ denote the Péclet number for waste metabolite transport in the porous membrane and cell layer regions, where $i = m,c$. We assume that waste product is generated in the cell layer at a rate proportional to the nutrient uptake. The governing equation for waste transport in the cell layer is then
 \begin{equation} \mathcal{P}_{w,c}\boldsymbol{U}_c\boldsymbol{\cdot}\boldsymbol{\nabla} w_c = \nabla^{2}w_c + \nu\mathcal{R}(c_c), \end{equation}
where  $\nu$ denotes the constant of proportionality between nutrient consumption and waste production. We also assume that no waste product is introduced to the system from the inlet ports, and prescribe a zero inlet concentration condition at the lumen and ECS inlet
 \begin{equation} w_i = 0 \quad \mbox{at} \ z = 0, \quad i = l,e. \end{equation}
 The remaining boundary conditions for  $w_i$ are equivalent to those in the nutrient transport problem, i.e. boundary conditions (2.5)–(2.8), (2.10) remain the same, replacing $c_i$ with $w_i$.
3. Model reduction and solution
We provide typical model parameter values in table 1. As referenced, we use parameter values from literature wherever possible.
3.1 Cell layer reduction
We investigate nutrient transport and uptake in the cell layer of thickness  $\delta = \varepsilon (R_{c0} - R_{m0})$. As justified by the parameter values in table 1, we consider the physically relevant asymptotic limit $0 < \delta \ll \varepsilon \ll 1$. By scaling in to the $O (\delta )$ cell layer region and integrating the cell layer governing equations (2.3) across the thickness of the cell layer, we derive the following effective membrane–ECS interfacial condition
 \begin{equation} c_m = c_e, \quad \phi_m^2\frac{\partial c_m}{\partial r} - \frac{\partial c_e}{\partial r} = {-}\phi_c^2\bar{\mathcal{R}}({c_m}) \quad \mbox{at} \ r = \varepsilon R_{m0}, \end{equation}
where  $\bar {\mathcal {R}} = \delta \mathcal {R}$, which we take to be an $O (1)$ quantity. Equation (3.1) states that the jump in radial nutrient flux across the cell layer is proportional to the uptake of nutrients in the cell layer, formally replacing (2.3), (2.5b) and (2.5c), and reducing our problem to consideration of nutrient transport through the lumen, membrane and ECS only. Full details of the cell layer reduction of the fluid flow and nutrient transport problem are found in Appendices A and B. Similarly, the effective membrane–ECS interfacial condition for waste metabolite transport becomes
 \begin{equation} w_m = w_e, \quad \phi_m^2\frac{\partial w_m}{\partial r} = \frac{\partial w_e}{\partial r} + \nu\phi_c^2\bar{\mathcal{R}}(c_e) \quad \mbox{at} \ r = \varepsilon R_{m0}, \end{equation}
3.2 Streamfunction–arclength reformulation
The long, thin bioreactor geometry ( $0 < \varepsilon \ll 1$) will motivate the application of lubrication scalings in § 3.3. We note, however, that although the small radial distances (compared with axial distances) promotes radial diffusion compared with axial diffusion, the flow is sufficiently fast for advective mass transport to remain important and balance radial diffusion in the lumen and ECS in (2.2). The spatially two-dimensional nature of the advective transport terms means that numerical solution of (2.2) remains computationally expensive.
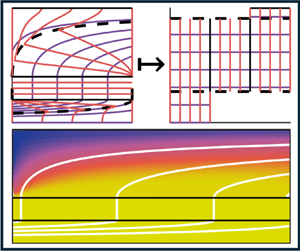
To circumvent this issue, we transform into a streamfunction–arclength ( $\psi, s$) coordinate system as shown in figure 3. Instead of specifying the nutrient concentration at a radial $r$ and axial $z$ position in space, we parameterise space by which fluid streamline ( $\psi$) a nutrient particle is travelling along, and how far along the streamline it has travelled ( $s$). Without loss of generality, we impose $0 \leq s \leq 1$ in the lumen, $1 \leq s \leq 2$ in the membrane and $2 \leq s \leq 3$ in the ECS. We note this is similar to the approach in Reference Cummings and WatersCummings & Waters (2007) (for nutrient transport in a rotating bioreactor system). In our system, nutrients or waste metabolites are advected along streamlines (lines of constant streamfunction value), and therefore advective terms become spatially one-dimensional with respect to arclength. We consider the full transformation from a two-dimensional axisymmetric set-up into streamfunction–arclength coordinates for an arbitrary incompressible flow field in Appendix C. In these transformed coordinates, (2.2) becomes
 \begin{equation} \mathcal{P}_i\frac{\partial c_i}{\partial s} = \frac{\partial}{\partial\psi}\left(r^2 l_{\psi,i}\tilde{U}_i\frac{\partial c_i}{\partial \psi}\right) + \frac{\partial}{\partial s}\left(\frac{1}{l_{\psi,i}\tilde{U}_i}\frac{\partial c_i}{\partial s}\right) \quad \mbox{where}\ \tilde{U}_i = \sqrt{U_i^2 + W_i^2}, \end{equation}
and  $l_{\psi,i}$ is the total length of the streamline corresponding to $\psi$ in region $i$.
$i$.
Transformation from an axisymmetric coordinate system ( $r,z$) on the left, to a streamfunction–arclength coordinate system ( $\psi,s$) on the right. Purple lines denote equally spaced streamlines of constant $\psi$, with $\psi =0$ corresponding to the streamline along the symmetry line $r = 0$. Orange lines denote contours of constant arclength $s$ along streamlines, and black solid lines denote the boundary between each physical domain, where the lumen corresponds to $r \in (0, 1)$, $s \in (0,1)$, the membrane corresponds to $r \in (1,2)$, $s \in (1,2)$ and the ECS corresponds to $r \in (2,5)$, $s \in (2,3)$. Dotted black lines denote the critical streamlines $\psi _{i,crit}$ defined in Appendix C which divide where fluid enters or leaves. Note that $\psi _{l,crit}=\psi _{e,min}$ and $\psi _{l,max}=\psi _{e,crit}$. Appropriate boundary conditions are annotated by their corresponding equation number.

3.3 Long thin reduction
From (3.3), we see that the governing equations in streamfunction–arclength formulation represent a balance between advective mass transport along streamlines and diffusive mass transport in all directions. Given the similarity to the original transport (2.2), it may not yet be clear what we have gained by performing this transformation. However, we are now in a position to exploit the long thin bioreactor geometry to simplify our nutrient transport governing equations further.
3.3.1 Lumen and ECS
In the lumen and ECS, we introduce the lubrication scalings  $r = \varepsilon r^\star, U_i = \varepsilon U_i^\star$, where $r^\star, U_i^\star = {O}(1)$. Since we have an $O (1)$ axial flow entering the lumen through a circular area of $O (\varepsilon )$ radius, fluid flux through the bioreactor is $O (\varepsilon ^2)$, and hence the streamfunction $\psi$ scales with $\varepsilon ^2$. This motivates scaling the streamfunction via $\psi = \varepsilon ^2\psi ^\star$. Utilising these scalings, dropping the superscript $\star$, and taking the limit $\varepsilon \to 0$, (3.3) at leading order is
 \begin{equation} \varepsilon^2\mathcal{P}_i\frac{\partial c_i}{\partial s} = \frac{\partial}{\partial\psi}\left(r^2l_{\psi,i} W_i\frac{\partial c_i}{\partial \psi}\right), \quad i = l,e, \end{equation}
where  $W_i \geq 0$ throughout. We note that $\varepsilon ^{2}\mathcal {P}_i$ is the reduced Péclet number in region $i$ which we take to be an $O (1)$ quantity, motivated by the parameters in table 1, and we see a balance between advection along streamlines and diffusion between streamlines. This process has systematically reduced a two-dimensional elliptic partial differential equation (PDE) (3.3) to a nonlinear one-dimensional heat equation with non-constant coefficients (i.e. a parabolic PDE) which is much less computationally expensive to solve, where arclength is the time-like coordinate and streamfunction is the space-like coordinate.
3.3.2 Membrane
In the membrane, we again scale  $r = \varepsilon r^\star, U_i = \varepsilon U_i^\star, \psi = \varepsilon ^2\psi ^\star$, where $r^\star, U_i^\star, \psi ^\star = {O}(1)$. However, the analysis in Appendix A reveals streamlines now align with the radial axis, which is an $O (\varepsilon )$ length scale compared with the bioreactor length. Hence, $l_{\psi,m}$ scales with $\varepsilon$ in the membrane, and so we write $l_{\psi,m} = \varepsilon l_{\psi,m}^\star$, where $l^\star _{\psi,m} = {O}(1)$. Utilising the velocity scalings in the membrane (Appendix A), we find
 \begin{equation} \tilde{U}_m = \sqrt{\varepsilon^2U^{{\star} 2}_m + \varepsilon^4W^{{\star} 2}_m} \sim \varepsilon\tilde{U}_m^\star. \end{equation}
Again dropping the superscript  $\star$ and taking the limit $\varepsilon \to 0$, the leading-order transport governing equation in the membrane (3.3) is
 \begin{equation} \varepsilon^2\mathcal{P}_m\frac{\partial c_m}{\partial s} = \frac{\partial}{\partial s}\left(\frac{1}{l_{\psi,m}U_m}\frac{\partial c_m}{\partial s}\right), \end{equation}
where the reduced Péclet number in the membrane  $\varepsilon ^{2}\mathcal {P}_m = \varepsilon ^{2}\mathcal {P}_l/\phi _m = {O}(1)$ (noting that $U_m > 0$ throughout). Equation (3.6) is now an ordinary differential equation (ODE), which can be solved to determine an analytical solution for concentration in the membrane.
3.3.3 Interfacial and boundary conditions
At leading order in  $\varepsilon$, the transformed lumen–membrane and membrane–ECS interfacial conditions (2.5a), (3.1) in streamfunction–arclength coordinates become
 \begin{gather} c_l = c_m, \quad \frac{\partial c_m}{\partial s} = 0 \quad \mbox{at} \ s = 1, \psi \in [\psi_{l,crit}, \psi_{l,max}), \end{gather}
 \begin{gather}c_m = c_e, \quad \frac{\partial c_m}{\partial s} = {-}\frac{\varepsilon l_{\psi,m}\phi_c^2\bar{\mathcal{R}}(c_m)}{\phi_m^2} \quad \mbox{at} \ s = 2, \psi \in (\psi_{e,min}, \psi_{e,crit}], \end{gather}
where we take  $\varepsilon \bar {\mathcal {R}}$ to be an $O (1)$ quantity. Here, $\psi _{i,min}, \psi _{i,max}$ denote the minimum and maximum streamline values in domain $i$, and $\psi _{i,crit}$ denotes the critical streamline that divides which inlet or outlet fluid enters and leaves from domain $i$ as shown in figure 3.
The lumen symmetry condition (2.6) and the no-flux condition at the outer wall (2.7) become
 \begin{equation} \frac{\partial c_i}{\partial\psi} = 0 \quad \mbox{at} \ \psi = 0, \psi_{e,max}, \end{equation}
and the inlet concentration conditions (2.9) remain the same
 \begin{gather} c_l = 1 \quad \mbox{at} \ s = 0, \end{gather}
 \begin{gather}c_e = 0 \quad \mbox{at} \ s = 2, \psi \in (\psi_{e,crit}, \psi_{e,max}]. \end{gather}
Finally, the outlet no-diffusive-flux condition (2.10) becomes
 \begin{equation} \frac{\partial c_i}{\partial s} = 0 \quad \mbox{at} \ s = 1, \psi\in (0, \psi_{l,crit}] \quad \mbox{and} \quad s = 3. \end{equation}
In Appendices C and D, we consider the transformation and reduction of the full governing equations and boundary conditions for nutrient and waste metabolite transport.
3.4 Model solution
The resulting leading-order governing equations (3.4) and (3.6) are coupled via the appropriately transformed continuity of concentration and flux conditions at the lumen–membrane and membrane–ECS interfaces (3.7). Up until now, analysis has been presented for a general flow field. However, to solve (3.4), (3.6) for the solute concentration, we require a solution to the fluid velocities in each domain,  $U_i$ and $W_i$.
3.4.1 Solution of fluid flow problem
The particular flow problem we solve for is detailed in Appendix A, and shown in figure 4. In summary, we consider slow, viscous lubrication flow of an incompressible Newtonian fluid in the lumen and ECS, driven by an axial pressure drop between the inlet fluid pressure,  $P_{i,in}$, and the outlet fluid pressure, $P_{i,out}$, where $i=l,e$. Flow in the lumen and ECS is coupled to incompressible Newtonian Darcy flow across the porous membrane wall of permeability $\kappa$. Utilising the analysis outlined in Appendix A, we determine the fluid velocities in each region of the bioreactor ( $U_i, W_i$) in terms of fluid pressures ( $P_i$) (see (A12) and (A14a,b)), and substitute into the transport governing equations (3.4) and (3.6).
Canonical flow set-up considered in our model analysis. Slow, viscous, Newtonian, pressure-driven lubrication flow is prescribed in the lumen and ECS, coupled to Darcy flow across the membrane wall. Flow enters the lumen and ECS inlets at  $z=0$ with fluid pressures $P_{l,in}, P_{e,in}$, respectively. Flow exits the lumen and ECS at $z=1$ with fluid pressures $P_{l,out}, P_{e,out},$ respectively.

3.4.2 Solution of transport problem
To solve (3.4), we use the method of lines with a central-difference discretisation for  $\psi$, essentially solving a system of coupled ODEs with $s$ as a time-like variable using MATLAB's in-built ode15s solver. Initial conditions for the ODE solvers are provided by the inlet concentration condition (3.9a) in the lumen, and the continuity of concentration conditions (3.7b) and (3.9b) in the ECS.
We can solve the reduced equation (3.6) exactly by substituting in our analytic solution for membrane fluid flux (A14a,b) and imposing continuity of concentration at the lumen–membrane interface (3.7a) and the effective uptake condition at the membrane–ECS interface (3.7b). Therefore, nutrient concentration in the membrane is given by
 \begin{equation} c_m = 1 - \mathcal{A}((s-1)(R_{m0}-1) + 1)^{-\xi}, \quad \xi = \frac{\varepsilon^2\mathcal{P}_l\kappa(P_e - P_l)}{\phi_m^2\ln R_{m0}}, \quad \mathcal{A} = \frac{b + \sqrt{b^2 + 4ac}}{2a}, \end{equation}
where  $P_l, P_e$ are the fluid pressures in the lumen and ECS, respectively, $s\in (1,2)$ in the membrane parameterises the position along streamlines, and
 \begin{equation} a = \phi_m^2\xi R_{m0}^{-(2\xi + 1)}, \quad b = \phi_m^2\xi R_{m0}^{-(\xi + 1)}(K_M + 1) - \varepsilon\delta\phi_c^2V_{max} R_{m0}^{-\xi}, \quad c = \varepsilon\delta\phi_c^2V_{max}. \end{equation}
From (3.11), we see that nutrient concentration in the membrane is directly proportional to the transmural pressure drop across the wall,  $P_l - P_e$. This transmural flow is a key driving force for nutrient transport in the membrane. Specifically, axial variations in nutrient concentration in the membrane arise from the axial dependency coming from the fluid pressure variations. We note that, while we solve our system of equations in streamfunction–arclength formulation, solutions presented in § 4 have been transformed back into two-dimensional axisymmetric coordinates.
We present full details of the metabolite transport solution method in Appendix E. We note that the same procedure outlined in § 3 can also be followed to mathematically reduce and solve the governing equations for waste metabolite transport in each domain, the details of which we discuss in Appendices C–E.
4. Results
4.1 Typical operating conditions
We first consider steady fluid flow and nutrient transport under typical bioreactor operating conditions (summarised in table 1) as shown in figure 5(a). In the lumen, the transformed governing equation for metabolite transport (3.4) is a nonlinear diffusion equation. Solving subject to constant inlet concentration (3.9a), the lumen concentration is constant along streamlines and therefore equal to the prescribed inlet concentration. Advective transport of nutrient across the membrane wall to the cells seeded at  $r=R_{m0}$ is driven by a transmural pressure drop, which varies axially due to the axial variation in fluid pressure along the lumen and ECS, as shown in (3.11). Therefore, we expect to see a higher nutrient concentration delivered to the cells where the radial pressure drop across the membrane wall is highest. Any leftover nutrient is then washed away by flow in the ECS.
Nutrient concentration profiles across a cross-section of the bioreactor set-up. (a) Nutrient concentration profile under typical experimental conditions as outlined in table 1. Black lines denote the interfaces between the lumen ( $r \in (0,1)$), the membrane ( $r \in (1,2)$) and the ECS ( $r \in (2,5)$). Fresh nutrient enters through the lumen inlet at $z=0$ and transports either along the length of the lumen or across the membrane wall to be consumed by cells seeded on the outer membrane surface at $r = 2$. Excess nutrient is washed away by flow in the ECS. Solid white lines denote streamlines beginning at the lumen inlet and (b) nutrient concentration profile at the outer membrane wall under varying axial pressure drops holding $P_{l,in}, P_{l,out}, P_{e,in}$ constant. Axial heterogeneity in nutrient concentration increases as axial variations in the transmural pressure drop increase. In particular, at a given axial position, the nutrient concentration delivered to the cells seeded at the outer membrane wall decreases when the transmural pressure drop decreases.

Focusing on figure 5(b) (left), we see that nutrient transport to the outer membrane interface under typical operating conditions is relatively uniform due to a pressure drop that remains relatively constant across the membrane. If we fix the lumen and ECS inlet pressures and vary the transmural pressure drop (e.g. by varying the ECS outlet pressure,  $P_{e,out}$), we observe a strong dependence of nutrient delivery on the transmural pressure drop in figure 5(b). Towards the bioreactor outlet where the transmural pressure drop decreases, advective mass transport across the membrane wall decreases, and hence nutrient delivery also decreases. This spatial heterogeneity of nutrient delivery means that cells are receiving unequal amounts of nutrient depending on where they are seeded along the length of the membrane. This is of particular concern in engineering homogeneous tissue constructs, which have a uniform nutrient requirement, since heterogeneous nutrient delivery will lead to heterogeneous tissue growth. We see that to achieve uniform nutrient delivery across the membrane wall, we require a uniform transmural pressure drop irrespective of the given operating conditions.
4.2 Homogeneous vs. heterogeneous permeability distributions
One way to generate uniform nutrient delivery via advection is to use a membrane with a heterogeneous permeability. Advective mass transport is a function of the local permeability,  $\kappa$, and transmural pressure drop, $P_l - P_e$, given by (3.11). At positions where advective nutrient flux across the membrane wall is smaller due to a smaller transmural pressure, introducing a larger permeability will reduce the resistance for advective transport across these regions, thus raising the flux (and vice versa for a smaller permeability). We can derive an analytic representation of this favourable permeability distribution from (3.11), where we seek a membrane permeability that exactly counteracts transmural pressure
 \begin{equation} \kappa(z) = \frac{1}{P_l(z) - P_e(z)}. \end{equation}
 Figure 6(a) shows the concentration of nutrient delivered to cells seeded at the outer membrane wall as a function of the operating conditions, comparing a homogeneous membrane permeability to the heterogeneous permeability given in (4.1) under typical bioreactor operating conditions. Utilising the heterogeneous permeability distribution exactly cancels out the axial variations in  $c_m$ from the transmural pressure drop in figure 6(a), resulting in a membrane concentration profile that is axially uniform. For the considered model parameters, the heterogeneous permeability distribution also leads to a larger average nutrient concentration. As the desired heterogeneous permeability distribution is a function of the lumen and ECS fluid pressures, any variations in $P_{l,in}$ and $P_{e,in}$ will alter the appropriate permeability distribution. However, because this will cancel out the fluid pressure terms in our solution to $c_m$, our concentration profile remains unchanged by variations in these parameters.
Comparing the nutrient concentration delivered to the outer membrane wall with a homogeneous vs a heterogeneous membrane permeability under varying structural and operating conditions. (a) Varying permeability,  $\kappa$ (left), lumen inlet pressure, $P_{l,in}$ (middle), and ECS inlet pressure $P_{e,in}$ (right). Coloured lines denote the concentration profile at $R_{m0}$ with a homogeneous membrane permeability, and the black dotted line is the concentration profile with a heterogeneous membrane permeability. Note that the membrane concentration with a heterogeneous permeability is invariant to changes in the selected parameters and (b) Comparing the average nutrient concentration at the outer membrane wall, $\bar {c}|_{R_{m0}}$ with a homogeneous vs ideal heterogeneous permeability under varying membrane thicknesses $R_{m0}$ and reduced Péclet numbers $\varepsilon ^2\mathcal {P}_l$. The solid white lines denote contours of constant nutrient concentration. The average concentration of nutrient delivered to cells at the outer membrane wall is greater in the heterogeneous membrane at each corresponding membrane thickness and reduced Péclet number.

Our theoretically favourable solution does, however, depend on both the membrane thickness and the lumen Péclet number. Figure 6(b) shows how increasing the membrane thickness decreases the nutrient concentration at the outer wall as the radial membrane fluid flux decreases, thus decreasing advective mass transport. As might be expected, an increase in the lumen Péclet number increases advective mass transport, therefore increasing nutrient delivery across the membrane wall. In both cases, the optimal nutrient delivery problem delivers a much higher nutrient concentration to the outer wall compared with a membrane with constant membrane permeability, suggesting that in all scenarios, a heterogeneous permeability distribution is of significant benefit for both efficient and uniform nutrient transport.
4.3 Waste metabolite transport
Using the same methodology as § 4.2, we can model waste metabolite transport through our bioreactor system. This is of particular interest in understanding the intricate relationship between maximising nutrient delivery and waste removal, and how both factors can be affected by changes in structural and operating parameters.
Figure 7 shows how the waste metabolite concentration at the outer wall varies under different operating conditions. Similarly to nutrient concentration in figure 6, we see that any change in parameter value that increases advective mass transport (either by increasing the pressure drop or decreasing resistance to flow across the membrane) increases flux across and out of the membrane. For the same reasons that this increases nutrient concentration delivery to the outer membrane wall, this increase in advective mass transport also washes away any waste metabolite produced more efficiently, thus decreasing the waste metabolite concentration at the outer wall. Interestingly, we see that increasing the inlet ECS pressure, corresponding to an increase in flow rate, actually increases waste concentration at the outer membrane wall compared with lower ECS pressures. As the inlet ECS pressure increases towards the inlet lumen pressure, the pressure drop across the membrane decreases and thus fluid flux across the membrane wall also decreases. Therefore, waste product is removed less easily. These results suggest that, in the parameter regimes considered, the most important mechanism for waste product removal in HFMBs is maximising fluid flow across the membrane wall rather than increasing the axial flow rate through the ECS.
Waste metabolite concentration at the outer membrane wall under varying lumen inlet pressure (a), ECS inlet pressure (b) and membrane wall thickness (c). The red line denotes the average concentration with a homogeneous permeability given in table 1 with the shaded red region denoting the maximum and minimum concentrations. This shaded region is very thin in the right-most panel. The blue line denotes the concentration under the heterogeneous permeability distribution.

Similarly to before, we note that the specific heterogeneous permeability distribution we derive results in both a uniform production of waste metabolite, and an overall reduction in local waste concentration compared with a homogeneous permeability for the majority of parameter values. We conclude that the heterogeneous membrane allows for the delivery of a uniform nutrient concentration at higher concentrations compared with the homogeneous case under the same operating conditions, and washes away waste metabolites more efficiently.
5. Discussion
In this paper, we present a two-dimensional axisymmetric model for nutrient and waste transport through a hollow fibre membrane bioreactor. Utilising a coordinate transformation into a streamfunction–arclength formulation and exploiting the long thin geometry, we use an asymptotic analysis to systematically reduce the dimensionality of our governing equations and derive a reduced-order system which we solve efficiently using the method of lines. We interpret our results to understand how the membrane permeability can be manipulated to achieve uniform nutrient transport to the cell layer, as well as to understand how to tune physical operating and geometric parameters to improve the balance between nutrient delivery and waste product removal.
Our systematic derivation of the reduced model means that we can solve for the nutrient transport problem with greater speed and efficiency compared with full multiphysics simulations in software packages such as COMSOL. A full simulation of nutrient transport through our bioreactor design under typical operating conditions, using a fine mesh necessary to resolve variations in concentration in the radial direction, takes around seven minutes to compute in COMSOL on a standard desktop computer. Alternatively, a full simulation of our reduced model takes a fraction of a second to solve for the fluid flow problem, and around 1 minute to solve for the nutrient transport problem, for a comparative mesh size. Better still, we are able to solve for the nutrient concentration profile through the membrane and at the outer membrane wall using our analytic solution as per (3.11) in a fraction of a second. Our analysis also provides us with a full mechanistic understanding of the dominant nutrient transport mechanisms across the membrane and the transitions between different regions, which reveals the impact of system parameters on the model solution. This model reduction in turn also speeds up sensitivity analysis considerably.
For example, our model reduction allows us to understand the role of heterogeneous permeability distributions in achieving uniform nutrient delivery. From (E5), we derive an explicit relationship between the nutrient concentration in the membrane and the membrane permeability, as well as an explicit understanding of how axial variations in the membrane flux leads to axial variations in nutrient delivery. This means that we derive an explicit formula for the optimal membrane permeability that cancels out axial variations and leads to uniform nutrient delivery to the cell site. This is of particular importance for informing experimental design, whereby appropriate mathematical modelling can help inform the manufacture of membranes with the heterogeneous permeability distribution under desired operating conditions. For example, by changing the applied voltage or adjusting the distance between the spinneret and collector in the electrospinning of hollow fibre membranes, one can generate a gradient in fibre diameter and density, which in turn affects the membrane's permeability across different regions (Reference Forgie, Leclinche, Dréan and DolezForgie et al. 2023). We note, however, that the spatial resolution is limited by the voltage, geometry and polymer properties in the electrospinning set-up, placing limits on the achievable permeability range.
This ‘optimal’ heterogeneous permeability distribution results in a uniform delivery of nutrient to a spatially uniform cell layer of uniform cell type and seeding density. In the case of a heterogeneous cell seeding density, or in a set-up containing several different cell types, the effect of a spatially varying nutrient demand will impact the optimal nutrient delivery, which in turn changes the corresponding heterogeneous permeability distribution. Given an axial dependency of nutrient uptake in the cell layer, it is straightforward to use our methodology to determine a heterogeneous permeability that depends on advection across the membrane wall and on the spatially varying reaction kinetics. For example, this could be theoretically achievable by setting the membrane concentration at the outer membrane wall in (3.11) to be constant, and rearranging to determine an explicit relationship between the permeability  $\kappa$, and the axial dependency arising from the reaction kinetic parameters and the transmural pressure drop.
In our analysis of the nutrient and waste transport problem, it is clear that promoting advective mass transport not only improves nutrient delivery to the cell site, but also promotes the removal of waste cell products. However, in practice, an increase in advective mass transport comes at a cost of increased mechanical stress imparted on the cells. Cells are particularly sensitive to their local mechanical environment, which is of importance in regulating cell morphology and for mechanotransduction signalling pathways. Excessive shear stresses can damage and even detach cells seeded to the membrane wall in an experimental set-up, presenting a difficult trade-off between optimising the local chemical and mechanical cell environment. In our current model, the indirect impact of mechanical stress on nutrient uptake is not accounted for. However the derivation of the effective membrane–ECS interfacial condition holds for a general nutrient uptake reaction term,  $\mathcal {R}$, and therefore can be used when introducing reaction kinetics that depend on the local mechanical stress. Furthermore, the semi-analytic nature of the framework presented in this study presents a quick and efficient method for implementing optimisation methods to determine the optimal system of structural and operating conditions that would lead to the desired trade-off between nutrient delivery and mechanical disruption.
The speed-ups offered by a reduced modelling approach are of particular importance in extending this work beyond traditional hollow fibre bioreactors to consider faster, more physiologically relevant fluid flow problems. The framework presented in this paper can be used alongside any underlying two-dimensional fluid velocity field provided that we can determine the accompanying streamfunction, either analytically or numerically. This will be of use in future work where we relax the assumption of Stokes flow, and introduce alternative flow profiles applicable in a range of experimental designs (Reference BoothBooth 2023).
The modelling approaches in this paper present a robust and flexible framework for the analysis of nutrient transport in hollow fibre membrane bioreactor systems. With these tools, we develop a mechanistic understanding of the system's response to varying structural and operating parameters, and the impact this has on the nutrient delivery/waste removal problem. This lays the groundwork for a plethora of mathematical extensions that more accurately describe the local chemical and mechanical environment of the cell layer, and provide us the tools to quickly and accurately traverse a large parameter space to determine the optimal bioreactor set-up for uniform nutrient delivery to the cells.
6. Conclusion
We have developed a mathematical model to describe steady fluid flow and cell metabolite transport in a single-fibre HFMB, and have considered the impact of varying structural and operating parameters on nutrient delivery and waste metabolite removal. We have developed the framework to accommodate any two-dimensional flow, and we showcase our methodology by considering the specific problem of lubrication flow in the lumen and ECS coupled to Darcy flow across the membrane. Having investigated the dependency of nutrient transport on the transmural pressure drop, we have determined a theoretically ideal heterogeneous membrane permeability distribution that facilitates uniform nutrient delivery to cells for engineering homogeneous cell populations of uniform size and density. This analysis provides a robust framework for understanding and optimising HFMB design and operation, valid across a wide range of possible operating Péclet numbers and limiting nutrient concentrations. Given the computational time savings relative to typical numerical simulations, the analysis in this paper can be utilised by experimentalists to quickly and efficiently understand and optimise experimental bioreactor design for applications in tissue engineering research.
Acknowledgement
The authors gratefully acknowledge the contributions of A. Witt and R. Martin, who aided in sourcing parameter values for the model.
Declaration of interests
The authors declare no conflict of interest.
Funding statement
G.B. was supported by the UKRI Engineering and Physical Sciences Research Council (grant number EP/L016044/1). M.P.D. was partially supported by the UK Engineering and Physical Sciences Research Council (Grant No. EP/W032317/1). For open access, the author has applied a Creative Commons Attribution (CC BY) licence to any Author Accepted Manuscript version arising.
Author contributions
G.B. developed the mathematical model including formal analysis, methodology, software, validation, visualisation and took the lead in paper writing. M.P.D. and S.L.W. contributed to mathematical model development including conceptualisation, project administration, project supervision and review and editing of drafts. H.Y. and P.A.M. contributed to conceptualising the model set-up, as well as draft reviewing and editing.
Data availability statement
The code that was used to perform the simulations in this paper is available at: https://github.com/gjibooth/NutrientTransport/. All data are provided in the paper.
Ethical standards
The research meets all ethical guidelines, including adherence to the legal requirements of the study country.
Appendix A. Solution to fluid flow problem
We describe fluid flow through the lumen and ECS by the steady Stokes equations and continuity equation for an incompressible viscous Newtonian fluid of constant dynamic viscosity,  $\mu ^{*}$. In the membrane and cell layer, we model fluid flow using Darcy's law for an incompressible Newtonian fluid, where $\phi _i, k^*_i$ denote the porosity and permeability of porous region $i = m,c$. We let $k^*_m = k^*_m(z^*)$ vary across the length of the domain. We take advantage of the long, thin bioreactor geometry and non-dimensionalise the fluid flow problem using the following scalings:
 \begin{equation} \left.\begin{array}{c} (r^ * , z^ * ) = L^ * (\varepsilon r, z), \quad (U^ * _l, U^ * _e, W^ * _l, W^ * _e ) = \bar{W}^ * (\varepsilon U_l, \varepsilon U_e, W_l, W_e), \\ (U^ * _m, U^ * _c, W^ * _m, W^ * _c ) = \varepsilon\bar{W}^ * (U_m, U_c, \varepsilon W_m, \varepsilon W_c), \quad P^ * _i = \dfrac{\mu^{ * }\bar{W}^ * }{\varepsilon^2L^ * }P_i, \quad Q^ * _{i,in} = 2\pi\varepsilon^2{L^ * }^2\bar{W}^ * Q_{i,in}, \end{array}\right\} \end{equation}
where  $\varepsilon = R^*_{l0}/L^*$ is the aspect ratio of the lumen, $\bar {W}^*$ is the typical axial lumen fluid velocity and $i=l,m,c,e$. We define the cell layer thickness $\delta = \varepsilon (R_{c0} - R_{m0})$, and consider the physically relevant sublimit $0 < \delta \ll \varepsilon \ll 1$. Standard lubrication scalings are applied in the lumen and ECS (Reference BatchelorBatchelor 1967), and lubrication scalings for the coupled porous regions are used in the membrane and ECS (Reference Dalwadi, King, Dyson and ArkillDalwadi et al. 2020). The scaled Stokes equations and Darcy equations in the limit $\varepsilon \to 0$ are given by
 \begin{gather} \frac{1}{r}\frac{\partial}{\partial r}(r U_i) + \frac{\partial W_i}{\partial z} = 0, \end{gather}
 \begin{gather}\frac{\partial P_i}{\partial r} = 0, \quad \frac{\partial P_i}{\partial z} = \frac{1}{r}\frac{\partial}{\partial r}\left(r\frac{\partial W_i}{\partial r}\right), \end{gather}
for  $i = l,e$, and
 \begin{gather} \frac{1}{r}\frac{\partial}{\partial r}(r U_i) = 0, \end{gather}
 \begin{gather}\phi_i U_i = {-}\kappa_i\frac{\partial P_i}{\partial r}, \quad \phi_i W_i = {-}\kappa_i\frac{\partial P_i}{\partial z}, \end{gather}
for  $i = m,c$. Here, $\kappa _i = k^*_i/\varepsilon ^4L^{*2}$ is the non-dimensional permeability in region $i$. We take $\kappa _i$ to be a $O (1)$ quantity in our analysis to investigate the most general model set-up i.e. the distinguished asymptotic limit in the language of matched asymptotic expansions.
At the lumen–membrane, membrane–cell and cell–ECS interfaces, we prescribe interfacial conditions to couple the fluid flow in each region. Typically, flow past porous media can be modelled by imposing a Beavers–Joseph slip condition on the tangential component of fluid stress, where the slip coefficient is experimentally derived (Reference Beavers and JosephBeavers & Joseph 1967). However, Shipley et al. show that accounting for slip at a porous interface in a typical bioreactor set-up has negligible impact on the flow solution (Reference Shipley, Waters and EllisShipley et al. 2010). Motivated by this, we impose a no axial slip condition and a continuity of normal flux condition at each interface. Secondly, we specify that the normal component of fluid stress in the lumen is balanced by the fluid pore pressure in the membrane at the lumen–membrane interface similarly to Reference Chapman, Whiteley, Byrne, Waters and ShipleyChapman et al. (2017). Additionally, we specify that the normal component of fluid stress in the ECS is balanced by the fluid pore pressure in the cell layer at the cell–ECS interface, and we prescribe continuity of fluid pressure at the membrane–cell layer interface. The scaled interfacial conditions are then given by
 \begin{gather} -P_l + 2\varepsilon^2\frac{\partial U_l}{\partial r} = {-}P_m, \quad U_l = \phi_mU_m, \quad W_l = 0 \quad \mbox{at} \ r = 1, \end{gather}
 \begin{gather}P_m = P_c, \quad \phi_mU_m = \phi_cU_c, \quad W_m,W_c = 0 \quad \mbox{at} \ r = R_{m0}, \end{gather}
 \begin{gather}-P_c = {-}P_e + 2\varepsilon^2\frac{\partial U_e}{\partial r}, \quad \phi_cU_c = U_e, \quad W_e = 0 \quad \mbox{at} \ r = R_{c0}. \end{gather}
Given that we are investigating the limit in which cell layer thickness is small (i.e.  $\delta = \varepsilon (R_{c0} - R_{m0}) \ll \varepsilon \ll 1$), we can further reduce our flow problem. From inspection of (A3) and (A4) for $i=c$, we see that in the limit $\delta \to 0$ (i.e. $R_{c0} \to R_{m0}$)
 \begin{equation} P_c|_{R_{c0}} \to P_c|_{R_{m0}}, \quad U_c|_{R_{c0}} \to U_c|_{R_{m0}}. \end{equation}
Utilising (A5a,b) and taking the limit  $\varepsilon \to 0$, we can replace (A4) with the following boundary conditions:
 \begin{gather} P_l = P_m, \quad U_l = \phi_mU_m, \quad W_l = 0 \quad \mbox{at} \ r = 1, \end{gather}
 \begin{gather}P_m = P_e, \quad \phi_mU_m = U_e, \quad W_e = 0 \quad \mbox{at} \ r = R_{m0}. \end{gather}
Therefore, our flow problem reduces to flow through the lumen, membrane and ECS only, and the cell layer is replaced by an interfacial condition at the membrane–ECS interface (A6b).
The membrane is sealed at each axial end, therefore we prescribe no flux through these ends in the membrane
 \begin{equation} W_m = 0 \quad \mbox{at} \ z = 0,1. \end{equation}
To drive flow along the lumen and ECS, we prescribe a pressure drop along each channel
 \begin{gather} P_i = P_{i,in} \quad \mbox{at} \ z = 0, \end{gather}
 \begin{gather}P_i = P_{i,out} \quad \mbox{at} \ z = 1, \end{gather}
for  $i = l,e$. We note that, while we prescribe fluid pressures at the inlet and outlet of the lumen and ECS in our model, we determine the appropriate inlet pressures to prescribe in (A8) from a set of volumetric flow rates from literature summarised in table 1. We relate the inlet flux and inlet pressures via the relationship
 \begin{equation} Q_{i,in} = \int_{R_1}^{R_2} r W_i \, \mbox{d} r \quad \mbox{at} \ z = 0, \end{equation}
for  $i = l,e$, where $R_1, R_2$ define the inner and outer radial boundaries of the respective region.
Lastly, we prescribe a symmetry condition at the lumen centreline
 \begin{equation} U_l = \frac{\partial W_l}{\partial r} = 0 \quad \mbox{at} \ r = 0, \end{equation}
and at the outer wall of the bioreactor, we prescribe no slip and no flux
 \begin{equation} \boldsymbol{U}_e = \boldsymbol{0} \quad \mbox{at} \ r = R_{e0}. \end{equation}
 Integrating the lumen and ECS flow equations (A2) with respect to  $r$ and applying the no axial slip boundary conditions in (A6), (A11), we find that $P_l = P_l(z), P_e = P_e(z)$ and
 \begin{gather} W_l = \frac{1}{4}\frac{\mbox{d}P_l}{\mbox{d}z}(r^{2} - 1), \quad U_l = \frac{r}{16}\frac{\mbox{d}^{2}P_l}{\mbox{d}z^{2}}(2 - r^{2}), \end{gather}
 \begin{gather}W_e = \frac{1}{4}\frac{\mbox{d}P_e}{\mbox{d}z}\left(r^{2}-R_{e0}^{2} + \frac{(R_{e0}^{2}-R_{m0}^{2})\ln (r/R_{e0})}{\ln (R_{m0}/R_{e0})}\right), \end{gather}
 \begin{align} U_e & = \frac{1}{16r\ln (R_{m0}/R_{e0})}\frac{\mbox{d}^{2}P_e}{\mbox{d}z^{2}} \Big(2r^{2}(R_{m0}^{2} - R_{e0}^{2})\ln (r/R_{e0})\nonumber\\ &\quad -(r^{2}-R_{e0}^{2})(R_{m0}^{2} - R_{e0}^{2} + (r^{2} - R_{e0}^{2})\ln (R_{m0}/R_{e0}))). \end{align}
Substituting (A3b) into (A3a) for  $i=m$ and solving subject to continuity of pressure in (A6) we find that
 \begin{equation} P_m = \frac{(P_e-P_l)}{\ln R_{m0}}\ln r + P_l. \end{equation}
We substitute (A13) into (A3b) to find
 \begin{equation} \phi_mU_m = \frac{\kappa(P_l-P_e)}{r\ln R_{m0}}, \quad \phi_mW_m = \kappa\left(\frac{\ln r}{\ln R_{m0}}\left(\frac{\mbox{d}P_l}{\mbox{d}z} - \frac{\mbox{d}P_e}{\mbox{d}z}\right) - \frac{\mbox{d}P_l}{\mbox{d}z}\right). \end{equation}
Substituting into the continuity of flux conditions in (A6), we end up with a system of coupled ODEs for  $P_l$ and $P_e$
$P_e$
 \begin{equation} \frac{A}{\kappa}\frac{\mbox{d}^{2}P_l}{\mbox{d}z^{2}} = P_l - P_e, \quad \frac{B}{\kappa}\frac{\mbox{d}^{2}P_e}{\mbox{d}z^{2}} = P_l - P_e, \end{equation}
where
 \begin{equation} A = \frac{\ln R_{m0}}{16}, \quad B = {-}\frac{\ln R_{m0}}{16\ln (R_{m0}/R_{e0})}[(R_{e0}^{2}-R_{m0}^{2})^{2} + (R_{e0}^4-R_{m0}^4)\ln (R_{m0}/R_{e0})]. \end{equation}
A.1 Case I: homogeneous permeability
Substituting the ODE for  $P_l$ in to the ODE for $P_e$ in (A14a,b), we obtain a fourth-order ODE in $P_l$ with constant coefficients, the characteristic equation of which is solved by $\lambda _{1,2} = \pm \sqrt {\kappa (B-A)/BA}, \lambda _{3,4}=0$. Noting that $\kappa (B-A)/BA > 0$ for all possible values of $R_{m0}$, $R_{e0}$ and $\kappa$, we can substitute our general solution for $P_l$ back in to (A14a,b) and solve subject to (A8) to find
 \begin{align} P_l & = \frac{B(P_{l,in} - P_{e,in})}{(B-A)({\rm e}^{\lambda_1} - {\rm e}^{\lambda_2})}[(z-1)({\rm e}^{\lambda_1} - {\rm e}^{\lambda_2}) - ({\rm e}^{\lambda_1(z-1)} - {\rm e}^{\lambda_2(z-1)})] \nonumber\\ &\quad - \frac{B(P_{l,out} - P_{e,out})}{(B-A)({\rm e}^{\lambda_1} - {\rm e}^{\lambda_2})}[z({\rm e}^{\lambda_1} - {\rm e}^{\lambda_2}) - ({\rm e}^{\lambda_1z} - {\rm e}^{\lambda_2z})] + (P_{l,out} - P_{l,in})z + P_{l,in},\end{align}
 \begin{align} P_e & = \frac{(P_{l,in} - P_{e,in})}{({\rm e}^{\lambda_1} - {\rm e}^{\lambda_2})}\left[\frac{B}{(B-A)}(z-1)({\rm e}^{\lambda_1} - {\rm e}^{\lambda_2}) - \frac{A}{(B-A)}({\rm e}^{\lambda_1(z-1)} - {\rm e}^{\lambda_2(z-1)})\right] \nonumber\\ &\quad - \frac{(P_{l,out} - P_{e,out})}{({\rm e}^{\lambda_1} - {\rm e}^{\lambda_2})}\left[\frac{B}{(B-A)}z({\rm e}^{\lambda_1} - {\rm e}^{\lambda_2}) - \frac{A}{(B-A)}({\rm e}^{\lambda_1z} - {\rm e}^{\lambda_2z})\right]\nonumber\\ &\quad + (P_{l,out} - P_{l,in})z + P_{l,in}, \end{align}
giving us a fully analytic solution for  $P_l$ and $P_e$.
A.2 Case II: uniform flux
A common objective of bioreactor systems is to deliver nutrient uniformly to cells. For a homogeneous cell population with uniform seeding density at the outer wall of our fibre membrane, this corresponds to an axially uniform nutrient flux across the membrane wall. For nutrient delivered via advection, this can be achieved with a radial membrane flux that is independent of axial position at the outer wall.
From (A14a,b), we see that the axial dependency in membrane flux comes from the difference in pressures in the lumen and ECS. Axial pressure gradients drive fluid through our bioreactor system and thus cannot be eliminated. Instead, we seek a solution to our membrane permeability such that
 \begin{equation} \kappa(z) = \frac{1}{P_l(z) - P_e(z)}, \end{equation}
where  $P_l, P_e$ are yet to be solved for. Therefore (A14a,b) becomes
 \begin{equation} \phi_mU_m = \frac{1}{r\ln R_{m0}}. \end{equation}
The flux delivered to the outer membrane wall where cells are seeded can then be determined by evaluating (A19) at  $r = R_{m0}$.
With (A18), the system (A14a,b) decouples, simplifying to
 \begin{equation} \frac{\mbox{d} ^2P_l}{\mbox{d} z^2} = \frac{1}{A}, \quad \frac{\mbox{d} ^2P_e}{\mbox{d} z^2} = \frac{1}{B}. \end{equation}
Solving subject to inlet and outlet pressures (A8), (A20a,b) becomes
 \begin{gather} P_l = \frac{z(z-1)}{2A} + (P_{l,out} - P_{l,in})z + P_{l,in}, \end{gather}
 \begin{gather}P_e = \frac{z(z-1)}{2B} + (P_{e,out} - P_{e,in})z + P_{e,in}. \end{gather}
From (A18) it is clear that we encounter a singularity when  $P_l = P_e$. That is, we cannot have uniform flow if the pressure drop across the membrane vanishes at any axial position. Additionally we cannot have negative permeability, therefore this analysis only holds for $P_l > P_e$ at each value of $z$. For this to hold, we must also ensure $P_{l,in} > P_{e,in}$ and $P_{l,out} > P_{e,out}$.
Appendix B. Cell layer reduction
As justified by the parameter values in table 1, we investigate the physically relevant asymptotic limit  $\delta \ll \varepsilon \ll 1$. We transform the radial coordinate $r$ such that $r = n + \varepsilon (R_{m0} + R_{c0})/2$. In doing so, we take the axial centreline of the cell layer to be $n = 0$, where $n \in (-\delta /2, \delta /2)$ in the cell layer. A schematic is shown in figure 8, where we let $\boldsymbol {Q}_i = \mathcal{P}_l c _i\boldsymbol {U}_i - \phi _i\boldsymbol {\nabla } c_i$ for $i =m,c$, and $\boldsymbol {Q}_e = \mathcal{P}_l c _e\boldsymbol {U}_e - \boldsymbol {\nabla } c_e$. Given the cell layer is $O (\delta )$, we introduce an inner scaling $n = \delta N$ such that $N = {O}(1)$. For a distinguished asymptotic limit where uptake appears at leading order, we also take $\mathcal {R} = {O}(\delta ^{-1})$, and define $\bar {\mathcal {R}} = {O}(1)$ such that $\mathcal {R} = \bar {\mathcal {R}}/\delta$. We then pose an asymptotic expansion for $c_i$ in powers of $\delta$ i.e.
 \begin{equation} c_i \sim {c_i}_0 + \delta{c_i}_1 + \cdots \quad \mbox{as} \ \delta \rightarrow 0. \end{equation}
Substituting (B1) into (2.2) and (2.3) and collecting  $O (\delta ^{-2})$ terms, we obtain
 \begin{equation} \frac{\partial^2 {c_m}_0}{\partial N^2} = \frac{\partial^2 {c_c}_0}{\partial N^2} = \frac{\partial^2 {c_e}_0}{\partial N^2} = 0. \end{equation}
Equation (B2) has general solution
 \begin{equation} {c_c}_0 = A_c(z)N + B_c(z), \quad {c_i}_0 = A_i(z)N + B_i(z), \quad i = m,e. \end{equation}
We note that in the cell layer,  $N = {O}(1)$ and bounded. In the membrane and ECS, however, $N$ can tend to $\pm \infty$. Since concentrations in the outer regions will be bounded as $\delta \to 0$, matching these inner solutions for ${c_m}_0, {c_e}_0$ as $N \to \pm \infty$ with the outer solutions as $n \to 0$, we obtain the matching condition $A_i \equiv 0$ for $i = m,e$, so that
 \begin{equation} {c_m}_0 = B_m(z), \quad {c_e}_0 = B_e(z). \end{equation}
From the continuity of concentration and flux boundary conditions (2.5), we then find  $A_c(z) = 0$, and $B_m(z) = B_c(z) = B_e(z)$. Therefore, concentration $c_c$ is constant at leading order in the boundary layer, and therefore
 \begin{equation} {c_c}_0 = {c_m}_0|_{n = 0} = {c_e}_0|_{n = 0}. \end{equation}
Collecting terms at  $O (\delta ^{-1})$, (2.2) and (2.3) become
 \begin{gather} \frac{\partial}{\partial N}\left(\mathcal{P}_c(\boldsymbol{U}_c\boldsymbol{\cdot} \hat{\boldsymbol{n}}){c_c}_0 - \frac{\partial {c_c}_1}{\partial N}\right) = {-}\bar{\mathcal{R}}({c_c}_0), \end{gather}
 \begin{gather}\frac{\partial}{\partial N}\left(\mathcal{P}_i(\boldsymbol{U}_i\boldsymbol{\cdot} \hat{\boldsymbol{n}}){c_i}_0 - \frac{\partial {c_i}_1}{\partial N}\right) = 0, \end{gather}
for  $i = m,e$, where $\hat {\boldsymbol {n}}$ is the unit normal vector in the positive $N$-direction. From (B6) we see that the flux is conserved in the inner regions of the membrane and cell layer domains. Multiplying (B6a) by the square of the porosity of the cell layer, $\phi _c^2$, and noting that $\mathcal {P}_i = \mathcal {P}_l/\phi _i$, we integrate over $N \in (-1/2,1/2)$ to find
 \begin{equation} \phi_c\left.\left(\mathcal{P}_l(\boldsymbol{U}_c\boldsymbol{\cdot} \hat{\boldsymbol{n}}) {c_c}_0 - \phi_c\frac{\partial {c_c}_1}{\partial N}\right) \right|_{-{1}/{2}}^{{1}/{2}} = {-}\phi_c^2\bar{\mathcal{R}}({c_c}_0). \end{equation}
Noting continuity of fluid flux in (2.5), and that  $\mathcal {P}_i = \mathcal {P}_l/\phi _i$, we see
 \begin{gather} \left.\phi_c\left(\mathcal{P}_l(\boldsymbol{U}_c\boldsymbol{\cdot} \hat{\boldsymbol{n}}){c_c}_0 - \phi_c\frac{\partial {c_c}_1}{\partial N}\right)\right|_{-{1}/{2}} = \left.\phi_m\left(\mathcal{P}_l(\boldsymbol{U}_m\boldsymbol{\cdot} \hat{\boldsymbol{n}}){c_m}_0 - \phi_m\frac{\partial {c_m}_1}{\partial N}\right)\right|_{-{1}/{2}}, \end{gather}
 \begin{gather}\left.\phi_c\left(\mathcal{P}_l(\boldsymbol{U}_c\boldsymbol{\cdot} \hat{\boldsymbol{n}}){c_c}_0 - \phi_c\frac{\partial {c_c}_1}{\partial N}\right)\right|_{{1}/{2}} = \left.\left(\mathcal{P}_l(\boldsymbol{U}_e\boldsymbol{\cdot} \hat{\boldsymbol{n}}){c_e}_0 - \frac{\partial {c_e}_1}{\partial N}\right)\right|_{{1}/{2}}. \end{gather}
We also note that, by continuity of fluid flux and continuity of concentration, the advective terms in (B8) cancel out. Matching into the outer problem in the membrane and ECS, we find that
 \begin{gather} \left.\frac{\partial {c_m}}{\partial n}\right|_{n\uparrow 0} \sim \frac{1}{\delta}\frac{\partial}{\partial N}({c_m}_0 + \delta {c_m}_1)|_{N = {-}{1}/{2}} = \left.\frac{\partial {c_m}_1}{\partial N}\right|_{N = {-}{1}/{2}}, \end{gather}
 \begin{gather}\left.\frac{\partial {c_e}}{\partial n}\right|_{n\downarrow 0} \sim \frac{1}{\delta}\frac{\partial}{\partial N}({c_e}_0 + \delta {c_e}_1)|_{N = {1}/{2}} = \left.\frac{\partial {c_e}_1}{\partial N}\right|_{N = {1}/{2}}. \end{gather}
Therefore, using the results of (B6) and (B9), we may derive the following effective boundary condition:
 \begin{equation} \phi_m^2\frac{\partial {c_m}}{\partial n} - \frac{\partial {c_e}}{\partial n} = {-}\phi_c^2\bar{\mathcal{R}}({c_c}_0). \end{equation}
Cell layer with thickness  $\delta$. The central dotted line denotes the centreline along which we define $N=0$, and the external dotted lines above and below denote the asymptotic extent of the inner region in the outside membrane and ECS regions which we scale into.

Transforming back into the radial coordinate  $r$, (B5), (B10) become
 \begin{equation} c_m = c_e, \quad \phi_m^2\frac{\partial c_m}{\partial r} - \frac{\partial c_e}{\partial r} = {-}\phi_c^2\bar{\mathcal{R}}({c_m}) \quad \mbox{at} \ r = \varepsilon R_{m0}, \end{equation}
thus reducing our problem to fluid flow and nutrient transport in the lumen, membrane and ECS only. Formally, (B11) replaces (2.5b)–(2.5c) as  $R_{c0} \rightarrow R_{m0}$. Physically, (B11) states that the effective jump in diffusive flux across the membrane wall is due to nutrient uptake by the cells. Similarly to the derivation of (B11), the effective boundary condition at the membrane-ECS interface for the waste transport problem becomes
 \begin{equation} w_m = w_e, \quad \phi_m^2\frac{\partial w_m}{\partial r} = \frac{\partial w_e}{\partial r} + \nu\phi_c^2\bar{\mathcal{R}}(c_e) \quad \mbox{at} \ r = \varepsilon R_{m0}. \end{equation}
Appendix C. Streamfunction–arclength formulation
To mathematically reduce the dimensionality of the two-dimensional advection term in our nutrient transport model, we consider the transformation of our system from a three-dimensional Cartesian coordinate system to a streamfunction–arclength formulation defined in axisymmetric cylindrical coordinates,  $(x, y, z) \mapsto (\psi, \theta, s)$. However, given that our solutions to the fluid flow problem are known in an axisymmetric cylindrical coordinate system, it is prudent to express our Cartesian coordinate system in terms of cylindrical coordinates, such that
 \begin{equation} x = r(\psi, s)\cos{\theta}, \quad y = r(\psi, s)\sin{\theta}, \quad z = z(\psi, s). \end{equation}
The metrics of the transformation can be expressed as
 \begin{gather} H_\psi \equiv \left|\frac{\partial\boldsymbol{x}}{\partial\psi}\right| = \sqrt{x_\psi^2 + y_\psi^2 + z_\psi^2} = \sqrt{r_\psi^2(\cos^2\theta + \sin^2\theta) + z_\psi^2} = \left|\frac{\partial\boldsymbol{r}}{\partial\psi}\right|, \end{gather}
 \begin{gather}H_\theta \equiv \left|\frac{\partial\boldsymbol{x}}{\partial\theta}\right| = r\sqrt{\cos^2\theta + \sin^2\theta} = r, \end{gather}
 \begin{gather}H_s \equiv \left|\frac{\partial\boldsymbol{x}}{\partial s}\right| = \sqrt{x_s^2 + y_s^2 + z_s^2} = \sqrt{r_s^2(\cos^2\theta + \sin^2\theta) + z_s^2} = \left|\frac{\partial\boldsymbol{r}}{\partial s}\right| , \end{gather}
where  $\boldsymbol {x} = (x,y,z)$ and $\boldsymbol {r} = (r,\theta, z)$.
The streamfunction ( $\psi$) relates to the fluid velocity in domain $i$ by
 \begin{equation} \boldsymbol{U}_i = \boldsymbol{\nabla} \times \boldsymbol{\psi}, \end{equation}
where  $\boldsymbol {\psi } = (0,0,\psi )$. Having previously solved for components of the fluid velocity in cylindrical coordinates, (C3) can be written as
 \begin{equation} U_{i} = {-}\frac{1}{r}\frac{\partial\psi}{\partial z}, \quad W_{i} = \frac{1}{r}\frac{\partial\psi}{\partial r}, \end{equation}
where  $U_i, W_i$ are the radial and axial components of fluid velocity, respectively. Therefore
 \begin{equation} \left|\frac{\partial\psi}{\partial \boldsymbol{r}}\right| = \sqrt{\left(\frac{\partial\psi}{\partial r}\right)^2 + \left(\frac{\partial\psi}{\partial z}\right)^2} = r\sqrt{U_i^2 + W_i^2} = r\tilde{U}_i. \end{equation}
We can relate (C5) to the metric of transformation  $H_\psi$ by
 \begin{equation} \frac{\partial\psi}{\partial \boldsymbol{r}}\boldsymbol{\cdot} \frac{\partial \boldsymbol{r}}{\partial\psi} = \left|\frac{\partial\psi}{\partial \boldsymbol{r}}\right|\left|\frac{\partial \boldsymbol{r}}{\partial\psi}\right|\cos\theta. \end{equation}
Given that both vectors are tangential and align in the direction of constant  $s$, this means that $\theta =0$, and thus $\cos \theta = 1$. The left hand side of (C6) can be simplified if we consider the Jacobian of the transformation $(r,z) \mapsto (\psi, s)$
 \begin{equation} \left|\frac{\partial(r,z)}{\partial(\psi,s)}\right| = \begin{pmatrix} r_\psi & r_s \\ z_\psi & z_s \end{pmatrix} = \begin{pmatrix} \psi_r & \psi_z \\ s_r & s_z \end{pmatrix}^{{-}1} = \frac{1}{\psi_r s_z - \psi_z s_r} \begin{pmatrix} s_z & -\psi_z \\ -s_r & \psi_r \end{pmatrix}. \end{equation}
Therefore, the left-hand side of (C6) becomes
 \begin{equation} \frac{\partial\psi}{\partial \boldsymbol{r}}\boldsymbol{\cdot} \frac{\partial \boldsymbol{r}}{\partial\psi} = \psi_r r_\psi + \psi_z z_\psi = \frac{\psi_r s_z - \psi_z s_r}{\psi_r s_z - \psi_z s_r} = 1, \end{equation}
as a direct result of the inverse function theorem. Therefore,
 \begin{gather} \left|\frac{\partial\psi}{\partial \boldsymbol{r}}\right|\left|\frac{\partial \boldsymbol{r}}{\partial\psi}\right| = 1, \end{gather}
 \begin{gather}\Rightarrow \left|\frac{\partial \boldsymbol{r}}{\partial\psi}\right| = \left|\frac{\partial\psi}{\partial \boldsymbol{r}}\right|^{{-}1} = \frac{1}{r\tilde{U}}. \end{gather}
 The normalised arclength ( $s$) parameterises the distance along streamlines. Without loss of generality, we impose $0 \leq s \leq 1$ in the lumen, $1 \leq s \leq 2$ in the membrane and $2 \leq s \leq 3$ in the ECS. We let $\mathcal {L}_i$ denote the actual arclength of a streamline in domain $i$, which varies between 0 and the total length of the streamline, $l_{\psi,i}$. The arclength $\mathcal {L}_{i}$ and normalised arclength $s$ are therefore related by
 \begin{equation} \mathcal{L}_{i} = l_{\psi,i}(s - n_i), \end{equation}
where  $n_i = 0,1,2$ for the lumen, membrane and ECS, respectively. We also know that, along a streamline of constant $\psi$, we can relate the arclength of a streamline to axisymmetric coordinates such that
 \begin{equation} {\mbox{d}\mathcal{L}_i}^{2} = {\mbox{d} r}^2 + {\mbox{d} z}^2. \end{equation}
With  $\psi$ fixed, $\mathcal {L}_i$ varies only with $s$. Combining (C10) and (C11), this means that
 \begin{gather} \left(\frac{\partial\mathcal{L}_i}{\partial s}\right)^2 = \left(\frac{\partial r}{\partial s}\right)^2 + \left(\frac{\partial z}{\partial s}\right)^2 = l_{\psi,i}^2, \end{gather}
 \begin{gather}\Rightarrow \left|\frac{\partial\boldsymbol{r}}{\partial s}\right| = \sqrt{\left(\frac{\partial r}{\partial s}\right)^2 + \left(\frac{\partial z}{\partial s}\right)^2} = l_{\psi,i}. \end{gather}
Substituting (C9), (C12) in to (C2), we can determine the metrics of the transformation to be
 \begin{equation} H_\psi = \frac{1}{r\tilde{U}_i} , \quad H_\theta = r, \quad H_s = l_{\psi,i}. \end{equation}
In these transformed coordinates, (2.2) becomes
 \begin{equation} \mathcal{P}_i\frac{\tilde{U}_i}{H_s}\frac{\partial c_i}{\partial s} = \frac{1}{H_\psi H_\theta H_s}\left[\frac{\partial}{\partial\psi}\left(\frac{H_\theta H_s}{H_\psi}\frac{\partial c_i}{\partial \psi}\right) + \frac{\partial}{\partial s}\left(\frac{H_\psi H_\theta}{H_s}\frac{\partial c_i}{\partial s}\right)\right], \quad i = l,e.\end{equation}
Finally, substituting in our metrics of transformation (C13a–c) into (C14), we recover (3.3).
To transform the boundary conditions from axisymmetric to streamfunction–arclength formulation, we make use of the fact that
 \begin{gather} \frac{\partial}{\partial r} = \frac{\partial\psi}{\partial r}\frac{\partial}{\partial\psi} + \frac{\partial s}{\partial r}\frac{\partial}{\partial s} = rW_i\frac{\partial}{\partial\psi} + \frac{U_i}{l_{\psi,i}\tilde{U}_i}\frac{\partial}{\partial s}, \end{gather}
 \begin{gather}\frac{\partial}{\partial z} = \frac{\partial\psi}{\partial z}\frac{\partial}{\partial\psi} + \frac{\partial s}{\partial z}\frac{\partial}{\partial s} = {-}rU_i\frac{\partial}{\partial\psi} + \frac{W_i}{l_{\psi,i}\tilde{U}_i}\frac{\partial}{\partial s}. \end{gather}
With this, continuity of concentration and solute flux (2.5a) becomes
 \begin{equation} c_l = c_m, \end{equation}
 \begin{align} &rW_l\frac{\partial c_l}{\partial\psi} + \frac{U_l}{l_{\psi,l}\tilde{U}_l}\frac{\partial c_l}{\partial s} = \phi_m^2\left(rW_m\frac{\partial c_m}{\partial\psi} + \frac{U_m}{l_{\psi,m}\tilde{U}_m}\frac{\partial c_m}{\partial s}\right)\nonumber\\ &\quad \mbox{at} \ s = 1, \psi \in [\psi_{l,crit},\psi_{l,max}), \end{align}
and the effective cell layer condition (B11) becomes
 \begin{equation} c_m = c_e, \end{equation}
 \begin{align} &\phi_m^2\left(rW_m\frac{\partial c_m}{\partial\psi} + \frac{U_m}{l_{\psi,m}\tilde{U}_m}\frac{\partial c_m}{\partial s}\right) = \left(rW_e\frac{\partial c_e}{\partial\psi} + \frac{U_e}{l_{\psi,e}\tilde{U}_e}\frac{\partial c_e}{\partial s}\right) - \phi_c^2\bar{\mathcal{R}}(c_e) \nonumber\\ &\quad \mbox{at}\ s = 2, \psi \in (\psi_{e,min},\psi_{e,crit}]. \end{align}
The symmetry condition (2.6) and the no-flux condition at the outer wall (2.7) become
 \begin{equation} rW_i\frac{\partial c_i}{\partial\psi} + \frac{U_i}{l_{\psi,i}\tilde{U}_i}\frac{\partial c_i}{\partial s} = 0 \quad \mbox{at} \ \psi = 0, \psi_{e,max}, \end{equation}
and the no-diffusive-flux outlet conditions (2.10) become
 \begin{equation} \frac{W_i}{l_{\psi,i}\tilde{U}_i}\frac{\partial c_i}{\partial s} -rU_i\frac{\partial c_i}{\partial\psi} = 0 \quad \mbox{at} \ s = 1, \psi \in (0, \psi_{l,crit}] \quad \mbox{and} \quad s = 3. \end{equation}
The inlet concentration conditions (2.9) remain the same,
 \begin{gather} c_l = 1 \quad \mbox{at} \ s = 0, \end{gather}
 \begin{gather}c_e = 0 \quad \mbox{at} \ s = 2, \psi \in (\psi_{e,crit},\psi_{e,max}]. \end{gather}
For waste metabolite transport, the governing equations (3.3) remain the same, swapping  $c_i$ for $w_i$. The jump condition (B12) becomes
 \begin{equation} w_m = w_e, \end{equation}
 \begin{align} &\phi_m^2\left(rW_m\frac{\partial w_m}{\partial\psi} + \frac{U_m}{l_{\psi,m}\tilde{U}_m}\frac{\partial w_m}{\partial s}\right) = \left(rW_e\frac{\partial w_e}{\partial\psi} + \frac{U_e}{l_{\psi,e}\tilde{U}_e}\frac{\partial w_e}{\partial s}\right) + \nu\phi_c^2\bar{\mathcal{R}}(w_e) \nonumber\\ &\quad \mbox{at}\ s = 2, \psi \in (\psi_{e,min},\psi_{e,crit}], \end{align}
and the inlet concentration (2.12) condition becomes
 \begin{gather} w_l = 0 \quad \mbox{at} \ s = 0, \end{gather}
 \begin{gather}w_e = 0 \quad \mbox{at} \ s = 2, \psi \in (\psi_{e,crit},\psi_{e,max}]. \end{gather}
The remaining boundary conditions (C16), (C18) and (C19) remain the same as for nutrient transport, exchanging  $c_i$, for $w_i$.
Appendix D. Model reduction of metabolite transport problem
Motivated by the scaling arguments outlined in § 3.3.1 and dropping the superscript  $^\star$, (3.3) in the lumen and ECS becomes
 \begin{equation} \varepsilon^2\mathcal{P}_i\frac{\partial c_i}{\partial s} = \frac{\partial}{\partial\psi}\left({r}^2 l_{\psi,i}\tilde{U}_i\frac{\partial c_i}{\partial \psi}\right) + \varepsilon^2\frac{\partial}{\partial s}\left(\frac{1}{l_{\psi,i}\tilde{U}_i}\frac{\partial c_i}{\partial s}\right), \end{equation}
for  $i=l,e$ where
 \begin{equation} \tilde{U}_i = \sqrt{\varepsilon^2U_i^2 + W_i^2}, \end{equation}
and the reduced Péclet number  $\varepsilon ^{2}\mathcal {P}_i = {O}(1)$. Utilising the scalings outlined in § 3.3.2, (3.3) in the membrane becomes
 \begin{equation} \varepsilon^2\mathcal{P}_m\frac{\partial c_m}{\partial s} = \varepsilon^2\frac{\partial}{\partial\psi}\left({r}^2 l_{\psi,m}\tilde{U}_m\frac{\partial c_m}{\partial \psi}\right) + \frac{\partial}{\partial s}\left(\frac{1}{l_{\psi,m}\tilde{U}_m}\frac{\partial c_m}{\partial s}\right), \end{equation}
where the reduced Péclet number in the membrane  $\varepsilon ^{2}\mathcal {P}_m = \varepsilon ^{2}\mathcal {P}_l/\phi _m = {O}(1)$. Utilising the appropriate scalings from §§ 3.3.1 and 3.3.2, continuity of concentration and solute flux becomes
 \begin{equation} c_l = c_m, \end{equation}
 \begin{align} &r W_l\frac{\partial c_l}{\partial\psi} + \varepsilon^2\frac{U_l}{l_{\psi,l}\tilde{U}_l}\frac{\partial c_l}{\partial s} = \phi_m^2\left(\varepsilon^2r W_m\frac{\partial c_m}{\partial\psi} + \frac{U_m}{l_{\psi,m}\tilde{U}_m}\frac{\partial c_m}{\partial s}\right) \nonumber\\ &\quad \mbox{at} \ s = 1, \psi \in [\psi_{l,crit},\psi_{l,max}), \end{align}
and the effective cell layer condition becomes
 \begin{equation} c_m = c_e, \end{equation}
 \begin{align} &\phi_m\left(\varepsilon^2 r W_m\frac{\partial c_m}{\partial\psi} + \frac{U_m}{l_{\psi,m}\tilde{U}_m}\frac{\partial c_m}{\partial s}\right) = \left(r W_e\frac{\partial c_e}{\partial\psi} + \varepsilon^2\frac{U_e}{l_{\psi,e}\tilde{U}_e}\frac{\partial c_e}{\partial s}\right) - \varepsilon \phi_c^2\bar{\mathcal{R}}(c_e) \nonumber\\ &\quad \mbox{at}\ s = 2, \psi \in (\psi_{e,min},\psi_{e,crit}]. \end{align}
The symmetry condition and the no-flux condition at the outer wall (C18) become
 \begin{equation} r W_i\frac{\partial c_i}{\partial\psi} + \varepsilon^2\frac{U_i}{l_{\psi,i}\tilde{U}_i}\frac{\partial c_i}{\partial s} = 0 \quad \mbox{at} \ \psi = 0, \psi_{e,max}, \end{equation}
and the no-diffusive-flux outlet conditions become
 \begin{equation} \frac{W_i}{l_{\psi,i}\tilde{U}_i}\frac{\partial c_i}{\partial s} -r U_i \frac{\partial c_i}{\partial\psi} = 0 \quad \mbox{at} \ s = 1, \psi \in (0, \psi_{l,crit}] \quad \mbox{and} \quad s = 3. \end{equation}
The inlet concentration conditions remain the same
 \begin{gather} c_l = 1 \quad \mbox{at} \ s = 0, \end{gather}
 \begin{gather}c_e = 0 \quad \mbox{at} \ s = 2, \psi \in (\psi_{e,crit},\psi_{e,max}]. \end{gather}
Again, (D1)–(D4), (D6) and (D7) remain the same for waste metabolite transport exchanging  $c_i$ for $w_i$. The effective boundary condition (C21) becomes
 \begin{equation} w_m = w_e, \end{equation}
 \begin{align} &\phi_m^2\left(\varepsilon^2 r W_m\frac{\partial w_m}{\partial\psi} + \frac{U_m}{l_{\psi,m}\tilde{U}_m}\frac{\partial w_m}{\partial s}\right) = \left(r W_e\frac{\partial w_e}{\partial\psi} + \varepsilon^2\frac{U_e}{l_{\psi,e}\tilde{U}_e}\frac{\partial w_e}{\partial s}\right) - \varepsilon \phi_c^2\bar{\mathcal{R}}(w_e) \nonumber\\ &\quad \mbox{at}\ s = 2, \psi \in (\psi_{e,min},\psi_{e,crit}], \end{align}
and the inlet concentration condition remains the same as (C22).
Appendix E. Solution to metabolite transport problem
E.1 Membrane solution
From (3.5), we see that  $\tilde {U}_m = U_m$ at leading order in $\varepsilon$. Therefore at leading order and dropping superscript $\star$, (D3) becomes (3.6). Equation (3.6) is then solved subject to continuity of concentration (D4a) and the leading-order effective cell layer boundary condition (D5b), which becomes
 \begin{equation} \frac{\phi_m^2}{l_{\psi,m}}\frac{\partial c_m}{\partial s} = {-} \varepsilon \phi_c^2\bar{\mathcal{R}}(c_m) \quad \mbox{at}\ s = 2, \psi \in (\psi_{e,min},\psi_{e,crit}], \end{equation}
noting that  $W_e$ vanishes at the membrane–ECS interface as per (A4), and continuity of concentration (D5a) means we can consider $c_m = c_e$ at this interface too. For generality, we retain $\varepsilon \bar {\mathcal {R}}$ as an $O (1)$ quantity. Having previously solved the fluid transport problem analytically in Appendix A to obtain $U_m$, we know that streamlines in the membrane align with the radial axis as demonstrated in figure 3. Therefore, we can relate the radial coordinate to the normalised arclength in the membrane via the relationship
 \begin{equation} r = (s-1)(R_{m0} - 1) + 1, \end{equation}
and streamline lengths throughout the membrane become,
 \begin{equation} l_{\psi,m} = R_{m0} - 1. \end{equation}
On this basis, we can express the fluid velocity along a streamline in the membrane wall by the radial velocity in (A3b), having transformed the radial coordinate by (E2) to give
 \begin{equation} \tilde{U}_m = U_m = \frac{\kappa(P_l - P_e)}{\phi_m[(s-1)(R_{m0}-1) + 1]\ln R_{m0}}. \end{equation}
Substituting (E2)–(E4) into (3.6), we can integrate subject to continuity of concentration (D4a) and the effective membrane-ECS interfacial condition (E1) to determine that
 \begin{equation} c_m = c_l|_{[l,m]} - \mathcal{A}([(s-1)(R_{m0}-1) + 1]^{-\xi} - 1), \quad \xi = \frac{\varepsilon^2\mathcal{P}_l\kappa(P_e - P_l)}{\phi_m^2\ln R_{m0}}, \end{equation}
where  $c_l|_{[l,m]}$ denotes the unknown lumen concentration at the lumen–membrane interface and $\mathcal {A}$ depends on $c_l|_{[l,m]}$. These unknowns depend on the solution to nutrient concentration in the lumen which in turn is coupled to the solution to the membrane concentration itself. Therefore, care must be taken when handling interfacial conditions coupling each region together. To understand this coupling, we must now consider nutrient concentration in the lumen and ECS.
E.2 Lumen/ECS solution
E.2.1 Boundary layer analysis
Equation (D1) results in a singular perturbation problem as  $\varepsilon \to 0$, and implies the existence of a boundary layer at the end of the streamlines in the lumen and ECS where diffusion along streamlines dominates. Therefore, care must be taken in deriving an appropriate matching condition for the outer region.
We first investigate the boundary layer at the lumen and ECS exits. To maintain a dominant balance of advection and diffusion along streamlines,  $s$ must scale with $\varepsilon ^2$. We introduce an $O (1)$ variable $\hat {s}$ and scale such that $s = n + \varepsilon ^2 \hat {s}$ where $n=1,3$ in the lumen and ECS, respectively. Equation (D1) then becomes
 \begin{equation} \varepsilon^2\mathcal{P}_i\frac{\partial \hat{c}_i}{\partial \hat{s}} = \varepsilon^2\frac{\partial}{\partial\psi}\left({r}^2 l_{\psi,i}\tilde{U}_i\frac{\partial \hat{c}_i}{\partial \psi}\right) + \frac{\partial}{\partial \hat{s}}\left(\frac{1}{l_{\psi,i}\tilde{U}_i}\frac{\partial \hat{c}_i}{\partial \hat{s}}\right), \end{equation}
subject to
 \begin{equation} \frac{W_i}{l_{\psi,i}\tilde{U}}_i\frac{\partial \hat{c}_i}{\partial \hat{s}} -\varepsilon^2 r U_i \frac{\partial \hat{c}_i}{\partial\psi} = 0 \quad \mbox{at} \ \hat{s} = 0, \quad \psi \in [0,\psi_{l,crit})\ \mbox{and} \ \psi \in (\psi_{e,min},\psi_{e,max}), \end{equation}
at the bioreactor outlet. Here,  $\psi _{i,min},\psi _{i,max}$ denote the minimum and maximum streamline values in domain $i=l,e$, respectively. At leading order in $\varepsilon$, (E6) and (E7) become
 \begin{equation} \varepsilon^2\mathcal{P}_i\frac{\partial \hat{c}_i}{\partial \hat{s}} = \frac{\partial}{\partial \hat{s}}\left(\frac{1}{l_{\psi,i}\tilde{U}}_i\frac{\partial \hat{c}_i}{\partial \hat{s}}\right), \end{equation}
subject to
 \begin{equation} \frac{\partial \hat{c}_i}{\partial \hat{s}} = 0 \quad \mbox{at} \ \hat{s} = 0, \quad \psi \in [0,\psi_{l,crit})\ \mbox{and} \ \psi \in (\psi_{e,min},\psi_{e,max}). \end{equation}
Equation (E8) is satisfied by the general solution
 \begin{equation} \hat{c}_i = A_1(\psi) - A_2(\psi)\exp{\left(\varepsilon^2\mathcal{P}_i l_{\psi,i}\int_0^{\hat{s}}\tilde{U}_i\,\mbox{d}\hat{s}\right)}, \end{equation}
and solving subject to (E9) we see that  $A_2 = 0$. $A_1$ can be solved for by matching into the concentration leaving the outer region, which shows that the concentration remains constant along streamlines in the boundary layer and equal to the concentration entering the boundary layer (i.e. there is no boundary layer at leading order for outlet flow).
We now investigate the lumen boundary layer at the lumen–membrane interface. This boundary layer is of  $O (\varepsilon )$ thickness, given that in this region it is consistent to scale $r$ and $W_l$ as well as $s$. Therefore, we scale $s = 1 + \varepsilon \hat {s}$, $r = 1 + \varepsilon \hat {r}$ and, due to continuity of flux, scale $W_l = \varepsilon \hat {W}_l$ in the lumen. Using these scalings, (D1) becomes
 \begin{equation} \varepsilon^2\mathcal{P}_l\frac{\partial \hat{c}_l}{\partial \hat{s}} = \varepsilon^2\frac{\partial}{\partial\psi}\left((1 + \varepsilon{\hat{r}})^2 l_{\psi,i}\hat{\tilde{U}}_l\frac{\partial \hat{c}_l}{\partial \psi}\right) + \frac{\partial}{\partial \hat{s}}\left(\frac{1}{l_{\psi,i}\hat{\tilde{U}}_l}\frac{\partial \hat{c}_l}{\partial \hat{s}}\right), \end{equation}
where
 \begin{equation} \tilde{U}_l = \sqrt{\varepsilon^2 {U_l}^2 + W_l^2} = \sqrt{\varepsilon^2{U_l}^2 + \varepsilon^2\hat{W}_l^2} = \varepsilon\sqrt{{U_l}^2 + \hat{W_l}^2} = \varepsilon\hat{\tilde{U}}_l. \end{equation}
The lumen–membrane interfacial condition (D4) becomes
 \begin{align} &\varepsilon(1 + \varepsilon\hat{r}) W_l\frac{\partial \hat{c}_l}{\partial\psi} + \frac{U_l}{l_{\psi,l}\hat{\tilde{U}}_l}\frac{\partial \hat{c}_l}{\partial \hat{s}} = \phi_m^2\left(\varepsilon^2r W_m\frac{\partial c_m}{\partial\psi} + \frac{U_m}{l_{\psi,m}\tilde{U}_m}\frac{\partial c_m}{\partial s}\right) \nonumber\\ &\quad \mbox{at} \ \hat{s} = 0, \psi \in [\psi_{l,crit},\psi_{l,max}). \end{align}
At  $O (1)$, (E11) reduces to (E8) and thus gives the general solution (E10). Equation (E13) becomes
 \begin{equation} \frac{1}{l_{\psi,l}}\frac{\partial \hat{c}_l}{\partial \hat{s}} = \frac{\phi_m^2}{l_{\psi,m}}\frac{\partial c_m}{\partial s} \quad \mbox{at} \ \hat{s} = 0, \psi \in [\psi_{l,crit},\psi_{l,max}), \end{equation}
noting that  $\tilde {U}_m = U_m$ at leading order, and $\hat {\tilde {U}}_l = U_l$, $\hat {W}_l = 0$ given by the no-slip condition at the lumen–membrane interface (A4). We know the solution to $c_m$ in terms of the concentration at the lumen–membrane interface $c_l|_{[l,m]}$ given by (E5). Substituting (E10) and (E5) in to (E14), we find that $A_2 = \mathcal {A}$, and from matching into the outer solution in the lumen, we know that $A_1 = c_l|_{s \uparrow 1}$, giving
 \begin{equation} \hat{c}_l = c_l|_{s \uparrow 1} - \mathcal{A}\exp\left(\varepsilon^2\mathcal{P}_l l_{\psi,l}\int_0^{\hat{s}} \tilde{U}_l\,\mbox{d}\hat{s}\right). \end{equation}
From the continuity of normal fluid flux condition (A4), we can write
 \begin{equation} \left.\int_0^{\hat{s}} \tilde{U}_l \, \mbox{d} \hat{s} \right|_{\hat{s} = 0} = \left.\int_0^{\hat{s}} U_l \, \mbox{d} \hat{s} \right|_{\hat{s} = 0} = \left.\phi_m\int_1^{s} U_m\, \mbox{d} s \right|_{s = 1} = 0, \end{equation}
and thus using (E15) can express the lumen–membrane interfacial concentration as
 \begin{equation} c_l|_{[l,m]} = c_l|_{s \uparrow 1} - \mathcal{A}. \end{equation}
Therefore substituting (E17) into (E5) and dropping superscript notation gives (3.11).
E.3 Lumen/ECS outer solution
We now solve for the nutrient concentration in the outer regions of the lumen and ECS. From (D2),  $\tilde {U}_i = W_i$ at leading order in $\varepsilon$. Dropping the superscript $\star$, (D1) at leading order becomes (3.4). Owing to our asymptotic reduction, we see that (3.4) is first order with respect to $s$. Therefore, we require initial conditions in $s$ to solve for transport in the lumen and ECS, which come from inlet conditions (D5a), (D8). Additionally, the symmetry and no-flux condition at leading order becomes
 \begin{equation} c_m = 1 - \mathcal{A}((s-1)(R_{m0}-1) + 1)^{-\xi}, \quad \xi = \frac{\varepsilon^2\mathcal{P}_l\kappa(P_e - P_l)}{\phi_m^2\ln R_{m0}}, \quad \mathcal{A} = \frac{b + \sqrt{b^2 + 4ac}}{2a}, \end{equation}
which is also given as (3.8) in the main body.
We solve (3.4) using the method of lines, whereby we discretise along the  $\psi$ coordinate, resulting in a linear system of ODEs with respect to $s$ which can be solved readily using MATLAB's in-built ODE solver, ode15s.
E.4 Waste transport
We solve for the waste transport problem similarly to the nutrient transport problem in this appendix. As in the derivation of nutrient transport concentration in the membrane (3.11), we solve (3.6) swapping  $c_i$ for $w_i$ subject to continuity of concentration
 \begin{equation} w_l = w_m \quad \mbox{at} \ s = 1, \psi \in [\psi_{l,crit},\psi_{l,max}), \end{equation}
and the leading-order effective boundary condition
 \begin{equation} \frac{\phi_m^2}{l_{\psi,m}}\frac{\partial w_m}{\partial s} = \varepsilon \phi_c^2\bar{\mathcal{R}}(c_m) \quad \mbox{at}\ s = 2, \psi \in (\psi_{e,min},\psi_{e,crit}], \end{equation}
giving
 \begin{equation} w_m = w_l|_{s \uparrow 1} + \mathcal{B}((s-1)(R_{m0}-1) + 1)^{-\xi}, \end{equation}
where
 \begin{equation} \mathcal{B} = {-}\frac{\varepsilon\phi_c^2\bar{\mathcal{R}}(c_m)\log{R_{m0}}}{\varepsilon^2 \mathcal{P}_{w,l}\kappa(P_e - P_l)R_{m0}^{-(\xi + 1)}}. \end{equation}


 Open access