


Introduction
Marine ice forms from a mixture of sea and fresh water and adds mass to the underside of ice shelves. It can accrete in open basal structures, such as rifts and crevasses (Reference MorganMorgan, 1972; Reference SouchezSouchez and others, 1991; Reference OerterOerter and others, 1992; Reference Tison, Ronveaux and LorrainTison and others, 1993; Reference EickenEicken, 1994; Reference Khazendar, Tison, Stenni, Dini and BondesanKhazendar and others, 2001; Reference CravenCraven and others, 2004, Reference Craven, Allison, Fricker and Warner2009; Reference PattynPattyn and others, 2012; Reference Jansen, Luckman, Kulessa, Holland and KingJansen and others, 2013), suture zones (Reference Jansen, Luckman, Kulessa, Holland and KingJansen and others, 2013; Reference Kulessa, Jansen, Luckman, King and SammondsKulessa and others, 2014) or as a massive layer below meteoric ice-shelf ice (Reference Zotikov, Zagorodnov and RaikovskyZotikov and others, 1980; Reference Craven, Allison, Fricker and WarnerCraven and others, 2009; Reference Treverrow, Warner, Budd and CravenTreverrow and others, 2010). Its presence influences the rheology and stability of ice shelves (Reference Khazendar, Rignot and LarourKhazendar and others, 2009; Reference Kulessa, Jansen, Luckman, King and SammondsKulessa and others, 2014), which drain 74% of Antarctica’s grounded ice together with outlet glaciers (Reference BindschadlerBindschadler and others, 2011). Ice shelves also buttress most ice streams (Reference Dupont and AlleyDupont and Alley, 2005). Marine ice has been increasingly observed in Antarctic ice shelves, either directly in ice-core samples (Reference Zotikov, Zagorodnov and RaikovskyZotikov and others, 1980; Reference SouchezSouchez and others, 1991; Reference Tison, Ronveaux and LorrainTison and others, 1993; Reference Eicken, Oerter, Miller, Graf and KipfstuhlEicken and others, 1994; Reference Khazendar, Tison, Stenni, Dini and BondesanKhazendar and others, 2001; Reference Craven, Allison, Fricker and WarnerCraven and others, 2009; Reference PattynPattyn and others, 2012; Reference Dierckx, Peternell, Schroeder and TisonDierckx and others, 2014) or remotely using geophysical methods (Reference Fricker, Popov, Allison and YoungFricker and others, 2001; Reference Joughin and VaughanJoughin and Vaughan, 2004; Reference McMahon and LackieMcMahon and Lackie, 2006; Reference Khazendar, Rignot and LarourKhazendar and others, 2009; Reference PattynPattyn and others, 2012; Reference Jansen, Luckman, Kulessa, Holland and KingJansen and others, 2013).
Due to the difficulty associated with accessing the ice-shelf cavity, processes of marine ice formation, including timing, location and volume, remain largely unknown. Since marine ice can be several hundred metres thick (e.g. Amery Ice Shelf, East Antarctica; Reference Craven, Allison, Fricker and WarnerCraven and others, 2009), fast-forming frazil ice crystals are assumed to be mainly responsible for the generation of marine ice (Reference Treverrow, Warner, Budd and CravenTreverrow and others, 2010), allowing for marine ice accumulation rates of >1 m a−1 at some ice shelves (Reference Bombosch and JenkinsBombosch and Jenkins, 1995; Reference Wen, Wang, Wang, Jezek, Liu and AllisonWen and others, 2010). Indeed, loose agglomerations of frazil ice crystals have been observed below ice shelves in borehole imagery (Reference CravenCraven and others, 2005; Reference Hubbard, Tison, Pattyn, Dierckx, Boereboom and SamynHubbard and others, 2012). These small freely floating discoid ice crystals nucleate in supercooled water (Reference MartinMartin, 1981; Reference DalyDaly, 1984), which is water cooled below its in situ freezing point without changing state (Reference Leonard, Mager, Pauling, Hughes and SmithLeonard and others, 2014). Supercooling of water masses below ice shelves can occur as a result of a change in the pressure-dependent freezing point due to adiabatically rising water masses (Reference Foldvik and KvingeFoldvik and Kvinge, 1974) or double diffusion of heat and salt between water masses of different salinities at their freezing point (Reference Souchez, Khazendar, Ronveaux and TisonSouchez and others, 1998). Both mechanisms generally involve mixing of sea water with fresher water. The former process is part of a thermohaline circulation often referred to as the ‘ice pump’ mechanism (Reference Lewis and PerkinLewis and Perkin, 1986) and has been widely associated with marine ice formation in thick layers (e.g. Reference Galton-Fenzi, Hunter, Coleman, Marsland and WarnerGalton-Fenzi and others, 2012). Hereby, continental freshwater ice is melted at depth close to the grounding line of an ice shelf by denser High Salinity Shelf Water (HSSW), which is generated during sea-ice formation in winter. Similarly, warmer Circumpolar Deep Water (CDW) can enter the ice-shelf cavity inducing melt at the ice-shelf base (Reference Jacobs, Helmer, Doake, Jenkins and FrolichJacobs and others, 1992). This meltwater then rises along the gradient of the ice shelf due to its buoyancy to shallower waters, where it becomes supercooled due to a change in the pressure-dependent freezing point and frazil ice crystals nucleate (Reference Galton-Fenzi, Hunter, Coleman, Marsland and WarnerGalton-Fenzi and others, 2012). Double diffusion-induced supercooling could occur close to the grounding line of shallower ice shelves, where surface meltwater can percolate through sediment (Reference Souchez, Khazendar, Ronveaux and TisonSouchez and others, 1998) or drain through tide cracks (Reference Gow, Weeks, Hendrickson and RowlandGow and others, 1965; Reference Gow and EpsteinGow and Epstein, 1972) to the ice/water interface. Heat diffuses faster than salt from relatively warmer meltwater to colder sea water (Reference Martin and KauffmanMartin and Kauffman, 1974). This results in rapid freezing of the less saline water mass. If both water masses are near their salinity-dependent freezing point and become turbulently mixed, frazil ice crystals might nucleate in a double diffusion process (Reference McPhee, Skogseth, Nilsen and SmedsrudMcPhee and others, 2013). This could be driven by a shallow tidal circulation. If supercooled water extends to the ocean floor, frazil ice crystals can also flock together on the sea floor, forming anchor ice (Reference Mager, Smith, Kempema, Thomson and LeonardMager and others, 2013). This ice could eventually lift off the ocean floor when its buoyancy is large enough and contribute to marine ice at the ice-shelf base (e.g. Reference SwithinbankSwithinbank, 1970).
Over time, frazil ice crystals gradually sinter together and adjust their shape to minimize the surface energy of the ice crystals (Reference MartinMartin, 1981). However, it remains uncertain whether marine ice is formed from frazil ice crystals only, that grow, settle and compact much like snow due to the buoyancy pressure, or whether ‘pore spaces’ between individual frazil ice crystals are filled by sea water, which freezes as a result of heat conduction through the ice shelf (Reference EickenEicken, 1994; Reference Tison, Khazendar and RoulinTison and others, 2001). In either case, the bulk of marine ice (70–95 %) would be made up of frazil ice crystals due to their high buoyancy pressure (Reference Tison, Khazendar and RoulinTison and others, 2001). Once consolidated, frazil ice crystals in marine ice form granular, banded or platelet ice facies. Granular ice facies have been observed most frequently in marine ice formed from primarily frazil ice crystals (Reference OerterOerter and others, 1992; Reference Tison, Ronveaux and LorrainTison and others, 1993; Reference Eicken, Oerter, Miller, Graf and KipfstuhlEicken and others, 1994; Reference Treverrow, Warner, Budd and CravenTreverrow and others, 2010), followed by banded ice facies (Reference Khazendar, Tison, Stenni, Dini and BondesanKhazendar and others, 2001; Reference CravenCraven and others, 2004; Tison and others, 2010; Reference Treverrow, Warner, Budd and CravenTreverrow and others, 2010; Reference PattynPattyn and others, 2012) (Table 1). Large platelet ice facies are less common in marine ice (Reference Gow and EpsteinGow and Epstein, 1972; Reference Tison, Ronveaux and LorrainTison and others, 1993) (Table 1).
Occurrence of ice crystal facies (gr: granular; bd: banded; clm: columnar; pl: platelet), measured range in δ18O and salinity, and co-isotopic slopes of marine ice in previous studies

A better understanding of marine ice formation processes outlined above contributes to the assessment of the stability of ice shelves, many of which are experiencing rapid change as a result of increased ice-shelf basal melt rates due to oceanic erosion (e.g. Reference DepoorterDepoorter and others, 2013) and surface melt/ponding (e.g. Reference Banwell, Caballero, Arnold, Glasser, Mac Cathles and MacAyealBanwell and others, 2014). The aim of this study is to determine the composition and origin of water masses that freeze to form marine ice at the southern McMurdo Ice Shelf (SMIS), Antarctica, (Fig. 1) and whether there are spatio-temporal variations. To accomplish this, marine ice samples were collected from different SMIS sites, and the ice crystal morphology and chemistry was analysed in conjunction with a boundary layer freezing model. The data are interpreted in the light of the geographic setting to determine whether marine ice at SMIS was formed as a result of a deep thermohaline circulation, or in a double diffusion mechanism of heat and salt during turbulent mixing of sea water with fresher surface meltwater.
Landsat Image Mosaic of Antarctica (LIMA) showing the location of the southern McMurdo Ice Shelf (SMIS), McMurdo Sound, Antarctica. Inset shows a detailed view of the marine ice sampling sites close to Minna Bluff. Marine ice occurs in a zone of relatively darker ice at SMIS, which is separated from the lighter meteoric ice by a distinct boundary running parallel to shore (2–3.5 km from shore) (see Reference Fitzsimons, Mager, Frew, Clifford and WilsonFitzsimons and others, 2012, fig. 1).

Sampling and Data Analysis
In this section we describe the field site and give a summary of previous studies. We also detail marine ice extraction from the ice shelf and its laboratory analysis for water isotope and major ion composition. The frazil ice boundary-layer freezing model, which is used to compare theoretical and measured water isotope signals of marine ice, is explained below. Thin sectioning of marine ice and the classification of ice crystal morphology into different ice facies are also described.
Field site
SMIS is a small ice shelf (∼30 × 35 km2) in Antarctica confined by Minna Bluff to the south and Black and White Islands to the north (Fig. 1). It is separated from the much larger and two magnitudes faster-flowing Ross Ice Shelf by a rift zone (Fig. 1). SMIS flows slowly at a rate of 0.4–7.3 m a−1 in a west-southwesterly direction toward Minna Bluff in its southern parts and in a west-northwesterly direction in its northwestern parts (Reference CliffordClifford, 2005). The ice shelf floats on a water column of 300–400 m in its centre (Reference JohnstonJohnston and others, 2008). Ground-penetrating and airborne radar investigations have revealed that the ice shelf is thickest in the north (∼180 m) and thins (to ∼100 m) toward its eastern and southern margins (Reference SwithinbankSwithinbank, 1970; Reference CliffordClifford, 2005), where the radar signal becomes lost 5–6 km from shore. This was ascribed to outcropping of slightly saline marine ice at the snow-free ice-shelf surface close to the shore of Minna Bluff (Fig. 1) (Reference CliffordClifford, 2005). The presence of marine ice was also detected in previous studies on ice composition (Reference Kellogg, Kellogg and StuiverKellogg and others, 1991a; Reference Fitzsimons, Mager, Frew, Clifford and WilsonFitzsimons and others, 2012) and inferred from the presence of marine macrofossils at the ice-shelf surface (Reference DebenhamDebenham, 1919; Reference Gow, Weeks, Hendrickson and RowlandGow and others, 1965; Reference SwithinbankSwithinbank, 1970; Reference Kellogg, Kellogg, Stuiver and BentleyKellogg and others, 1990, Reference Kellogg, Kellogg and Stuiver1991b; Reference Fitzsimons, Mager, Frew, Clifford and WilsonFitzsimons and others, 2012). Two of these shells were radiocarbon-dated to 1230 ± 50 and 2850 ± 30 radiocarbon years BP (Reference Kellogg, Kellogg, Stuiver and BentleyKellogg and others, 1990; Reference Denton and MarchantDenton and Marchant, 2000) using an Antarctic reservoir correction of 1300 years (Reference Berkman and FormanBerkman and Forman, 1996). However, their age does not necessarily reflect the date of marine ice accretion, since the time of death of the marine organisms is not necessarily related to their entrainment date (Reference FitzsimonsFitzsimons, 1997). Surfacing of marine ice, which was originally accreted at SMIS’s base, is speculated to be a result of stripping by katabatic winds (Reference CliffordClifford, 2005), as at the Hell’s Gate Ice Shelf (Reference Tison, Ronveaux and LorrainTison and others, 1993). Modelled wind fields indeed show elevated wind speeds over the southern part of SMIS (Reference Monaghan, Bromwich, Powers and ManningMonaghan and others, 2005). Local summer surface melting also contributes to the observed negative surface mass balance (>0.10 m; Reference CliffordClifford, 2005) in the snow-free band running parallel to Minna Bluff (Fig. 1). Melting is likely partially induced by the locally high debris concentration on the ice-shelf surface close to Minna Bluff (Reference Denton and MarchantDenton and Marchant, 2000) and the lower surface albedo of the darker marine ice (Reference Warren, Roesler and BrandtWarren and others, 1997). Surface meltwater pools in several ice-shelf surface lakes (Reference CliffordClifford, 2005), which are often elongated and oriented at right angles to shore (Fig. 2) parallel to the prevailing wind direction (Reference SwithinbankSwithinbank, 1970). These lakes were observed to form in summer, while the rest of the year they were frozen over into ‘mirror-smooth’ surfaces of ice (Reference SwithinbankSwithinbank, 1970). The lakes are estimated to be ∼1m deep, similar to lakes observed on other ice shelves (e.g. Reference Banwell, Caballero, Arnold, Glasser, Mac Cathles and MacAyealBanwell and others, 2014), several tens to hundreds of metres wide and up to 1–2 km long. Some lakes were observed to drain completely during the course of the melt season.
Marine ice exposed at the ice-shelf surface of SMIS. Photograph was taken in November from Minna Bluff, looking northeast. The Hagglunds vehicle is 7 m long and parked on an ice ridge ∼6 m high. Meltwater was observed to pool in elongated ponds between the ridges in December 2010. (Photo: Michael Hambrey.)

Ice sampling in the field
Marine ice was extracted in shallow cores from the apex of snow-free ∼6m high ice ridges that separate surficial lakes and are oriented at right angles to shore, almost in a perfect north–south direction (Fig. 2). Cores were taken in November 2010 with a Kovacs corer, and in December 2007 with a custom-made SIPRE-type coring auger. The extracted three ice cores (C5, C9 and C15; Fig. 1) were 2.71 ± 0.01 m, 3.04 ± 0.01 m and 9.49 ± 0.01 m long. The freeboard level was not reached during ice-core extraction since the ice shelf is ≥100 m thick (Reference CliffordClifford, 2005). The top 0.50 ± 0.01 m of every core was discarded to avoid the influence of potential surface melt (Reference Tison, Ronveaux and LorrainTison and others, 1993). Ice cores were immediately put in a freezer and kept below −15°C during transport and storage.
Solutes and water isotopes
Ice cores were cut into 0.10 ± 0.001 m sections along the length of the cores and a 0.0075 ± 0.0025 m thick outside rim of the ice cores was cut off to avoid contamination. Subsequently the samples were allowed to melt in closed plastic containers at room temperature. Water samples were filtered under vacuum using MF-Millipore 0.45 μm membrane cellulose acetate and cellulose nitrate filters. The samples were analysed using a Dionex ICS-3000 ion chromatograph to determine the concentration of major cations and anions (Li+, Na+, Mg2+, K+, Ca2+, NH4+ and Cl−, NO2−, Br−, NO3 2−, SO4 2−). A carbonate removal device (CRD-200) was installed to remove the carbonate peak. Precision and accuracy of cation and anion concentrations are better than 5%. The sum of all cations and anions gives the total dissolved solids (TDS), which are quoted in parts per thousand (‰) to allow for easy comparison with salinity measurements of other studies. Ions were measured in mg L−1 and are quoted with respect to Standard Mean Ocean Water (SMOW) ion ratios according to Reference MausMaus and others (2011) (e.g. ΔMg/Cl = (Mg/Cl − (Mg/Cl)SMOW)/(Mg/Cl)SMOW), in which the SMOW ratios were taken from Reference Millero, Feistel, Wright and McDougallMillero and others (2008). Since individual frazil ice crystals are thought to expel all salt during their formation (Reference Tison, Khazendar and RoulinTison and others, 2001), salt could only be included in the pore spaces of the agglomeration or at grain boundaries. Reference Tison, Ronveaux and LorrainTison and others (1993) suggest that ion fractionation in marine ice is further evidence of the presence of sea-water filled pores, which consolidate slowly, allowing for the selective incorporation of ions. Previous studies have interpreted variations in ion ratios to result from changes in the consolidation rate of marine ice (Reference OerterOerter and others, 1992; Reference Tison, Ronveaux and LorrainTison and others, 1993; Reference Moore, Reid and KipfstuhlMoore and others, 1994).
The relative concentration of oxygen and deuterium isotopes (δ18O and δD) was measured with a Picarro laser spectrometer relative to SMOW (e.g. δ18O = ((18O/16O − (18O/16O)SMOW/(18O/16O)SMOW × 1000). The samples were repeat-injected eight times whereby the first three injections from one sample were discarded due to carry-over from previous samples. The measurement precision was 0.07‰ for δ18O and 0.40‰ for δD. In order to establish whether marine ice at SMIS was formed from a constant or a changing mixed water source, the regression slope of co-isotopic plots of δ18O and δD was established and compared to co-isotopic freezing slopes (Reference Souchez and JouzelSouchez and Jouzel, 1984) and mixing slopes (Reference Souchez and GrooteSouchez and Groote, 1985) models. Regression slopes in mixing models are ∼8 (Reference Souchez and GrooteSouchez and Groote, 1985), whereas freezing models have smaller slopes (Reference Souchez and JouzelSouchez and Jouzel, 1984) whereby the exact slope magnitude depends on the isotopic composition of the water source. Data trends and interrelations are assessed with the Pearson’s product-moment correlation coefficient and are expressed in terms of r. All r values quoted in this paper are significant at the 99% level.
Ice crystal facies
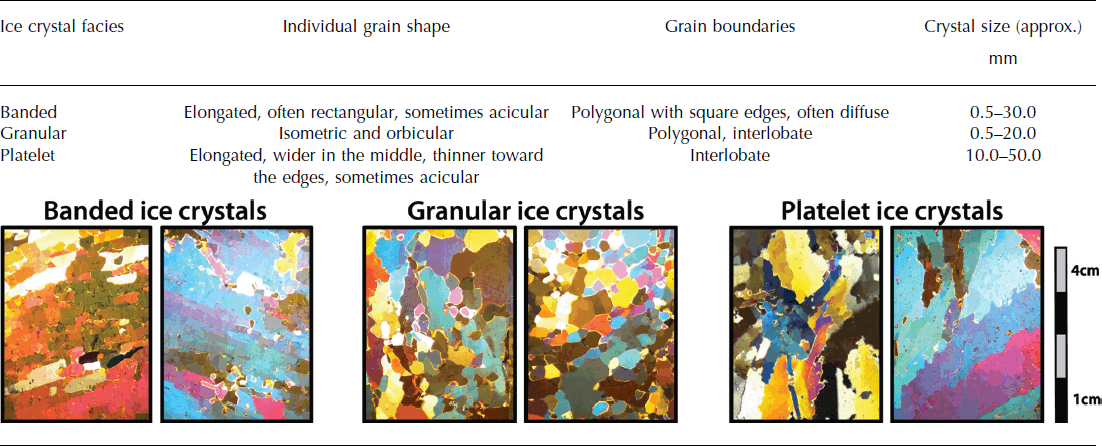
Thin sections of ice were prepared according to the method detailed by Reference Durand, Gagliardini, Thorsteinsson, Svensson, Kipfstuhl and Dahl-JensenDurand and others (2006) vertically along the full length of the ice cores to a thickness of ∼0.5 × 10⁻³ m using a conventional biological microtome in a cold room maintained at −15°C. Thin sections were photographed between cross-polarized light, and ice crystals were classified into different ice facies (granular, banded and platelet) based on their shape (Table 2) for every 0.10 m down-core coinciding with the sampling for the ice chemistry. Where 30–70 % of both banded and granular ice crystals were present in a 0.10 m long section of thin sections, the ice facies were classified as a mixed ice facies. On the rare occasions when the ice crystal morphology did not fit any of the descriptions, they were logged as ‘other’. Ice crystal morphology, as apparent in thin section, is analysed in conjunction with ice chemistry in order to determine whether variations in marine ice source water lead to changes in the appearance of marine ice crystals.
Criteria for the classification of ice crystal facies with examples
Freezing model for frazil ice crystals
The isotopic source water composition for marine ice predominantly formed by frazil ice crystals can be derived by applying a modelled effective fractionation coefficient (eff) to the measured isotopic concentration of the ice. This coefficient was calculated using Tison and others’ (2001) boundary layer freezing model for individual marine ice frazil ice crystals. The model is based upon Burton and others’ (1953) boundary layer model originally developed for simulating solute diffusion into a liquid boundary layer during the solidification of metal:

where the effective fractionation coefficient (α eff; unitless) is calculated from the equilibrium fractionation coefficient (α equ; unitless) as a function of the growth rate (v; ms−1), diffusion coefficient (D; m2 s−1) and boundary layer thickness (z bl; m). The isotopic concentration (c; unitless) in the boundary layer near the ice/water interface hereby changes over time (t; s) according to Fick’s law (Reference Burton, Prim and SlichterBurton and others, 1953; Eicken, 1998):

where z is the distance from the ice/water interface into the fluid (m) and V is the freezing velocity of the ice front (m s−1). The model is run with a Crank–Nicolson scheme to allow for simultaneous diffusion and fractionation during the advancement of a freezing front. In the model, water is frozen from a semi-infinite reservoir (basically assuming an open system). Reference Tison, Khazendar and RoulinTison and others (2001) used a simple rod geometry for frazil ice crystals, with a diameter of 1.0 × 10⁻³ m and a boundary layer thickness of half the crystal size (0.5 × 10⁻³ m) (Reference DalyDaly, 1984). Equilibrium fractionation coefficients were taken from Lehmann and Siegenthaler (1981) (α D = 1.0212 and α 18O =1.00291), and diffusion coefficients from Reference Ferrick, Calkins, Perron, Cragin and KendallFerrick and others (2002) (1.06 × 10⁻⁹ m2 s−1 for 1HD18O and 1.21 × 10⁻⁹ m2 s−1 for 1H2 18O) scaled to 0°C with the Stokes–Einstein equation from Eicken (1998). Frazil ice crystals form in episodic bursts (Reference Smith, Langhorne, Frew, Vennell and HaskellSmith and others, 2012). Their freezing velocities were taken from Reference Tison, Khazendar and RoulinTison and others (2001) (10−6 m s−1 and 2.7 × 10⁻⁶ m s−1) and Reference Smith, Langhorne, Frew, Vennell and HaskellSmith and others (2012) (0.3 × 10⁻⁶ m s−1 to 1.4 × 10⁻⁶ m s−1). Since the freezing speed (removing heavy isotopes from the liquid) is greater than the diffusion coefficient (replenishing the boundary layer with heavy isotopes), a temporary amplified depletion of heavy isotopes in the boundary layer occurs – the initial transient (Reference Tison, Khazendar and RoulinTison and others, 2001) – before the isotopic concentration equals steady state. This effect is taken into account by the model since it could be especially significant in the growth of small ice crystals (mm size). Lack of empirical data on frazil ice crystal isotopic composition makes it impossible to validate the model and quantify the error. However, the frazil ice boundary-layer freezing model is very sensitive to the assumed boundary layer thickness, which in turn depends on the crystal size. Observed frazil ice crystal sizes vary between 0.035 × 10⁻³ m and 4.5 × 10⁻³ m (Reference Morse and RichardMorse and Richard, 2009). Since the size class distribution of marine ice frazil ice crystals is still poorly known (e.g. Reference Galton-Fenzi, Hunter, Coleman, Marsland and WarnerGalton-Fenzi and others, 2012), this model focuses on the typical size chosen by Reference Tison, Khazendar and RoulinTison and others (2001).
In this study, the model is run for two scenarios: marine ice formation from (1) frazil ice crystals only and (2) frazil ice crystals with an estimated 15% pore space on average, similar to the average pore space Reference Tison, Khazendar and RoulinTison and others (2001) calculated for the Ronne Ice Shelf (Reference OerterOerter and others, 1992) based on heat conduction and accumulation rate. The pore water is taken as pure sea water fractionating at equilibrium. Even though it remains unknown whether pore water would be merely trapped between frazil ice crystals or fractionate upon freezing to become solid marine ice, similar to river and lake ice (Reference Ferrick, Calkins, Perron, Cragin and KendallFerrick and others, 2002), the modelled effective fractionation coefficient would decrease slightly if the pore water was not fractionating (by 0.44‰ for α 18O and by 3.18‰ for α D for marine ice with 15% sea-water-filled pores). Previous efforts to model boundary-layer freezing of marine or sea ice have focused on the oxygen isotope and salinity signal (Eicken, 1998; Reference Tison, Khazendar and RoulinTison and others, 2001). However, the reasons for variations in marine ice salinity are poorly understood (Reference Tison, Khazendar and RoulinTison and others, 2001). Even though δD is not an independent tracer, this study models the composition of both water isotopes in marine ice to allow for comparison with the measured co-isotopic signal.
Results
In this section we first present the occurrence of banded, granular and mixed ice facies in marine ice from all three SMIS sites. Secondly, the variation of the δ18O and δD ratios in all marine ice cores is described and co-isotopic relationships are given. Subsequently, the calculated effective isotopic fractionation coefficients, which help to determine theoretical marine ice source water composition, are presented for different freezing speeds. Finally, we give marine ice salinity (TDS) and ion ratios (ΔMg/Cl and ΔK/Mg) indicating ion fractionation during freezing of marine ice pores.
Ice crystal facies of marine ice
The marine ice cores are almost entirely made up of banded and granular ice facies, including a mixed ice facies of these two crystal types that occurs in all three ice cores (Table 3; Figs 3–5). Ice core C15 shows a high percentage of both pure granular (32%) and pure banded ice crystals (24%) (Fig. 5; Table 3). The two shorter ice cores (C5 and C9), however, show an exclusive preference for either pure banded ice crystals (45%) in the case of C5 (Fig. 3; Table 3) or pure granular ice crystals (58%) in the case of C9 (Fig. 4; Table 3). Platelet ice facies are uncommon in marine ice at SMIS and make up <10% of the ice facies in C15 (Fig. 5; Table 3).
Marine ice crystal facies, δ18O, salinity (TDS) and ΔMg/Cl ion ratio for core C5.

Marine ice crystal facies, δ18O, salinity (TDS) and ΔMg/Cl ion ratio for core C9. Legend in Figure 3.

Marine ice crystal facies, δ18O, salinity (TDS) and ΔMg/Cl ion ratio for core C15. Legend in Figure 3.

Average marine ice chemical composition and occurrence of ice crystal facies (bd: banded; gr: granular; mx: mixed; pl: platelet; oth: other), in each SMIS marine ice core

Isotopic composition of marine ice
Isotopic values in all the ice cores range from −0.43‰ to 2.29‰ δ18O and −3.80‰ to 17.61‰ δD (Figs 3–6). The isotopic range increases with total core length (Figs 3–5); in the shallowest core, C5 (2.65 m long), the δ18O range is 1.06‰, while δ18O ranges are 1.50‰ in C9 (3.04 m long) and 2.40‰ in the longest ice core, C15 (9.44 m long). In the two shallower cores C5 and C9 (Table 3), collected close to each other (Fig. 1), the data are on average more enriched in heavy isotopes (>1.6‰ δ18O) than in core C15 (0.47‰ δ18O) (Table 3). In C9 and C15 the δ18O signal shows a linear trend with depth, although the trend is positive in C9 (r = 0.86; Fig. 4) and negative in C15 (r = −0.59; Fig. 5). The δ18O and δD signals are significantly correlated in all cores (r > 0.93), with an overall slope of 8.68 ± 0.13 (r = 0.97) in a co-isotopic plot (Fig. 6). Furthermore, all marine ice samples at SMIS are enriched in heavy isotopes with respect to sea water and there is a wide overlapping range of isotope values for the different ice facies (Fig. 6).
Co-isotopic diagram for marine ice samples classified by ice facies from all SMIS sampling sites, plotted together with local sea water (taken as Shallow Ice Shelf Water from below the Ross Ice Shelf (Reference Jacobs, Fairbanks, Horibe and JacobsJacobs and others, 1985; Reference Fitzsimons, Mager, Frew, Clifford and WilsonFitzsimons and others, 2012)). The slope for the linear regression for isotopic data from all ice cores together is 8.68 ± 0.13 (r = 0.97). Individually data from C15 have a slope of 7.92 ± 0.17 (r = 0.98), from C9 have a slope of 7.69 ± 0.29 (r = 0.99) and from C5 have a slope of 5.26 ± 0.48 (r = 0.93).

Effective fractionation coefficients
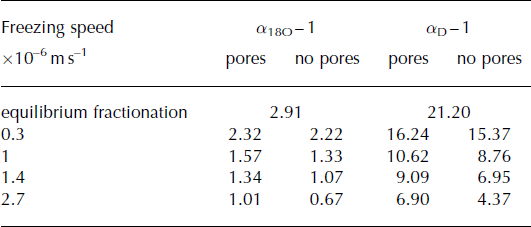
Calculating the effective fractionation coefficients for frazil ice crystals using Tison and others’ (2001) model at variable freezing speeds shows that a change in freezing speed can theoretically cause an isotopic range of ≤1.55‰ δ18O (Table 4; Fig. 7a). This range becomes slightly smaller when pores that fractionate at equilibrium are considered (Table 4; Fig. 7b). In either case the calculated effective fractionation coefficient for oxygen isotopes is at least 0.60‰ lower than the equilibrium fractionation coefficient (Table 4).
δ18O and δD composition of measured marine ice samples plotted together with the calculated δ18O and δD composition of marine ice applying Tison and others’ (2001) effective fractionation coefficients to a pure sea-water source (dark grey line) or a mixed water source of sea water and melted meteoric ice (4%: black line) or marine ice (40%: light grey line) using a range of different freezing rates. The triangles within the grey shaded lines denote calculated marine ice isotopic compositions generated at different freezing rates (2.7 × 10⁻⁶ m s−1, 1 × 10⁻⁶ m s−1 and 0.3 × 10⁻⁶ m s−1), whereby marine ice formed at a faster freezing rate remains isotopically more similar to the source water. Meteoric ice is taken as the average isotopic composition of meteoric ice samples collected from the surface of SMIS (−30.00‰ δ18O and −238.27‰ δD; n = 22) and marine ice is defined as the measured average isotopic composition of samples from the isotopically most enriched ice core C5. (a) assumes 100% frazil ice crystals; (b) assumes 85% frazil ice crystals and 15% pores frozen from pure sea water at equilibrium fractionation.

Calculated effective fractionation coefficients (quoted as ice–water fractionation constants in ‰, i.e. α − 1) using Tison and others’ (2001) boundary layer freezing model considering different frazil ice freezing speeds (taken from Reference Tison, Khazendar and RoulinTison and others, 2001; Reference Smith, Langhorne, Frew, Vennell and HaskellSmith and others, 2012). Two different scenarios are considered: marine ice formation from frazil ice crystals only (‘no pores’) and marine ice formation from 85% frazil ice crystals with 15% of pure sea water consolidating at equilibrium freezing speed in the remaining pore spaces (‘pores’)
Salinity and ion ratios of marine ice
Marine ice collected from SMIS is slightly saline (0.03–1.01‰ TDS; Figs 3–5), with an average of 0.25‰ TDS. Similar to the isotope record, the TDS record increases significantly with depth in C9 (r = 0.83) and decreases with depth in C15 (r = 0.48). Indeed, TDS and the oxygen isotope record are significantly positively correlated in C9 and C15 (r > 0.54). However, in C5 there is no significant linear relationship between isotopes and TDS. Samples of banded and granular ice facies occur within the whole range of measured salinities and isotopic compositions (Fig. 8a). Nonetheless, there is an apparent difference in the mean isotopic composition and salinity of different ice facies in C15; banded ice facies are more isotopically enriched and more saline than granular and mixed ice facies (Fig. 8b). Similarly, the granular ice facies in C9 are less saline than the mixed ice facies (Fig. 8b). However, there is no significant difference between the chemical compositions of different ice facies; the standard deviations of mean chemical composition for different ice facies overlap (Fig. 8b).
Total dissolved solids (TDS) and oxygen isotopes (δ18O) for the different ice crystal facies in the individual ice cores. (a) Individual samples from all cores; (b) averages for all cores ± one standard deviation. Note: same key for both diagrams.

The marine ice at SMIS is depleted in ΔMg/Cl and enriched in ΔK/Mg (Table 3). Increases in the ΔMg/Cl signal coincide with increases in the TDS record in all cores (e.g. increase of ∼0.20‰ TDS and ∼0.30 ΔMg/Cl at 2.5 m in C9; Fig. 4). The ΔMg/Cl and TDS signal in C5 and C9 are positively correlated (r > 0.64). No significant relationship, however, exists between the ΔMg/Cl ratio and TDS in C15.
Discussion
Here we first present the evidence for marine ice formation from frazil ice crystals that nucleate in supercooled water. Applying Tison and others’ (2001) boundary layer freezing model, the isotopic composition of the marine ice water source is calculated using effective fractionation coefficients. Subsequently, we evaluate the evidence for marine ice formation from a changing mixed water source rather than a constant water source with a changing freezing rate. Finally, we discuss the possible geographic origin of the relatively fresher water needed in the frazil ice formation process and what this implies with regard to marine ice formation mechanisms.
Marine ice formation from frazil ice crystals
The presence of predominantly banded and granular ice facies (Table 1) in marine ice at SMIS strongly suggests that this marine ice was formed from predominantly frazil ice crystals (e.g. Reference Tison, Ronveaux and LorrainTison and others, 1993; Reference Treverrow, Warner, Budd and CravenTreverrow and others, 2010) which nucleate from supercooled water. Marine ice formation solely from the advancement of a freezing front and associated formation of columnar ice crystals (e.g. Reference Zotikov, Zagorodnov and RaikovskyZotikov and others, 1980) is indeed rare (Table 1) and no columnar ice crystal facies have been observed in thin sections from SMIS. Further evidence for SMIS frazil ice formation from supercooled water is provided by a higher δD/δ18O ratio in marine ice from C5 and C9 than is predicted by the output of Tison and others’ (2001) source model (Fig. 7a and b). This enrichment in δD could result from an enhanced diffusivity of deuterium in saline waters (Reference HoritaHorita, 2009) together with a fast freezing speed, which is thought to amplify kinetic effects (Reference Souchez, Jouzel, Lorrain, Sleewaegen, Stievenard and VerbekeSouchez and others, 2000). This is in keeping with Reference SouchezSouchez and others (1995), who suggested using a 2‰ higher equilibrium fractionation coefficient to explain the higher enrichment of δD in marine ice.
Marine ice might not be made up of frazil ice crystals alone since these generally expel all salt during their formation (Reference Tison, Ronveaux and LorrainTison and others, 1993) and SMIS marine ice is slightly saline (Table 2). Ion fractionation in SMIS marine ice samples (depletion in ΔMg/Cl and enrichment in ΔK/Mg; Table 3) also suggests the presence of sea water in pore spaces between frazil ice crystals. Nonetheless it is difficult to estimate the percentage of sea-water filled pores from its chemistry since marine ice pore water salinity and desalination processes are poorly understood. No brine channels have ever been observed in marine ice, and evidence of brine pockets was only found in the lower tens of metres of the ∼200 m thick marine ice layer (which is still in hydraulic connection with the ocean) at the Amery Ice Shelf (Reference CravenCraven and others, 2004; Reference Treverrow, Warner, Budd and CravenTreverrow and others, 2010).
Isotopic evidence of a changing water source
Whether marine ice was formed from pure frazil ice crystals only or from a combination of frazil ice crystals and frozen pore water, the isotopic record of marine ice predominantly reflects the source water composition of frazil ice crystals. The measured isotopic range and co-isotopic slope of all SMIS marine ice samples indicate frazil ice formation from a mixed water source that changes over time. Even though the measured δ18O range for samples from all ice cores at SMIS (2.71‰ δ18O and 21.41‰ δD; Fig. 6) is similar to the theoretical maximum isotopic shift at equilibrium fractionation from a constant water source (Table 4), results obtained by applying Tison and others’ (2001) boundary layer freezing model indicate that the isotopic composition of marine ice should only vary by ≤1.55‰ δ18O and ≤11.00‰ δD considering a range of measured freezing rates for frazil ice crystals and a constant water source (no pore water; Fig. 7a; Table 4). If pores filled with sea water that fractionates upon consolidation are present, the isotopic range of marine ice formed at variable typical freezing speeds will be even smaller (1.31‰ δ18O and 9.34‰ δD) (15% pore water; Fig. 7b; Table 4). Hence, the measured isotopic range of marine ice samples at SMIS indicates a source water composition that is likely not constant over time and in space, assuming an open reservoir in the ice-shelf cavity. This idea is further supported by a high co-isotopic regression slope of 8.68 ± 0.13 (r = 0.97) (Fig. 6), which is steeper than a freezing slope (i.e. water formed from the same water source with a variable freezing speed) in an open or closed system (Reference Jouzel and SouchezJouzel and Souchez, 1982; Reference Souchez and JouzelSouchez and Jouzel, 1984). However, since frazil ice crystals form in a water plume in the ice-shelf cavity, closed system freezing is precluded. Nonetheless, the highest possible freezing slope in an open system is theoretically only 7.38, applying Souchez and Jouzel’s (1984) freezing model to a water source of pure sea water taken as Shallow Ice Shelf Water (SISW) below the Ross Ice Shelf (Reference Jacobs, Fairbanks, Horibe and JacobsJacobs and others, 1985; Reference Fitzsimons, Mager, Frew, Clifford and WilsonFitzsimons and others, 2012). Freezing slopes of sea water with a constant contribution of melted meteoric ice would be even lower. Co-isotopic mixing slopes for ice formed from a changeable water source, however, would be higher, ∼8 (Reference Souchez and GrooteSouchez and Groote, 1985), which is more similar to the measured slope of all SMIS samples (Fig. 6).
For individual ice cores the isotopic range is smaller and co-isotopic slopes are shallower (Fig. 6). While the co-isotopic slope of 7.92 ± 0.17 in C15 with an isotopic range of 2.4‰ δ18O remains similar to a mixing slope, the two shallower ice cores C5 and C9 have a slope ≤7.69 with a smaller isotopic range (≤1.50‰ δ18O). This could suggest that the source water was similar during accretion events amounting to ∼3m of marine ice at the core sites of the shallower ice cores, extracted close to each other (Fig. 1), while the source water composition at the C15 site could have changed over the course of accreting ∼9.5 m of marine ice due to the co-isotopic slope close to 8 and an isotopic range >1.55‰ δ18O. The low slope of 5.26 ± 0.48 in co-isotopic data from C5 is lower than a freezing slope, even if the source water was mainly glacial water derived from meteoric ice. The isotopic range of 1.06‰ δ18O with most samples clustering tightly around 1.5‰ δ18O (Fig. 6) might be too small to allow for a representative freezing or mixing slope.
Since there is some evidence that marine ice at SMIS partially formed from consolidation of sea-water filled pores, an increase in marine ice salinity is consistent with slower consolidation rates of frazil ice crystals. A significant correlation between the TDS and ΔMg/Cl signal in C5 and C9 could therefore suggest that sea-water filled pores consolidate more slowly (leading to higher ion fractionation) when salinity is high.
Source water composition
Since the crystallography provides evidence that marine ice is primarily composed of frazil ice crystals, which nucleate in supercooled water, the marine ice source water at SMIS is likely a mixture of local sea water and fresher and possibly warmer water. This combination of water masses supercools upon mixing (double diffusion mechanism) and/or adiabatic lifting (ice pump mechanism). The fresher-than-sea water could originate from melted meteoric ice (Reference SouchezSouchez and others, 1995, Reference Souchez, Khazendar, Ronveaux and Tison1998) and/or melted marine ice (Reference SouchezSouchez and others, 1991; Reference Tison, Ronveaux and LorrainTison and others, 1993).
Applying the calculated effective fractionation coefficients of Tison and others’ (1993) model (Table 4) to sea water suggests that marine ice at SMIS with an isotopic concentration ≥1.70‰ δ18O (Fig. 7b) could have formed from a water source with a component of recycled marine ice. The exact cut-off threshold depends on the calculated fractionation coefficient and the assumed sea-water composition. This study took SISW as measured below the Ross Ice Shelf (Reference Jacobs, Fairbanks, Horibe and JacobsJacobs and others, 1985; Reference Fitzsimons, Mager, Frew, Clifford and WilsonFitzsimons and others, 2012) as the ambient sea water, but it remains unknown whether the pure sea water below SMIS could be more enriched in heavy isotopes (by ∼0.30‰ δ18O). The idea of marine ice formation from a water source with a component of melted and relatively fresher recycled marine ice was first developed by Reference SouchezSouchez and others (1991) based on marine ice that was more enriched in heavy isotopes (up to 3.20‰ δ18O; Table 1) than could be explained by applying the equilibrium fractionation coefficient to sea water. However, equilibrium freezing during frazil ice formation is unlikely. Since the isotopic composition of marine ice in C5 and C9 is, on average, ∼2‰ more enriched in δ18O than sea water, a high contribution of recycled marine ice (∼40% dependent on freezing speed) to the source water is necessary to explain all the observed enriched marine ice samples (Fig. 7a and b). The exact percentage contribution of recycled marine ice, however, is difficult to determine, especially since marine ice can be repeat-recycled. Reference GoodwinGoodwin (1993) considered the possibility that δ18O marine ice samples, which are not as enriched as in Souchez and others’ (1991) study (i.e. only up to 1.56‰ δ18O; Table 1), could have formed from repeat recycling of previously formed marine ice.
Less enriched (≤1.70‰ δ18O) marine ice samples could have formed with a small contribution of glacial water derived from meteoric ice to the marine ice water source (especially in C15; Fig. 7a and b). Since meteoric ice is very depleted in heavy isotopes (−35‰ to −25‰ δ18O; Reference Kellogg, Kellogg and StuiverKellogg and others, 1991a,b), a small glacial water contribution to the source water (up to a maximum of 4%) is sufficient to explain the isotopic composition of some of the less isotopically enriched and isotopically depleted ice samples in C15 (Fig. 7a and b). Previous studies interpreted the presence of a mixing slope, together with a larger isotopic range (of up to 18.00‰ δ18O; Table 1) than observed at SMIS of isotopically depleted samples, as the result of a mixed water source of sea water and varying proportions of melted meteoric ice (Reference GoodwinGoodwin, 1993; Reference SouchezSouchez and others, 1995, Reference Souchez, Khazendar, Ronveaux and Tison1998). The marine ice source water for all sample sites at SMIS, however, could consist of a mixture of all three water sources – melted meteoric ice, melted marine ice and sea water – whereby melted meteoric ice would contribute least to the mixture (in the order of 5%) due to its high isotopic depletion.
There is no evidence that different crystal morphologies are the result of marine formation from different water sources and/or proportions of pore water. There is no significant difference in the chemistry of the most common ice crystal facies (Fig. 8a); the mean isotopic signature and salinity of banded ice crystals differs only slightly from that of granular ice facies in all cores in which the standard deviations overlap (Fig. 8b).
Processes of frazil ice formation at SMIS
Here we discuss geophysical scenarios that can lead to the formation of marine ice source water as identified through the ice chemistry in the previous subsection. One possible mechanism for marine ice formation at SMIS could be the ice pump, delivering fresh water of meteoric origin to the ice-shelf cavity. This process could explain marine ice formation at site C15 where the ice likely formed from a mixed water source dominated by glacial and sea water (Fig. 7a and b). Indeed, there is a thermohaline circulation driven by either HSSW or modified Circumpolar Deep Water (mCDW) in the cavity of the adjacent Ross Ice Shelf (Reference Dinniman, Klinck and SmithDinniman and others, 2007). Ocean circulation models reveal that there is an amplified basal melt rate at the eastern margin of the Ross Ice Shelf that extends from the Ross Ice Shelf margin south past Minna Bluff (Reference Dinniman, Klinck and SmithDinniman and others, 2007; Reference Timmermann, Wang and HellmerTimmermann and others, 2012). A buoyant plume of meteoric meltwater and sea water generated below the Ross Ice Shelf could enter the ice-shelf cavity of the ∼300 m thinner SMIS, similar to the vertical ascent of a water plume from below the Ross Ice Shelf to the cavity of the northern McMurdo Ice Shelf (Reference Robinson, Williams, Stevens, Langhorne and HaskellRobinson and others, 2014). Here the water in the plume would supercool due to a change in the pressure-dependent freezing point in shallower waters, and frazil ice crystals would nucleate. Potentially this water plume could also reach the ocean floor of the much shallower SMIS cavity with a maximum depth of ∼400 m (Reference JohnstonJohnston and others, 2008), forming anchor ice as suggested in a modelling effort by Reference Leonard, Mager, Pauling, Hughes and SmithLeonard and others (2014). However, marine ice below the Ross Ice Shelf accumulates only in a thin layer (Reference Zotikov, Zagorodnov and RaikovskyZotikov and others, 1980; Reference Timmermann, Wang and HellmerTimmermann and others, 2012). Hence the ice pump mechanism might be not very strong in the Ross Ice Shelf cavity. Also, this ice pump would only explain the delivery of fresh water of meteoric origin into the SMIS cavity and not the recycling of marine ice.
A proportion of marine ice at SMIS shows an apparent fractionation in water isotopes that exceeds the modelled effective fractionation for freezing of frazil ice crystals from a pure sea-water source. After Reference SouchezSouchez and others (1991) and Reference Tison, Ronveaux and LorrainTison and others (1993), marine ice could be recycled in a mechanism where a shallow thermohaline or tidal circulation melts the older marine ice at depth, which then becomes supercooled upon rising to shallower waters where frazil ice crystals nucleate. However, it is unlikely that a shallow tidal circulation would reach the SMIS cavity, which is sheltered by Black and White Islands and is several tens of kilometres from the open ocean (Fig. 1).
Alternatively, marine ice at SMIS could be recycled through melting of exposed marine ice at the ice-shelf surface which would then be routed to the ice-shelf base through tide cracks. Indeed, surface melt at SMIS was observed to temporarily pool in elongated lakes between ridges of exposed marine ice during the summers of 2007 and 2010. In Figure 2 such lakes occur between the clearly distinguishable ice ridges but are frozen since the picture was taken at the start of the season. Also, a tide crack was observed to run parallel to Minna Bluff in the marine ice zone close to shore, where the ice shelf becomes regrounded. Salt deposits along the tide crack indicate that it actively connects the ice-shelf base with the ice-shelf surface. As surface meltwater would drain through the tide crack, it could become supercooled in a double-diffusion mechanism of heat and salt with the ambient sea water, whereby frazil ice crystals would nucleate. For this process to occur, both water masses, the sea water at the ice-shelf base and the recycled marine ice, need to be at their salinity-dependent freezing point and would become mixed due to local turbulence (Reference McPhee, Skogseth, Nilsen and SmedsrudMcPhee and others, 2013). Hence, the surface meltwater would need to be cooled during percolation. In this process some refreezing could occur. Indeed, solute chemistry and ice facies of the ∼9.5 m long ice core C15 show evidence of local refreezing. Between 6.8 and 7.2 m depth, for example, the marine ice salinity increases by almost an order of magnitude and the ice facies are predominantly large platelet-type crystals (Fig. 5). Similarly, platelet ice facies are present between 0.5 and 1.8 m depth together with several peaks in salinity (Fig. 5). This could be a result of surface meltwater refreezing at depth.
Recycling of ice melted at the ice-shelf surface, however, is not necessarily limited to marine ice. Water from the nearby glaciers and snowpatches on Minna Bluff close to the shore of the ice shelf (Fig. 1) could find its way into the tide cracks of SMIS and hence to the ice-shelf base. This process would be an alternative explanation for the small contribution of glacial water to the source water at SMIS, especially at site C15 (Fig. 7a and b). Recycling surface meltwater in the process of marine ice formation would imply that the ice shelf could be sustaining itself to some extent, with most of the marine ice forming during the melt season in summer. If surface ablation and local accumulation of marine ice were in equilibrium (e.g. Reference Kellogg, Kellogg, Stuiver and BentleyKellogg and others, 1990) their rates would both be in the order of ∼0.1 m a−1, as the measured surface ablation on SMIS (Reference CliffordClifford, 2005). Hence, the surface ice of the ∼100 m thick SMIS would be ∼1000 years old, similar to the youngest radiocarbon date of 1230 ± 50 years BP (Reference Denton and MarchantDenton and Marchant, 2000).
Instead of recycling marine ice from the ice-shelf surface, Reference McPhee, Skogseth, Nilsen and SmedsrudMcPhee and others (2013) suggests that loose frazil ice crystals could also be recycled in ocean turbulence before they consolidate. In this process, frazil ice crystals would be moved to deeper waters where they melt due to the pressure dependence of the freezing point. Upon rising of the resulting more buoyant meltwater plume, frazil crystals would renucleate (Reference McPhee, Skogseth, Nilsen and SmedsrudMcPhee and others, 2013). If recycling of surface meltwater or loose frazil crystals occurs below SMIS, turbulence must occur at the ice-shelf base to allow for vertical mixing. In the absence of a thermohaline and tidal circulation, it still remains to be determined how this vertical turbulence would be initiated.
There is little evidence that suggests different marine ice formation processes lead to different ice crystal facies at SMIS. Banded ice crystals are slightly more enriched in heavy isotopes and saline than the granular ice facies, especially in samples from C15 (Fig. 8a and b), but this difference is not statistically significant. Reference Tison, Ronveaux and LorrainTison and others (1993) found a similarly weak chemical difference between the two ice facies but suggested that banded ice facies were generated by frazil ice crystals that aligned in a sub-ice-shelf current, whereas granular ice crystal facies were thought to result from fast frazil ice formation in a deeper thermohaline circulation further inland. In contrast, Reference Treverrow, Warner, Budd and CravenTreverrow and others (2010) found that banded ice crystal facies merely occurred in younger marine ice than granular ice crystals. This would suggest a change in crystal morphology over time. Indeed, ice deformation experiments showed that due to post-depositional ice growth and recrystallization processes associated with ice flow, the original ice crystal morphology is often altered (Reference Wilson, Peternell, Piazolo and LuzinWilson and others, 2014) and predominantly granular/less elongated ice crystals develop in marine ice (Reference Dierckx, Peternell, Schroeder and TisonDierckx and others, 2014).
Conclusion
The aims of this study were to determine the composition and origin of water masses of marine ice at SMIS. We have focused our analysis on the crystal morphology and the chemistry of the ice and used a boundary layer freezing model to derive the source water composition. The specific conclusions are:
SMIS marine ice was mainly formed by frazil ice crystals since the ice is almost entirely composed of granular and banded ice crystal facies.
The source water composition of SMIS marine ice is not constant but changes spatio-temporally. This is indicated by a co-isotopic mixing slope of ∼8 and an isotopic range of 2.71‰ δ18O and 21.41‰ δD for all marine ice samples from all sites, which is almost double the isotopic range predicted by the boundary layer freezing model for marine frazil ice formed from a constant water source at different freezing speeds.
Marine ice samples, which are isotopically depleted compared to modelled marine frazil ice formed from pure sea water, have likely formed from a source water mixture of sea water and a relatively small proportion (∼4%) of melted meteoric ice. This isotopically depleted melted meteoric ice could have been vertically advected from the ice-shelf base of the adjacent ∼300 m thicker Ross Ice Shelf in an ice pump mechanism.
Marine ice samples, which are isotopically enriched compared to modelled marine frazil ice formed from pure sea water, have likely formed from a source water mixture of sea water and a large proportion (∼40%) of isotopically enriched melted marine ice. The exact percentage varies with freezing speed and the number of freeze–thaw–refreeze cycles. In a proposed recycling mechanism, marine ice, which is exposed at the ice-shelf surface, melts and drains through the tide crack to the ice-shelf base, where it becomes turbulently mixed with relatively colder and saltier sea water and frazil ice crystals nucleate in a double diffusion process. Thus, summer surface melt could make a substantial contribution to basal ice-shelf mass accretion particularly at the southern margin of SMIS.
Consequently we conclude that basal boundary conditions and the formation of marine ice at the relatively thin SMIS are at least partially determined by surface meltwater generation. The proposed mechanism of marine ice recycling thus ties together surface and basal processes, and could potentially slow ice-shelf disintegration.
Acknowledgements
We thank Antarctica New Zealand for excellent logistical support on SMIS. Sean Fitzsimons held a University of Otago Research Grant and Inka Koch was supported by a University of Otago Doctoral Scholarship. The New Zealand Royal Society Mobility Fund, the Antarctic Science Bursary and the University of Otago Polar Environments research theme provided financial support to establish collaboration with the Laboratoire de Glaciologie in Belgium. We thank Jono Conway, Nicolas Cullen, Michael Hambrey, Abigail Lovett, Martin Sharp, Simon Shelton and Nita Smith for help with the ice-core extraction in the field. For assistance with scientific instruments in the laboratory and cold room we are grateful to Julie Clark, Saïda El Amri, Marie Dierckx and Robert van Hale. We thank Eric Roulin for help in reviving the numerical code for the boundary layer freezing model of frazil ice crystals. Inga Smith and Sarah Mager made helpful suggestions on an earlier version of the manuscript. We thank three anonymous reviewers for comments which helped to improve the clarity of the paper.



