
INTRODUCTION
One of the most visible ways that the American legal system stands apart from other systems around the world is the use of elections to select and/or retain judges at the state level.Footnote 1 This article focuses on the initial selection of state supreme court justices in those states where the state constitutions or state statutes call for justices to be elected, “elected by the people” in the words of several state constitutions.Footnote 2 Specifically, it examines the actual initial selection of justices in those states, considering two broad questions: what percentage of justices are in fact initially elected and what factors can account for whether a justice was initially elected or initially appointed?
The phenomenon of judicial elections was largely a product of the mid-nineteenth century, when many states shifted from executive appointment (or legislative election) of judges to popular elections and new states chose to elect their judges. Shugerman (Reference Shugerman2012, 6) argues that the core reason for this shift was to increase the independence of judges from other political elites. Whether there was an increase in independence is unclear because leaders of political parties, including the very same governors who previously had made the appointments, largely continued to control the nomination process, at least until states adopted direct primaries or nonpartisan election of judges starting in the early twentieth century (Hall Reference Hall1984, 354).Footnote 3
A key issue that states using elections must deal with is how to fill midterm vacancies arising due to death, resignation, or retirement occurring during a justice’s term. The three possibilities are (1) leave the position open until the next regularly scheduled election, (2) hold a special election to fill the position, or (3) empower someone, usually the governor, to appoint someone to fill the position until either the next regularly scheduled election or the end of the departing justice’s term. Given the problems of leaving a vacancy unfilled for an extended period of time (e.g., the increased possibility of tie votes) and the cost of running a statewide special election, all states but one use appointments to fill midterm supreme court vacancies, some until the next regularly scheduled election and some for the remainder of the departing justice’s term; the one state currently using special elections is Louisiana, where state supreme court justices are elected by district rather than statewide. With some exceptions, discussed below, the appointee can then run to continue in the position when the subsequent election is held.
In 2017 the Brennan Center for Justice (BCJ) published a report highlighting the initial appointment of state supreme court justices serving as of August 2016 in the twenty-two states where the state constitution still specifies that justices are to be popularly elected (Berry and Lisk Reference Berry and Lisk2017).Footnote 4 According to the report, only 54.9 percent of the then-sitting justices in those states had been initially elected to their positions. Moreover, the authors reported that in three states—Georgia, Minnesota, and North Dakota—none of the sitting justices were initially elected (Berry and Lisk Reference Berry and Lisk2017, 1–2); in three other states—Pennsylvania,Footnote 5 Louisiana, and West Virginia—all of the sitting justices were elected. The authors also noted that “over one-third of justices who were initially appointed were unopposed in their first election, and 29 percent had never been opposed” (2). They argue that this constitutes a “disconnect in many states between the formal system of judicial selection and practice. If a state chooses to elect judges in order to forward certain goals, such as public accountability or democratic input, the regular use of interim appointments raises questions about whether its system is, in fact, serving these purposes” (2). Thus, the BCJ suggests important normative issues concerning how judges are initially selected.
Today, the purpose of electing judges is most frequently described as a method of enhancing accountability to the electorate (DeBow et al. Reference DeBow, Diane Brey, Soroko, Strickland and Wallace2002; Bonneau and Hall Reference Bonneau and Gann Hall2009, 2; O’Malley Reference O’Malley2010). However, the theory of political ambition (Schlesinger Reference Schlesinger1966) tells us that the key to accountability is retention in office, not initial selection to office. Following from this, there is a body of research providing evidence that state supreme court justices who must stand in some type of election to retain their seats may be more responsive to the political preferences of the voters on hot-button issues—such as criminal justice and abortion—than are justices who do not face the electorate (Brace and Boyea Reference Brace and Boyea2008; Shepherd Reference Shepherd2009; Canes-Wrone, Clark, and Park Reference Canes-Wrone, Clark and Park2012; Canes-Wrone, Clark, and Kelly Reference Canes-Wrone, Clark and Kelly2014). There appear to be little or no such effects on decisions regarding lower-salience issues (Canes-Wrone, Clark, and Semet Reference Canes-Wrone, Clark and Semet2018). There is also evidence that state supreme court justices who are retained through partisan or nonpartisan elections are more willing to overturn legislation (and to reverse precedents) than are judges who face reappointment rather than reelection (Lindquist Reference Lindquist2017). One can debate whether this type of accountability is what one wants in the courts, or what degree of accountability there should be, but accountability turns on retention rather than initial selection.
This does not mean that initial selection is unimportant because who is initially selected can affect court decisions, as is clearly demonstrated by research on decision making by federal judges who do not face a retention. However, this is not “accountability.” There is some evidence of a loyalty effect, with federal appointees more deferential to their appointers than even those appointed by other presidents of the same party (Howell Reference Howell2003, 136–74). Loyalty does have its limits, as demonstrated by Trump appointees’ decisions rejecting challenges to the 2020 presidential election. There is no similar research or evidence concerning loyalty effects among appointed state judges.
The initial selection process does have the potential to impact the legitimacy of the courts and the decisions they make. The evidence concerning the direct impact of the formal selection system on measures of legitimacy is mixed, with some research showing a difference between election and appointment and some showing no difference (Kritzer Reference Kritzer2015, 53–56; Nelson Reference Nelson and Chris2017). However, the method of initial selection could indirectly affect legitimacy through possible effects on demographic representativeness, what Pitkin (Reference Pitkin1967) labeled “descriptive representation.” Importantly, what is relevant here is not the formal system of selection but how the way judges are actually selected impacts descriptive representation and how that in turn affects the perceived legitimacy of the court and court decisions. There is evidence that descriptive representation has effects on legitimacy (Achury et al. forthcoming, but see Overby et al. Reference Overby2005; Scherer and Curry Reference Scherer and Curry2010; Scherer forthcoming). In my conclusion, I will consider how the actual mode of selection of supreme court judges in a state impacts descriptive representation.
Although my motivation for the analysis presented in the following pages is primarily empirical, I will return to the normative issues related to methods of judicial selection in my conclusion. My central focus is on what accounts for the extreme variation across the states with elected supreme courts regarding whether justices are initially elected or initially appointed to fill midterm vacancies. To that end, I consider a seventy-five-year period, 1946–2020. Unlike the BCJ study, I omit from my analysis two states, Louisiana and Arkansas, where appointees are barred by law from running in the subsequent election, as well as appointees in three other states for certain periods of time where, for various reasons, appointees either chose not to run (Pennsylvania, 1975–2014) or were appointed in a system where the formal selection system made initial appointment the norm (Utah, 1968–1984; New Mexico, post-1988). I discuss these omissions in more detail in the data section of this article.
Because there have been important political and structural changes over the seventy-five-year period that potentially affect how state supreme court justices initially come to their positions on elected courts, the first part of my empirical analysis examines whether there has been a significant shift between initial appointment and initial election over the seventy-five-year period. There have been two major political changes. The first is the demise of the one-party Democratic South with the Republican Party becoming dominant in statewide politics in most of those formerly Democratic states. The second change has been the general polarization of politics in the United States, which is also evident in state supreme court elections. Since at least 1980, state supreme court elections of all types—partisan, semi-partisan (nomination by party processes but nonpartisan general elections), nonpartisan, and retention—have become more partisan with the increase most striking in states using ostensibly nonpartisan elections (see Kritzer Reference Kritzer2015, 179–200; Kritzer Reference Kritzer2018, 412–14; Weinschenk et al. Reference Weinschenk, Mandi Baker, Vanessa Depies, Quinne Herolt, Cameron Makurat, Clarice Martell, Bradley Riddle, Tauferner and Zilliox2020; Kritzer Reference Kritzer2021–22).
There have also been two noteworthy structural changes, one major and one minor, that have implications for whether new judges will be initially appointed or elected. The major change has been to the formal selection systems and has been largely a shift away from partisan elections to nonpartisan elections, Missouri Plan systems,Footnote 6 or in one state—New York—gubernatorial appointment.Footnote 7 Of the thirty-six states that used some type of popular election for initial selection of their supreme court justices as of 1946, twenty-two states had by 2020 changed their systems, several more than once so that by 2020, only twenty-two states continued to use popular elections in some way for the initial selection of justices; the decline was particularly strong regarding partisan elections, dropping from twenty-one states to only six as of 2020.Footnote 8 These changes are important because prior research that considered the frequency of initial election in states with elected supreme courts found that the likelihood of initial election was greater in partisan election states than in nonpartisan states (Herndon Reference Herndon1962, 63–66; Atkins and Glick Reference Atkins and Glick1974, 447; Flango and Ducat Reference Flango and Ducat1979, 27–28; Dubois Reference Dubois1980, 105–06).Footnote 9 Thus, one might expect to observe an overall decrease in the initial election of justices over the period I examine.
The second type of structural change has been the adoption of age-based mandatory retirement of judges in many states since 1946. At the start of the period I examine, only four states had mandatory retirement rules for judges. An additional nineteen states imposed mandatory retirement over the next sixty-five years. As of 2020, twenty-one states still had mandatory retirement because it ended in two states, Wisconsin by lapsing and Illinois where a statute creating mandatory judicial retirement was struck down as not authorized by the state constitution (Maddux v. Blagojevich, 911 N.E.2d 508 (Ill. 2009)). Mandatory retirement might be expected to increase the incidence of midterm vacancies and hence reduce the likelihood of initial election of justices.
In addition to the question of what, if anything, has changed over the seventy-five-year period, there is the question of whether factors other than election type or the presence of a mandatory retirement rule might help explain the variation in the likelihood of state supreme court justices actually being initially elected in states where the constitution calls for election. Other factors I consider are region, party competitiveness, and state norms. Thus, the analysis that follows examines several questions/hypotheses:
How does the likelihood of initial election vary by state?
Has the percentage of justices initially elected changed over time?
Does any temporal relationship vary by type of election system used by a state?
Do the major political changes that have occurred in the South account for any of the temporal changes?
What, if any, effect is there of a state changing from partisan to nonpartisan (and in North Carolina, back to partisan) elections?
What role do rules concerning mandatory retirement or other maximum age limitations play in whether justices tend to be initially elected or appointed?
Is the likelihood of initial election related to party competitiveness in a state and is any such relationship conditioned by election system?
What is the role, if any, of state norms regarding judicial selection, and how can that be assessed?
The remainder of this article consists of six sections. Section II uses a critical discussion of the BCJ study to identify some complexities in looking at the initial election versus initial appointment issue. Section III discusses the data, explaining what is and is not included. Section IV opens with an overview of the variation across the states and then examines temporal patterns and whether temporal patterns vary by election type or region (South versus non-South); included in this section is an analysis of whether patterns change when a state shifts from partisan to nonpartisan election. Section V considers two other explanations for variation across states: mandatory retirement and party competitiveness. Section VI considers the idea of state norms as a partial explanation and presents several analyses assessing the role of such norms. Section VII concludes with a brief summary and revisits the normative issues inherent in the initial selection of judges.
THE BRENNAN CENTER STUDY
The BCJ study provided a snapshot of how state supreme court justices sitting as of August 2016 obtained their positions in the twenty-two states where the state constitution calls for the election of the members of the state’s highest court. As noted previously, the study found that only 54.9 percent of the 153 justices were elected (Berry and Lisk Reference Berry and Lisk2017, 4). As noted in the Introduction, the BCJ reported that the percentage elected varies from 0 in three states to 100 in three other states; the mean and median percentage elected were 54.9 and 57.1 respectively.
With one minor exception, the BCJ study did not look at any of the factors that might explain the likelihood of election rather than appointment. The one exception was to point out that in Louisiana, where all seven justices sitting in August 2016 were elected, an interim appointee may not run in the subsequent election to fill the seat to which the interim justice had been appointed (Louisiana Constitution of 1974, Article V, §22(B)). The authors of the study failed to note that the Louisiana Constitution also calls for the governor to call a special election to fill interim vacancies to be held within twelve months unless there is less than twelve months remaining in the departing justice’s term (Louisiana Constitution of 1974, Article V, §22(B)); in practice, the special elections occur within just a few months. Thus, at any point in time, it is unlikely that there would be an appointed interim justice sitting on the Louisiana Supreme Court.
The BCJ authors also failed to note that the Arkansas Constitution also prohibits an interim appointee from running in the subsequent election for the seat to which the justice had been appointed (Arkansas Constitution of 1874, Amendment 29, §2). However, unlike in Louisiana, in Arkansas the governor does not call a special election, and the interim appointee serves out the term of the departing justice. In August 2016, there was one interim appointee sitting on the Arkansas Supreme Court, Chief Justice Howard Brill, who had been appointed in August 2015 to complete the term of retiring Chief Justice Jim Hannah;Footnote 10 in November 2016 John “Dan” Kemp was elected to that position, taking office on January 1, 2017.
There were two other quirks in judicial selection processes in operation in 2016 that the BCJ authors failed to consider. Regarding Pennsylvania, as previously noted, for a period of about forty years ending in 2015, there was a norm that interim appointees refrain from running in the subsequent election; the appointee who broke the norm by running in 2015 lost in the subsequent Democratic primary. The first appointee since 1969 to run successfully was appointed in June 2016 (see Mendicino Reference Mendicino2016). The second quirk concerns New Mexico, where the report shows only one of the five justices having been elected. The system in New Mexico calls for the governor to make appointments from a list prepared by a nominating commission for all vacancies on the state supreme court, including those occurring when justices choose not to run for reelection and leave office at the end of their terms; appointees can then run in a partisan election held at the time of the next general election. The only elected justice on the New Mexico Supreme Court in 2016 was Democrat Barbara Vigil; in 2012, she had defeated the interim justice, who had been appointed by the Republican governor less than two months before the election. Thus in New Mexico, the system is designed with a presumption that justices will be appointed while allowing for the possibility of election.Footnote 11
If one omits Louisiana, Arkansas, Pennsylvania, and New Mexico from the calculation in the BCJ report, the percentage of justices initially elected drops from 54.9 to 50.8 percent. Thus, just barely over half of justices sitting in August 2016 on state supreme courts where there was no effective presumption for or against appointment were initially elected to their seats. One might further adjust these figures by including the Texas Court of Criminal Appeals, which is the final court for criminal cases in Texas but was not included in the BCJ report. As of August 2016, eight of the nine judges on that court had been initially elected; with those nine judges included, the percentage of justices and judges of state high courts initially elected goes back up to 53.3 percent, very close to the figure reported in the BCJ report.
This discussion of the BCJ report may seem like nitpicking, particularly given that my final adjustment produces a figure virtually identical to that in the report. However, the point here is that one must take care in assessing the frequency of appointment of high court judges in states with elected judiciary because the rules governing selection and how those rules affect which states are included in the calculation play an important role in the percentages one obtains.
DATA
To examine how justices of state supreme courts initially come to their positions, I relied on data I have assembled on state supreme court elections between 1946 and 2020 to identify the justices taking the bench during this period and how they obtained their positions, initial election or initial appointment.Footnote 12 For each of those elected, the data indicated whether the seat was open, was being contested by an incumbent who had been appointed since the last election, or was being contested by an incumbent who had been previously elected to the seat. New justices include the winners of all open seats, all justices who had been appointed since the last elections and sought, successfully or unsuccessfully, to retain their positions, and all justices who defeated an incumbent regardless of whether that incumbent had been previously elected to the seat or had been recently appointed and was standing for election for the first time. Thus, I excluded from the analysis justices appointed on a strictly interim basis, by law, custom, or personal choice; this means I did not include persons appointed to midterm vacancies who then did not run in the subsequent election for the position to which they had been appointed.
Consequently, I omitted new justices in five states for some or all of the period examined:
Arkansas and Louisiana, entire period: as noted previously, the constitutions of those states prohibit an appointed justice from running to succeed him- or herself.Footnote 13
Pennsylvania, 1975–2014: after the state adopted a system using partisan elections for initial terms and retention elections for subsequent terms, a norm, noted previously, came to exist that interim appointees refrain from running in the subsequent election; this norm ended in 2015 when appointee Correale Stevens ran unsuccessfully to retain the seat to which he had been appointed in 2013.Footnote 14
New Mexico, 1989–2020: in 1988 voters approved a unique system for filling vacancies on the state supreme court that is a compromise between a pure Missouri Plan appointment system and a partisan election system (see Kritzer Reference Kritzer2020, 191–96). As discussed previously, under that system, regardless of whether a vacancy occurs during a term or at the end of the departing justice’s term, the governor appoints a new justice from a list of nominees prepared by a nominating commission; the appointee can then run in a partisan election at the time of the next even-year general election. Once a justice has won a partisan election, the justice can seek additional terms by standing in retention elections.Footnote 15
Utah, 1969–1984: during that period, legislation provided that every vacancy, whether interim or at the end of the departing justice’s term, was to be filled by appointment; all incumbents including recent appointees could be challenged in nonpartisan elections, but no challengers defeated an appointee between 1969 and 1984,Footnote 16 after which Utah adopted a full Missouri Plan system (see Kritzer Reference Kritzer2020, 169–78).
Omitting the five states as specified above and those interim appointees who did not run in the subsequent election,Footnote 17 1,120 new justices joined state high courts over the seventy-five-year period, close to half (568, 50.7 percent) of whom were initially elected. There are three ways that justices can be initially elected: winning open-seat elections, defeating recently appointed incumbents (i.e., incumbents standing in their first election since being appointed), or defeating previously elected incumbents. About two-thirds of those initially elected (67.4 percent) won open-seat elections, with the remainder evenly split between defeating a recently appointed incumbent (16.6 percent) and defeating a previously elected incumbent (16.0 percent). Preliminary analyses showed that this split varied little over time with the possible exception of the 1971–1980 decade when 75.9 percent of new justices won open-seat elections and only 4.6 percent defeated previously elected incumbents.
CHANGE OVER TIME, REGION, AND ELECTION TYPE
Overview
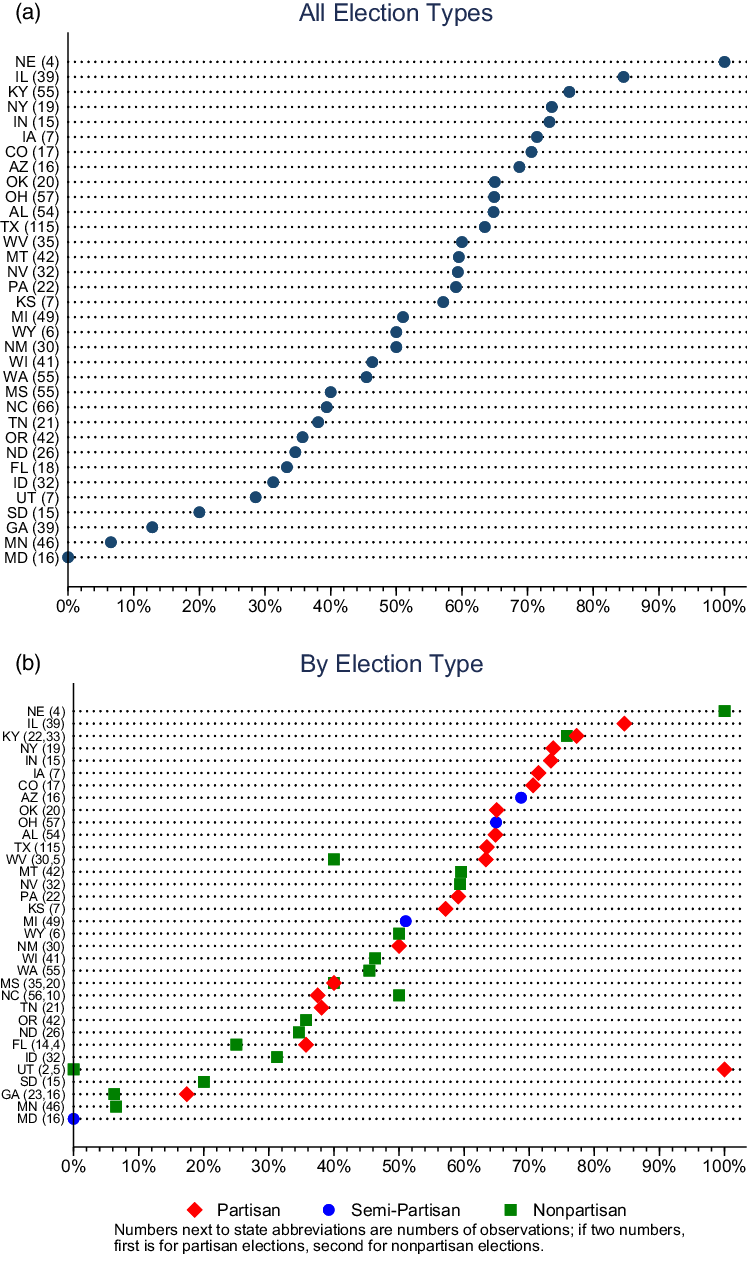
Figure 1a shows the percentage of justices elected in each state that used elections for some or all of the period 1946–2020. Similar to the BCJ report, that percentage ranged from 0 to 100, although the one hundred in Nebraska is based on only four new justices who joined the Nebraska Supreme Court between 1946 and 1962, after which the state switched to the Missouri Plan.Footnote 18 Figure 1b shows that the range is similar for partisan, semi-partisan, and nonpartisan election systems; the outlying values for Utah reflect that there were only two new justices—both elected—between 1946 and 1950 when partisan elections were used and only five—all appointed—between 1952 and 1968 when nonpartisan elections were used. Although the range is similar for partisan and nonpartisan election states, partisan states tend to be in the upper part of the figure and nonpartisan states in the lower part. Overall, in partisan states, 58.0 percent of new justices were initially elected, in semi-partisan states 52.9 percent, and in nonpartisan states 40.4 percent.Footnote 19 These differences are consistent with the prior research noted in the Introduction.
Percentage Elected for Each State Using Elections.
Variation over Time
Figure 2 shows by decade the percentage of new justices initially elected. As the figure shows, that percentage has varied between 42.5 percent to 59.8 percent, although that latter figure covers only the period 1946–1950. There is no overall trend. Leaving aside that first half decade, the percentage initially elected increases from 42.9 percent for 1951–1960 to 57.5 percent for 1991–2000 before dropping back to 44.8 percent. The increase from 1951 through 2000 might relate to some of the changes noted in the Introduction, but those would not explain the drop-off over the last two periods shown in the figure.
Percentage of New Justices Elected by Decade, 1946–2020.

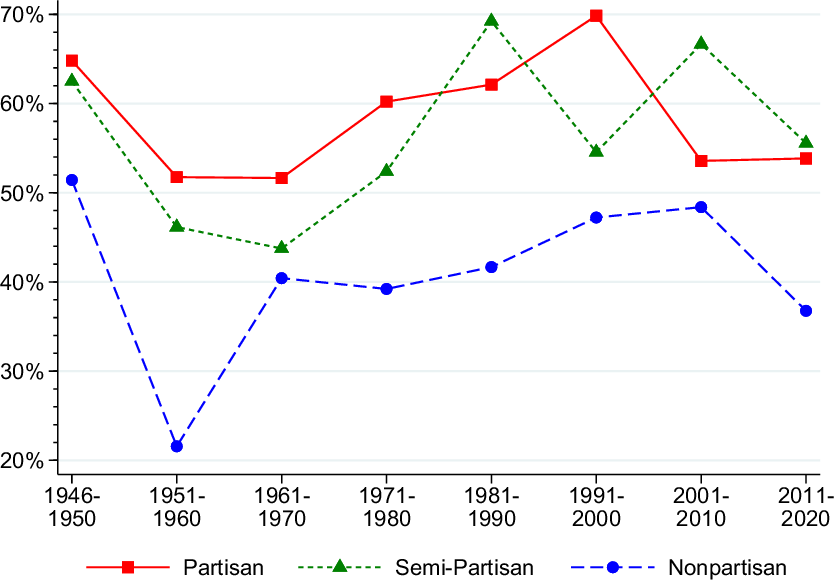
Does any of the variation in Figure 2 reflect changes in state selection systems given the differences in likelihood of initial election by type of election noted previously? Figure 3 shows how these figures vary over time, but again there are no consistent trends. In some decades, the percentage initially elected is highest in the semi-partisan election states. In every decade, the percentage initially elected is least for nonpartisan states, particularly in the 1951–1960 decade; moreover, without that decade, percentage elected would vary the least in nonpartisan election states. There is no clear difference over time between partisan and semi-partisan states, with a greater percentage elected in partisan states in some decades and a greater percentage in semi-partisan states in others. Given the similarity in the patterns for partisan and semi-partisan states, I combine those two groups of states in many of the analyses that follow.
Percentage Elected by Decade and Election Type.
Region
As noted in the Introduction, one of the major political changes in the United States over the period under consideration was the shift from one-party Democratic control in southern states to the dominance of the Republican Party in those states. In my study of changes in state supreme court elections between 1946 and 2012 (Kritzer Reference Kritzer2015), I found that changes in election patterns were most pronounced in the southern states. Is there a difference between southern and nonsouthern states in the percentage of justices initially elected?Footnote 20 Looking at the entire period 1946–2020 the answer is not much: 47.6 percent elected in the South versus 52.3 percent in the non-South.Footnote 21 Figure 4a shows the comparison across the decades. Very clearly, there is a convergence, with the South differing from the non-South in the first three periods but differing little after 1970. Figure 4b extends the analysis of regions by adding the type of election, collapsing semi-partisan and partisan elections because no southern state employs, or previously employed, semi-partisan elections.Footnote 22 As the figure shows, there were no nonpartisan elections in the South until the 1970s.Footnote 23 Although the difference between the South and non-South generally declines over time, election is more likely in non-South states for every decade for both partisan and nonpartisan elections with the single exception of the 1991–2000 decade.Footnote 24
Percentage Elected by Decade and Region.

Impact of Changing Type of Election
Figure 1b included two symbols for the seven states that switched from partisan to nonpartisan (and in North Carolina, back to partisan) between 1946 and 2020. With the exception of Utah, where there were only two new justices during the period of partisan elections and five new justices during the nonpartisan period, there was not a lot of difference in the likelihood of initial election when a state changed. This is clear in Table 1, which shows the percentage elected under each election system for the six states other than Utah. In no state is there a statistically significant decrease in the percentage initially elected when a state switched to nonpartisan elections.Footnote 25 In fact, a higher percentage of justices were elected in North Carolina during the period (2004–2016) the state used nonpartisan elections.
Percentage Elected in States that Changed from Partisan to Nonpartisan Elections

a North Carolina switched to nonpartisan elections effective 2004 and then back to partisan elections effective 2018.
b The numbers in parentheses are the numbers on which the percentages are based.
FURTHER EXPLANATIONS: MANDATORY RETIREMENT AND PARTY COMPETITION
The substantial variation among the states, even after accounting for type of election system and region, raises the question of whether any other state or situational characteristics might explain whether a new justice joins a state’s supreme court by election or appointment. The Introduction noted several possible variables beyond election system. This section considers two of those variables: mandatory retirement rules and party competitiveness.
Mandatory RetirementFootnote 26
Over the period of this study, twenty-four states had mandatory retirement or other maximum age rules for some part of the period.Footnote 27 Only four states had such rules as of 1946; twenty states imposed mandatory retirement or age limits after 1946 with fifteen doing so between 1950 and 1974; as of 2020, twenty-two states had rules mandating judicial retirement or limiting maximum age.Footnote 28 The maximum age falls between seventy and seventy-five for all states using elections,Footnote 29 with fourteen states currently setting the age at seventy, six at seventy-five, three at seventy-two, and one at seventy-four.Footnote 30 Of more importance than the specific age is the range of age limitation rules that exist, which differ in their implication for whether new justices would tend to be appointed rather than elected. The variants are:
Must retire on reaching mandatory retirement age or shortly thereafter—for example, at the end of the month (“immediate mandatory retirement”).
Must retire at the end of the court term or end of the year in which the justice reaches the mandatory retirement age (“delayed mandatory retirement”).
Must retire at end of the term of office (i.e., “ineligible for reelection due to age”) during which the justice reaches retirement age.
Other: (a) must retire at retirement age but may complete the term of office if less than 50 percent of the current term remains when retirement age is reached (Florida), or (b) must retire at the end of the court term unless the justice reaches retirement age during the first four years of the justice’s term, in which case the justice must retire at the end of the fourth year of the term (Texas).
The first two, immediate mandatory retirement and delayed mandatory retirement, are most likely to create a vacancy to be filled by appointment. Under the third variant, ineligible for reelection, there is no reason to expect an increase in the likelihood of a vacancy to be filled by appointment; rather, it might increase the likelihood of open-seat elections due to justices choosing to serve out their final terms. The “other” variants would fall somewhere between the ineligible for reelection variant and the two date-certain variants.
Column a of Table 2 shows the percentage of new justices initially elected when there is no mandatory retirement and under each of the mandatory retirement regimes. Overall, justices are least likely to be elected in states requiring immediate retirement. However, justices in states with no mandatory retirement are no more likely to have been initially elected than justices in states with delayed mandatory retirement or justices in states where justices become ineligible for reelection due to age. Actually, a greater percentage of justices were initially elected where justices become ineligible for reelection due to age than where there was no mandatory retirement or where there was delayed mandatory retirement.Footnote 31
Likelihood of Initial Election by Mandatory Retirement and Election Type
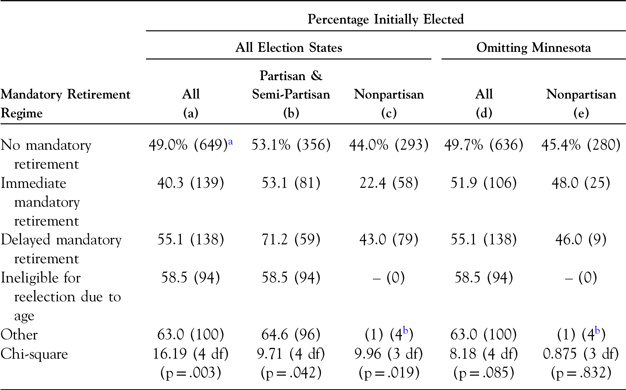
a The numbers in parentheses are the numbers on which the percentages are computed.
b “Other” includes only Florida and Texas; Florida briefly used nonpartisan elections during part of the 1970s.
Columns b and c of Table 2 show what initially appear to be interesting variations after controlling for type of election system. In states using partisan and semi-partisan elections, the percentage of justices initially elected was the same in states without mandatory retirement as in states with immediate mandatory retirement; a higher percentage were initially elected in states with other types of mandatory retirement rules, particularly where there was delayed mandatory retirement. There are effectively only three mandatory retirement regimes in nonpartisan election states: no mandatory retirement, immediate mandatory retirement, and delayed mandatory retirement. There is no difference in the likelihood of having been elected for justices in states with no mandatory retirement and states with delayed mandatory retirement, but sharply fewer justices were initially elected in nonpartisan election states with immediate mandatory retirement rules.
The latter pattern must be treated with caution because a single state, Minnesota, which adopted mandatory retirement effective in 1974, is driving much of what is in column c of Table 2. Of the forty-three new justices in nonpartisan election states with mandatory retirement, thirty-three came from Minnesota and thirty-two of the new Minnesota justices were initially appointed. As shown in column e of Table 2, omitting Minnesota justices, the 22.4 percent elected in nonpartisan states with immediate retirement becomes 48.0 percent, and the chi-square drops to a nonsignificant 0.872. Moreover, omitting Minnesota and ignoring election type, the percentage elected in states with immediate retirement increases to 51.9, which is actually higher than the 49.7 percent in states without mandatory retirement.Footnote 32 Thus, after omitting Minnesota, what appeared to be an interesting pattern disappears.
Although it seems logical that mandatory retirement would be at least a partial explanation for state supreme court justices often being initially appointed rather than being initially elected, that does not appear to be the case. Likelihood of initial appointment is lower under some types of mandatory retirement rules than when there is no mandatory retirement. Moreover, there does not appear to be a sharp difference between no mandatory retirement and the immediate form of mandatory retirement that one might expect to have the greatest effect once one considers the pattern in Minnesota that long predates that state’s adoption of an immediate mandatory retirement rule.Footnote 33
One reason that mandatory retirement may not have the effect hypothesized is that the opportunity for appointments may arise frequently in states without mandatory retirement due to death or serious health conditions. There were 331 appointments in states without a mandatory retirement rule. The opportunity for appointment in 116 (35.0 percent) of those arose due to the death (104) or illness (12) of the appointee’s predecessor.Footnote 34
Party Competitiveness
A second potential covariate is party competitiveness in a state. One might hypothesize that justices’ decisions whether to step down prior to when they will have to stand for election will be affected by who they want to choose their replacement, the governor or the voters, and party competitiveness could easily play a role in that choice. In some states, party competitiveness is strong and in others it is weak. The extreme version of weak party competitiveness was the overwhelming dominance of the Democratic Party in the southern states during the early years being examined (see Ranney Reference Ranney, Jacobs and Kenneth1965, 65–67).
To assess the impact of party competitiveness I adapted a version of an index of party dominance created by Austin Ranney (Reference Ranney, Jacobs and Kenneth1965, 63–64).Footnote 35 Ranney’s measure combines the partisan divisions in the two chambers of the state legislature, the most recent partisan division in the vote for governor, and whether one party controls the governorship and both chambers of the legislature. From these indicators, a running average is created. The resulting index runs from 0 for extreme Republican control to 1 for extreme Democratic control; .5 constitutes maximum competitiveness. For my analysis I created a competitiveness measure by “folding” the four-year running average version of the Ranney index at .5, and then algebraically adjusting the result to run from zero to ten, with zero meaning no competition (i.e., the equivalent of either 0 or 1 on the original scale) and ten meaning maximum competition (.5 on the original scale). The actual values range from 0 to 9.99 with a mean of 6.53 (median 6.98) and a standard deviation of 2.60. Because the dependent variable is dichotomous, election versus appointment, logistic regression is an appropriate statistical methodology.
A series of logistic regression models, see Table A1 in the online appendix, showed that party competitiveness had an effect, but only where partisan (including semi-partisan) elections were used. Table 3 provides an easy way to see the effect of competitiveness in partisan/semi-partisan election states and the lack of effect in nonpartisan election states. I split the data at the three observed quartiles of party competitiveness (5.07, 6.98, 8.77) and determined the observed percentage of new justices elected in each of the four quartiles, both across election types and within the two election-type categories.Footnote 36 As column a of the table shows, ignoring the type of election used, there is an inconsistent tendency for the percentage of justices elected to increase across the quartiles. For nonpartisan election states (column c), there is no pattern, and three of the four quartiles show virtually the same likelihood of election. There is a strong, clear pattern of increase in partisan/semi-partisan election states (column b), with 43.4 percent of justices elected in the least competitive quartile, rising to 71.8 percent in the most competitive.
Likelihood of Election by Quartiles of Competitiveness
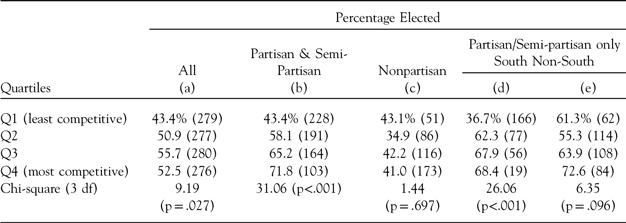
This suggests another question: is the pattern shown in Table 3 attributable to the frequency of extreme one-party dominance in the southern states? Columns d and e of Table 3 show the pattern for partisan and semi-partisan states separately for the South and non-South. There is a strongly significant relationship for the South and at best a very marginal relationship for the non-South.Footnote 37 This is largely confirmed by another set of logistic regression models included in the online appendix (see Table A2 and accompanying discussion). The one difference that appears in the logistic regression is that when state fixed effects are included, competitiveness is statistically significant in partisan election states in both the South and the non-South, and the coefficient for the non-South is larger (but not to a statistically significant degree) than the coefficient for the South. From this it appears that the relationship between the likelihood of initial election and party competitiveness appears to be largely a southern phenomenon, particularly in the context of partisan elections. Perhaps of more importance is that the set of state fixed effects is statistically significant.Footnote 38 This indicates that there may be systematic characteristics of the states that have not yet been accounted for.
STATE NORMS
What might be hidden in the state fixed effects included in the logistic models examining competitiveness? Recall that despite the broad pattern of a lower likelihood of initial election in states using nonpartisan elections, there were no statistically significant changes in that likelihood in the states that switched from partisan to nonpartisan elections during the period under study. This suggests that there are probably state norms that persist despite this shift. In this section I explore several ways of assessing the role of state norms:
The method of selection of a justice’s predecessor: are those whose predecessor was elected more likely to be elected?
Appointees’ likelihood of facing opposition at their first elections: does the likelihood of an appointee being opposed increase as the percentage of justices initially elected to open seats increases?
Appointees’ success in standing for reelection: are appointees less successful in their first election as the percentage of justices initially elected to open seats increases?
The role of state political culture: is there a relationship between the method of initial selection in one or more measures of state political culture?
Method of Predecessor’s SelectionFootnote 39
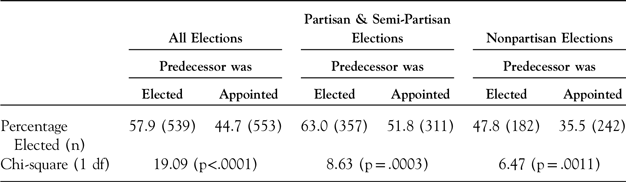
A possible indicator of the influence of state norms is the manner of selection of a justice’s predecessor (ignoring any strictly interim appointees).Footnote 40 Table 4 shows that new justices whose predecessor was elected were 12–13 percentage points more likely to have been elected themselves than if their predecessor was appointed. Logistic regressions reported in the online appendix (Table A3) show that method of the predecessor’s selection continues to have an effect after controlling for election type and party competitiveness.
Effect of How Predecessor Was Selected
Appointees’ First Elections
Likelihood Appointees Will Be Opposed at Their First Election
In a state where the norm is that state supreme court justices should be elected one could expect that appointees will be more likely to face opposition at their first primary and/or general election than in states where the norm is that justices will initially be appointed. Where there is such a norm, justices will be more likely to step down at the end of their terms so that their successors can be chosen by the electorate. A possible indicator of a norm that justices should be elected is the percentage of justices initially elected to open seats (PJIEOS) between 1946 and 2020. The circles in Figure 5a show the percentage of appointees who were opposed in their first election (circles) in each of the twenty-eight states where there were five or more appointees; the figure also shows PJIEOS for those twenty-eight states (squares). The circles and squares tend to increase together (i.e., move to the right together in the figure). Figure 5b shows a traditional scatterplot and regression line predicting the probability of appointees being opposed in their first election by PJIEOS. The regression indicates that PJIEOS accounts for more than a third (r2 = .374, p<.001) of the variation in the percentage of appointed justices facing opposition at their first election. Moreover, for each one-point increase in PJIEOS, the percentage of appointees facing opposition increases 0.84 percentage points—not far from a one-to-one relationship.
Appointees Opposed at First Election.

One limitation of this simple aggregate analysis is that it does not account for other factors that might be important. For example, in a study of nonsouthern state supreme court elections between 1948 and 1974, Dubois (Reference Dubois1980, 141) found that appointees were more likely to be opposed in partisan and semi-partisan elections (86.6 percent) than in nonpartisan elections (55.0 percent).Footnote 41 The same is true for the period and states included in this analysis, although the gap is not as large: 64.1 percent for partisan and semi-partisan elections and 52.9 percent for nonpartisan elections. The lower number for partisan and semi-partisan elections is largely due to partisan elections in the South (where there have been no semi-partisan elections);Footnote 42 only 48.0 percent of appointed incumbents in partisan elections in the South faced opposition when they stood for their first election compared to 87.3 percent outside the South.
There are a variety of other factors that one could hypothesize would affect the likelihood that appointees would face opposition at the first election following their appointment. As previously discussed, that likelihood might be expected to be related to the political competitiveness in the state, increasing as competitiveness increased. It might be expected to increase as the term length increased because those interested in a seat on the court would have to wait longer for an opportunity to run as the term length increased. Finally, one could also expect that the longer the time from the initial appointment until the election, the more established the appointee would become as a justice, which might then decrease the likelihood of opposition; this variable is scaled from one to six with one indicating that the election was occurring the same year as the justice’s appointment and six that the election was occurring during the sixth year since the justice’s appointment. Based on results so far, one could also expect that competitiveness would be conditioned on partisan (including semi-partisan) versus nonpartisan elections, and the same might be true for the effect of PJIEOS as a predictor of opposition.
Table A4 in the online appendix reports the results of a probit analysis, which is similar to logistic regression except for the scaling of the coefficients.Footnote 43 I used probit analysis because it will be needed for the analysis of electoral success of appointees discussed in the next section.Footnote 44 The results show a significant effect for PJIEOS in states using partisan elections but no such effect where nonpartisan elections are used. Similarly, competitiveness has a strong effect in partisan election states and only a marginal effect in nonpartisan election states. Years on the court has the expected effect with those having been on the court longer before their initial elections less likely to be opposed in those elections. Term length has a marginal effect in the expected direction. The effects of PJIEOS and competitiveness are shown graphically in Figure 6;Footnote 45 the absence of an effect of PJIEOS in nonpartisan states is clear, as is the smaller effect of competitiveness in those states.
Likelihood Appointees Are Opposed at First Election by Competitiveness and Percentage of Justices Initially Elected to Open Seats (PJIEOS).

Appointees’ Success in Standing for Election
A third way to see the role of a possible state norm is to consider the likelihood that appointees will survive the subsequent election. As he did regarding the likelihood that recently appointed justices would face opposition in their first election, Dubois (Reference Dubois1980, 141–43) reported on the success of appointees in those elections. He found that those appointees who were opposed were considerably less likely to lose the election in nonpartisan states (18.8 percent) than were appointees in partisan/semi-partisan states (40.3 percent). Including appointees who were unopposed at their first election, only 4.1 percent in nonpartisan states lost compared to 32.8 in partisan/semi-partisan states. In the current study, the comparable figures are 38.7 percent for opposed appointees and 25.6 percent for all appointees in partisan/semi-partisan states, and 15.4 percent for opposed and 8.2 percent for all appointees in nonpartisan states.
Figure 7 shows the aggregate relationship between the percentage of appointees defeated and PJIEOS. The circles and solid lines represent state percentages of all appointees defeated (n = 28); the diamonds and broken line represent the state percentages of opposed appointees defeated (n = 23). The slopes of the two lines are similar (0.43 for all appointees and 0.38 for opposed appointees) but the regression fits (r2s) are quite different (0.24 and 0.10 respectively); the relationship for opposed appointees does not meet the criterion for statistical significance (p = .134).
Success of Appointees Standing for Election.

Except for term length, the same variables that I hypothesized would influence whether appointees would be opposed at their first election would also potentially influence whether an opposed appointee won that election. Because whether an appointee is opposed is not entirely random, failing to take into account whether there is an opponent would produce a biased analysis (Heckman Reference Heckman1979; Berk and Ray Reference Berk and Ray1982). For this reason, the appropriate approach is to use a model that accounts for the selection process. The estimating method I use employs probit analysis to simultaneously estimate both the “selection” equation and the “outcome” equation.Footnote 46 I again condition the effects of PJIEOS and competitiveness on type of election (collapsing partisan and semi-partisan). The probit results are shown in online appendix Table A5 and indicate that only one of the predictors has a statistically significant effect on election outcomes of the opposed appointees, and that is PJIEOS in partisan election states; however, the sign of the coefficient is in the wrong direction: as PJIEOS increases, the likelihood of an opposed appointee in a partisan election state being defeated declines. Figure 8 provides two visual representations of the predicted results based on the probit model, varying PJIEOS and party competitiveness.Footnote 47 What appears as almost a straight line in the top-right panel of the figure reflects the perspective from which the three-dimensional representation is presented; the lower two panels provide perspectives that exchange the axes of the two predictors.Footnote 48
Likelihood Opposed Appointees Are Defeated at First Election by Competitiveness and Percentage of Justices Initially Elected to Open Seats (PJIEOS).

* * *
To summarize, in states where new justices tend to be elected in open-seat elections rather than being appointed (or defeating an incumbent), a justice who is appointed is more likely to be opposed at the justice’s first election, but only in partisan election states. The likelihood of opposition increases as party competitiveness increases regardless of election type, but more strongly in partisan election states.Footnote 49 In contrast, the outcome of elections in which an appointee is opposed does not have the hypothesized relationship with PJIEOS.
State Political Culture
There is a body of literature that focuses on state political culture. The best known is Elazar’s (Reference Elazar1966, 85–94) tripartite distinction: individualistic, moralistic, and traditionalistic. According to Elazar’s analysis (97, 122), some states reflect only one of these cultures, others two of them, and one state (Illinois) all three (122). There is a hint that there might be something of a continuum, running from moralistic through individualistic to traditionalistic, but Elazar did not try to use this as more than a way of grouping states (110). Not surprisingly, the cultures varied regionally with the South and Southwest heavily traditionalist, northern states from Illinois to the East Coast heavily individualistic, and the Midwest through the West Coast heavily moralistic. Several scholars have made stabs at producing quantitative measures of Elazar’s idea. Sharkansky (Reference Sharkansky1969) proposed a single dimension and produced a scale ranging from one to nine. Johnson (Reference Johnson1976, 496–97) combined perspectives from another book by Elazar (Reference Elazar1970, 475–76) linking various religious groups to the three political cultures with state-level census data on religious affiliation from the first half of the twentieth century to propose a set of three measures, one for each culture; his scales range from 0 to .999.Footnote 50
Correlating these four indicators with the percentage of new justices who were elected in the thirty-four states using elections for at least part of the period under study did not produce evidence of statistically significant relationships. The strongest correlation, 0.32 with the individualistic dimension, did approach statistical significance (p = .0695). Correlations with the other three measures of Elazar’s concept of state political culture were not even close to statistical significance: −0.14, −0.16, and 0.02 for moralistic, traditionalistic, and Sharkansky’s single dimension respectively. A regression equation combining the four measures did account for 22 percent of the variation, but given the small number of observations the equation was not overall statistically significant (p = .1139) and none of the individual coefficients was statistically significant at the .05 (two-tailed) level.
Lieske (Reference Lieske2012) sought to update Elazar’s work using county-level data from the 2000 census and a 2000 survey of American church bodies.Footnote 51 Rather than replicating Elazar’s approach, Lieske applied two statistical techniques, factor analysis and cluster analysis, to fifty state-level cultural indices and derived eleven relatively homogeneous political subcultures (541–43): Heartland, Latino, Nordic, Border, Mormon, Global, Blackbelt, Native American, Germanic, Rurban, and Anglo-French. To provide a measure of each dimension, Lieske aggregated “the proportion of statewide population that are under the influence of each regional subculture”; for each state, those proportions add to one. Only the Nordic dimension among Lieske’s eleven dimensions has a statistically significant correlation (-.41, p = .0172) with the percentage of justices initially elected; the strong negative correlation is not surprising given that the dimension is the strongest of the cultural dimensions in Minnesota (.77 out of 1.00), where only three of forty-one justices were initially elected between 1946 and 2020.
The overall lack of relationship is not surprising. In a study I did some years ago (Kritzer Reference Kritzer and Peter1979), I found that the Sharkansky and Johnson measures of political culture were unrelated to several indicators of state judicial/legal systems. Thus, it appears that Elazar’s notion of state political culture fails to capture a dimension of culture relevant for understanding important legal phenomena and leaves the question of whether there is something that could be described as a distinct dimension of state “legal culture” that relates to the state norms about how judges should be selected.
Friedman (Reference Friedman1969, 34) provides a succinct definition of the general concept of a legal culture: “the network of values and attitudes relating to law.” Although the concept of legal culture has most often been used to understand cross-national variations (see Ehrmann Reference Ehrmann1976; Cotterrell Reference Cotterrell, Reimann and Zimmermann2006; Nelken Reference Nelken and David2012), Silbey (Reference Silbey, John, Grindstaff and Lo2010, 475–76) points out that there are several threads of discourse on legal culture, including legal ideology, legal consciousness, cultures of legality, and the structure of legality. However, little of this research has focused on variation in legal culture among the fifty US states. The one approach that has applied the idea of legal culture to specific geographic areas in the United States employs the idea of “local legal culture,” defined as “common practitioner norms governing case handling and participant behavior in court” (Church Reference Church1985, 449). This concept has been applied in research on a range of specific topics,Footnote 52 but none of the studies have produced generalizable measure of local legal culture that could be applied at the state level.
In my earlier study (Kritzer Reference Kritzer and Peter1979) that found little connection between measures derived from Elazar’s work and several legal variables, I did find a dimension that the I labeled the “role of the legal system.” That dimension related to three indicators: Walker’s measure of state innovation (Walker Reference Walker1969, 883), Vines and Jacob’s measure of legal professionalism (Vines and Jacob Reference Vines, Jacob, Jacob and Kenneth1971, 292), and Glick and Vines’s measure of the modernization of court organization (Glick and Vines Reference Glick and Vines1973, 30). However, neither those individual indicators nor a scale formed by combining three indicators had a statistically significant correlation with the percentage of justices initially elected.Footnote 53
Thus, the analyses in this subsection fail to demonstrate a relationship with state political or legal culture as I have been able to find or create possible measures of these concepts. Nonetheless, it remains an open question whether there might be a way to operationalize the notion of state legal culture that could help explain the variation in the likelihood of initial election. Whether there is such a concept that could be operationalized to produce a valid measure must be left to future research.
The Role of State Norms in Election versus Appointment
In this section, I have attempted to assess the role of state norms regarding how judges of a state’s highest court should in practice be selected. The fact that for all appointees considered in this analysis their state constitutions called for election represents the presumed ideal as to how justices should be selected. The question of interest concerns understanding the working norm regarding selection. To try to assess the possible role of a working norm, I presented several analyses, two of which support the argument that norms are important and one providing conditional support.
First, given that the likelihood of initial election is clearly higher in states using partisan rather than nonpartisan elections, one would expect that a state shifting from partisan elections to nonpartisan elections would see a drop in the percentage of new justices elected. The fact that such a drop did not occur supports the idea that something akin to a state norm is playing a role. Second, the fact that how a justice’s predecessor was selected predicts the method of the justice’s own selection supports the idea that norms play a role. Third, an indirect indicator of a norm that justices should be elected rather than appointed is the percentage of justices initially elected to open seats (PJIEOS). If such a norm exists, I hypothesized that appointees would be more likely to be opposed at their first elections and more likely to lose that election in states where a high percentage of new justices were initially elected to open seats; more specifically, I fitted models predicting opposition and defeat conditional on opposition that included as a predictor PJIEOS. The models produced mixed results. Opposition did increase with PJIEOS, but the relationship was much weaker in nonpartisan states than in partisan/semi-partisan states. In contrast, there was no relationship between PJIEOS and the defeat of opposed appointees; in fact, the relationship in partisan states was inverse to what was expected. It is noteworthy that various measures of state political and legal culture were uncorrelated with the percentage of justices in a state that were initially elected.
DISCUSSION
Although the constitutions of twenty-two of the American states currently call for justices of the state’s highest court(s) to be elected, as did another twelve states for some part of the period between 1946 and 2020, only about half of the persons who joined those courts as more than strictly temporary members over those seventy-five years initially obtained their seats by being elected to vacancies created by death, retirement, resignation, or the creation of new positions. This article examined various factors that might explain the pattern of election versus appointment.
The analysis confirms earlier research showing that the likelihood of initial selection by election rather than appointment to a midterm vacancy is related to election format, with election most likely in partisan election states and least likely in nonpartisan election states. There is also some evidence that party competitiveness tends to increase initial selection through election. Somewhat surprisingly, laws requiring justices who reach a mandatory retirement age to vacate their positions before the end of a term fail to account for a greater likelihood of appointment. Most important, there seems to be ongoing state practice or norms. That is, in some states (e.g., Minnesota and GeorgiaFootnote 54 ) there is a strong norm that incumbents leave before the end of their terms, allowing their successors to be appointed, rather than leaving at the end of a term so that there is an open-seat election. In Georgia, the norm was not affected by the switch from partisan to nonpartisan elections. At the other end one finds Illinois and Kentucky, where over 70 percent of justices come to their seats by election, and the pattern in Kentucky did not change when that state switched from partisan to nonpartisan elections.
As noted in the Introduction, Shugerman (Reference Shugerman2012) argues that a key motivation for replacing gubernatorial appointment with popular election in the mid-nineteenth century was to increase the independence of state judges from the elected officials who had previously appointed the judges, but it is not clear that that goal was initially achieved given the continuing role of political party leaders in nominating candidates. Today the choice between appointment and selection is more often discussed as reflecting a tension between independence and accountability, with popular elections more on the accountability side of the ledger. However, if as noted in the Introduction the concern is accountability, initial selection is less important than how judges are retained. Even though accountability is more a matter of retention than selection, the initial selection serves at least two purposes.
First, initial selection speaks to the symbolic politics question of who we want to choose our judges. In the United States, there is a strong norm that public officials of all sorts should be elected by the people, even though we know that the people typically pay relatively little attention to down-ballot elections. Although voters may not want to take the time necessary to evaluate significant numbers of candidates for low-level office, they apparently take some satisfaction from believing they have had a say. A common form of disparagement in the United States is to say that a person “couldn’t even be elected dogcatcher.” In fact, there are at least two places where the dogcatcher (“animal control officer”) is an elected position. Moreover, in one of those places, a small town in New Hampshire, the citizens in 2018 voted to reinstate the position as an elected town position several years after it had been changed to an appointed position (Giddings Reference Giddings2018). If Americans are going to want to elect the dogcatcher, or the library board, or the water and sewer commission, it is not surprising that they will want to elect judges.
A second purpose that initial selection can serve is aiding in achieving descriptive representation by the inclusion of otherwise underrepresented groups. There is a substantial literature on whether the formal selection system for state supreme court justices or other judges affects the characteristics of the justices serving on those courts (Jacob Reference Jacob1964; Canon Reference Canon1972; Glick and Emmert Reference Glick and Emmert1987). There is a more specific literature that has examined the impact of formal selection systems on the representation of women (Alozie Reference Alozie1996; Hurwitz and Lanier Reference Hurwitz and Noble Lanier2003, 340–42; Williams Reference Williams2007; Frederick and Streb Reference Frederick and Streb2008), Blacks (Alozie Reference Alozie1988), Hispanics (Alozie Reference Alozie1990), 318–19), and racial and ethnic minorities more generally (Hurwitz and Lanier Reference Hurwitz and Noble Lanier2003, 338–40) as judges on state courts. Most of this research concludes that the formal selection system has relatively little impact.
There is a more limited literature that examines whether how individual justices are actually selected matters for inclusion of women and minorities. In that literature justices are categorized as “elected” only if they initially came to their positions by winning an open seat or defeating an incumbent. Two studies demonstrate that Blacks or other non-Whites are less likely to come to be on state supreme courts through election than are Whites (Martin and Pyle Reference Martin and Pyle2002; Holmes and Emrey Reference Holmes2006, 7). In contrast, a study looking at all levels of courts found that Blacks were more likely to be selected through election systems than through appointive systems (Graham Reference Graham1990, 328–30). Regarding state supreme courts, the first Black justice to sit on a state supreme court since Reconstruction was Otis Smith who was appointed to the Michigan Supreme Court in 1961;Footnote 55 it was another ten years before the next Black justice was appointed, Robert Morton Duncan in Ohio. The first Black justice who was initially elected to a state supreme court was Robert N. C. Nix in 1972 in Pennsylvania; not until 1990 did another Black justice gain a seat on a state supreme court by election, Charles Freeman in Illinois. By my count, there have been seventy Black justices post-Reconstruction. Five of them served as strictly interim justices in Arkansas, Louisiana, and Pennsylvania. Of the remaining sixty-five,Footnote 56 twenty-nine served in states using systems that exclusively used appointment for initial selection. Of the thirty-six Black justices who served in states where the constitution specified initial election, only ten (29 percent) were initially elected.
Regarding women on the bench, the results are less clear (Martin and Pyle Reference Martin and Pyle2002; Holmes and Emrey Reference Holmes2006, 7). The first woman to serve on a state supreme court, Florence Allen, was elected to the Ohio Supreme Court in 1922.Footnote 57 Next came Rhoda Lewis thirty-seven years later when she was appointed to the Hawaii Supreme Court in 1959. Three women joined state supreme courts in the early 1960s, one elected (Lorna Lockwood in Arizona) and two appointed to midterm vacancies (Anne Alpert in Pennsylvania and Susie Sharp in North Carolina). As this is written, 318 women have served on state supreme courts.Footnote 58 Only eighty-two (25.8 percent) have come to their positions by popular election. Omitting those selected in states that do not use popular election leaves 172 justices, eighty-two (47.7 percent) of whom were elected. Perhaps of more importance is that since 1990 just over half (51.7 percent of 143 justices) were elected, but up until 1990 only a quarter (25.0 percent of twenty-eight) were elected.Footnote 59
Descriptive representation can overlap with “substantive representation” if demographic groups have specific interests. One issue in assessing whether judges with certain demographic characteristics, such as race and gender, differ from their colleagues in the decisions that they make is that one must take into account other factors related to decisional propensity, particularly political ideology. This is a challenge when looking at the race of the judge because minority judges are overwhelmingly Democrats, but it is less of a problem for gender. Also, one might expect the effects of gender or race to be more prominent in cases that raise issues related to gender or race. There are studies showing that women judges are more pro-plaintiff in discrimination cases than are men, even controlling for party or ideology (Davis, Haire, and Songer Reference Davis, Haire and Songer1993, 132; Songer, Davis, and Haire Reference Songer, Davis and Haire1994, 435), and in sexual harassment cases prior to the Clarence Thomas hearings (McCall Reference McCall2003, 90–93), and there is one study showing that women are more pro-victim (i.e., anti-defendant) in domestic violence cases when the victim is female (McCall Reference McCall2008, 288). However, gender effects can show up in other types of cases; one study found that women judges on state supreme courts were more likely to vote in a liberal direction than were men in obscenity cases and death penalty cases after taking into account the judge’s political party (Songer and Crews-Meyer Reference Songer and Crews-Meyer2000). Other research, focused on the federal Court of Appeals, has shown that the presence of a woman on a three-judge panel can affect the decisions of her male colleagues in discrimination cases (Farhang and Wawro Reference Farhang and Wawro2004; Peresie Reference Peresie2005); a similar effect has been found for the presence of a Black judge on a federal Court of Appeals panel (Kastellec Reference Kastellec2013).Footnote 60 Thus, even though it is best to think in terms of retention when the focus is on accountability, the initial selection process can and does play a role in some types of cases.
In conclusion, how judges are actually selected is important. It has implications for how people think about the courts, and it affects who actually serves as judges and justices. Who serves has potential effects on the decisions that courts make. Although this article has specifically focused on selection of state supreme court judges, the issue may be as important, or more important, for who serves on lower-level state courts. In those courts, a much larger proportion of judges may have been initially appointed in states where the formal system specifies election than is the case for the state supreme courts. Interestingly, in several states where appellate judges are appointed, trial judges have continued to be elected (Kritzer Reference Kritzer2020), at least in theory. If in practice in those states most trial judges are initially appointed, one might ask why the electorate has not been more willing to shift to a formal system of initial appointment. It might well be the case that most people in election states incorrectly believe that most of their trial judges got their positions through election even though that is not in fact the case. It would be useful to know the degree to which people know how their state judges initially obtain their positions, but I am not aware of any research that addresses this question.
I could conclude here with a discussion of the normative issue of how judges should be selected. That question has been debated since the founding of the country, and there is no definitive way to answer it. The choice of popular elections as the initial selection mechanism reflects a set of goals, independence in Shugerman’s analysis or accountability as argued by many contemporary observers. However, the system may not work to accomplish the goals sought because of how the system works in actual practice. Some might argue that deviations from the sought goals reflect intentional efforts to undermine the goals. However, it is equally likely that the system produces unanticipated consequences that short-circuit the goals. Certainly, there are justices and judges who step down strategically, not just at the federal level (e.g., Justice Breyer’s retirement), but also at the state level—that is, departures from the bench midterm to permit the governor to fill a vacancy (see Curry and Hurwitz Reference Curry and Hurwitz2016).Footnote 61 However, it is also likely that there are unanticipated or inevitable effects. Those who viewed judicial elections as producing independence from the political branch failed to consider nominating politics. The adoption of mandatory retirement by necessity produces the need to fill midterm vacancies, although as my analysis shows, the presence of mandatory retirement does not explain variation among states in the likelihood that justices are initially elected. Importantly, the absence of mandatory retirement also produces midterm vacancies due to ill health or death as justices age beyond what might have been a mandatory retirement age. These kinds of unanticipated or inevitable consequences can, and not infrequently do, prevent intended goals from being fully reached.
SUPPLEMENTARY MATERIAL
To view supplementary material for this article, please visit https://doi.org/10.1017/lsi.2022.23


 Open access