

Depression is highly prevalent and burdensome, with a particularly wide treatment gap apparent in low- and middle-income countries.Reference Hamilton1, Reference Radloff2 A number of clinician- or self-rated depression symptom severity measures, including the Hamilton Depression Rating Scale,Reference Hamilton1 the Centre for Epidemiologic Studies-DepressionReference Radloff2 and the Patient Health Questionnaire (PHQ-9),Reference Kroenke, Spitzer and Williams3 have been used to screen for depression. The administration of clinician-rated symptom severity measures is time consuming, whereas many self-rated instruments can only be administered in high literacy contexts. Given that up to 33% of people in sub-Saharan Africa are unable to read or write,4 it has been suggested that visual scales may be particularly useful in this setting.Reference Akena, Joska, Musisi and Stein5, Reference Puertas, Patel and Marshall6
Research examining the accuracy of visual scales in screening for depression has been evolving since the late 1960s. The majority of such scales were developed for use in patients with cognitive deficits.Reference Berg, Lönnqvist, Palomäki and Kaste7–Reference Price, Curless and Rodgers10 Results from these studies have been conflicting, with some recommending the use of visual scalesReference Akena, Joska, Musisi and Stein5, Reference Puertas, Patel and Marshall6, Reference Kertzman, Aladjem, Milo, Ben-Nahum, Birger and Grinspan9 and others not.Reference Berg, Lönnqvist, Palomäki and Kaste7, Reference Price, Curless and Rodgers10 One possibility is that scales with fewer items have lower specificity;Reference Arroll, Goodyear-Smith, Crengle, Gunn, Kerse and Fishman11, Reference Maurer12 after all, depression is a condition characterised by multiple signs and symptoms.
Preliminary work
In earlier work, we developed a 14-item visual scale consisting of items depicting signs and symptoms of depression, the Akena Visual Depression Inventory (AViDI),Reference Akena, Joska, Musisi and Stein5 and validated it against the Mini-International Neuropsychiatric Inventory (MINI).Reference Sheehan, Lecrubier and Harnett-Sheehan13 This work had a number of limitations, including no examination of the validity (face, content and criterion) and reliability (internal, inter-rater and test-retest) of the included items. This study addresses these limitations by (a) examining the validity (construct, content and face) and reliability (internal, test-retest and inter-rater) of visual scale items, and (b) assessing the sensitivity and specificity of the modified AViDI against the MINI in Kampala (Uganda) and Cape Town (South Africa). The two populations studied here differ in literacy level, socioeconomic status and ancestral origins.Reference Marie-Laurence and Hein De14 We therefore also examined whether accuracy of the modified AViDI was affected by sociodemographic variables.
Method
Study sites
The study sites for the investigation of validity and reliability of the items for inclusion in the visual scale were the Mityana Hospital and the Mildmay clinic in Uganda, and the out-patient clinic of the Department of Psychiatry at Groote Schuur Hospital in South Africa. Mityana Hospital is 65 km west of Kampala city and serves mainly rural and peri-urban populations. The Mildmay clinic is 10 km south of Kampala and mainly serves an urban population. Groote Schuur Hospital is 5 km west of Cape Town and serves mainly an urban population.
The study sites for the work on sensitivity and specificity (validation) of the visual scale were the Mityana Hospital and Butabika National Referral Mental Hospital in Uganda, and the MZM clinic in Philippi, Cape Town. Butabika Hospital is 10 km east of Kampala and serves all populations (rural, peri-urban and urban populations). The MZM clinic is 20 km south east of Cape Town and serves mainly a peri-urban population. All patients provided informed consent before participating in the study.
Sample size and power calculations
The sample size for the investigation of validity and reliability was based on previous validity and reliability studies, where sample sizes ranged from 300 to 500 participants.Reference Charter15, Reference Hobart, Cano, Warner and Thompson16 Burderer's formulaReference Fenn Buderer17 was used to calculate the sample size for the specificity and sensitivity study. With an estimated 12-month prevalence of 30% among attendees of out-patient clinics in sub-Saharan Africa,Reference Nakimuli-Mpungu, Bass, Alexandre, Mills, Musisi and Ram18 353 participants – of which 105 would have depression – are needed to achieve a sensitivity of 80%, providing 80% power with a 95% confidence interval.
Objective 1: validity and reliability assessment
Assessment of the validity and reliability of the pictorial items of the visual scale comprised the following six steps:
Step i: redesigning representation of items for inclusion in the scale
A fine artist at Makerere University provided illustrations depicting the following eight DSM-based depression signs and symptoms: sadness, anhedonia, low appetite, insomnia, low energy, crying spells, extreme worry and suicidality. In our previous work, we had used the same signs and symptoms, with the exception of insomnia.Reference Akena, Joska, Musisi and Stein5
Step ii: construct and content validity assessment
We conducted in-depth qualitative interviews to assess construct and content validity by showing the 28 pictures (drawn in step i) to 16 psychiatrists and clinical psychologists with at least 10 years of experience in practicing general adult psychiatry in Uganda and South Africa. These clinicians were asked to indicate if the pictures were an accurate representation of the relevant signs and symptoms, as found in their patients. The Lawshe method for assessing content validity was used by asking the participants to describe whether the pictures were: (a) essential, (b) useful but not essential, or (c) neither useful nor essential in assessing depression.Reference Lawshe19 The interviews were tape recorded, transcribed and entered into NVivo version 16 (run on Windows 7) for exploration of key themes and relationships between themes.
Step iii: face validity
To assess whether the items were a representation of what they were intended to measure (face validity), we presented 24 pictures (generated upon completion of step ii) to 10 individuals who had been diagnosed with a severe major depressive disorder (MDD) at the Butabika Hospital and who were in clinical remission and due for discharge. Participants were asked to state whether the pictures depicted how they felt while suffering from the MDD, to suggest modifications where there was lack of clarity, or to suggest whether new pictures were required to depict their depression signs and symptoms. We chose individuals with depression to assess for face validity as persons who have never suffered from a depressive disorder would be unlikely to identify with the depicted items; such individuals would simply state that they have never felt that way, information that would not be very useful.
Step iv: refining scale items
The results from the qualitative interviews in steps i–iii were used to further refine and improve the pictures. The fine artist was contacted to redraw some of the items based on answers to the questions above.
Step v: administration of the pool items to a developmental sample
Trained bachelor's degree-level research assistants then administered the 24 pictorial items to a random sample of 333 participants at Mityana Hospital out-patients department (OPD), the Mildmay clinic and Groote Schuur Hospital. Eligibility criteria included participants who were at least 18 years old with no overt psychiatric or physical illness that would require urgent attention (including hospital admission) as clinically assessed by nurses at triage. Each of the pictures was presented to participants, who were then asked whether the particular picture depicted how they felt over a 2-week period. If the respondent endorsed no, they would get a score of zero. Participants who answered yes would then be asked to state whether, over the past 2 weeks, they felt that way sometimes (scored 1), most of the time (scored 2) or almost all the time (scored 3). Participants were asked to indicate whether there was lack of clarity of the items, and if so to suggest how to improve the items. Sociodemographic data were collected.
Step vi: assessing reliability
We conducted test-retest reliability by administering the items to participants (n = 30) at baseline and then to the same participants 1 week later. To test the inter-rater reliability, two research assistants administered the items to participants (n = 30) an hour apart. The two research assistants occupied different rooms and were blinded to the each other's results.
Data analysis
STATA version 12.1 (run on Windows 7) was used in the analysis of the quantitative data obtained from steps v and vi. We used linear regression analyses to examine for associations between item scores and sociodemographic variables (age, gender, education level, employment and marital status) and HIV status. Factors that were statistically significant at bivariate analysis were then entered into a hierarchical multivariable linear regression model. We assessed for inter-item correlations, scale reliability coefficient (Cronbach's α), test-retest reliability, inter-rater reliability and factor loading analyses. We used the principal components method at factor loading analysis, retaining factors with an eigenvalue >1.2; eigenvalues >1.2 are indicative of more than a single construct in a scale.Reference Rahn20
Objective 2: validating (assessing the sensitivity and specificity) the AViDI-18
On the basis of the results from steps i–vi, 18 items were included in the modified AViDI-18 for comparison against the MINI gold standard.
This part of the study was conducted at the Mityana Hospital OPD (n = 100), at Butabika Hospital OPD (n = 107) and at the MZM clinic in Cape Town (n = 136). All participants were interviewed using the AViDI-18 and the MINI by two independent research assistants who were blinded to each other's results. Half of the participants had the AViDI-18 administered first, and the other half had the MINI administered first. Participants diagnosed with MDD according to the MINI were referred to the mental health clinic for treatment by the mental healthcare practitioner.
Using STATA version 12.1, we conducted factor loading analyses of the final items and calculated the sensitivity, specificity, likelihood ratios and predictive values of the AViDI-18 in relation to the MINI.Reference Lawshe19 We also computed the area under the receiver operating characteristic curve (AUC) score, which is a summary statistic (measure of scale accuracy) that is a function of the sensitivity, specificity, likelihood ratios and predictive values. AUC scores were compared across sociodemographic variables (age, gender and level of literacy), HIV status and country.
Results
Objective 1: validity and reliability assessment of the scale items
Steps i–iv (face, construct and content validity)
Of the 28 items, 4 were judged irrelevant on the basis of the Lawshe Method (described in step ii above) and were removed. The removed items included two pictures depicting happiness and two pictures depicting fear, which participants found ambiguous. The clinicians also suggested a number of modifications. Participants who had suffered from MDD also made suggestions about improvements, including ‘enhancing’ smiles on the faces, making the teeth/eyes more visible, using ‘neutral’ colours (not extremely bright or dark) for clothing and hanging by ropes as the most relevant method of dying by suicide (rather than guns or overdosing on medicines).
Step v (construct validity and reliability assessment)
The 24 items were administered to 333 participants, 84 of which were male (25.2%). The mean age of participants was 29.7 years (s.d. ± 11.4), approximately two-thirds (214, 64.3%) of whom were below 30 years old. Over one-third (135, 40.6%) had low levels of education (no formal education or only up to primary level education) and approximately half (147, 44.1%) were married. About one-third (119, 35.7%) of participants were formally employed. More than half (189, 56.7%) of the participants were HIV-positive.
The mean item score of the 24 items was 23.5 (s.d. ± 11.7) (Table 1). In the multivariable analysis, younger (β = 0.17, CI = 0.05–0.29, P = 0.003), unemployed (β = 0.65, CI = 0.13–1.17, P = 0.013) and poorly educated (β, −3.11, CI = −4.47 to −1.44, P < 0.001) participants were more likely to have higher scores (Table 1).
Baseline demographics of participant characteristics for objective 1

N/A, multivariable analysis not applicable since variables were not significant at bivariate analysis.
The average inter-item correlation of the 24 items was 0.32, with a Cronbach's α of 0.92 (Table 2). The inter-rater reliability agreement between two research assistants (n = 30) was 92.1% (expected agreement 77.9%, weighted kappa 0.64, P < 0.001). The test-retest reliability score was 0.86 (Spearman's correlation coefficient). Four factors with eigenvalues greater than 1.2 were retained at factor loading analysis (Table 3).
Item correlations for objective 1
Factor loading analysis for the objective 1

Likelihood ratio test statistic: independent v. saturated: χ2 (276) = 3850.52, P > χ2 = 0.0000.
Of the 24 items, 6 were removed due to their ambiguity at face and content validity assessment (steps ii–iv) as well as due to poor item correlations and factor loading (step v). The items removed were items 7, 19, 20 and 21 (meant to depict happy, neutral or euthymic states) as well as item 8 (meant to depict a sad/worried person) and item 22 (was meant to depict a person who does not intend to die by suicide). These items are attached as a Supplementary Appendix, available at https://doi.org/10.1192/bjp.2018.9.
Objective 2: validating (assessing the sensitivity and specificity) the AViDI-18
A sample of 343 participants (97% of the target sample size of 353) in Uganda and South Africa was obtained. Of the 343 participants, 116 (33.8%) were male. Participant mean age was 35.32 years (s.d. ± 12.3). Over one-third (131, 38.2%) of the participants had low levels of education (no formal education or only up to primary level education). Just over one-quarter (80, 25.5%) of the participants were HIV-positive (Table 4).
Factor loading analysis of the final scale items (objective 2)

The mean item score of the AViDI-18 was 13.23 (s.d. ± 8.2), with an average inter-item covariance of 0.28 and a Cronbach's α of 0.87. The mean time for the scale administration was 10 min (s.d. ± 5.2).
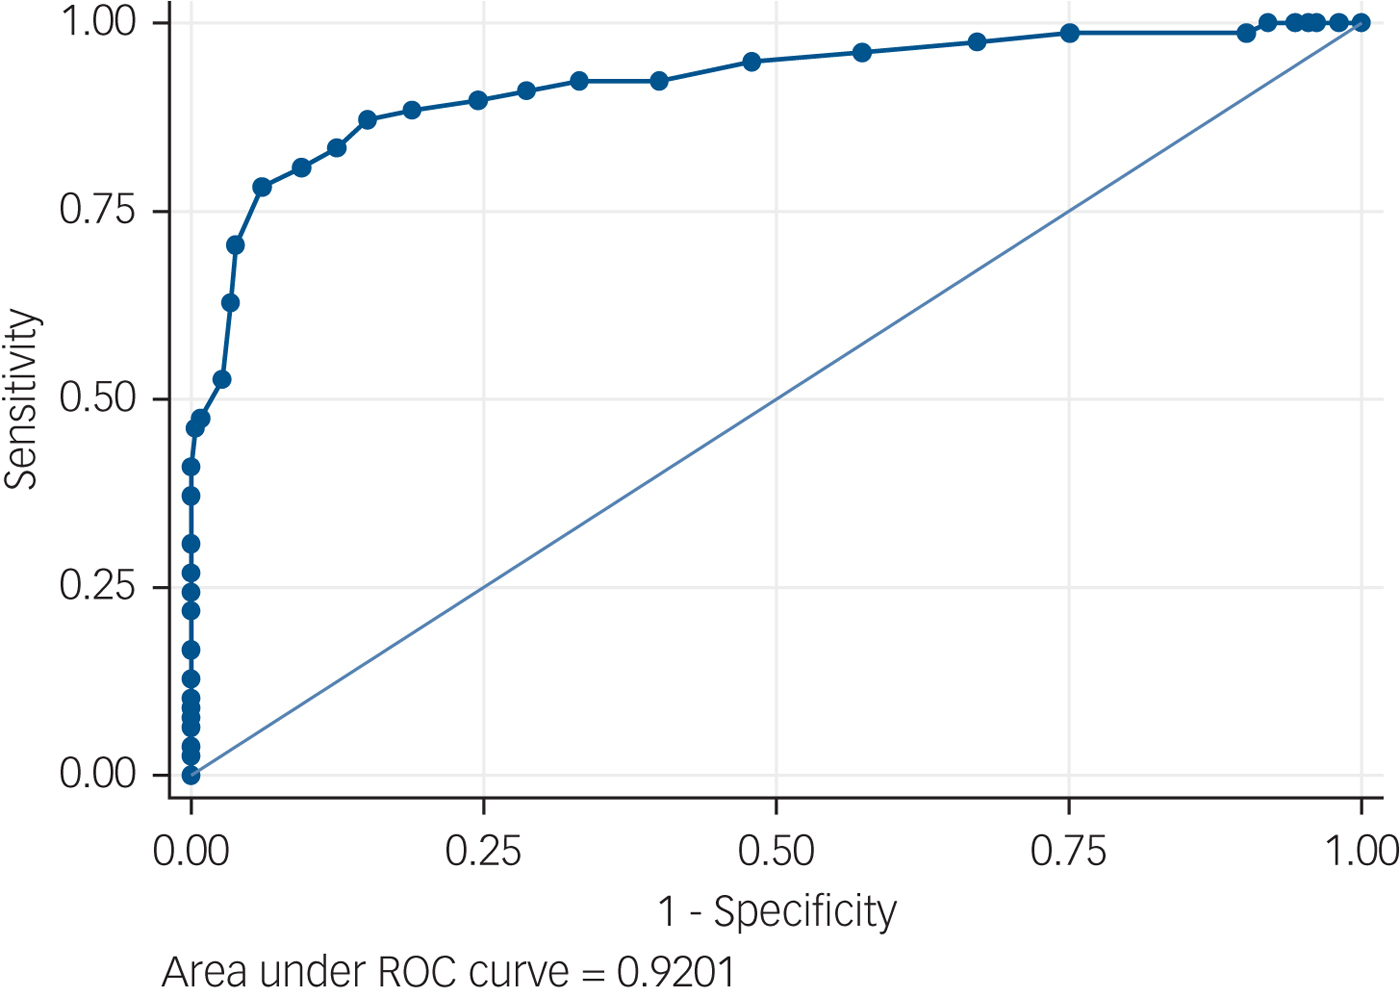
The prevalence of a DSM-based MDD episode according to the MINI was 22.7% (78/343). The AUC score of the AViDI-18 was 0.9 (0.88–0.95), with an s.e. of 0.02 (Fig. 1). A cut-off score of 16 produced the best balance between sensitivity, specificity and likelihood ratios with a sensitivity of 87%, specificity of 84.9%, a negative likelihood ratio of 5.8 and a positive likelihood ratio of 0.155. At this cut-off score, the scale was able to correctly identify 85.4% of cases. The negative predictive value (NPV) of the scale was 77.7% (CI 72.9–82%), with a positive predictive value (PPV) of 100% (CI 15.8–100%) (Table 5).
Receiver operating characteristics of the AViDI-18. Observations = 342, AUC = 0.9201, s.e. = 0.0203, CI = 0.88–0.95. ROC, receiver operating characteristics.
Cut-off scores of the AViDI-18
Scores ranging from 0 to 5 have been omitted from the table because the scale is 100% sensitive, and those ranging from 27 to 44 are omitted because the scale is 100% specific. LR+ positive likelihood ratio. LR− Negative Likelihood ratio. A score of ≥16 is the scale's best cut-off point.
There were no statistically significant differences in scale accuracy by gender (χ2 = 0.15, P = 0.59), age categories (χ2 = 0.96, P = 0.62), level of education (χ2 = 0.76, P = 0.38), employment status (χ2 = 2.07, P = 0.35) and HIV sero-status (χ2 = 0.15, P = 0.70) (Table 6).
Scale accuracy by sociodemographic variables
ROC, receiver operating characteristic.
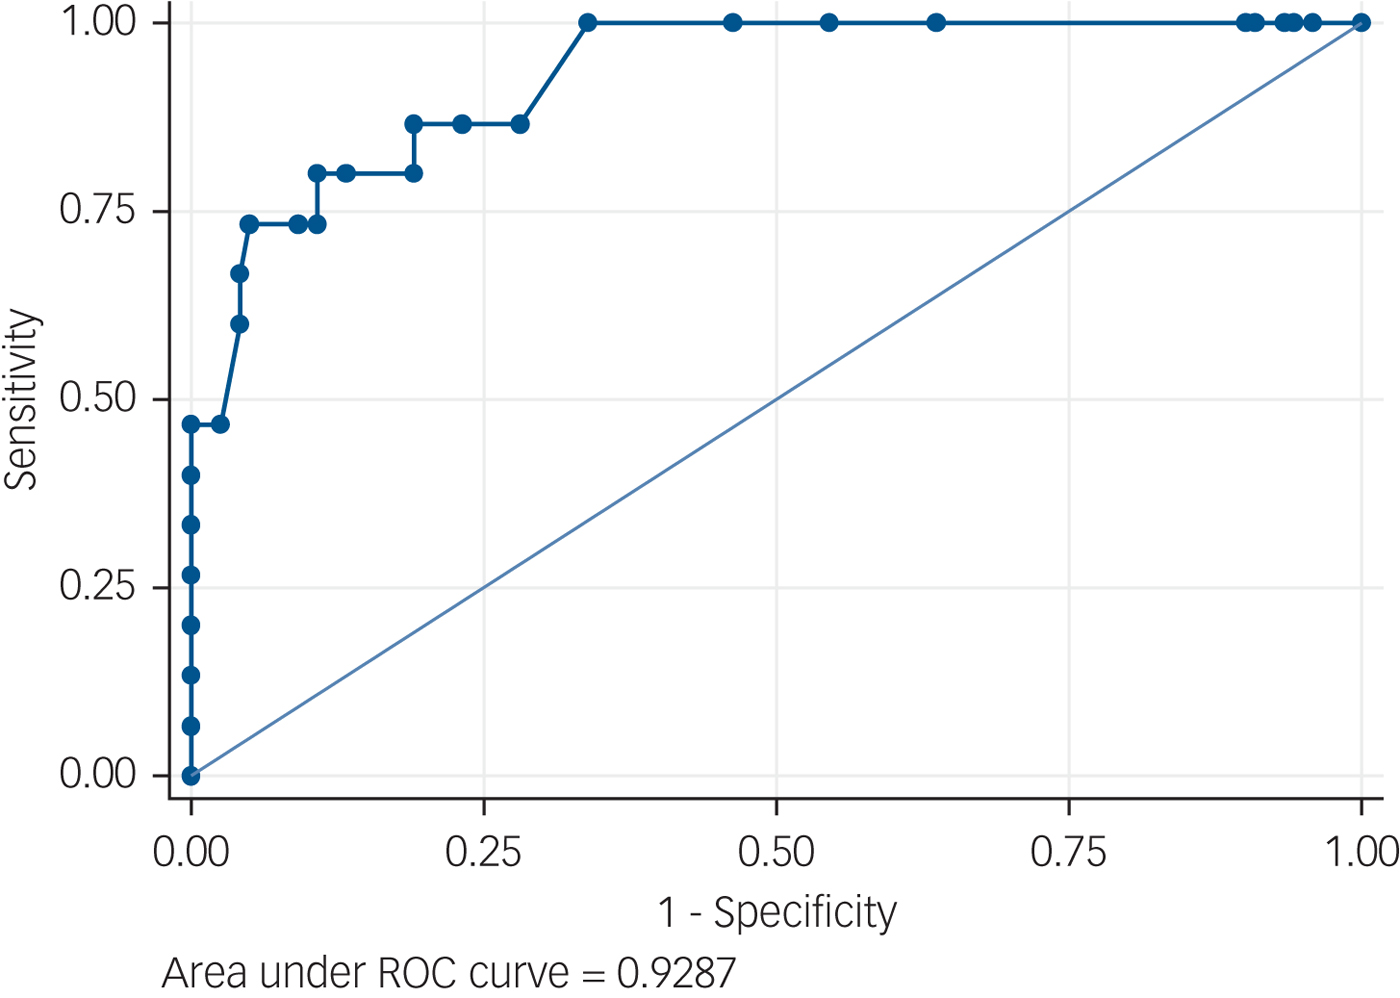
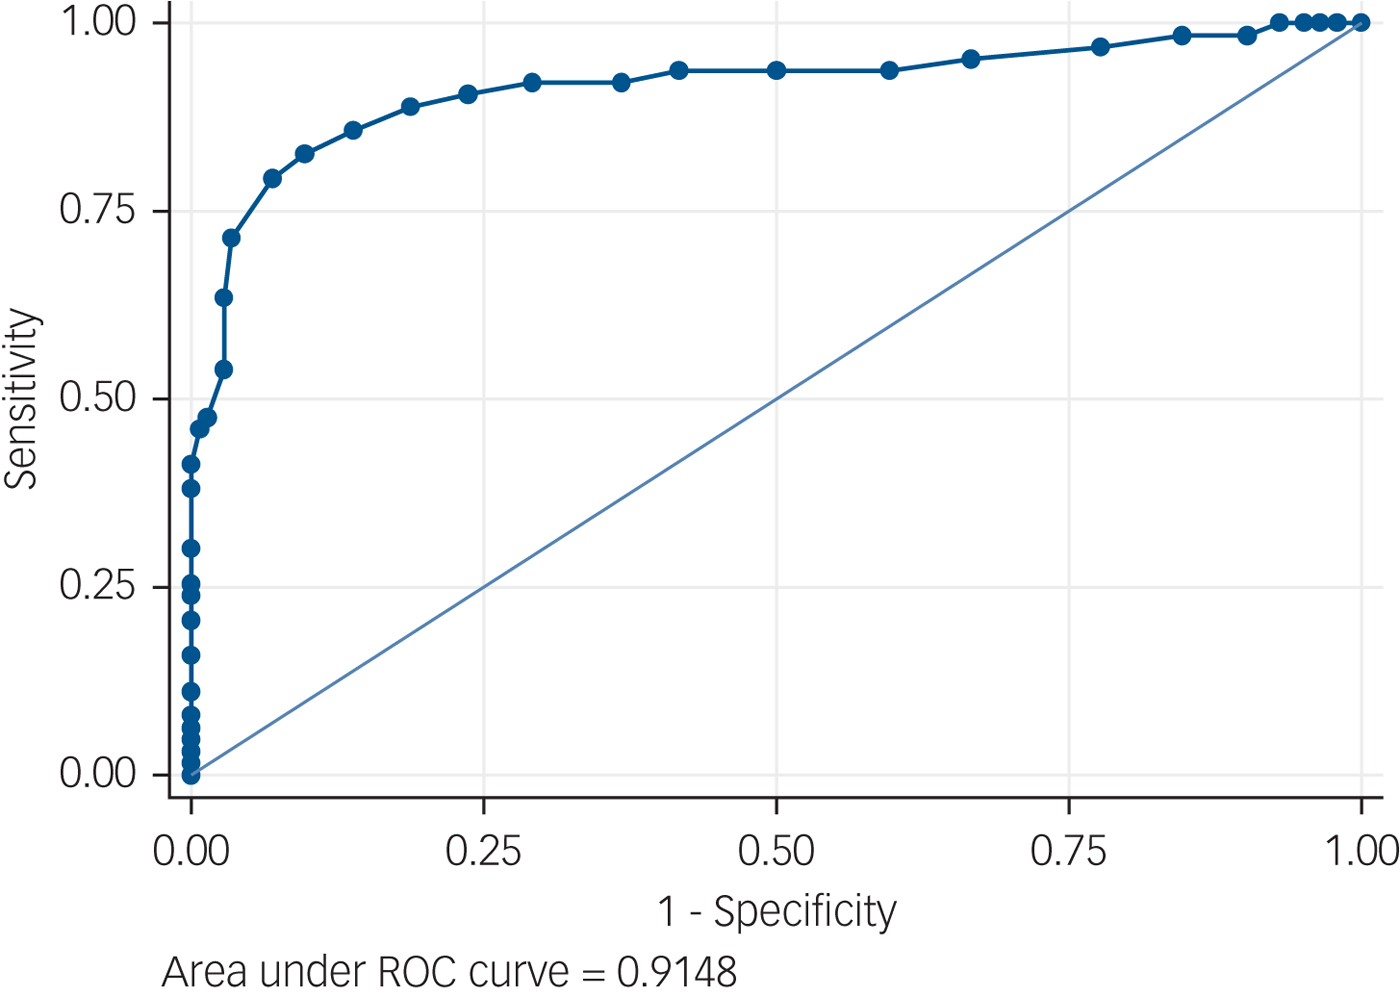
Receiver operating characteristics were similar in South Africa and in Uganda. In South Africa, the AUC score for the AViDI-18 was 0.92 (0.86–0.98), with a PPV of 100% (2.5–100%) and a NPV of 89.6% (83.2–94.2%) (Fig. 2). In Uganda, the AUC score was 0.92 (0.86–0.96), with a PPV of 100% (2.5–100%) and a NPV of 69.9% (63.14–76.08%) (Fig. 3).
Receiver operating characteristics curve for South Africa. Observations = 136, AUC = 0.92, s.e. 0.03, CI = 0.86–0.98. ROC, receiver operating characteristics.
Receiver operating characteristics curve for Uganda. Observations = 207, AUC = 0.91, s.e. = 0.02, CI = 0.86–0.96.
Instructions: Please look carefully at the pictures below and then tell me whether any of them describes the way you have been feeling over the past 2 weeks.
Discussion
Our study is among the first to demonstrate that a visual scale can be used as an accurate screener for a DSM-based MDD in patients with rates of low literacy.Reference Akena, Joska, Musisi and Stein5, Reference Puertas, Patel and Marshall6
The high accuracy of the AViDI-18 compared with previous visual scales is notable,Reference Akena, Joska, Musisi and Stein5, Reference Puertas, Patel and Marshall6 and may reflect a number of factors. First, we used multiple signs and symptoms including mood, appetite, sleep, energy, worry and suicidality to assess for depression; whereas a number of previous visual scales have used single items of sadness as a measure of depression,Reference Berg, Lönnqvist, Palomäki and Kaste7–Reference Price, Curless and Rodgers10 so limiting their sensitivity and specificity.Reference Arroll, Goodyear-Smith, Crengle, Gunn, Kerse and Fishman11, Reference Maurer12 Second, we conducted extensive face and content validity studies of the items followed by a factor loading analysis before including them into the final scale, whereas the development of previous visual scales did not incorporate such steps.Reference Berg, Lönnqvist, Palomäki and Kaste7–Reference Kertzman, Aladjem, Milo, Ben-Nahum, Birger and Grinspan9 Third, our scale consisted of coloured line drawings, whereas a number of previous visual scales are comprised of black and white shaded drawings. Coloured pictures are easier to understand and more appealing, especially in persons with low literacy.Reference Readence and Moore21 Fourth, the addition of simple lettered instructions to pictures improve understanding compared with text alone, and so may have enhanced the ability of partially literate participants to fully appreciate the items and provide appropriate responses.Reference Ngoh and Shepherd22
We found that scale accuracy was not significantly associated with sociodemographic variables or HIV status. Previous work has suggested that the meanings individuals attach to pictures may differ by gender.Reference Salkind and Salkind23, Reference Cela-Conde, Ayala, Munar, Maestú, Nadal and Capó24 The findings here suggest that pictorial items may, however, be an effective means of communication for a broad range of individuals with low literacy.Reference Ngoh and Shepherd22, Reference Houts, Doak, Doak and Loscalzo25 It is also notable that there was no significant difference in the accuracy of the AViDI-18 by HIV status, even though physical symptoms of AIDS may overlap with the signs and symptoms of depression. This finding confirms the potential value of the AViDI-18 as a screening tool for depression, even in populations with comorbid physical illness.
However, a number of limitations do deserve emphasis. First, AViDI-18 items were based on the DSM and the scale was validated against the MINI, rather than compared with a longitudinal expert assessment and diagnosis gold standard. Moreover, it was not possible to depict some of the DSM-based criteria for depression including guilt, psychomotor retardation or concentration pictorially without creating ambiguity. Second, our findings indicate that although the PPV of the AViDI-18 was very high, the confidence interval for this value was very wide too. The wide confidence interval of the PPV means that caution needs to be taken when interpreting a positive screen result. Since a high prevalence of a disease predicts an equally high PPV, and the prevalence of MDD in our study sample was high (22%), the AViDI-18 requires validation in a population with a low depression prevalence. Furthermore, given concerns about the value of screening for depression, it is also important to ascertain whether screening with the AViDI-18 leads to improved diagnosis and ultimately better patient outcomes. The sample sizes for future studies will need to be calculated for both specificity and sensitivity and is likely to be larger. Lastly, at factor loading, two factors with eigenvalues greater than 1.2 were identified. This finding indicates that the AViDI-18 could be measuring constructs other than depression. However, factor 1 had an eigenvalue of 5.9, so we can be confident that the AViDI-18 measured DSM-based MDD, perhaps with other potential comorbidities. The study sample size of 343 (97% of the target sample size) fell short by 10 participants, which could have reduced the power to detect statistically significant differences. Our findings should be interpreted cautiously with this in mind.
In conclusion, the findings from our study demonstrated that visual scales can be used to accurately detect depression in patients with low literacy in low-resourced countries in sub-Saharan Africa. It may be useful for further work to compare the accuracy of the AViDI-18 against established screening instruments such as the PHQ-9. We are also aware of a number of novel methods of administering screening instruments to individuals with low literacy, such as mobile phones and tablet computers with visual cues and auditory instructions, and we recommend that future studies explore these methods.
Supplementary material
Supplementary material is available online at https://doi.org/10.1192/bjp.2018.9.
Funding
This work was supported by the African Research Excellence Fellowship fund (AREF-MF-001; principal investigator: D.A.). During the writing of the paper, D.A. received protected time from a capacity building NURTURE fellowship (grant number D43TW010132) supported by Office of the Director, National Institutes of Health; National Institute of Dental and Craniofacial Research; National Institute of Neurological Disorders and Stroke; National Heart, Lung and Blood Institute; Fogarty International Center and the National Institute on Minority Health and Health Disparities.
Ethical approvals
This study was approved by the Makerere School of Medicine Research Ethical Committee (reference 2015-113), the Uganda National Council for Science and Technology (reference SS 3963) and the Faculty of Health Sciences Human Research Ethics Committee at the University of Cape Town (reference 228/2016).
Author contributions
D.A. conceptualised this work and supervised the data collection and analysis. J.J. and D.S. provided extensive comments and critiques of the work at all the stages, from writing the proposal to the final manuscript. All three authors actively participated in writing the manuscript


eLetters
No eLetters have been published for this article.