1. Introduction
Crack formation during deformation has received considerable attention in studies of the strength of granular and columnar-grain ice (Reference SinhaSinha, 1988, Reference Sinha, Wilshire and Evans1990; Reference SchulsonSchulson, 1990; Reference Smith and SchulsonSmith and Schulson, 1994). Reference GoldGold (1972a,Reference Goldb)observed that the grain-boundary and transcrystalline crack populations induced by the deformation of columnar-grain ice may be the result of two distinct crack-forming processes that have well-defined statistical characteristics that depend on the conditions of loading and random properties of the ice structure. In the winter of 1991–92, the author, as a visiting scientist atthe Institute for Marine Dynamics of the National Research Council of Canada, St John’s, Newfoundland, carried out a research program whose objective was to obtain information on the dependence of grain-boundary and transcrystalline cracks on strain rate, grain-size and temperature, and on statistical characteristics of these crack populations, in order to further understanding of the role they play in the process of failure of polycrystalline ice. This paper presents justification for the expectation of a statistical behaviour, and statistical information on crack type and length.
2. Preparation of the Ice and Test Specimens
The ice was made from deionised and deaerated water in an open-top tank measuring 55 cm × 35 cm × 25 cm. After cooling in a cold room, freezing was initiated by spreading on the surface of the water ice particles of a givenrange in size, obtained by crushing and sieving large single crystals. A heated overflow tube, connected to the bottom of the tank, prevented the build-up of pressure due to expansion of the water on freezing. This method of making ice produced a columnar-grain structure that, within 30 mm of the seeded surface, had a strong tendency for the axis of hexagonal crystallographic symmetry of each grain to be in the plane perpendicular to the long direction of the grains and to have a random orientation in that plane. The average cross-section of the grains near the surface was determined by the size of the seed particles, and increased gradually in the direction of growth.
Clear rectangular specimens, 30 mm × 90 mm × 200 mm, with the long direction of the grains perpendicular to the 90 mm × 200 mm face, were used for the tests. The specimens, prepared with a milling machine, had sides and faces parallel to within 0.1 mm and end faces to better than 0.02 mm. Each Specimen was sealed in an airtight plastic bag and stored in an airtight box. They were conditioned at the test temperature for at least 24 h prior to testing.
3. Experimental Procedure
A uniaxial compressive stress was applied to the 30 mm × 90 mm end faces at a constant rate of cross-head displacement by a servo-controlled hydraulic actuator. It was, therefore, perpendicular to the long direction of the columnar grains and parallel to the plane in which the direction of the crystallographic axis of hexagonal symmetry of each grain was randomly distributed. Maximum stresses were limited to 3–5 MPa, depending on the nominal strain rate and temperature. The nominal strain rates, ![]() were 10−2, 10−3, 10−4and 10−5s−1; the average measured values corresponding to these rates were 6.7 × 10⁻³, 7.6 × 10⁻⁴, 7.6 × 10⁻⁵and 7.8 × 10⁻⁶s−1. Only two tests were done at the nominal rate of 10−3s−1. Tests were conducted at the nominal rate of 10−3s−1at each of the temperatures −5°, −10°, −20° and −30°C.
were 10−2, 10−3, 10−4and 10−5s−1; the average measured values corresponding to these rates were 6.7 × 10⁻³, 7.6 × 10⁻⁴, 7.6 × 10⁻⁵and 7.8 × 10⁻⁶s−1. Only two tests were done at the nominal rate of 10−3s−1. Tests were conducted at the nominal rate of 10−3s−1at each of the temperatures −5°, −10°, −20° and −30°C.
Strains were measured with two electrical extensometers mounted on the edges of specimens. The strain rate was found to be almost constant over the range of Strain from 1.5 × 10⁻⁴to the maximum imposed during a test. For some tests the two measurements differed, but the relative change was small in comparison with that for the nominal rates. Values used in the analysis were the average of the two measurements. The average total strain, ![]() was between 4.1 × 10⁻⁴and 9.6 × 10⁻⁴.
was between 4.1 × 10⁻⁴and 9.6 × 10⁻⁴.
Loads were applied through steel platens. The upper platen was self-adjusting to ensure full contact with the ends ofthe specimens. A small preload, less than 0.1 MPa and small enough to allow positioning of the specimen on the lower platen, was applied for about 5 min before the beginning of each test. The output from the load cell, the two extensometersand the piston displacement transducer were sampled at a rate of 30–200 Hz, depending on the nominal strain rate and temperature. A video camera, placed in front of the 90 mm × 200 mm face, was used to monitor the formation ofcracks. The formation of a crack was abrupt and easily detected by the reflection of light from two lamps, one on each side of the specimen.
For the type of ice and stress conditions used in the study, the cracks that form are long and narrow, with their long direction in the long direction of the grains. The sine of the angle between the surface of the cracks and the direction of the applied compressive stress appears to be normally distributed about that direction (Reference GoldGold, 1966). There is a tendency for cracks to be displaced toward the surface with the larger average grain-size, probably because of the grain-size dependence of the strain and stress for crack initiation (Reference Gold, Jones and SladeGold and others, 1993). Preliminary observations showed that for specimens 30 mm thick, practically all of the cracks extended through the central plane of the specimens. For strain rates greater than about 10−5s−1, there was no visual evidence of cracks increasing in size for strains and stress less than 60% of yield or failure values. A few cases of crack enlargement after initial formation were observed in video records of tests conducted at the rale of 7.8 × 10⁻⁶s−1.
After completion of a test, the ends were cut from the specimen. The average grain-size perpendicular to the long direction of the grains was determined from thin sections cut from each face of the central part that remained. It was taken to be the diameter of the circle with area equal to the average grain area. The average for the specimen was the mean of the values for each face. Average grain-sizes for the tests carried out at −10°C were in the range 2.3–9.2 mm. At the other temperatures they were in the range 2.9–6.2 mm. The mean taper in the long direction of the grains for 64 specimens was 1°; the maximum was less than 2.4°.
After removal of the thin sections, the specimen was cut at its midplane and the new face of one smoothed by warming on a plate, whose temperature was just above 0°C, until the cracks were seen clearly. The length of the cracks perpendicular to their long direction (hereafter called the crack length) within the central 70 × 70 mm2area of the face was measured to an accuracy of 0.05 mm using a calibrated scale mounted in the ocular of a binocular microscope. It was noted for each whether it was in the grain boundary or transcrystalline and whether it involved one or more grains. The position of grain-boundary cracks relative to the grain-boundary junction points (triple points) was observed, as well as whether they involved all or only part of the boundary. These measurements were made within 5 h of completion of the test. At the time of measurement, the edges of the cracks were sharp and distinct. There was no visual evidence during the period of measurement that they had begun to heal.
4. Statistical Basis for the Analysis
In addition to being elastically anisotropic, the resistance to viscous shear on the basal plane of an ice crystal, the plane perpendicular to the axis of hexagonal symmetry, is lower by a factor of about 100 than that for any other crysiallographic plane. As the basal planes tended to be parallel to the long direction of the grains and the applied stressperpendicular to that direction, each grain had, effectively, only one direction for the initial delayed-elastic and non-elastic change of shape, and that was by slip on the basal plane in the direction of the resolved applied shear stress in the plane perpendicular to its long direction. As the shear stress in the long direction of the grains is small on both the basal planes and the grain boundaries, the initial deformation due to delayed-elastic and non-elastic strains would be virtually two-dimensional, their contribution in the long direction of the grains being much less than that in theplane perpendicular to it (Reference GoldGold, 1960). For this plane-strain condition and constant volume deformation, each grain musthave at least two degrees of freedom for deformation to conform to the change in shape of neighbouring grains (Reference GoldGold, 1960).
For strain rates greater than 7.6 × 10⁻⁵s−1at the temperature of −10°C, practically all the sirain was recovered when the load was removed. Analysis of the stress and strain measurements showed that the strain for the three highest rates was primarily elastic plus delayed-elastic. Curvature of thestress-strain curve for the strain rate of 7.8 × 10⁻⁶s−1, and non-recoverable strain after the removal of the load, showed that, for this condition, permanent deformation had become significant (Reference GoldGold, 1994). It would be expected that the delayed-elastic term would depend on grain-boundary shear, as hypothesised by Reference SinhaSinha (1979)and demonstrated for cyclical loading by Kuroiwa (1964), Reference Nakamura and AbeNakamura and Abe (1979)and Reference Cole and SodhiCole (1991). It would depend also on the recoverable time-dependent deformation of the grains(Reference ColeCole, 1993), and this would be affected by the anisotropy in the crystal structure of the ice. As each grain had, initially, only one degree of freedom for easy deformation, local stresses would be induced in the grain boundaries by, for example, grain distortion and grain-boundary shear, and in grains by, for example, the pile-up of dislocations. These stresses would depend on strain rate, time and the relative orientation of the crystallographic axis of adjacent grains. It would be expected that each local stress field would be of the scale of the grain-size and not be affected greatly by the relative orientation of grains some distance from the site. They would depend on immediately neighbouring grains, as the change in shape of a grain must conform with that of all grains in contact with its boundaries. If the local stress is sufficiently high, a crack may form and the deformation is no longer one of constant volume.
Because the axis of hexagonal symmetry of each grain is oriented randomly in the plane perpendicular to the long direction of the grains, there must be an equal probability of the occurrence of all possible combinations of crystallographic orientations for the three grains forming a triple point. Little is known about the nature of the singularities that cause local stress variations in ice. It would seem reasonable to assume, however, that the combination of such singularities and the random orientation of the crystallographic axes of symmetry would result in an internal strain-energy field with a variability that should be describable by a distribution function. If this is the case, the formation of a crack should tell something about the spatial and temporal variation in the internal strain energy, which is evolving in a manner that depends on the shape, size and relative crystallographic orientation of grains, the nature of the singularities and the time dependence of the stress and strain. The present study responds to the questions, for a simple experimental arrangement, what is the critical applied strain and stress at the time of the formation of a crack under plane-strain conditions, when and where do cracks form, and what are some of the statistical properties of the crack populations.
Assume that the formation of each crack is an independent, random event. Each test, therefore, can be considered as aset of concurrent, independent, experiments with the same external load conditions. The crack populations that develop during a test should give information on the probability distributions that may be used to describe the process. Additional tests extend this information base, as each specimen is a sample drawn from the universe of specimens for a particular type of ice of given average grain-size
Assume that the initial, dominant, spatial variation in the stress and the strain in a Specimen are determined by therelative crystallographic orientations of the grains forming each triple point. The number of grains per m2is given by 4/πd2, where dis the average grain-size as defined earlier. For the average grain-sizes of the specimens, the grain density of the ice is in the range 1.5 × 10⁴to 24 ×104m−2. This means that the 70 × 70 mm2area of observation for each specimen would have 74–1200 grains. Each grain shares one-third of six triple points, and so the number of triple points per m2is about twice the number of grains. That is, each specimen is a random sample of 150–2400grain-boundary triple points, depending on the average grain-size, of all possible combinations of relative crystallographic orientation of adjacent grains. The observations indicated that the number of grains for each specimen was sufficient to bring out statistical characteristics of the two crack populations.
5. Results
5.1. Crack type
For the strain rate and stress imposed on the specimens, the majority of the cracks were in the grain boundaries, in marked contrast to what was found for the same type of ice when subjected to a creep strain of about 10−2and compressive stress of less than 2.0 MPa (Reference GoldGold, 1972a, Reference Goldb). The grain-boundary cracks could occupy the full boundary between two grains, part of the boundary, or more than one boundary. Practically every grain-boundary crack had at least one edge at a triple point.
Most transcrystalline tracks were wholly within one grain. Some had one edge at a grain boundary or at a triple point, and a few propagated through a boundary into an adjacent grain. Some of the cracks were a combination of transcrystalline and grain-boundary (tr–gb). Although it was possible to follow a crack through the ice with the microscope, it was not possible to establish if a tr–gb crack initiated within the grain or in a boundary. In the analysis, tr–gb cracks were classified as transcrystalline.
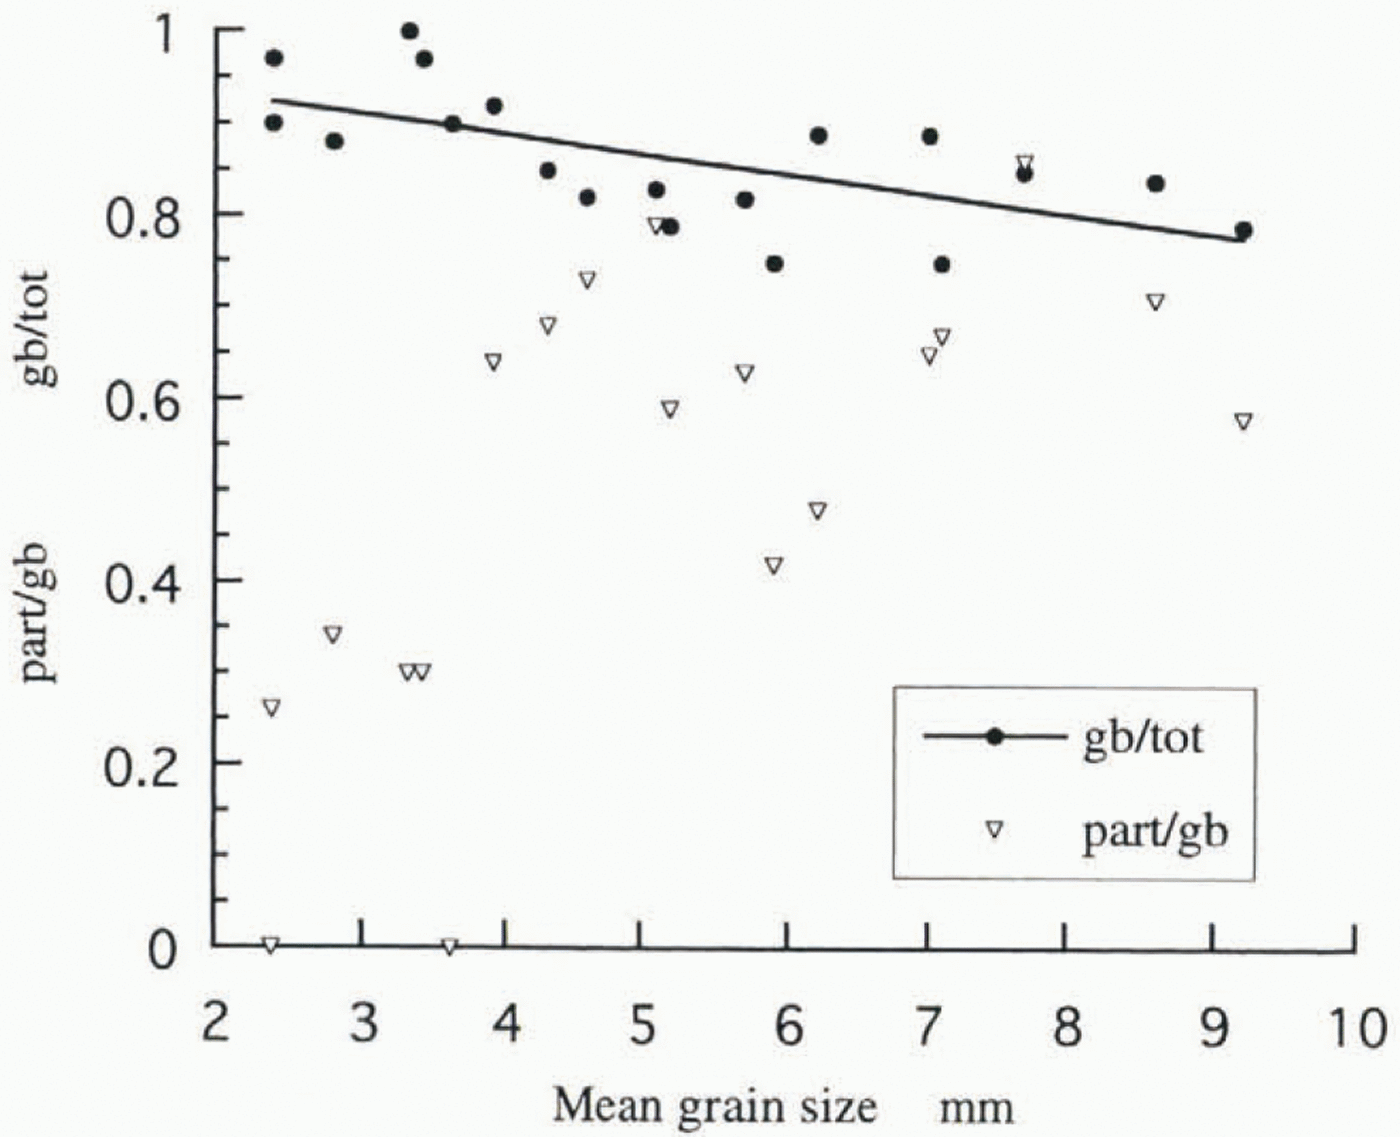
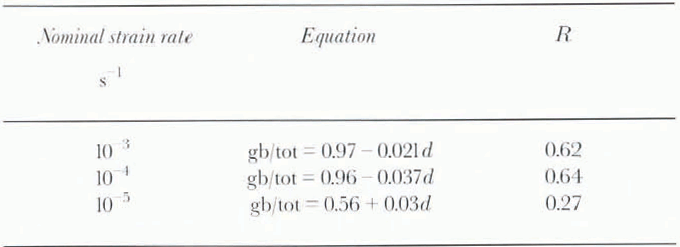
Figure 1shows the grain-size dependence of the ratio of the number of grain-boundary cracks to the total number of cracks (gb/tot) and of the ratio of the number of partial grain-boundary cracks to the total number of grain-boundary cracks (part/gb) for the nominal strain rate of 10−3s−1. Shown also is the linear regression line for gb/tot. The equation and correlation coefficient for gb/tot for thenominal rates 10−3, 10−4and 10−5s−1are presented in Table 1. It can be seen that the ratio decreased with increasing grain-size, but this dependence became less definite, and may even reverse, at the nominal strain rate of 10−5s−1. The part/gb ratio tended to increase with grain-size, but the dependence became less definite at the nominal strain rate of 10−5s−1. As the total number of cracks is the sum of thegrain-boundary and transcrystalline cracks, the grain-size dependence of the ratio of transcrystalline to total number is readily visualised from Figure 1and Table 1.
Linear regression equations and correlation coefficients for the ratio of grain-boundary cracks to total number of cracks for the nominal strain rate shown; d is in mm

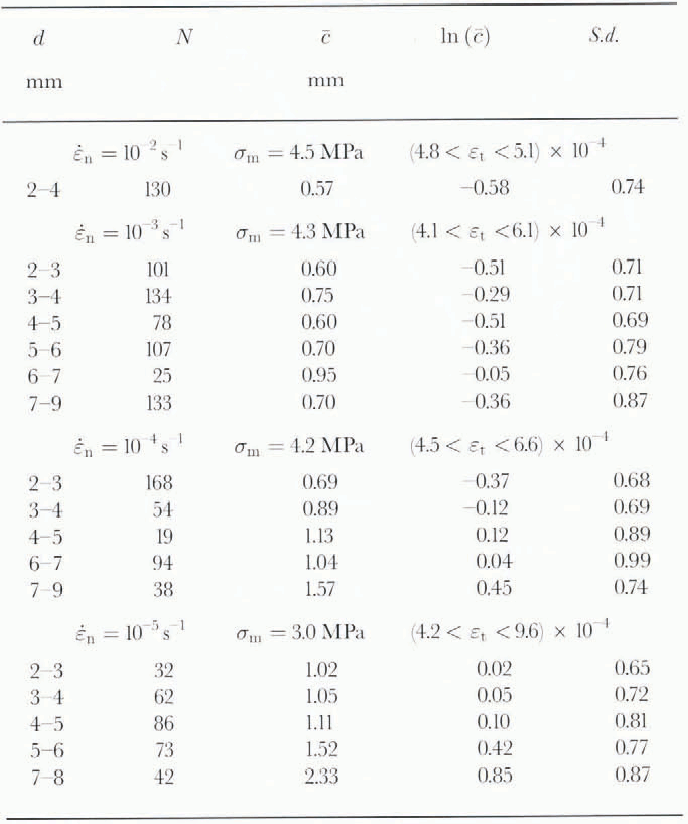
Characteristics of the log-normal distribution for grain-boundary cracks for the constant-strain-rate tests at −10°C; ![]() is the nominal strain rate, εtis the total strain, σmis the maximum stress applied, d is the range in grain-size, N is the number of cracks, cis the LMCL and S.d. is the standard deviation of the log-normal distribution (ln (mm))
is the nominal strain rate, εtis the total strain, σmis the maximum stress applied, d is the range in grain-size, N is the number of cracks, cis the LMCL and S.d. is the standard deviation of the log-normal distribution (ln (mm))
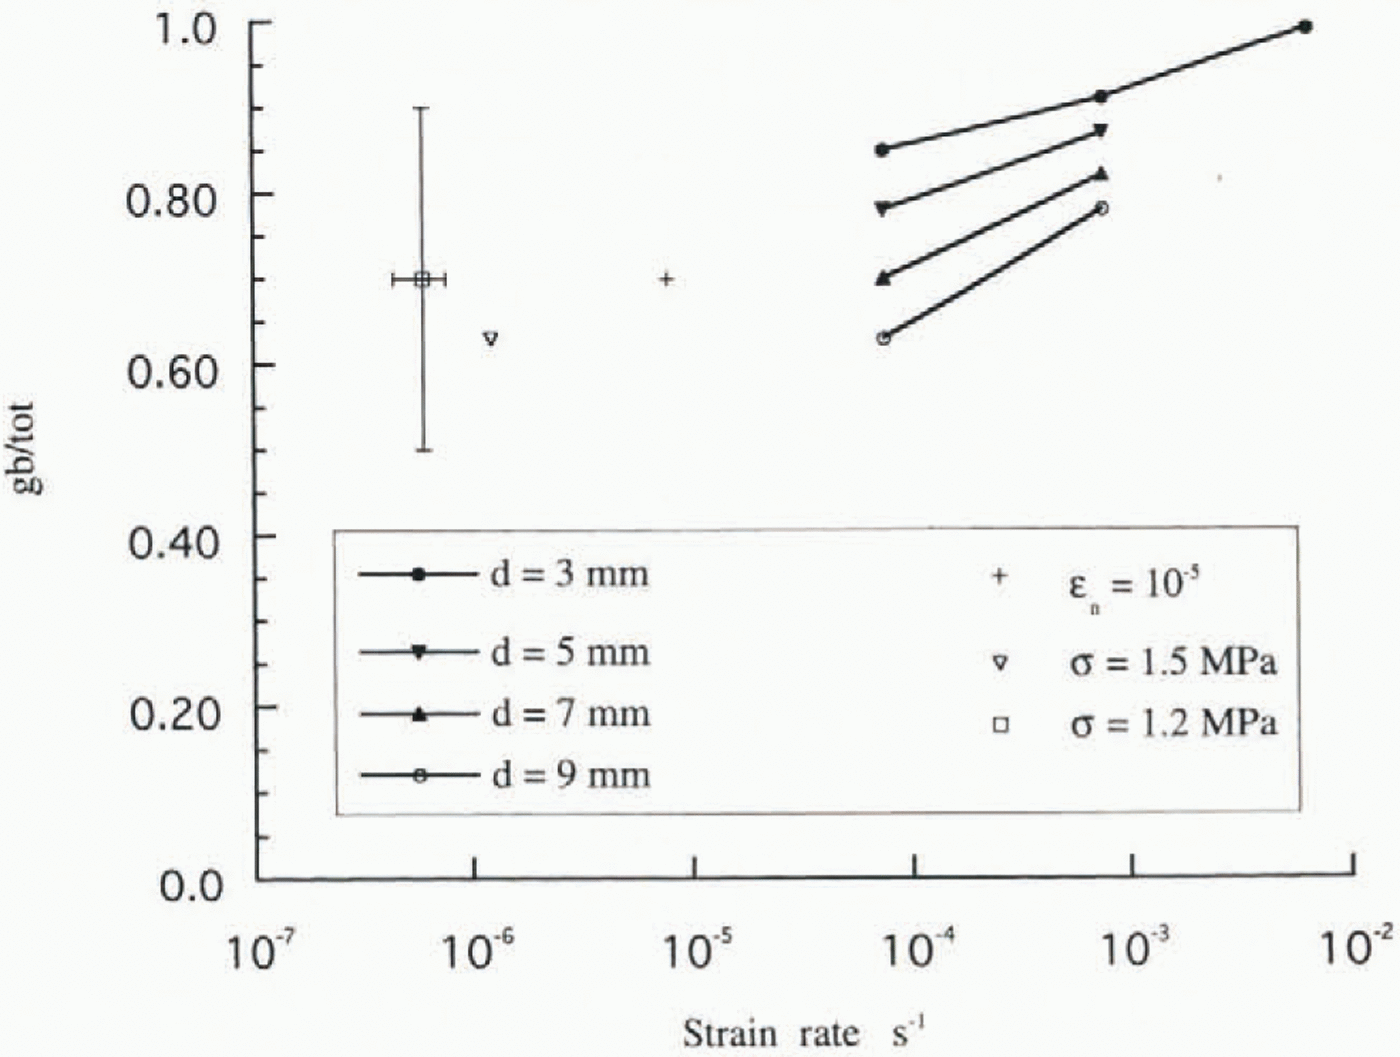
The linear regression equation for the grain-size dependence for gb/tot was used to calculate the mean ratio for eachnominal strain rate and grain-sizes of 3, 5, 7 and 9 mm. The resulting dependence of the mean ratios on actual average strain rate is shown in Figure 2. Because of the great scatter in the data for the nominal rate of 10−3s−1, [Table 1] only the average value for all grain-sizes is plotted for this rate. The mean of the ratios for the two specimens tested at the nominal rate of 10−2s−1is included. One hundred and thirty cracks were measured for these specimens, of which one was tr–gb and all the others were grain-boundary with at least one edge at a triplepoint. The specimens had an average grain-size of 3.6 and 2.3 mm, with a mean value of about 3 mm. The plot shows that the gb/tot ratio for all grain-sizes tends to 1 at a strain rate of about 10−2s−1.
Strain-rate dependence for the crack ratio, gb/tot, for given grain-size and constant strain-rate tests (T = −10°C) and constant-load tests (T = −9.5°C). The bars for the grain-boundary cracksfor the load condition σ = 1.2 MPa give the range in the ratio and the strain rate for 17 tests.

Observations on grain-boundary and transcrystalline cracks were made in earlier studies using the same type of ice, but with a constant compressive stress applied perpendicular to the long direction of the grains. The average grain-size for this ice was 1.4–3.1 mm, and the tests were carried out at a temperature of −9.5°C. Some tests,not previously reported, were carried out to strains in the same range as applied in the present work. One specimen was strained to 6.0 × 10⁻⁴at an average rate of 1.25 × 10⁻⁶s−1, by a stress of 1.5 MPa. The value of the ratio found for this test is given in Figure 2, along with the mean of the ratio for 17 specimens subjected to a strain of 4.4 × 10⁻⁴to 8.5 × 10⁻⁴, imposed at an average rate in the range of 4.2 × 10⁻⁷to 7.3 × 10⁻⁷s−1, by a stress of 1.2 MPa.
The combined crack populations for three specimens of average grain-size about 3 mm, strained in the earlier study to about 50 × 10−4under a constant stress of 0.7 MPa and average strain rate of 1.46 × 10⁻⁷s−1, had a gb/tot ratio of 0.62. It was found that when columnar-grain ice of average grain-size in the same range was strained to about 10−2under a constant stress of 1 MPa or lower, the ratio was about 0.25 (Reference GoldGold, 1960, Reference Gold1966, Reference Gold1972a, Reference Goldb). It is clear that the relative proportion of grain-boundary cracks at a strain of about 6 × 10⁻⁴decreases with decreasing strain rate and, in the ductile range of behaviour, decreases with increasing strain. Reference Kalifa, Ricard, Sinha, Sodhi and ChungKalifa and others (1989)found a similar decrease with decreasing strain rate for granular ice strained at rates greater than 10−4s−.
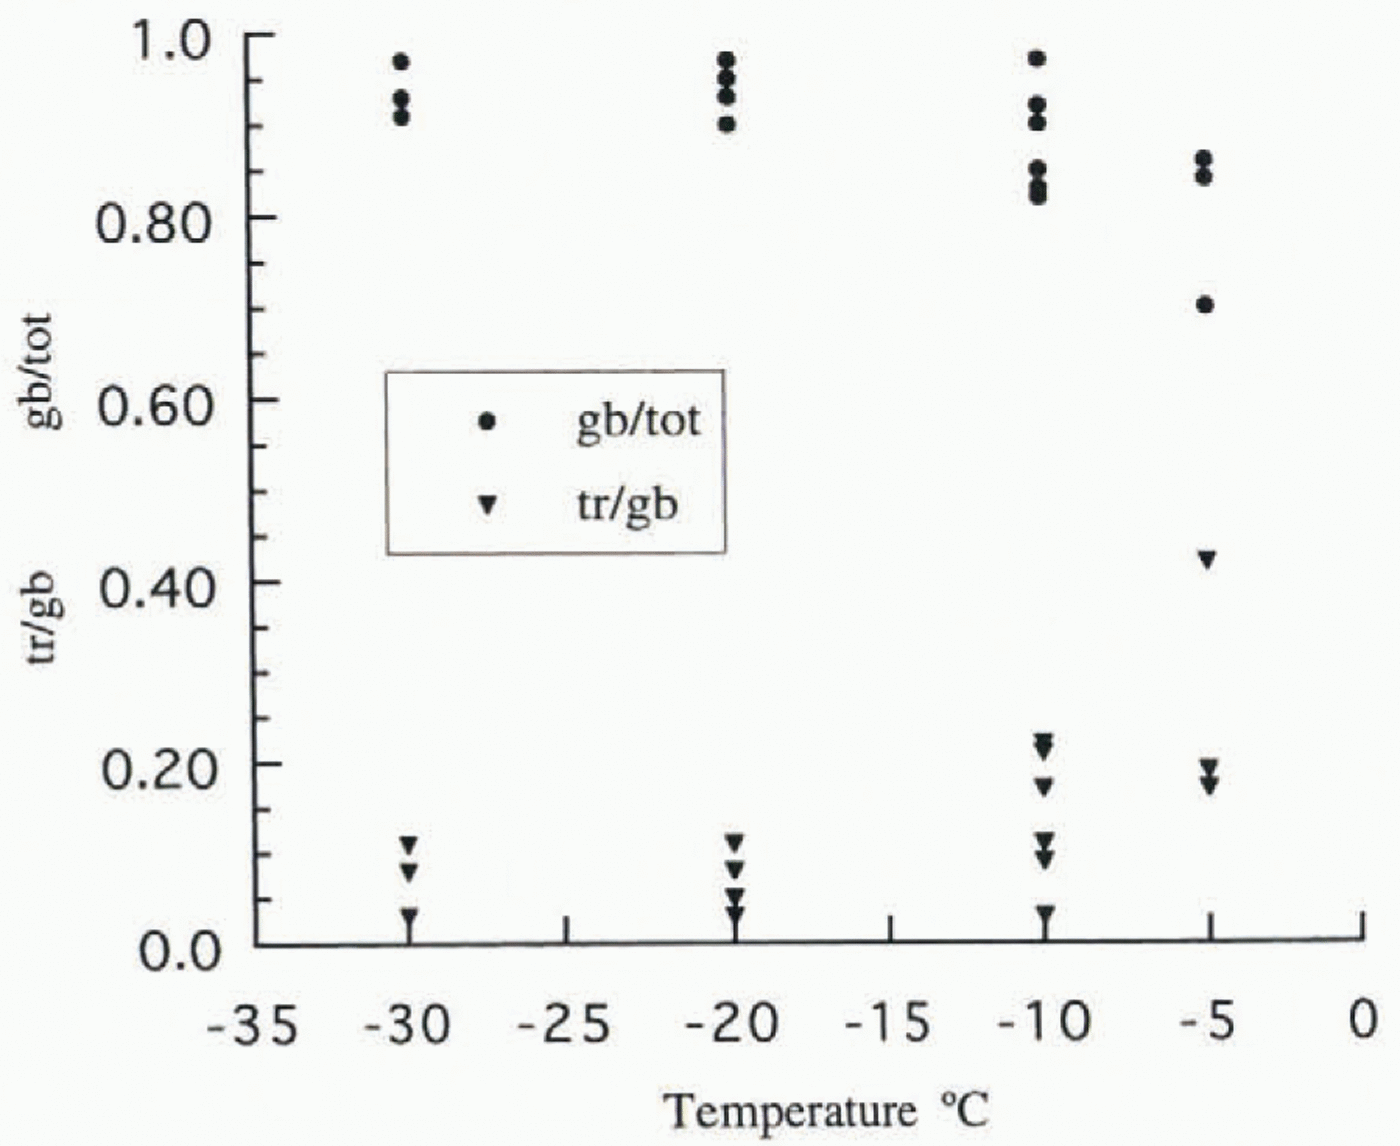
The gb/tot and transcrystalline to grain-boundary (tr/gb) ratios for the tests at temperatures of −5°, −20° and −30°C are plotted in Figure 3. One test at −5°C had to be deleted because the specimen broke during the test, and one at −30°C because there were too few cracks. The values for −10°C are for six specimens with average grain-size in the range 3.4–5.1 mm, tested at the nominal strain rate of 10−3s−1. The limited number of tests suggest a tendency for gb/tot to increase with decreasing temperature.
Temperature dependence of the crack ratios, gb/tot and tr/gb; ![]() εt~ 6 × 10⁻⁴; grain-size in the range 2.9–6.2 mm.
εt~ 6 × 10⁻⁴; grain-size in the range 2.9–6.2 mm.

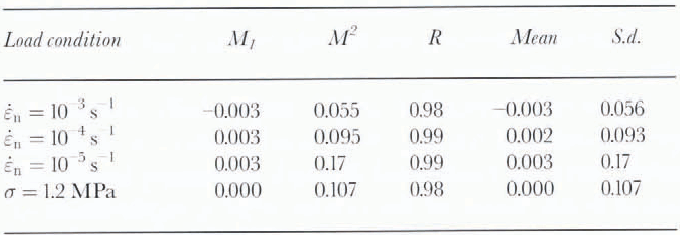
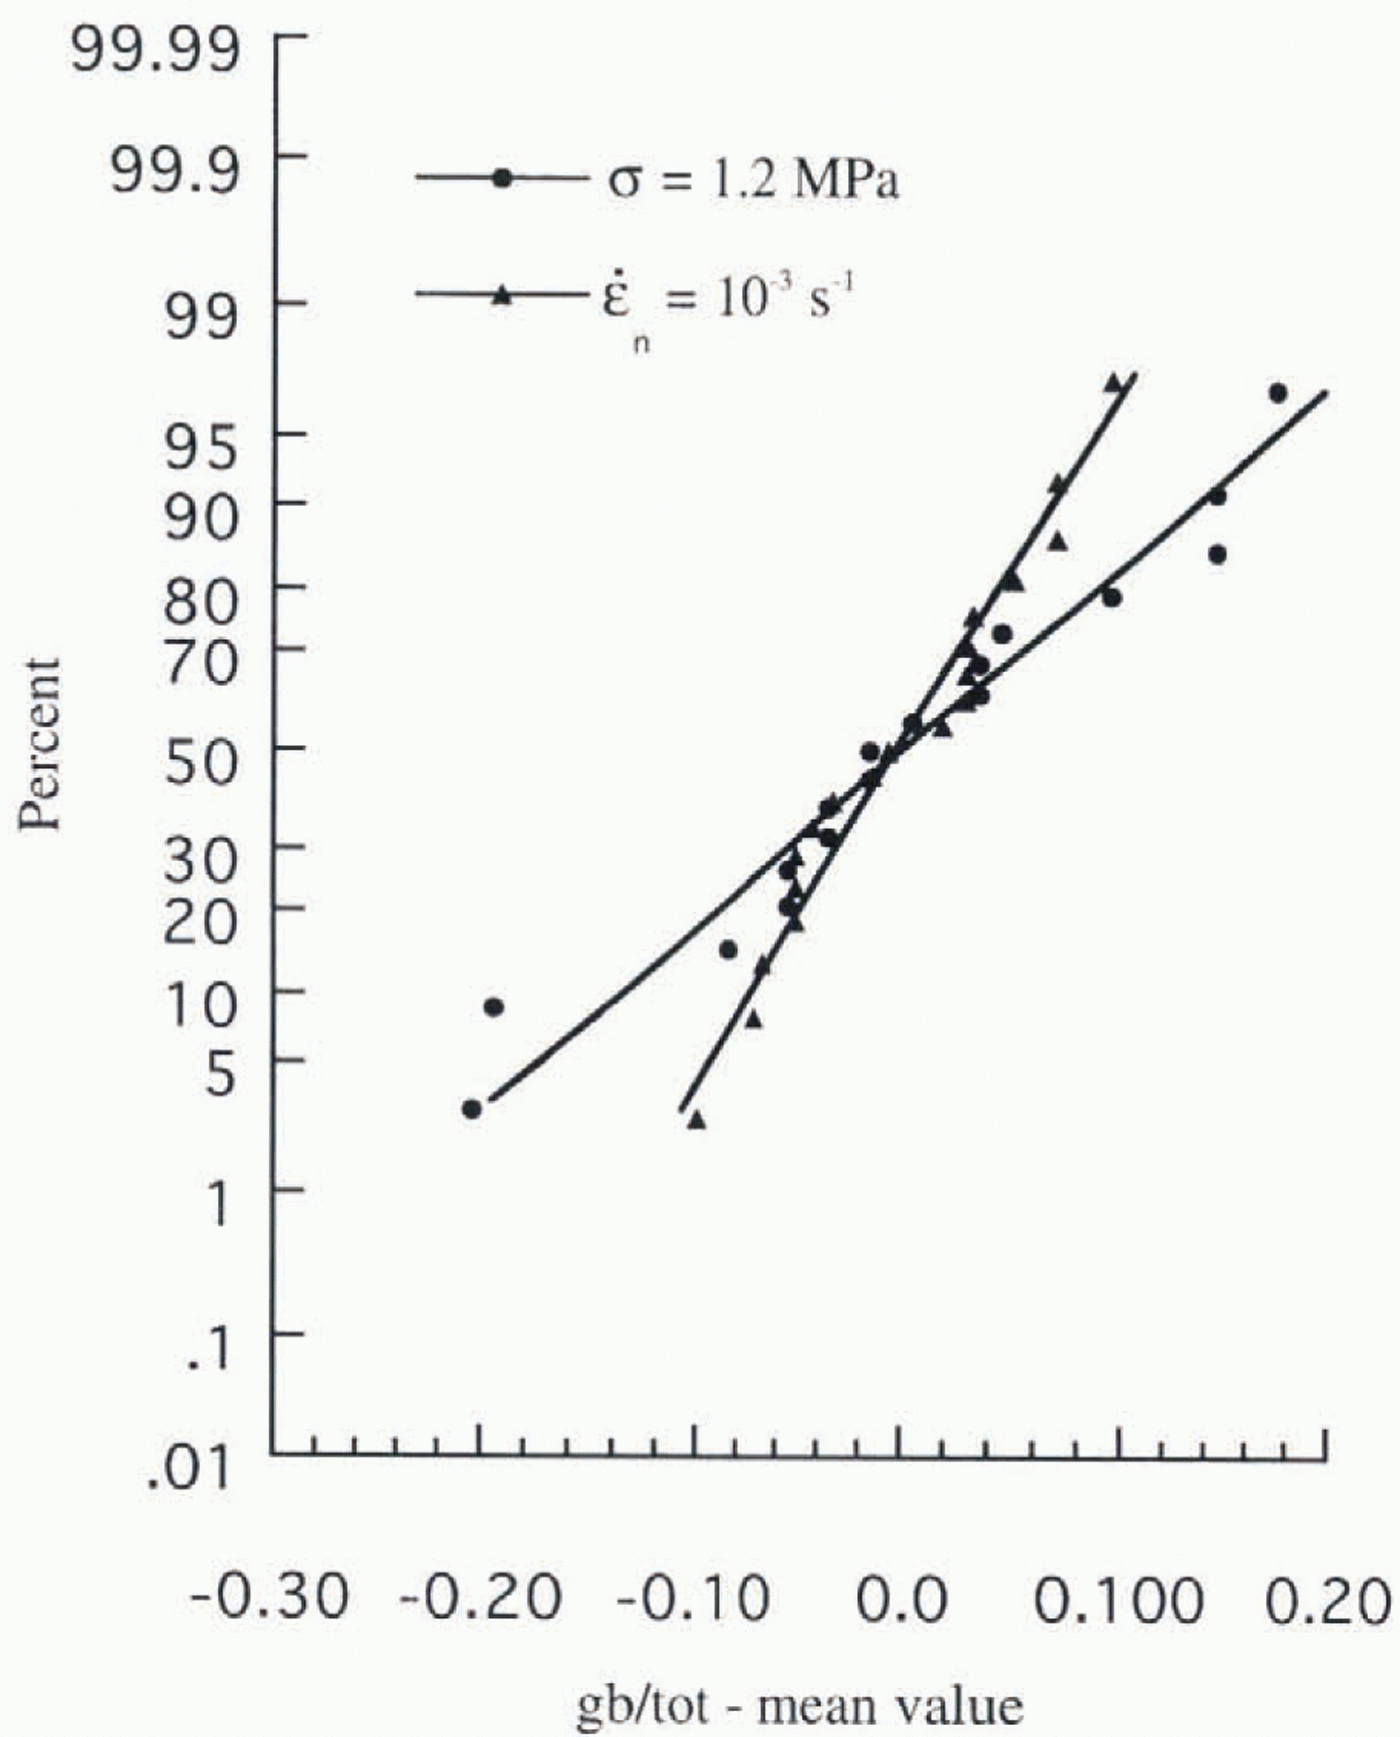
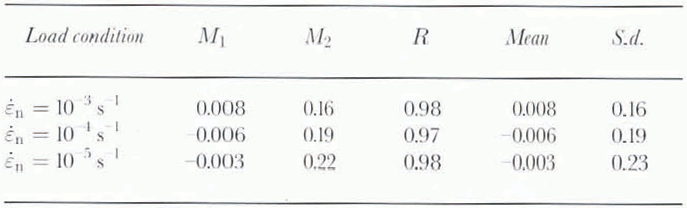
The difference between the observed value for gb/tot and the mean value was determined for the 17 tests conducted under a constant load of 1.2 MPa, and for the tests carried out at the nominal strain rates of 10−3, 10−4and 10−5s−1. For the latter group, the mean value for each speci-men average grain-size was calculated from the linear regression equations given in Table 1. Figure 4presents on a normal probability coordinate system the differences for the constant-load case and for the nominal strain rate of 10−3s−1. Shown also are the lines from a linear regression analysis of the percentage of specimens with differences less than or equal to a given value, using an exponential curve fit. The defining characteristics, M1and M2,and correlation coefficient for the exponential curve are summarised for each condition in Table 2, along with the means and standard deviations determined from a statisticalanalysis of the differences. M1and M2have values that agree very closely with the corresponding means and standard deviations.
The defining constants, M1and M2and the correlation coefficient, R, from an exponential curve to the differences, plotted on normal probability coordinates, between the actual and mean values of the ratio of grain-boundary to total cracks for the 17 tests with a constant stress of 1.2 MPa (T = −9.5°C), and for the actual and corresponding mean values determined from the grain-size dependence given in Table 1, for the constant-strain-rate tests (T = 10°C). Given also are the corresponding means and standard deviations (S.d.) from a statistical analysis of the differences; εt~ 6 × 10⁻⁴.

The difference, plotted on normal probability coordinate, between the observed value of the crack ratio, gb/tot, for each test, and the mean value for the constant-load condition of σ = 1.2 MPa (T = −9.5°C), and the mean value, corresponding to the grain-size, determined from the linear regression equation for ![]() The lines were obtained by an exponential curve fit to the results; εt~ 6 × 10⁻⁴
The lines were obtained by an exponential curve fit to the results; εt~ 6 × 10⁻⁴

5.2. Crack length
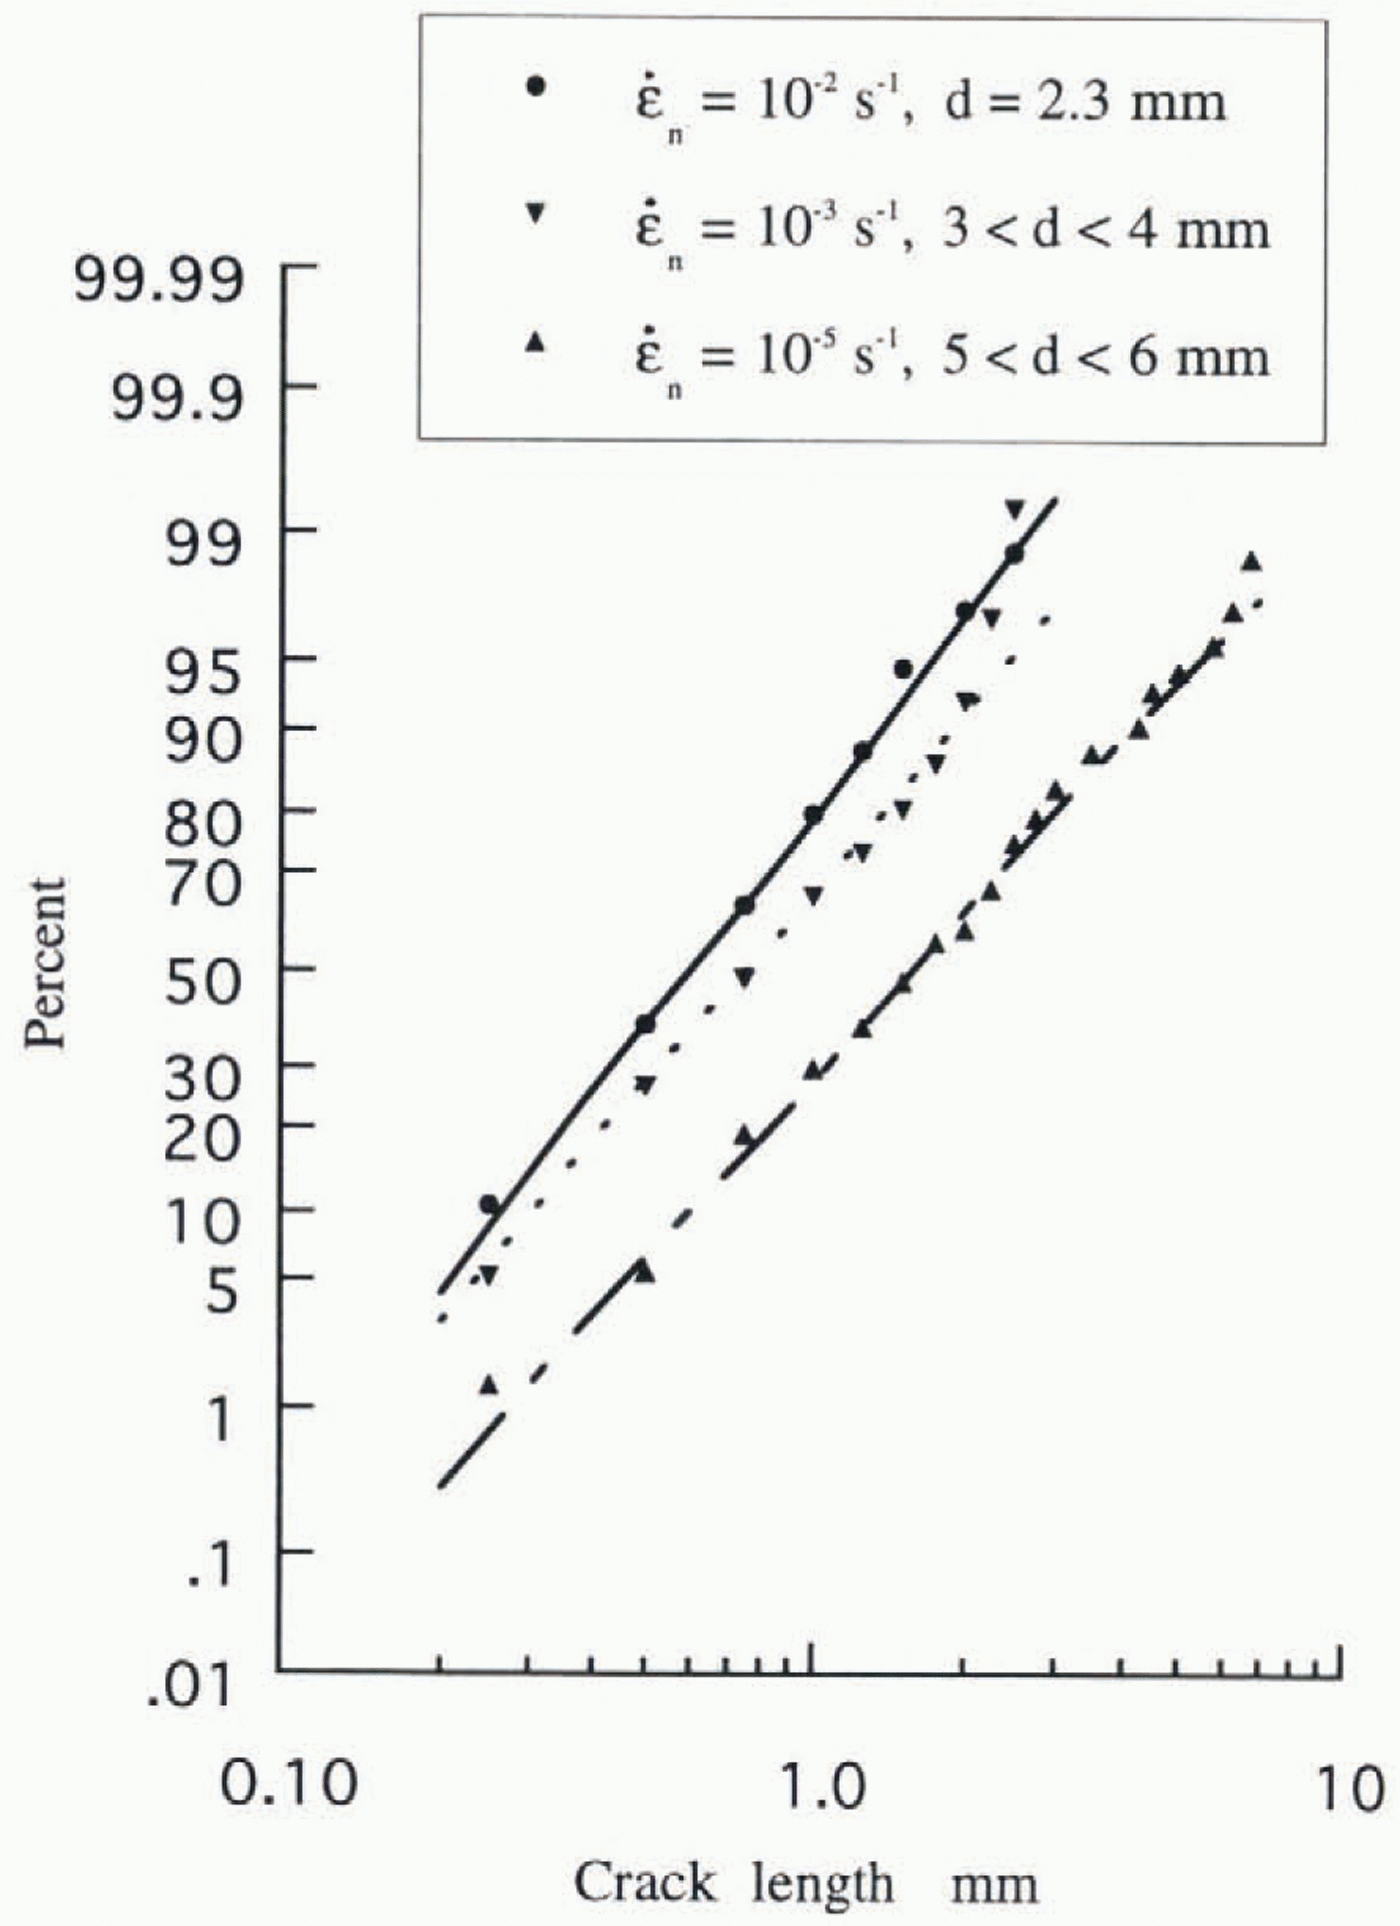
It was observed in the earlier constant-load tests (Reference GoldGold, 1972a) that the distribution in the length of all cracks formed in columnar-grain ice in a given strain of less than 15 × 10−4was described quite well bythe log-normal distribution. This was found to be the case also for both the grain-boundary, and transcrystalline cracksformed under constant strain-rate conditions. Figure 5shows on a log-normal probability coordinate system the distribution for 75 grain-boundary cracks formed in the specimen of 2.3 mm average grain-size, strained at the nominal rate of 10−2s−1.
Grain-boundary crack lengths, plotted on log-normal probability coordinates, for one specimen at ![]() for all specimens in the grain-size range of 3–4 mm,
for all specimens in the grain-size range of 3–4 mm, ![]() and for all specimens in the grain-size range 5–6 mm,
and for all specimens in the grain-size range 5–6 mm, ![]() The maximum stress and range in maximum strain are given in Table 3for each rate; T = −10°C.
The maximum stress and range in maximum strain are given in Table 3for each rate; T = −10°C.

The total number of grain-boundary cracks measured for each test at the nominal rates less than 10−2s−1was usually less than 40, and so specimens were grouped by average grain-size in ranges of 1 mm.cracks for all specimens in a given range were combined to obtain a larger statistical sample. Results for the specimensin the grain-size ranges 3–4 and 5–6 mm, tested at the nominal rates of 10−3and 10−5s−1, respectively, are presented in Figure 5. Thelines shown in the figure were obtained by statistical analysis of the crack lengths. Table 3presents the number of cracks measured for each grain-size range, and the logarithmic mean crack length (LMCL), c, and standard deviation for the population. Application of the X2test showed for each range that this parameter wasless than the critical value at the 5% level of significance, i.e., in no case was the hypothesis of a log-normal distribution rejected at that level of confidence.
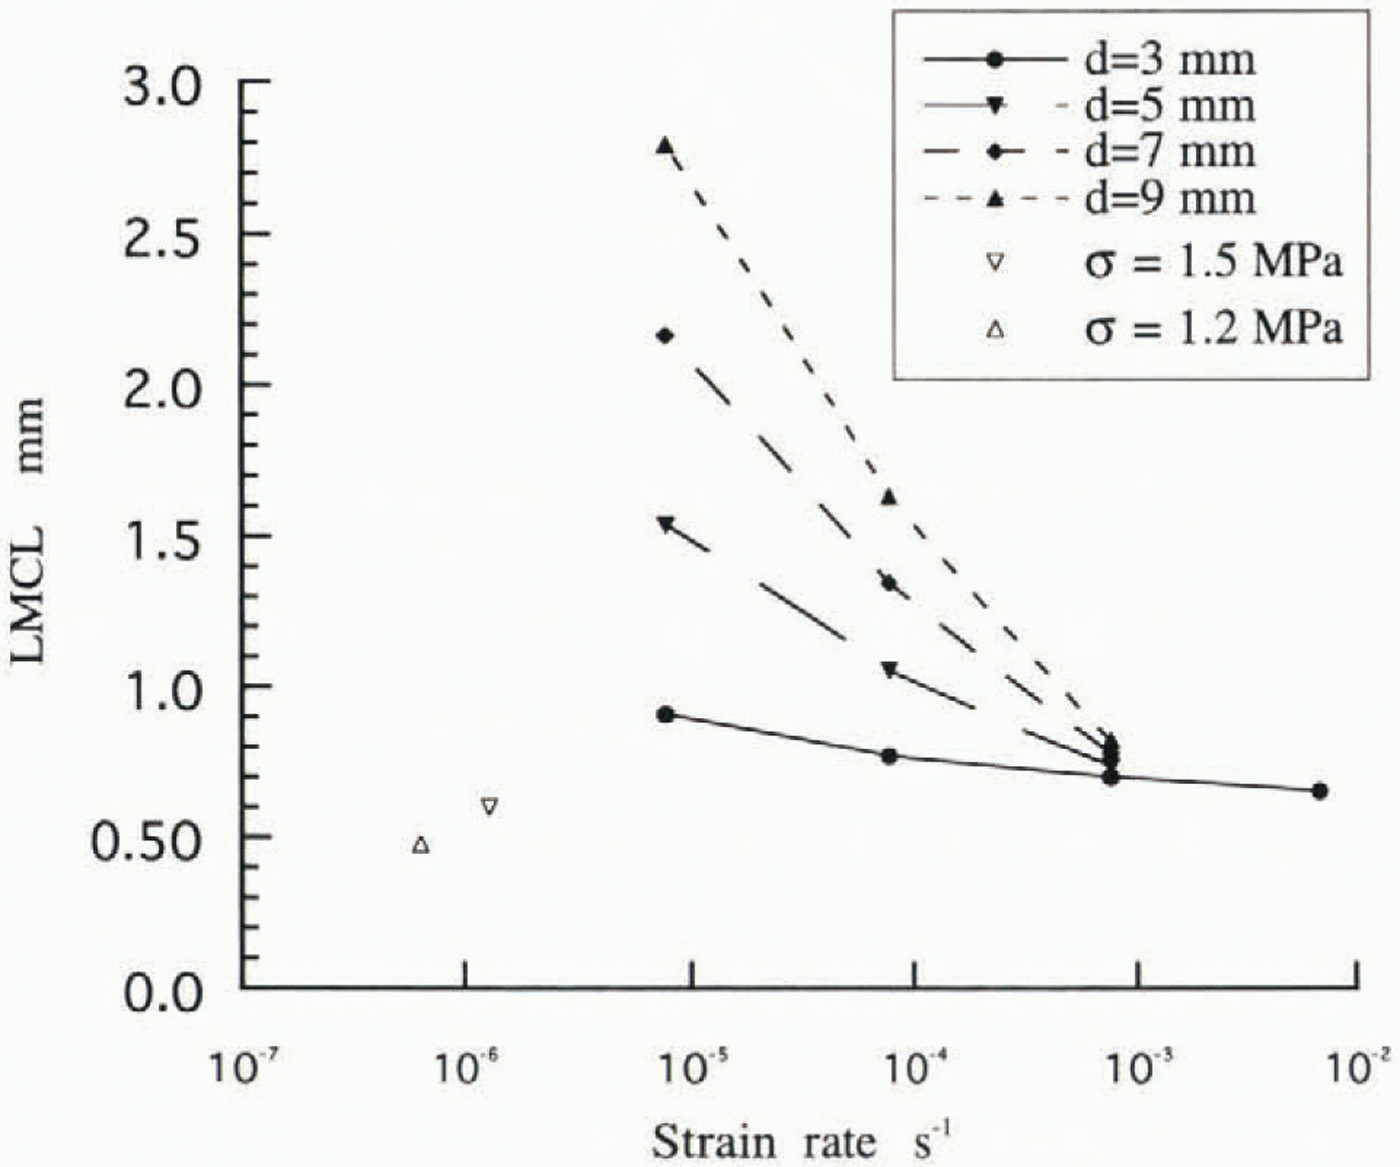
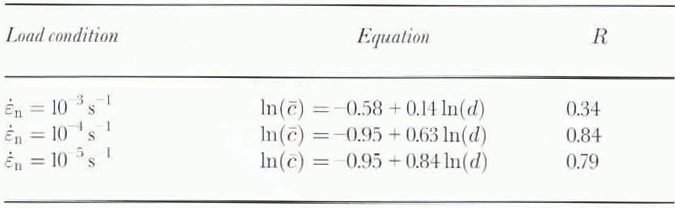
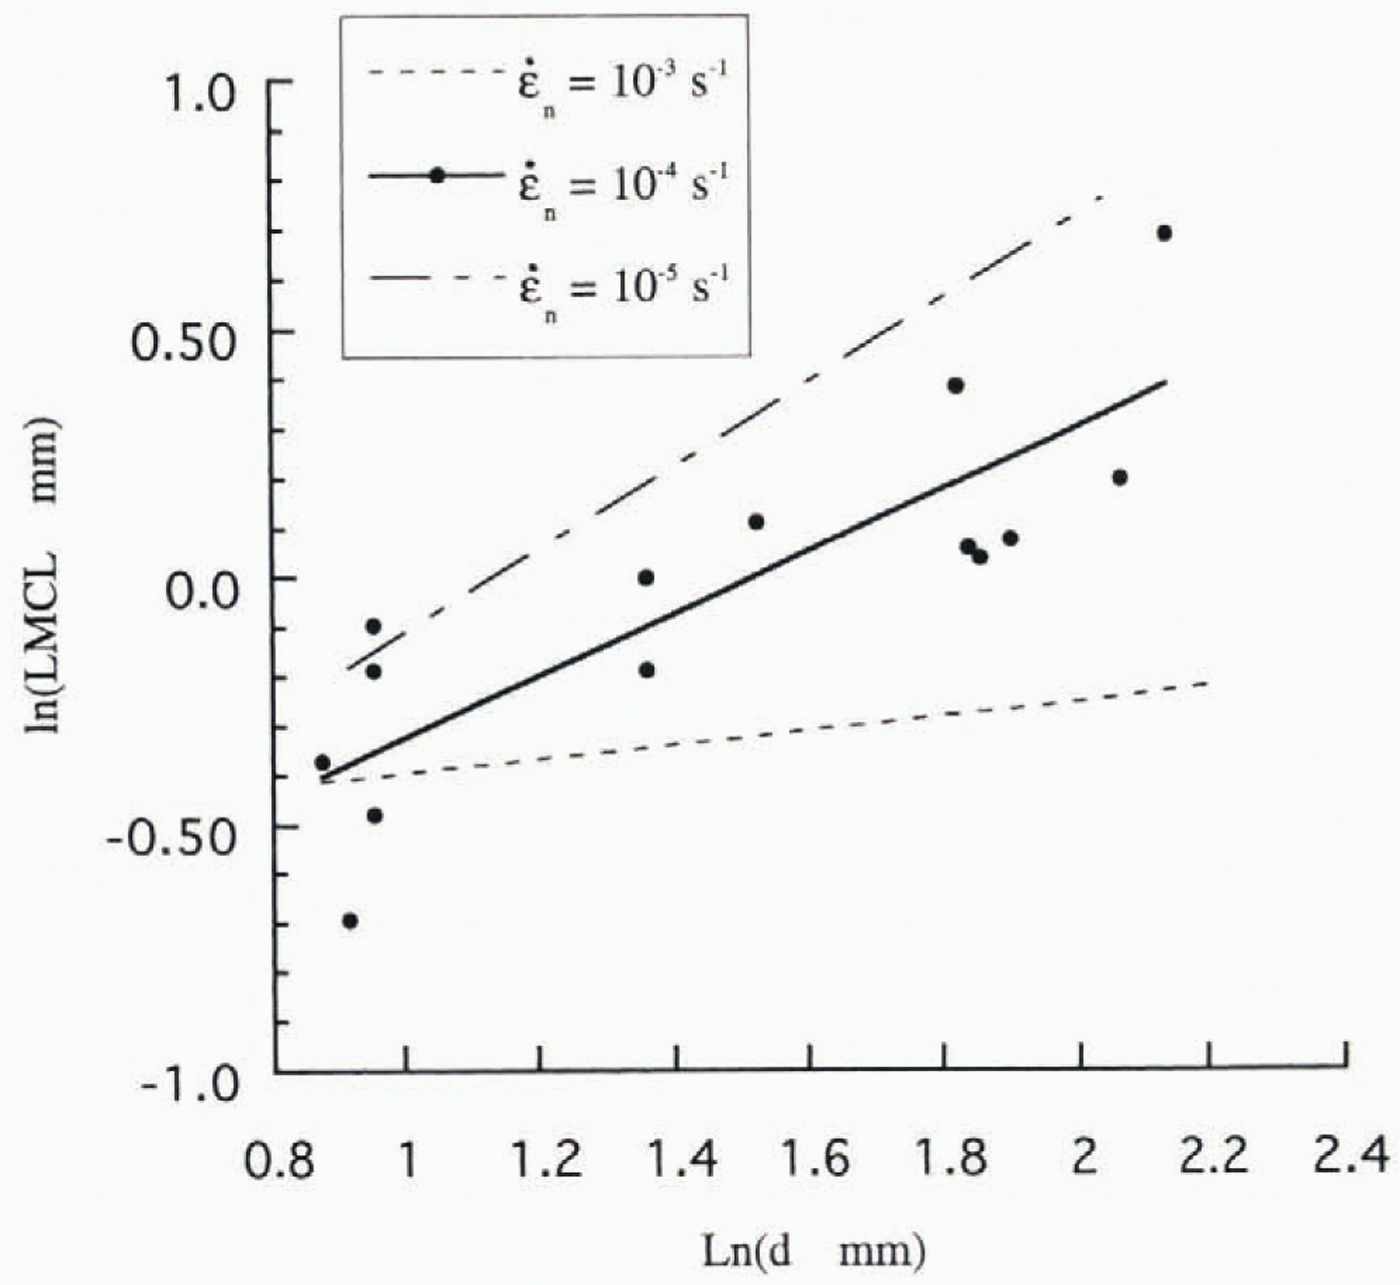
The specimen values of the log-normal distribution (In) of the grain-boundary LMCL for tests at the nominal rate of 10−4s−1are plotted against the In of the grain-size in Figure 6, along with the line obtained by a linear regression analysis. Shown as well are the lines from a linear regression analysis of the Specimen values of the LMCL for the nominal rates 10−3and 10−5s−1. The corresponding equations and correlation coefficients are given in Table 4. These equations were used to calculate the mean LMCL for grain-sizes of 3, 5, 7 and 9 mm,and the resulting values are plotted against actual strain rate in Figure 7. Included also are the means of the LMCLs for the tests conducted under constant-load conditions and for the two tests at the nominal rate of 10−2s−1, all with average grain-size about 3 mm. The results for this average grain-size indicate a maximum in the strain-rate dependence of the LMCL at a rate of 10−5to10−6s−1.
Strain-rate dependence of the grain-boundary LMCL, c, for a given grain-size; T = −10°C for the constant-strain-ratetests; T = −9.5°C and d ~3 mm for the constant-load tests at 1.2 and 1.5 MPa; εt~ 6 × 10⁻⁴.

Linear regression equations and correlation coefficients, R, for the grain-size dependence of the LMCL, c(mm), for given nominal strain rate, ![]() εt~ 6 × 10⁻⁴; T = −10°C; d is in mm
εt~ 6 × 10⁻⁴; T = −10°C; d is in mm

Dependence of the ln of the grain-boundary LMCL, c, on the ln of the grain-size, d, for the constant-strain-rate tests; individual values are shown for ![]() T = −10°С. The linear regression line is shown for each strain rate, and their equation and correlation coefficient are presented in Table 4.
T = −10°С. The linear regression line is shown for each strain rate, and their equation and correlation coefficient are presented in Table 4.
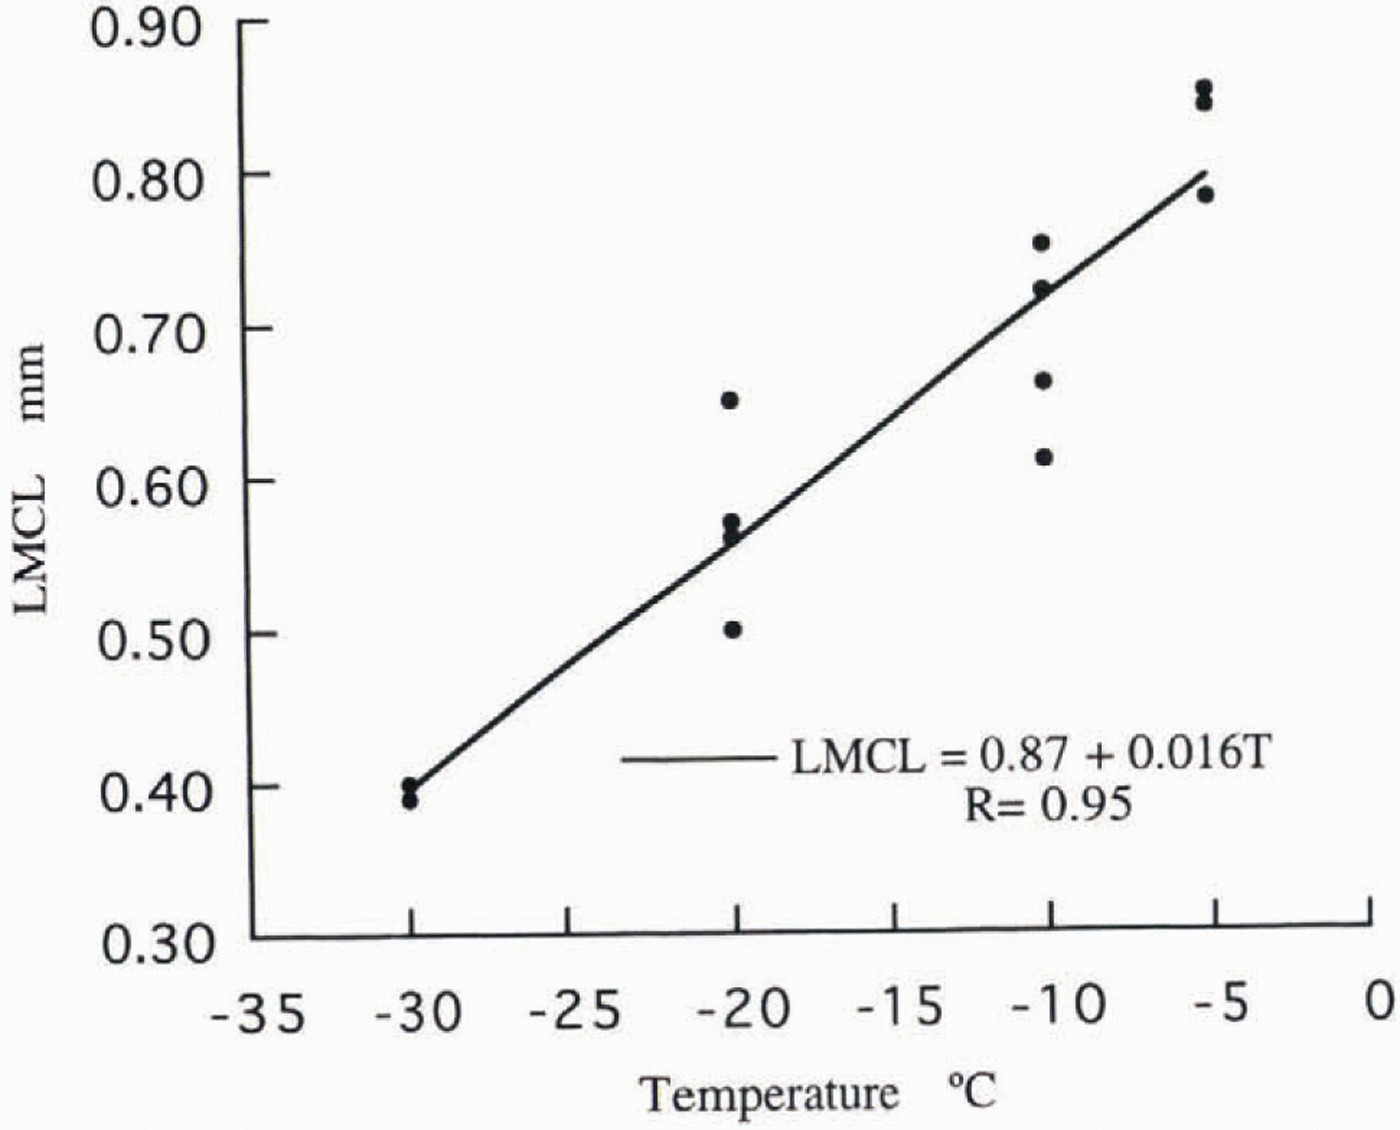
The grain-boundary LMCLs determined for the tests conducted at −5°, −20° and −30°C are presented in Figure 8. Included also are the LMCLs for the six specimens, tested at −10°C, that were used in the presentation of the dependence of the crack ratios on temperature, and the linear regression equation giving the dependence of the grain boundary LMCL on temperature. Only four data points appear for −10°C, as there were two specimens with a LMCL of 0.66 mm and two with a LMCL of 0.75 mm. All tests were conducted at the nominal rate of 10−3s−1, and the grain-size of eachspecimen was in the range 2.9–6.2 mm.
Temperature dependence of the grain-boundary LMCL, c; ![]() εt~6 × 10⁻⁴, and grain-size is in the range 3.2–6.2 mm. The linear regression line and its equation are presented, along with the correlation coefficient, R.
εt~6 × 10⁻⁴, and grain-size is in the range 3.2–6.2 mm. The linear regression line and its equation are presented, along with the correlation coefficient, R.

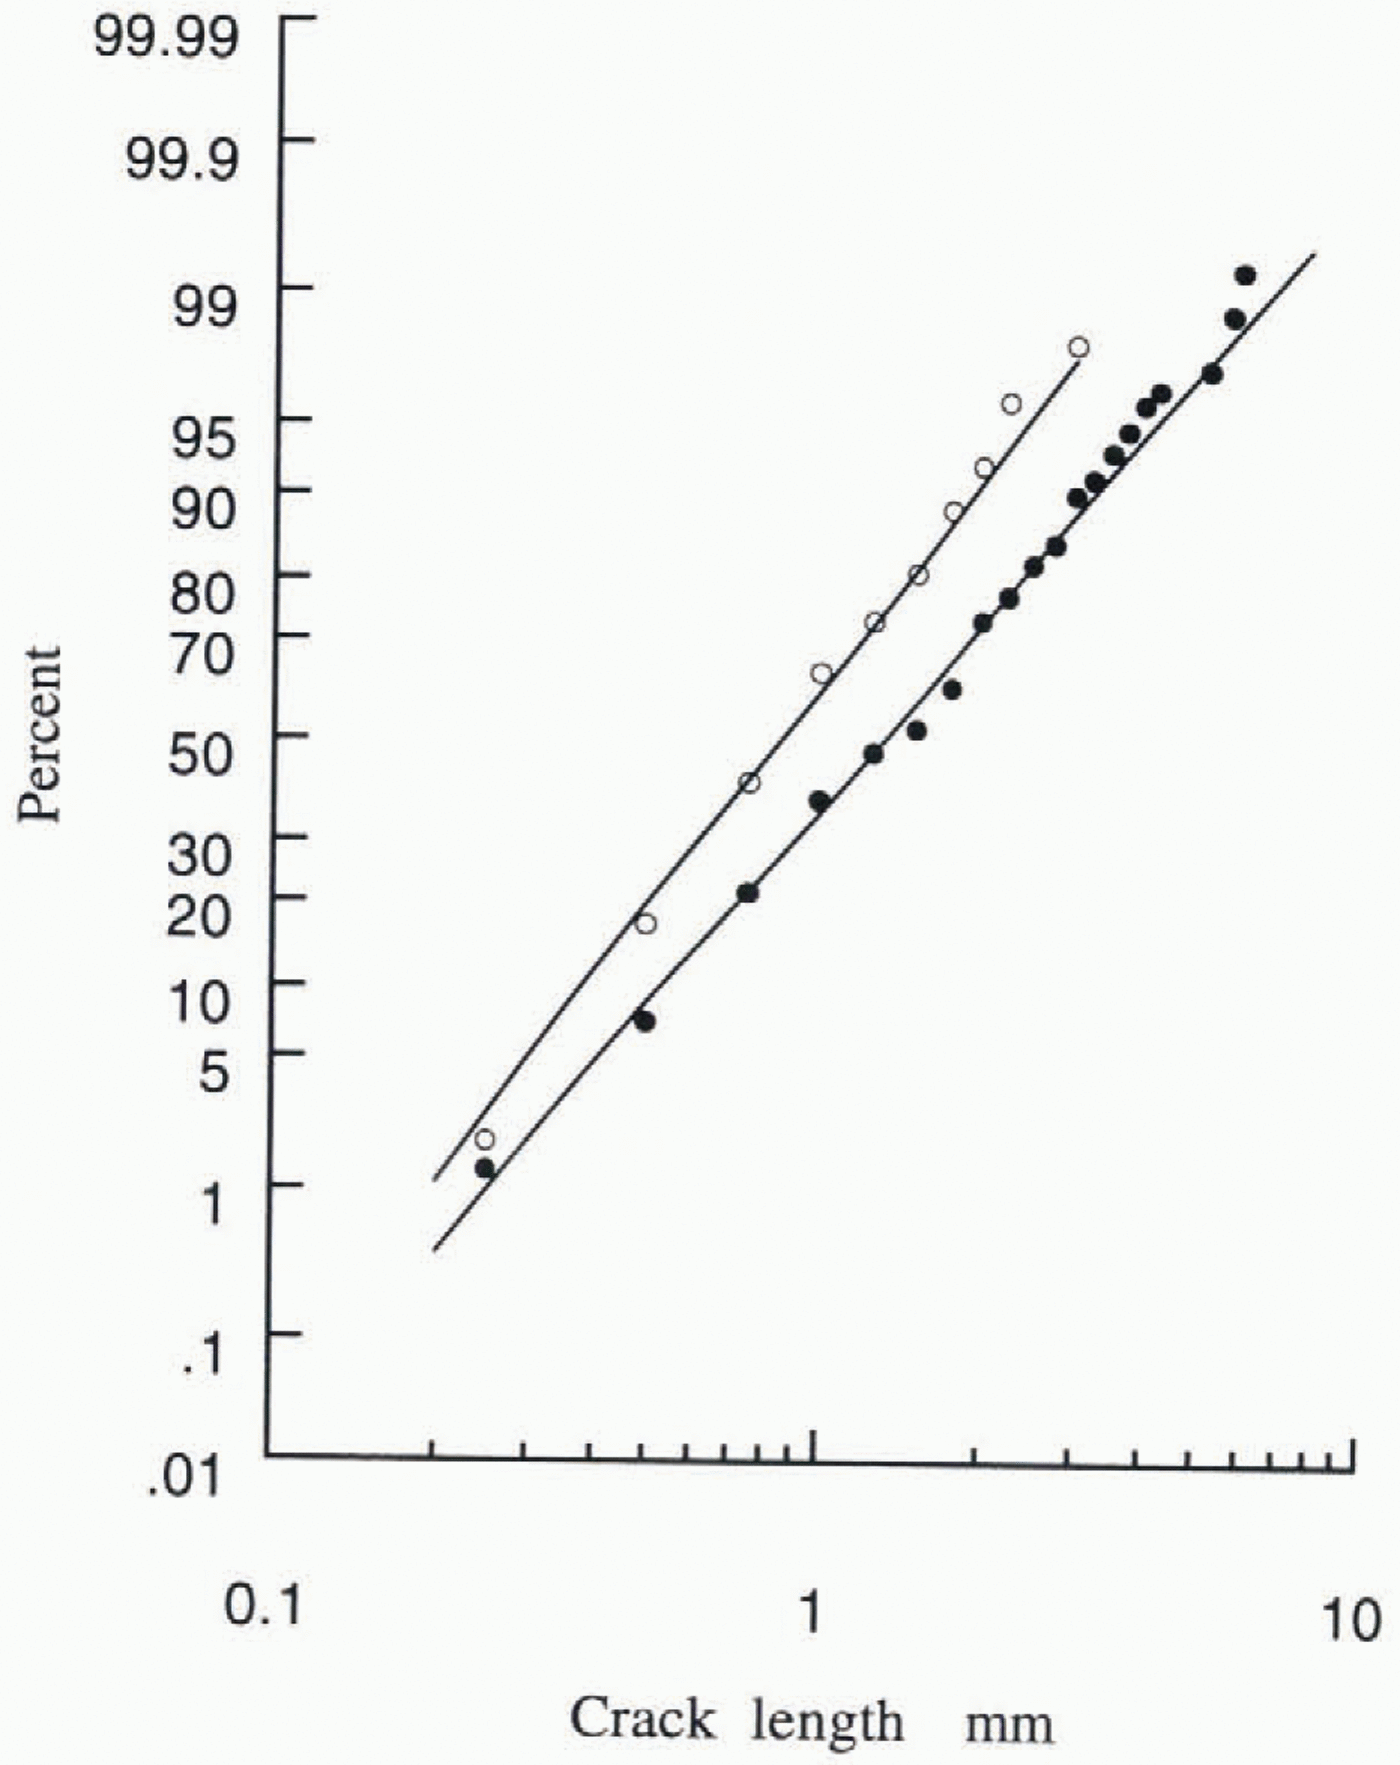
There were not enough transcrystalline cracks per specimen to carry out the same crack-length analysis as was done for the grain-boundary cracks. The lengths of the trans- crystalline cracks for all specimens tested at a given nominal strain rate at −10°C were combined for specimens of grain-size < 5 mm and of grain-size > 5 mm. The tr–gb cracks were included, as was done for the crack-type analysis. Figure 9 presents two sets of results on a log-normal coordinate system, along with the lines determined from the statistical analysis of the logarithms of the crack lengths. The LMCL and standard deviation for all the sets are presented in Table5. This table indicates that the LMCL for the transcrystalline cracks of specimens of grain-size < 5 mm, including those for the tests under constant loads of 1.2 and 1.3 MPa, [Figure 9] have a maximum at a strain rate of 10−5to 10−6s−1, similar to thatfor the grain-boundary cracks.
Transcrystalline crack lengths, plotted on log-normal probability coordinates, for all specimens of grain-size > 5 mm, ![]() (º), and for all specimens of grain-size <5 mm,
(º), and for all specimens of grain-size <5 mm, ![]() (•); εt~ 6 × 10⁻⁴; T = −10°C
(•); εt~ 6 × 10⁻⁴; T = −10°C

The transcrystalline cracks were combined for the tests at each of the temperatures −5°, −20° and −30°C, and for the specimens tested at −10°C that were used in the presentation of the temperature dependence of the LMCLs (Fig. 8). There were only ten transcrystalline cracks at −20°C andnine at −30°С. A linear regression analysis gave
where Tis the temperature in °C and the LMCL is in mm. This dependence is similar to that foundfor the grain-boundary cracks.
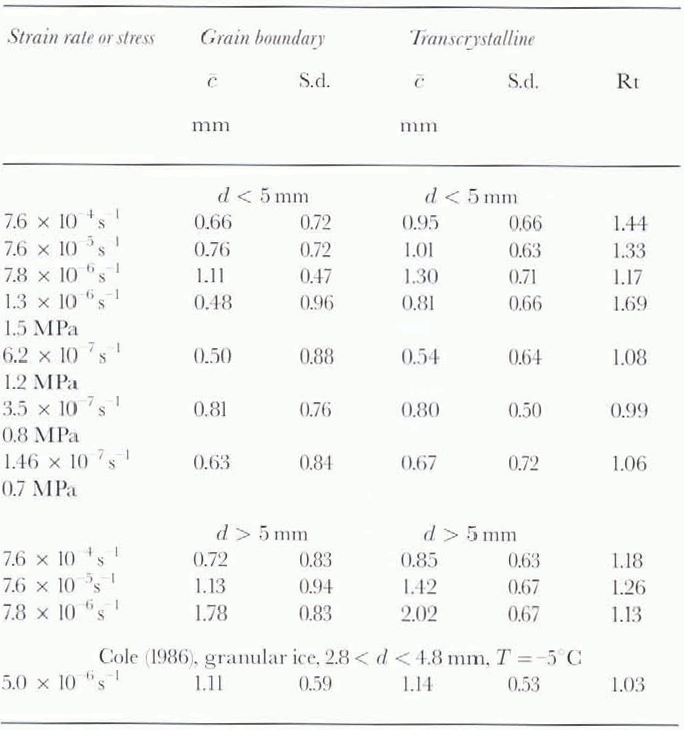
The grain-boundary crack-length measurements for all specimens of grain-size < 5 mm and for grain-size > 5 mm were combined for each of the nominal strain rates 10−3, 10−4and 10−5s−1. The mean and standard deviation from the statistical analysis of the logarithms of the crack lengths are presented in Table 5. Presented also are the characteristics of the grain-boundary and transcrystalline crack populations for the tests carried out under constant stresses of 0.7, 0.8, 1.2 and 1.5 MPa. The mean LMCL for the transcrystalline cracks is larger than for the corresponding grain-boundary cracks in each case except one, but the relative difference tends to decrease with decreasing strain rate.
Table. 5. LMCL, c, and standard deviation, S.d. (ln (mm)), for the log-normal distribution fit to the lengths of transcrystalline and grain-boundary cracks in data sets of specimens of grain-size, d, < 5 mm and > 5 mm, for given average strain rates and strain of about 6 × 10⁻⁴, except for stress of 0.8 MPa (εt= 35 × 10−4), stress of 0.7 MPa (εt~53 × 10−4) and Reference ColeCole (1986)(εt>25 × 10−4); T = −10°C (constant-strain-rate tests), = −9.5°C (constant-load tests), = −5°C (Reference ColeCole, 1986); Rt is the ratio of the transgranular mean crack length to the corresponding grain-boundary value
The difference between the actual value of the grain-boundary LMCL and the mean value determined from the linear regression equations for the grain-size dependence, given in Table 4, was calculated for each test for the nominal rates 10−3, 10−4and 10−5s−1in the same manner as was done for the grain-boundary crack ratios. Table 6gives the defining characteristics, M1and M2and the correlation coefficients from a linear regression analysis for an exponential curve fit to the percentages and differences plotted on nor-mal probability coordinates. Given also are the means and standard deviations from a statistical analysisofthe differences. M1and M2agree closely with the corresponding means and standard deviations, as was the case for the crack ratios. This agreement in the results of the regression analysis and the statistical analysis for both the crack ratios and the LMCLs indicates that the variations in the differences between specimens, for the same test conditions, can be described with a high level of confidence by the normal distribution. The ratios and the LMCLs behave as random variables. This behaviour is consistent with the relative crystallographic orientation of adjacent grains having a random distribution.
The defining characteristics, M1and M2, and the correlation coefficients, R, from an exponential curve fit to the differences, plotted on normal probability coordinates, between the test values of the grain-boundary logarithmic mean crack length and the corresponding mean value determined from the linear regression equations given in Table 4. Given also are the corresponding means and standard deviations (S.d.) from a statistical analysis of the differences; ε ~ 6 × 10⁻⁴; T = −10°C

6. Discussion
The maximum strain imposed on each specimen was 4.1 × 10⁻⁴to 6.6 × 10⁻⁴for nominal strain rate greater than 10−4s−1, and 4.2 × 10⁻⁴to 9.6 × 10⁻⁴for the nominal rate 10−5s−1. It was found that the elastic modulus increased with grain-size (Reference GoldGold, 1994), and as the maximum stress was always the same for each nominal strain rate, this would account for some of the spread in values. There was a tendency for the crack-length distribution curves to curl upward at the upper end, indicating a smaller number of longer cracks than would be predicted by a log-normal distribution. The tendency was greater for the transcrystalline than for the grain-boundary cracks. This would be expected if the length of cracks was limited by the length of the grain boundary or the size of the grains. The length of a crack was not fully uniform, also, but no attempt was made to relate the measured value to a mean value. In spite of these factors, the log-normal distribution was a reasonable approximation to the observed distribution.
Reference ColeCole (1986)presented histograms giving the lengths of grain-boundary and transcrystalline cracks formed in granular-ice specimens subjected to creep under constant load at −5°C. Crack lengths, obtained from the histograms,were combined for four specimens of grain-size 2.8–4.6 mm, strained to 25 × 10−4to 100 × 10−4at a minimum rate of 2.1 × 10⁻⁶to 8.5 × 10⁻⁶s−1. The log-normal distribution was found to be a reasonable description for both the grain-boundary and the transcrystalline crack populations. Their mean and standard deviation are given in Table 5.
Reference ColeCole (1988)has shown that for strain rate greater than about 10−5s−1, there is insufficient time during a strain of less than 10−3for dislocation pile-ups to be a significant process for crack initiation in ice. For such strain rates, recoverable strain in grain boundaries and grains, as demonstrated by the anelastic or delayed elastic behaviour (Reference SinhaSinha, 1979; Reference Cole and SodhiCole, 1991, Reference Cole1993; Reference GoldGold, 1994), as well as anisotropy in the elastic constants, would appear to be more appropriate reasons for the formation of cracks. For both these situations,stress concentrations can be expected to develop at the triple points (Reference Tvergaard and HutchinsonTvergaard and Hutchinson, 1988). These locations,therefore, would be preferred sites for the formation of cracks, as was found for the grain-boundary cracks.
When considering criteria for crack formation, a necessary condition is that the elastic strain energy available for the event at the time of initiation is greater than or equal to the new crack surface area times the effective surface energy. Because the imposed strain in the present work is essentially two-dimensional, the length of a crack would be a direct measure of that energy.
Reference Frost and SmithFrost and Smith (1993)have investigated the crack nucleation process for grain-boundary cracks in columnar-grain iceusing an elastic analysis and the method employed by Reference Tvergaard and HutchinsonTvergaard and Hutchinson (1988). They show that the energy at nucleation is given by:
where Unuelis the energy required for the formation of a crack of lenglh 2acrit, Jnuelis the strain-energy release rate at the time of formation (Jnuel≥ 2γgb,, where γgbis the grain-boundary energy) and λ is the exponent giving the strength of the singularity at the precursor tip. The value of λ in their analysis is determined by the geometry and relative crystallographic orientation of the grains forming atriple point, and the values of the elastic constants of the ice crystal. Reference Gupta and FrostGupta and others (1993), using the same methodof analysis, have shown that for columnar-grain ice the most critical value of λ occurs at triple points at whichthe grain boundaries are 120° to each other.
From Reference Frost and GuptaFrost and Gupta (1993), the critical strain-energy release rate is given by

where Eis the elastic modulus, vis Poisson’s ratio, σdis a constant that depends on the applied stress and grain shape, dis the grain-size and Q(λ)is a parameter that depends on the strength of the singularity at the tip of the precursor. Assume that all the effect of grain-size is given by the term d2λ.Under this condition, Jnueland Unuelfor the formation of a crack of length 2acritare proportional to d−2λ.For the uniaxial, compressive stress condition, the energy to form the crack must come from the local strain energy, i.e. Unuel. If the distribution in the lengths of the cracks is related directly to the distribution in Unuel,the LMCL should have the same dependence on das the corresponding value of Unuel,i.e. αd−2λ.Referring to the plot of ln(LMCL) against ln(d) (Fig.6; Table 4), the value of −2λ for the three nominal rates 10−3, 10−4and 10−5s−1is, respectively, 0.14, 0.63 and 0.84. This gives for λ the values of −0.07, −0.31 and −0.42, all within the expected range of 0 to −0.5.
Reference PicuPicu and Gupta (1995)and Reference Elvin and SunderElvin and Sunder (1996)present models for the formation of microcracks in columnar-grain ice. Both models assume that shear occurs over the full grain-boundary facet and show that this produces a larger crack-nucleating stress at the triple point than does elastic anisotropy. The models predict a grain-size dependence of d−½for the stress for the formation of a microcrack. Reference Gold, Jones and SladeGold and others (1993)found that the stress and strain to the formation of the first crack at the nominal strain rate 10−3s−1had a significant correlation with d−½and that their results agreed well with those of Reference Kalifa, Jones and SladeKalifa and others (1991)for granular ice. Reference GoldGold (1994)also found a significant dependence of theelastic moduli on grain-size at the same nominal rate of strain.
The present work covers the range of the crack-forming process that can be described as nucleation and “pop-in”. No evidence was seen either during the test or on the video record of it, of crack propagation after pop-in for the stress levels applied (about 60% of the failure value) and nominal strain rate greater than 10−5s−1. Figure 7indicates that the grain-boundary LMCLs tend to a value of about 0.75 mm for strain rate greater than 10−3s−1, that is independent of grain-size. Assuming that crack length is a valid measure of the associated minimum strain energy, what Figures 6 and 7 indicate is that the logarithmic mean strain energy for grain-boundary crack formation, and, therefore, the accompanyingstress field, become increasingly independent of grain-size with increasing strain rate, in agreement with the decreasing value for the strength of the singularity, as given by λ. This behaviour would suggest that the nucleation process for grain-boundary cracks becomes increasingly localised to the sites of the stress singularities with increasing strain rate. A value of −0.07 for λ at the nominal strain rate of 10−3s−1is the order to be expected for a relatively small elastic anisotropy (Reference Tvergaard and HutchinsonTvergaard and Hutchinson, 1988). Equation (3) and Figure 6do raise questions concerning the meaning for λ for increasing delayed elastic and viscous behaviour.
One of the problems for modelling crack nucleation for ice has been the apparent lack of precursors at the stress levels observed in practice. This difficulty appears to be reduced significantly if grain-boundary shear and relaxation aretaken into consideration (Reference PicuPicu and Gupta, 1995; Reference Elvin and SunderElvin and Sunder, 1996). One possibility that does not appear to have been considered for ice, however, is a time- and stress-dependent decrease in the effective grain-boundary energy. This could occur, for example, by the formation and coalition of vacancies in the high tensile stress region of stress singularities. Such a process would explain why some characteristics of crack formation, such as the time to formation of the first crack (Reference Gold and ŌuraGold, 1967, Reference Gold1972a), appear to be associated with a thermally activated process. It would be consistent with the initial relaxation in the elastic modulus of ice found for strain rates greater than 10−2s−1and the transition from crack formation to cavity formation with decreasing strain rate (Reference Gold and KingeryGold, 1963). In the present work, some examples were observed at triple points in specimens deformed at the nominal rate of 10−3s−1of linear features about 0.1 mm wide and several mm long, in grain boundaries tending to be parallel to the direction of the stress, and of rows of bubbles of the type postulated by Reference Elvin and SunderElvin and Sunder (1996). If this is what is taking place, the crack-forming process would begin when the stress field induced at a singularity starts to create vacancies. Crack nucleation would occur when the effective grain-boundary energy over a potential crack length, 2a,is reduced to a value that satisfies Equation (2). For this model, a sufficient condition for deformation-induced crack formation in ice at temperatures above −50°C would be that it be polycrystalline.
The analysis showed that the probability of a transcrystalline crack forming in the first 9 × 10⁻⁴of strain, decreased with increase in strain rate, decrease in temperature and decrease in grain-size, the converse of what was observed for the grain-boundary cracks. This indicates the two crack populations are formed by different crack-forming processes with different dependencies on grain-size, strain rate and temperature.
The increased permanent strain with decrease in strain rate and increase in temperature is associated with the increase in the relative proportion of transcrystalline cracks, indicating that dislocations may be an important cause for their formation (Reference Gold and ŌuraGold, 1967). Table 5shows that, for the same load conditions, the transcrystalline cracks have a larger mean LMCL than do the grain-boundary ones. This, and the fact that the surface energy for transcrystalline cracks is about 65% larger than for grain-boundary cracks (Reference HobbsHobbs, 1974), shows that, for a given strain rate and strain, the transcrystalline crack-causing mechanism must induce, on average, a larger amount of strain energy by the time of formation than does the grain-boundary crack-forming process. It would appear that the majority of the grain-boundary cracks were caused by forces tending to separate grains, and the transcrystalline cracks by forcesending to deform grains in shear.
The marked changes in the crack ratios and statistical characteristics of the crack lengths occurred over the same range of strain rate as the brittle to ductile transition in the deformation behaviour for this type of ice. This suggeststhat the changes and transition are controlled by the same deformation processes. The change in the statistical characteristics of the crack populations indicates that the underlying cause may be the time and temperature dependence of the response of dislocations to stress.
The analysis of the time dependence of the elastic modulus for the constant strain-rate tests (Reference GoldGold, 1994) showed that, for stress and strain of up to 60% of failure in the brittle range of behaviour, the effective elastic modulus was constant in spite of the formation of cracks. It would be expected, however, that their formation would have an important role in failure. Two specimens were loaded to failure at the nominal rate of 10−3s−1. In one case the failure load was 6.1 MPa and in the other 5.8 MPa. The specimens were enclosed in clear vinyl plasticfilm to keep them intact after failure. Failure was abrupt and the video record of the tests showed that it occurred by splitting and shear in the manner described by Reference SchulsonSchulson (1990). Several years ago, the author conducted similar tests ina screw-driven testing frame using the same type of ice. In this more compliant testing machine, failure was explosive and specimens disintegrated into small particles. One specimen was enclosed in clear vinyl film and it remained intact after failure. In this case, there was no splitting or shear. Rather, it appeared that the grain boundaries were all completely cracked. These observations, and the work of Schulson, bring but the marked dependence of the nature of the final failure process on ice type, crack damage, specimen geometry, conditions of loading and the characteristics of the testing machine. For the brittle range of behaviour, in particular, the transition from random to non-random for the crack populations may be an important criterion for failure.
7. Conclusions
Grain boundaries were found to be the principal location for cracks formed in columnar-grain ice strained to less than 10−3at a constant rate greater than 7.8 × 10⁻⁶s−1, by aload applied perpendicular to the long axis of the grains. Under these conditions, practically all of the grain-boundarycracks have at least one edge at a triple point. The proportion of grain-boundary cracks increases with increasing strain rate, decreasing grain-size and decreasing temperature, and is a random variable for tests with the same conditions ofloading. It approaches 100% for a strain rate of 10−2s−1and temperature of −10°C.
The distribution in crack lengths for the grain-boundary and transcrystalline crack populations is, with good confidence, log-normal. This suggests that the strain energy associated with the formation of the cracks has, also, a similar distribution function. For strain rate greater than 7.8 × 10⁻⁶s−1, the LMCL for both populations decreases with increasing strain rate and decreasing grain-size and temperature. The LMCLs at a strain of about 6 × 10⁻⁴and temperature of −10°C have a maximum between the strain rates of 10−5and 10−6s−1. In the ductile range of behaviour, theydecrease with decreasing strain rate. For the brittle range of behaviour and to a strain of 6 × 10⁻⁴at least, the LMCL is a random variable. This characteristic probably extends to larger strains with increasing ductile behaviour.
The principal differences between the grain-boundary and transcrystalline crack populations are the dependence of their relative number on grain-size, strain rate and temperature and, for a given amount of strain, the mean local strain energy required for their formation. The dependence of the crack ratios and lengths on strain rate, grain-size and temperature is consistent with the processes for the formation of grain-boundary cracks being, primarily, those associated with elastic and delayed elastic anisotropy and stress singularities, particularly at grain-boundary triple points, and, for the transcrystalline cracks, those associated with dislocation processes. For the conditions of the tests, the formation of a crack was a manifestation of a random sampling of precursors and crack-forming processes.
Acknowledgements
The author expresses his gratitude to the Institute for Marine Dynamics of the National Research Council of Canada and, in particular, to Dr S. Jones, for the opportunity to carry out this study of crack formation in ice. He is indebted to Dr M. Williams for her comments on the statistical analysis of the results and to Mr T. Slade for his most valuable assistance with preparing samples and carrying out the tests.