

Introduction
The Yellow Chat Epthianura crocea is one of five species of ground-adapted insectivorous honeyeaters endemic to Australia. Yellow Chats are most likely arid-evolved (Schodde Reference Schodde, Barker and Greenslade1982) and have a widespread but sporadic distribution across northern Australia on both sides of the continent as well as extending into southern parts along the Lake Eyre Basin catchments. One of three subspecies, the Capricorn Yellow Chat E. c. macgregori is endemic to coastal central Queensland near Rockhampton, occupying less than 7,000 ha of marine plain habitats along a 200-km coastline, with the most inland site less than 20 km from the coast (Houston et al. Reference Houston, Black and Elder2013) (Fig. 1). The nearest current known records of the Inland Yellow Chat (E. c. crocea) are 800 km to the west, associated with the Lake Eyre drainage system. Another subspecies, the Alligator Rivers Yellow Chat (E. c. tunneyi), occurs to the east of Darwin, also coastally.
Present distribution of Capricorn Yellow Chats (locations from Houston et al. (Reference Houston, Black and Elder2013) indicated by +) and the two sampling sites (large X).
A preliminary evaluation of the divergence between the Capricorn Yellow Chat and its nearest subspecies, the widespread Inland Yellow Chat, indicate a time to the most recent common ancestor of 215,000 years or less (Houston et al. Reference Houston, Aspden, Black, Elder, Carruthers, Campbell and Black2015). This timespan overlaps two periods of glacial aridity during which xeric habitats used by Yellow Chats for breeding, such as semiarid and arid swamps (Reynolds et al. Reference Reynolds, Walter and Woodall1982, Strong and Fleming Reference Strong and Fleming1987, Higgins et al. Reference Higgins, Peter, Steele, Higgins, Peter and Steele2001), may have expanded, allowing colonisation of the coastal marine plains (Houston et al. Reference Houston, Aspden, Black, Elder, Carruthers, Campbell and Black2015). Similar to other arid-evolved species (Kearns et al. Reference Kearns, Joseph, Toon and Cook2014), Houston et al. (Reference Houston, Aspden, Black, Elder, Carruthers, Campbell and Black2015) hypothesised that Capricorn Yellow Chats may represent a relict population from a previously more xeric era that has subsequently become isolated as the region became wetter following Pleistocene glacial maxima and aridity.
The distribution of the Capricorn Yellow Chat appears to be disjunct with a group of northern sites, centred on Broad Sound, separated from southern sites in the Fitzroy River delta by at least 140 km of unfavourable terrain (Houston et al. Reference Houston, Jaensch, Black, Elder and Black2009, Reference Houston, Black and Elder2013). A third area to the east of the Fitzroy River mouth on the north-eastern end of Curtis Island lies some 40 km from the southern group. The total population size is low, estimated at approximately 250 individuals with approximately 75% of the population in the northern Broad Sound area, 22% in the Fitzroy River delta and 3% at Curtis Island (Houston Reference Houston2010, Houston et al. Reference Houston, Elder and Black2017).
Capricorn Yellow Chats nest close to the ground in low vegetation (Houston Reference Houston2010), and breeding activity is associated with freshwater inundation of habitat and stimulation of abundant food resources (Houston Reference Houston2013). All identified breeding habitats are salt-affected and there is a strong association with wetlands of marine plains with most Capricorn Yellow Chat habitat less than 5 m above sea level (Houston et al. Reference Houston, Black and Elder2013). These wetlands are dominated by a mixture of salt-tolerant sedges, grasses and chenopods, with occasional shrubs.
Although the Inland subspecies is regarded as nomadic and dispersive by some authors (Ford and Parker Reference Ford and Parker1974, Storr Reference Storr1980, Black et al. Reference Black, Duggan, Pedler and Pedler1983, Blakers et al. Reference Blakers, Davies and Reilly1984), there is no evidence to suggest that the Capricorn Yellow Chat is similarly dispersive. Capricorn Yellow Chats have been observed to undertake small-scale seasonal movements of up to 10 km between breeding and non-breeding (dry season) habitats (Houston Reference Houston2010, Houston et al. Reference Houston, Elder and Black2017) but the extent of dispersal following breeding is unknown. Of the 15 Capricorn Yellow Chat sites, only five are known to support them throughout the year, the others being seasonally or opportunistically used for breeding (Houston et al. Reference Houston, Black and Elder2013, Reference Houston, Elder and Black2017).
Identified threats to this endangered species include the loss of water flows into breeding habitat and habitat loss due to industrial expansion, leading to further depletion in numbers and consequent further diminishment of genetic fitness (Houston Reference Houston2013). The effects of climate change, both through sea level rise and changes in frequency of droughts and floods, are another major threat (Houston et al. Reference Houston, Black and Elder2013). Other likely threats include alteration to habitat by overgrazing, weed invasion by semiaquatic ponded pasture grasses following removal of grazing, prolonged disturbance by human activities, and predation by feral predators (Houston and Melzer Reference Houston and Melzer2008, Houston Reference Houston2010). Low population size and a fragmented distribution also pose significant threats in terms of demographic stochasticity and loss of genetic viability of the subspecies.
Although there are slight morphological differences, a recent study of mitochondrial DNA found no genetic diversity within, nor genetic divergence between, Capricorn Yellow Chats occupying the two areas at the northern and southern extremes of the distribution (Houston et al. Reference Houston, Aspden, Black, Elder, Carruthers, Campbell and Black2015). That study concluded that the most likely explanation for the lack of variability was that the two groups represent daughter populations of an ancestral population that was affected by a genetic bottleneck in the recent past. However, given that birds may have relatively high vagility, it is also possible that dispersal and consequent gene flow between the two populations has been sufficient to prevent genetic drift. Microsatellite data collected on populations of a sister species, the White-fronted Chat, revealed restricted gene flow over distances as little as 20 km (Major et al. Reference Major, Johnson, King, Cooke and Sladek2014) and so it is conceivable that the lack of genetic differentiation in Yellow Chats may be a consequence of mitochondrial DNA not providing sufficient resolution for detecting recent genetic drift, unlike microsatellites with their high variability and mutation rate (Ellegren Reference Ellegren2004). To further understand the dispersal capacity and potential for population isolation in the endangered Capricorn Yellow Chat, we use nuclear microsatellite markers to test for gene flow between the disjunct northern and southern areas of the subspecies’ range.
Methods
Study species and sample collection
The Capricorn Yellow Chat is a small (10–11 cm long) insectivorous passerine with an average adult weight of 10.6 g (Houston et al. Reference Houston, Aspden, Black, Elder, Carruthers, Campbell and Black2015). The species is sexually dimorphic, exhibits bi-parental care and simple breeding pairs build concealed nests in low vegetation close to the ground (Houston et al. Reference Houston, Porter, O’Neill and Elder2004).
One site in each of the disjunct northern and southern areas of the distribution were selected on the basis that chats were regularly sighted and that the habitat structure offered the greatest likelihood of capturing chats in mist nets. The northern site was located on a cattle grazing property (22.5970S, 149.9570E) and the southern site on a salt field (23.6080S, 150.7340E) (Fig. 1). The two areas were located approximately 140 km apart. Birds in each site were captured using mist nets in July and November 2012. Captured birds were individually banded to prevent duplicate sampling, and to facilitate further population studies. Feathers have been shown to be a reliable non-invasive technique for sampling DNA (Taberlet and Bouvet Reference Taberlet and Bouvet1991) and so 5–10 breast feathers were removed and stored in plastic bags prior to freezing in the lab. Eleven birds were captured and sampled at the northern site and seven birds from the southern site. Despite being a small number of individuals, this was a substantial sample of the critically endangered population, 7% overall, and 6% and 13% respectively of birds at the two areas.
DNA extraction and genotyping
Under sterile conditions we used scalpel blades to remove 2 mm sections from the tips of two feather shafts from each bird. DNA was extracted from these sections using the DNeasy Blood and Tissue Kit (QIAGEN cat# 69506) following the manufacturer’s recommended protocol. We attempted to amplify 18 nuclear microsatellite primer sets developed for the sister species, Epthianura albifrons: Ea02, Ea03, Ea04, Ea05, Ea07, Ea08, Ea09, Ea10, Ea11, Ea13, Ea14, Ea16, Ea18, Ea19, Ea24, Ea26, Ea28, Ea30 (genBank accession numbers JX009386–JX009403; King et al. Reference King, Cooke, Johnson and Major2012). PCR amplification was performed in 25ul reaction (1 × CL buffer (Qiagen), 0.5× Q solution (Qiagen), 3.5 mM MgCl2, 0.05 mM of each dNTP, 10 μm of each primer, 2 × BSA, and 0.5 U of Taq polymerase (Qiagen) with an initial denaturing at 95°C for 60 s, followed by a 70–60°C touch-down, ending with 28 cycles of 95°C for 15 s, 60°C for 15 s and 72°C for 30s with a final extension of 70°C for 5 min. Multiplexed PCR products using labelled primers were run on an AB 3730xl Sequencer (Applied Biosystems), and the electropherograms were analysed and scored manually using GeneMapper version 4.1 (Applied Biosystems).
Analysis of population structure
Gene frequencies, heterozygosity and tests for Hardy-Weinberg equilibrium were determined for the 14 polymorphic loci that amplified successfully, using the program Arlequin version 3.5.1.2 (Excoffier and Lischer Reference Excoffier and Lischer2010). Pairwise FST between the two populations was calculated in Arlequin, and the proportion of ancestry of each individual originating from up to four putative populations was determined using the program Structure version 2.3.3 (Pritchard et al. Reference Pritchard, Stephens and Donnelly2000). We assumed that there was admixture between populations and that allele frequencies in the different populations were independent. Structure uses a Bayesian approach, and two separate models were run to include either no information on the provenance of each individual, or with informative priors based on sampling location. Each model was run four times, corresponding to a putative number of ancestral populations ranging from one to four, and the best model was selected based on the lowest log-likelihood ratio. Runs consisted of 106 iterations after a 105 burn in, and each model was run ten times to confirm that the log-likelihood ratio converged. The cluster-matching program CLUMPP (Jakobsson and Rosenberg Reference Jakobsson and Rosenberg2007) was used to compile the outputs of the ten runs into a single plot. The pedigree program COLONY version 2.0.6.2 (Wang Reference Wang2013) was used to identify siblings, which were excluded from the analysis.
Results
Fourteen of the 18 loci designed for Epthianura albifrons amplified in E. crocea, with a mean of 4.64 ± 0.62 (SE) alleles per locus (Table 1). Allelic diversity and heterozygosity were similar in the two populations (Table 1) but there were three private alleles that were present in at least 50% of the individuals in the populations in which they occurred (two in samples from the northern site and one from the southern site). Two loci (Ea04 and Ea16) showed significant deviation from Hardy-Weinberg equilibrium (Table 1) and so these were excluded from analyses of population structure. We also ran the analysis including and excluding two other loci (Ea02 and Ea08), each of which had 16% missing data. Population structures were almost identical in the two analyses, but the results below are for the reduced dataset. The analysis of pedigree identified three siblings in the northern population and so two of these individuals were excluded from all analyses resulting in a data matrix of 10 loci for 16 individuals with no missing data.
Allelic frequencies of 14 microsatellite loci in two populations (southern and northern) of Capricorn Yellow Chats. Data shown are the Number of alleles (Na), Number of Effective alleles (Ne), Heterozygosity observed (Ho) and Heterozygosity expected (He). Significant deviations from Hardy Weinberg equilibrium are denoted by * (P < 0.05). Two individuals were excluded from the full dataset because they were siblings of a third individual.

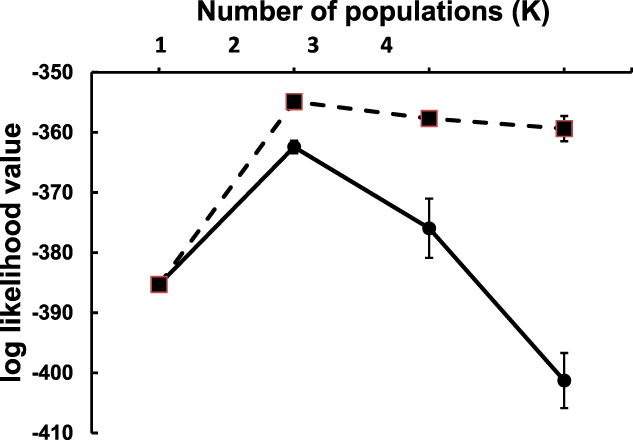
Significant structuring of the two populations was evident both from pairwise FST (FST = 0.189, P < 0.0001) and from the Structure models. Using both non-informative and informative locality priors, simulations indicated that genotypic variation was best explained by two ancestral populations (i.e. K = 2) based on the lowest log-likelihood ratios (Figure 2). Both models unambiguously clustered the individual genotypes into their respective populations (Figure 3).
Convergence of log likelihood values (mean ± SD) of 10 simulations of two model population structures ranging between one and four genetic populations (K). Models using non-informative locality priors are indicated by filled circles and solid lines. Models using informative locality priors are indicated by filled squares and dashed lines. The “best” models (i.e. K = 2) are those with highest (least negative) log likelihood values.
Population structuring as identified from Monte-Carlo Markov chain simulation using the program Structure, with (a) non-informative locality priors, and (b) informative locality priors. Black and grey shadings represent the percentage of ancestry of each of 16 individuals derived from two genetically distinct populations identified from MCMC simulations.

Discussion
This study demonstrates restricted gene flow between the northern and southern extremes of the Capricorn Yellow Chat distribution. This degree of genetic isolation suggests that the distance is too great for successful dispersal, the terrain is unfavourable for dispersal, and/or the populations have declined to a point where there are too few potential emigrants to achieve genetic rescue. Either way, implications are that the effective breeding population is lower than if it was one interbreeding unit, making the subspecies more vulnerable to population declines following chance events. Further, there may be implications for genetic fitness. In management terms, the two areas have to be managed separately and threats evaluated at a local level. This new information will have to be considered and the existing recovery plan updated.
Relevant to this situation is a study of the sibling species, the White-fronted Chat, which compared the genetic structure of five populations – two that were separated by less than 20 km within the greater conurbation of Sydney, two coastal sites to the north and south of Sydney within a non-urbanised matrix, and one 500 km inland (Major et al. Reference Major, Johnson, King, Cooke and Sladek2014). This study found that while urbanisation posed a significant geographic barrier to dispersal, extensive tracts of unsuitable habitat such as forested terrain did not.
The genetic distinctiveness of Capricorn Yellow Chats from the two areas sampled in this study indicates that there is restricted gene flow between them. This suggests the existence of a geographic barrier limiting dispersal and consequent gene flow. Extreme geographic barriers such as an extensive urban environment are not applicable to this study. The three areas where Capricorn Yellow Chats occur, Broad Sound in the north, the Fitzroy River delta in the south and Curtis Island in the south-east are characterised by broad treeless marine plains providing extensive tracts of suitable wetland habitat (Houston et al. Reference Houston, Black and Elder2013). In contrast, there is little suitable habitat that could provide a connecting corridor between the northern and southern populations as the two areas are separated by an extensive tract of forested terrain interspersed with grazing land. Further, the marine plain habitat that does occur is mostly confined to mangroves, some of which abuts forested hills in places. Consequently, opportunities for dispersal along the coastal strip are limited.
It is likely that the barrier to gene flow between the northern and southern extremes of the Capricorn Yellow Chat distribution pre-dates European settlement. Capricorn Yellow Chats still occur in the same places they were found in at the time of European settlement in the region: Torilla Plain in the north and Fitzroy Vale in the south (Campbell Reference Campbell1917, Keast Reference Keast1958); as well as a very early record, 1859, from the “Rockhampton District” (Mack Reference Mack1930). While there have been some developments locally associated with salt field and bank construction, roads and rail lines, and introduction of new species of pasture grasses for the grazing industry, there has not been the same level of urban intensification observed in Central Queensland as in Sydney. It is likely that the two populations of Capricorn Yellow Chat have been separated for considerably longer than 200 years.
Holocene sea level changes may be relevant to the current separation of the two populations. During glacial maxima, sea levels were much lower and the associated marine plains were much greater in area, connecting the two areas. Further, the climate was more arid and the type of wetlands supporting Capricorn Yellow Chats were likely to be more extensive, expanding out along the current continental shelf and increasing the likelihood that the two populations were interconnected (Houston et al. Reference Houston, Aspden, Black, Elder, Carruthers, Campbell and Black2015). Subsequent sea level rises some 7,000 years ago (Brooke et al. Reference Brooke, Bostock, Smith and Ryan2006) then isolated them. Such a recent isolation is consistent with the mtDNA findings. Mutation rates are in the order of 2% per million years (Weir and Schluter Reference Weir and Schluter2008) and a 7,000 year separation is an insufficient time for mtDNA mutations to have become fixed between the two populations.
In contrast, pronounced genetic drift in White-fronted Chats was evident in rapidly-evolving microsatellites once populations were isolated, as evidenced by the distinctiveness of the two Sydney saltmarsh populations (Major et al. Reference Major, Johnson, King, Cooke and Sladek2014). These were connected prior to the extensive urbanisation of Sydney and yet found to be genetically distinct at the present day. The present study shows a similar pattern of genetic drift in Capricorn Yellow Chats using microsatellites, which is likely to accelerate if there is further population decline, particularly in the small population present at the Southern Fitzroy River delta.
Management issues
The relative isolation of the smaller southern groups (the Fitzroy River delta and Curtis Island) from the much larger northern group (both sides of the Broad Sound) makes the southern population more vulnerable to local extinction. The small population size in this area of approximately 60 adults or 30 breeding pairs (Houston Reference Houston2010, Houston et al. Reference Houston, Elder and Black2017), assuming an equal sex ratio, means that developments that reduce habitat or interfere with breeding success have greater potential to lead to local extinction and this must be factored into consideration of developments in this area. It also has implications for development proposals in all areas where chats occur since the effective breeding population is reduced at all locations. The reduced effective population size also suggests that Capricorn Yellow Chats are vulnerable to inbreeding depression and the continued loss of genetic diversity which may compromise long term population viability; recent studies of which indicate that > 1,000 adults are required to maintain genetic fitness of populations in perpetuity (Frankham et al. Reference Frankham, Bradshaw and Brook2014). While the purging of deleterious alleles may in some instances, reduce the negative effects of inbreeding, the efficiency of purging in the wild is variable and limited evidence exists (Hedrick and Garcia-Dorado Reference Hedrick and Garcia-Dorado2016). Additional detailed research would be required to ascertain the fitness of the populations to determine if this has occurred. Furthermore, the loss of genetic diversity still reduces the potential for the population to adapt to changing conditions (Frankham et al. Reference Frankham, Bradshaw and Brook2014).
Both populations of Capricorn Yellow Chats exhibit low levels of genetic diversity and appear potentially inbred. The mtDNA data suggests that the two populations were historically part of a single population, while the microsatellite data indicates that there is limited recent gene flow between them, despite the geographical proximity. Thus, both populations would likely benefit from an exchange of individuals, to increase genetic diversity and reduce inbreeding, which will likely result in positive effects on fitness (i.e. genetic rescue) (Frankham Reference Frankham2015, Reference Frankham2016). When mixing populations, some consideration of the potential risk of outbreeding depression (i.e. mixing genetically incompatible populations) is required. Outbreeding depression is most likely to occur where populations differ in chromosomal rearrangements, are adapted to differing environmental/ecological conditions and where there has been no recent gene flow (Frankham et al. Reference Frankham, Ballou, Eldridge, Lacy, Ralls, Dudash and Fenster2011). There are no known chromosomal differences between the populations and given the similarity of the environmental conditions at the two sites strong local adaptations are not expected. Some further evaluation of the potentially long period of separation is warranted as there is some risk associated with populations separated for > 500 years. However, given the small population size and the indication from mtDNA that the populations were historically connected and some similarities between the populations at microsatellite loci, it is likely that facilitating mixing of the populations will be beneficial, although the effects of mixing should be carefully monitored.
The greater vulnerability of the southern population to extinction reinforces the value of the larger northern population. This suggests that a focus of conservation efforts on the northern area would be most cost-effective. However, public-based opportunities for this may be limited as most of these sites lie on private land or may be acquired for military training exercises. Some of the cattle properties with the largest number of chats (e.g. the Torilla Central site overlaps three large properties) support valuable cattle grazing enterprises whose management practices appear to be consistent with chat conservation (Houston et al. Reference Houston, Black and Elder2013, Reference Houston, Elder and Black2017). These practices include maintaining grass cover > 70% and grass height > 70 cm as well as removing cattle from the marine plain during the wet season (Houston Reference Houston2010, Houston et al. Reference Houston, Black and Elder2013). These practices have partly evolved as a consequence of the complexity of drainage networks across the plains and drivers such as wet season rainfall, leading to flooding of marine plain pastures in most years (Franklin et al. Reference Franklin, Whitehead, Pardon, Matthews, McMahon and McIntyre2005, Houston et al. Reference Houston, Black and Elder2013, Houston and Black Reference Houston and Black2016). One approach to ensure favourable land management practices would be for government agencies to enter into nature refuge agreements with the land owners agreeing to maintain such management practices in perpetuity. In that way, society gains the benefits of both highly productive grazing land and conservation benefits for a critically endangered bird.
Introduced semiaquatic pasture grasses such as para grass Urochloa mutica can potentially increase in groundcover and biomass following removal of grazing. This could reduce ground-based foraging microhabitat for Capricorn Yellow Chats as well as displace native sedges used for breeding such as Cyperus alopecuroides (Houston Reference Houston2010). Thus, changes to grazing and fire regimes associated with a change in ownership from private to public hands may result in potentially detrimental habitat changes unless carefully managed.
Future research should focus on evaluating gene flow between Curtis Island and the other two areas. Ideally, to fully understand gene flow, samples from both sides of Broad Sound in the north and both sides of the Fitzroy River delta in the south should also be compared.
Acknowledgements
Birds were captured under Central Queensland University ethics permit A12/02-279, Queensland Scientific Purposes Permit SP08039210 and Australian Bird and Bat Banding Scheme authority A706. We are grateful to Graham McCamley and Cheetham Salt (Richard Segal in particular) for granting access to the northern and southern sites, respectively and to Ian Carruthers, Lorelle Campbell, Leif Black and Richard Miller for assistance in the field. Costs of the field work were funded by a Central Queensland University Seed Grant.


