


Introduction
Air pollution is a major environmental risk to health, concerning both developed and developing countries, with diverse and substantial public health implications (WHO, 2018a). Ambient (outdoor) air pollution in both cities and rural areas was estimated to cause 4.2 million premature deaths worldwide in 2016. In that same year, 91% of the world's population was living in places where the WHO Air Quality Guidelines levels were not met.
The WHO Guidelines provide an assessment of health effects of air pollution and thresholds for health-harmful pollution levels. The Guidelines apply worldwide and are based on expert evaluation of current scientific evidence for particulate matter (PM), ozone (O3), nitrogen dioxide (NO2) and sulphur dioxide (SO2), in all WHO regions.
By decreasing air pollution levels, countries can reduce disease burden related to stroke, heart disease, lung cancer and both chronic and acute respiratory diseases, including asthma. Furthermore, it has been recently hypothesised that exposure to xenobiotic heavy metals such as lead and cadmium – constituents of air pollution such as particulate matter and nitrogen and sulphur oxides, organic solvents and other environmental pollutants – could be component causes for schizophrenia and other psychotic disorders (Attademo et al., Reference Attademo, Bernardini, Garinella and Compton2017). Moreover, recent studies in Sweden found that ambient air particle concentrations are associated with the number of visits to psychiatric emergency units in the warm season, suggesting that air pollution may exacerbate an underlying psychiatric disorder, or increase mental distress, even in areas with comparatively low levels of air pollution (Oudin et al., Reference Oudin, Åström, Asplund, Steingrimsson, Szabo and Carlsen2018). Similarly, long-term exposure to ambient air pollution could be an independent risk factor for mental health disorders ranging from subjective stress to depressive disorders and suicidal ideation (Shin et al., Reference Shin, Park and Choi2018). Recent studies analysing the association between daily levels of air pollutants and hospital admissions for mental disorders showed significant results for different pollutants considered both for admissions for generic mental disorders (Chen et al., Reference Chen, Liu, Chen, Wang, Li, Kan and Fu2018; Kim et al., Reference Kim, Do Shin, Song, Ro, Kong, Kim, Ko and Lee2018; Song et al., Reference Song, Zheng, Lu, Gui, Xu, Wu and Liu2018; Lee et al., Reference Lee, Lee, Kim, Kim, Myung, Kim and Kim2019; Qiu et al., Reference Qiu, Zhu, Wang, Pan, Pu, Zeng, Zhang, Peng and Zhou2019) and for specific diagnoses such as schizophrenia (Gao et al., Reference Gao, Xu, Guo, Fan and Zhu2017; Duan et al., Reference Duan, Cheng, Luo, Bai, Zhang, Wang, Xu, Gao, Zhang and Su2018; Bai et al., Reference Bai, Zhang, Zhang, Cheng, Duan, Gao, Xu, Zhang, Wang and Su2019), depression (Szyszkowicz et al., Reference Szyszkowicz, Kousha, Kingsbury and Colman2016; Wang et al., Reference Wang, Liu, Li, Liu, Guo, Yuan, Hu, Wang and Lu2018) and substance abuse (Szyszkowicz et al., Reference Szyszkowicz, Thomson, Colman and Rowe2018).
In addition, climate change is a major threat to the health of our planet, and is closely linked to air pollution. Over the past 50 years, human activities such as the burning of fossil fuels have released sufficient quantities of carbon dioxide (CO2) and other greenhouse gases to affect the global climate. The resulting changes in the global climate bring a range of risks to health, from deaths in extreme high temperatures to changing patterns of infectious diseases (WHO, 2018b).
The health effects of climate change are vast and distressingly serious, involving almost all organ systems of humans (and most other biological fauna and flora). The mental health consequences are also vast, pervasive, and likely to last longer than most other impacts on health (Clayton et al., Reference Clayton, Manning, Krygsman and Speiser2017).
The aim of the current study is to investigate the associations between daily levels of five air pollutants (particulate matter [PM10 and PM2.5], ozone [O3], carbon monoxide [CO], nitrogen dioxide [NO2]) and daily admissions for mental disorders to the emergency department of two general hospitals in Umbria region (Italy). Considering the daily number of admissions to psychiatric emergency services as a proxy measure of the psychiatric morbidity in the Umbria region, we hypothesised a positive association between air pollutant levels and daily number of psychiatric emergency admissions.
Methods
Psychiatric emergency services data
Data about daily admissions to psychiatric emergency services of Ospedale Santa Maria della Misericordia (Perugia) and Ospedale San Giovanni Battista (Foligno) were collected for the time period 1 January 2015 until 31 December 2016 (731 days). The catchment area covered by Ospedale Santa Maria della Misericordia (Perugia) consists of approximately 501 351 residents on an area of 4298.38 km2, with a population density of 116 inhabitants per km2 (ISTAT, 2015). The Ospedale San Giovanni Battista (Foligno) provides services for an area of about 901.77 km2, with 98 633 citizens and a population density of 109 inhabitants per km2 (ISTAT, 2015).
The psychiatric emergency services rely on the 24-h presence of a consultant psychiatrist in each of the above-mentioned hospitals. After the triage and first check in the Emergency Department, subjects presenting with an acute psychiatric condition undergo a screening visit operated by the mental health specialist. The number of consultations provided during each day of the considered time period was recorded into an electronic datasheet. Information about air pollution and meteorological data was then collected for each day and subsequently entered into the database.
Air pollution data
Data about daily levels of respirable particular matter (PM10 and PM2.5), ozone (O3), carbon monoxide (CO) and nitrogen dioxide (NO2) were collected from the regional agency for environmental protection of Umbria (Arpa Umbria – Agenzia Regionale per la Protezione Ambientale dell'Umbria) datasets (ARPA, 2017). We used air monitoring data for the different types of air pollutants which were averaged across up to 16 monitor stations dispersed in the region. The maximum distance among monitor stations is 91 km.
Meteorological data
Data about daily meteorological conditions such as daily average temperature, daily average pressure, daily average humidity and maximum and average wind speed in the study period were obtained from the meteorological station of Perugia-Monteluce, a centrally located urban station (monteluce.lineameteo, 2017).
Data analyses
We assessed the impact of an increase in air pollutants on the number of daily admissions using a time-series econometric framework. Specifically, we regressed the daily number of admissions (dependent variable) on the daily measure of air pollution, controlling for a set of covariates. Formally, the model can be expressed as:
 $$Admission_t = \alpha + \beta \overline {Pollutant_t} + \delta X_t + \varepsilon _t$$
where Admission t is the daily number of admissions, α is a constant term (intercept), β and δ are parameters,  $\overline {Pollutant_t} $ is a measure of daily air pollution, X t is a matrix of controls and ɛt is a residual. As for the strictly exogenous variable $\overline {Pollutant_t} $, we considered five air pollutants: PM10, PM2.5, NO2, CO and O3 concentration levels. Because air pollutants show a seasonal pattern (Figs 1 to 6) we removed the seasonal mean (defined as a 20-period moving average) and considered the daily deviation from it. In other words, $\overline {Pollutant_t} = Pollutant_t-(1/20)\sum\nolimits_{j = 0}^{19} {Pollutant_{t-j}} $. Our choice to define the seasonal mean as a 20-period moving average was discretionary but did not affect our results. Our evidence holds true with different choices such as allowing for seasonal dummy variables in Equation (1), considering a different length of the moving average, or considering the deviation from a biweight filter. The variable $\overline {Pollutant_t} $ captures daily pollution concentration levels from their mean and it is strictly exogenous in Equation (1). The exogeneity of $\overline {Pollutant_t} $ ensures that the estimated elasticity of daily admissions to air pollutants $(\widehat{\beta} )$ is unbiased. Finally, as for the matrix of controls $(X_t)$ we included the following variables: (i) a set of dummy variables for the day of the week, (ii) a variable capturing the average daily temperature, (iii) a variable capturing the average daily pressure, (iv) a variable capturing the average daily wind speed and (v) a variable capturing average daily humidity. Also, we include the squares and cubes of (ii), (iii) and (iv) in order to control for possible non-linear effects of temperature, pressure, wind speed and humidity. All control variables appeared to be strictly exogenous in Equation (1).
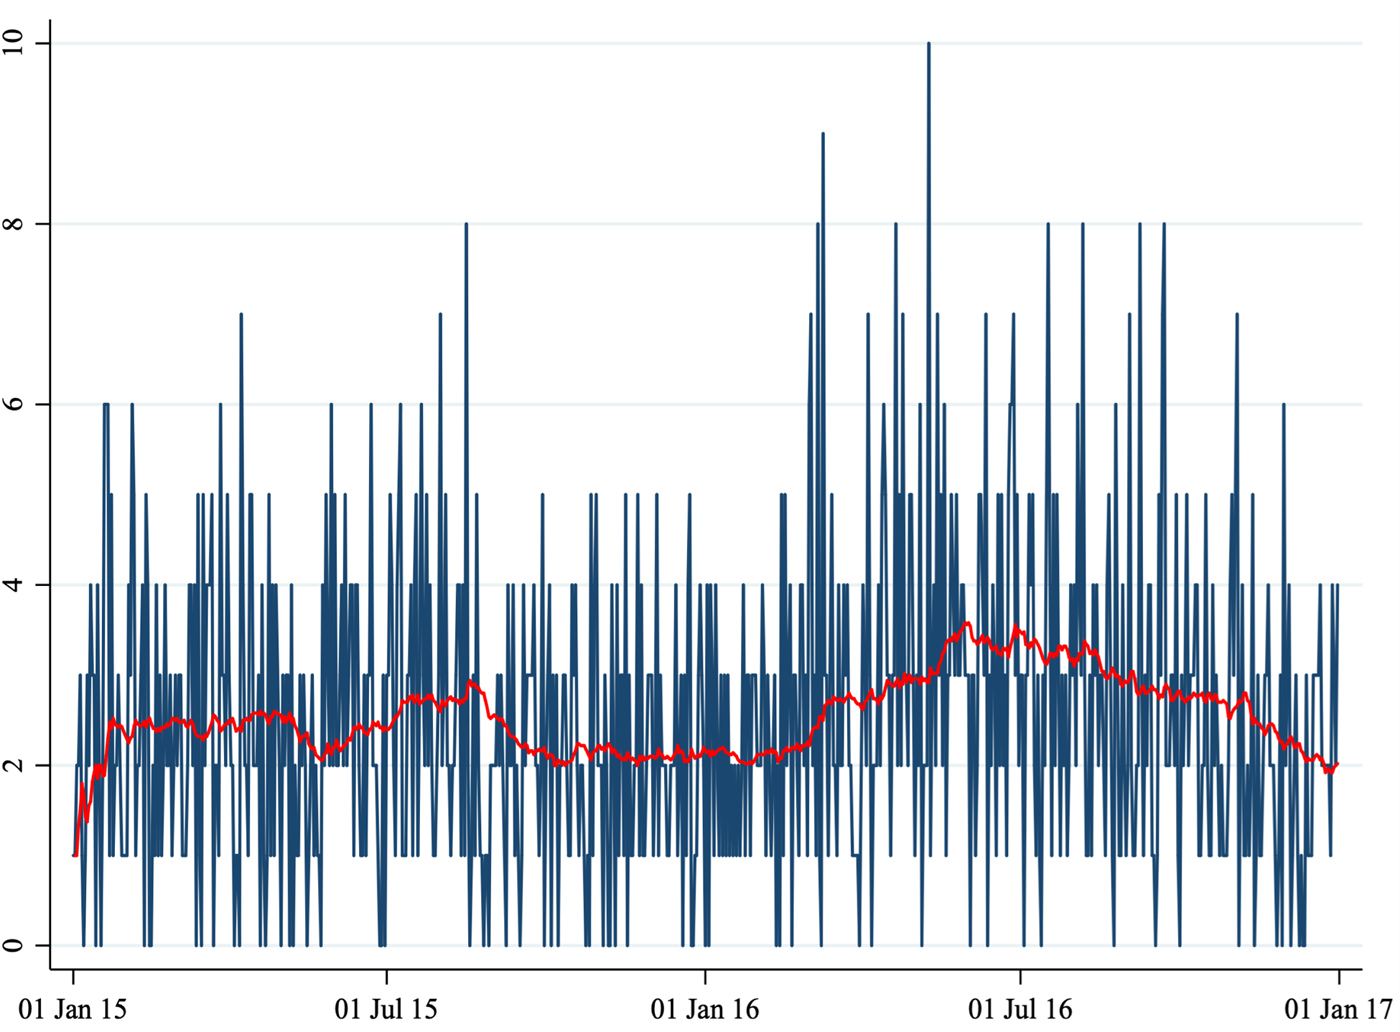
Number of daily admissions.
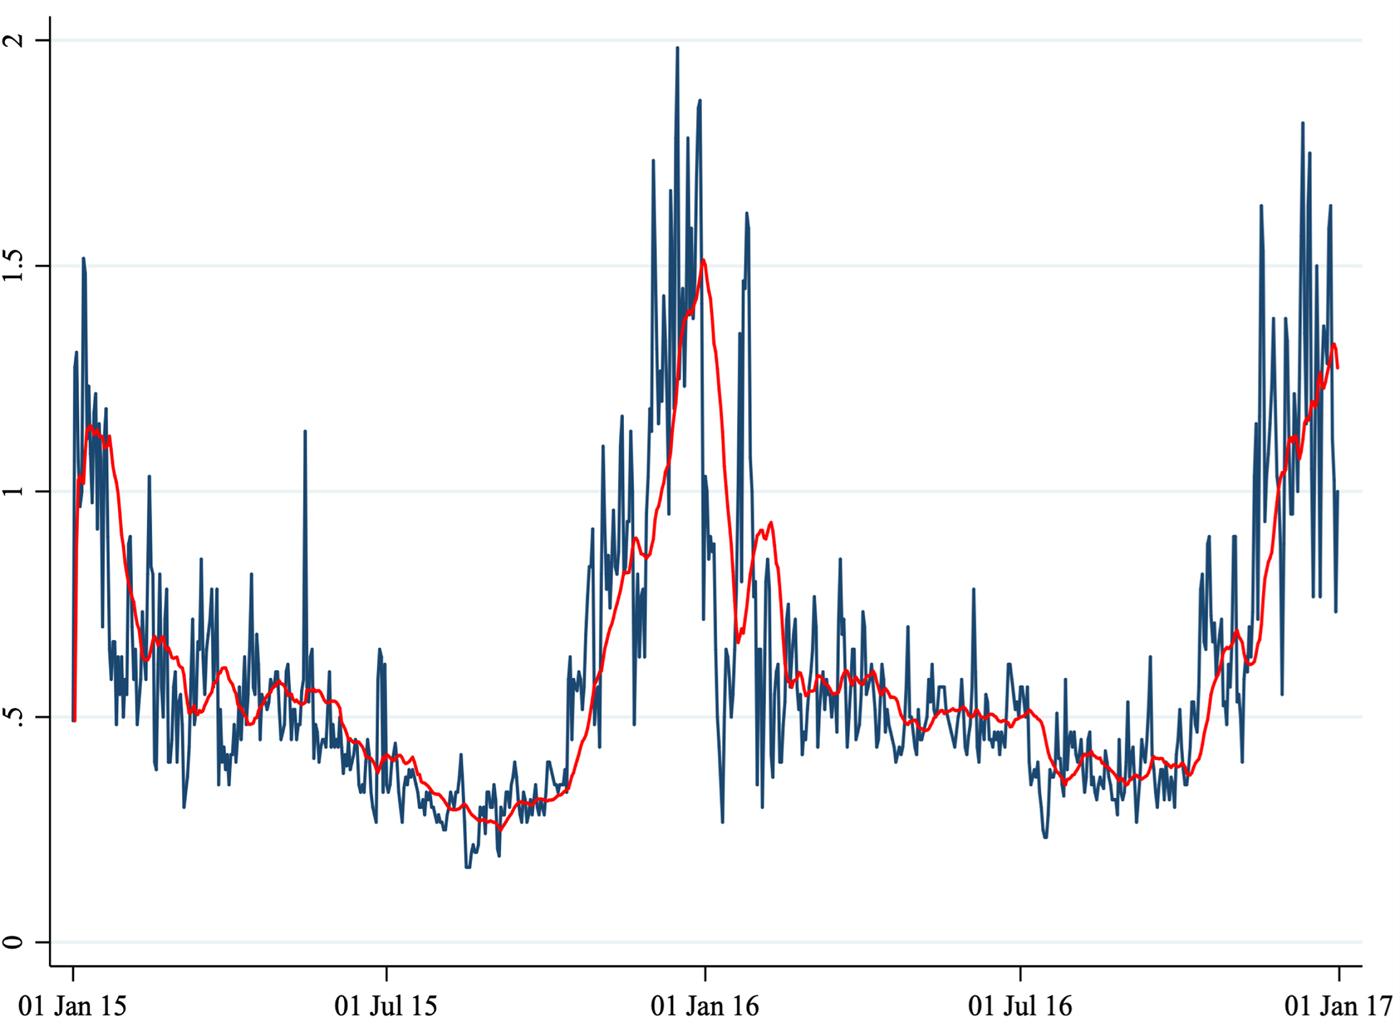
Average daily CO concentration.
Average daily NO2 concentration.

Average daily O3 concentration.

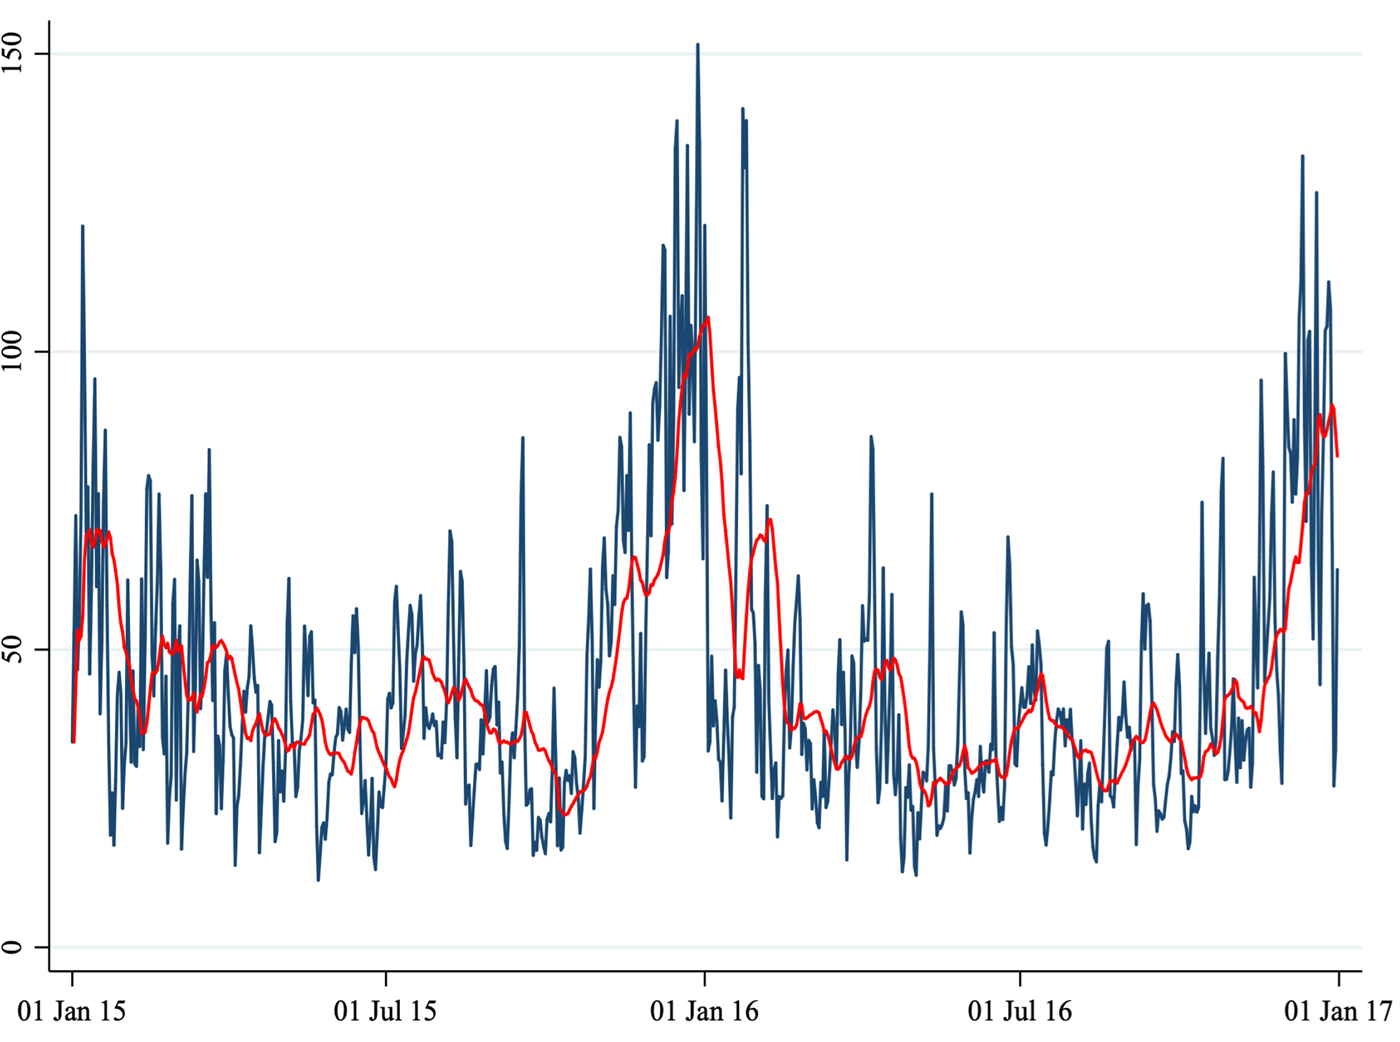
Average daily PM10 concentration.
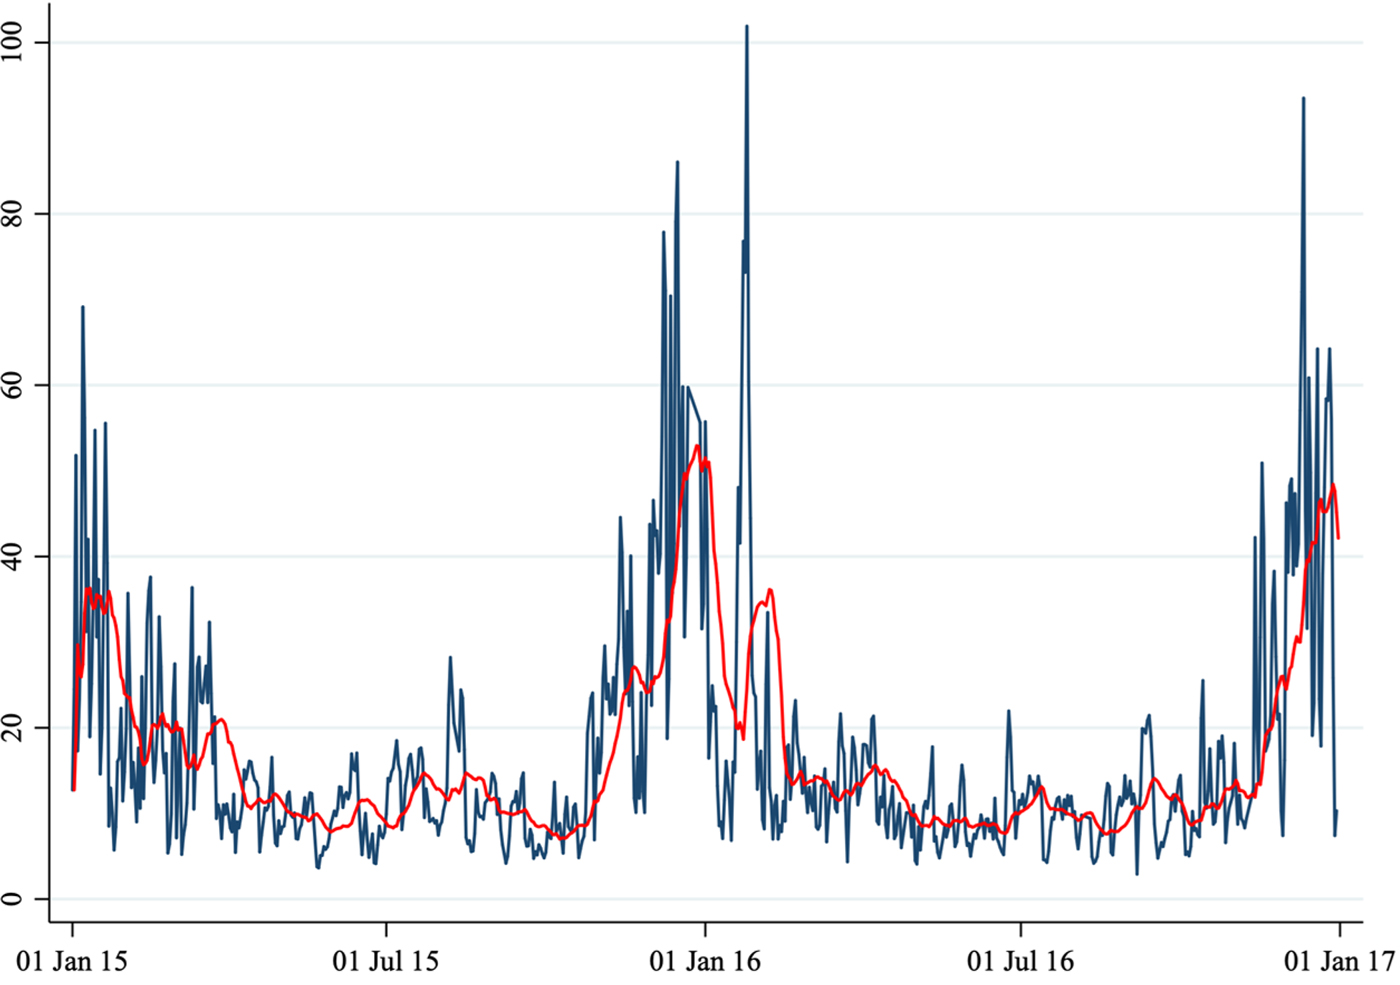
Average daily PM2.5 concentration.
Because of the (ordinal) nature of the dependent variable, we employed an ordered logit model (McCullagh, Reference McCullagh1980; Greene, Reference Greene, Hess and Daly2014) estimated using maximum likelihood. We ran the regressions including only lag 0 of the air pollutants. As robustness checks, we ran the same set of regressions using a linear regression model and using a Poisson regression model. Also, we ran a set of regressions allowing up to 10 lags of the air pollutant regressors. These robustness checks largely confirmed our baseline results.
In our econometric framework, we have ‘unified’ the two locations (emergency services of Ospedale Santa Maria della Misericordia in Perugia and Ospedale San Giovanni Battista in Foligno). Specifically, we have summed the total daily number of visits in both hospitals, and considered as pollutants the average daily entries across the two areas. As a robust check exercise we have also considered two alternative options: (i) using the average number of daily visits across the two locations as left-hand-side variable, and (ii) running a panel-data analysis (that is, considering the two locations as separate). In both cases, our results have been confirmed.
The statistical analysis was conducted using ‘STATA 13.0 – StataCorp LLC’.
Results
A total of 1860 cases (1461 in Perugia and 399 in Foligno) of emergency department admissions for mental disorders were recorded over the study period. Summary statistics of the variables in our dataset are shown in Table 1. A correlation matrix is given in Table 2. Time series of the variables of interest are shown in Figs 1 to 6.
Summary statistics

Note: This table shows descriptive statistics of the relevant variables in the dataset.
Correlation matrix
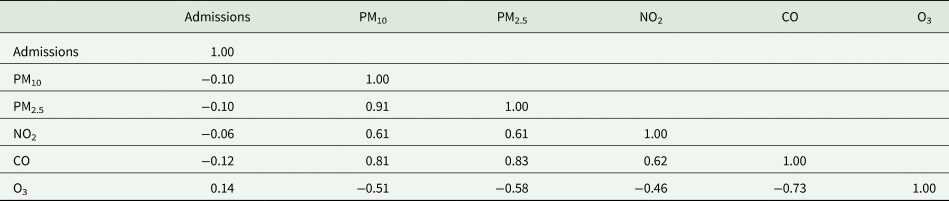
Note: This table shows the Pearson's correlation coefficients among relevant variables in the dataset. p-values are as follows: for two pairs (admissions–PM10 and admissions–CO) are 0.01, for one pair (admissions–NO2) is 0.13, and for all others 0.00.
The number of daily admissions was negatively correlated with daily concentration levels of PM10, PM2.5, NO2 and CO, while they were positively correlated with O3 levels. Virtually all correlations were statistically significant at the 1% level of significance. The number of daily admissions to the Emergency Department for psychiatric reasons appears relatively stable over time (except for an increase in mid-2016), with daily peaks throughout the entire time series. On the other hand, air pollutants exhibit a clear seasonal pattern. Average daily CO concentration levels as well as NO2, PM10 and PM2.5 tend to be higher during the cold season, while O3 concentration levels tend to be higher during the warm season. For practical purposes, in Figs 1 to 6 we have identified the ‘seasonal mean’ with a 20-period (days) moving average (red line). For all air pollutants there is considerable daily variation around the seasonal mean, which should ensure enough variation for identification purposes.
Switching to econometric evidence, regression results are presented in Table 3. The first column in Table 3 reports the results of univariate (‘Uni’) regressions, that allow only one pollutant to enter into Equation (1). Overall, we observe a statistically significant impact of O3 levels on daily admissions. The estimated coefficient of O3 is statistically significant at the 1% level. According to our results, an increase of 1 µg/m3 of O3 concentration (relative to the average concentration of the last 20 days) results in 0.013 more admissions to the hospitals. While the estimated effect might seem small, it is in fact appreciable. Because the variable used in the regression (O3 concentration levels in deviation from a moving average) has a maximum of 52, we can deduce that in the days with a peak in O3 concentration levels, one admission (after rounding) at the hospitals can be explained by the increased pollution levels. Considering that the dependent variable (number of admissions) has a mean of 2.5 (1.7, standard deviation), the effect of increased O3 concentration levels do not seem trivial.
Regressions results

Note: This table shows the estimated coefficients of a set of regressions. Each column shows the results of a different regression. Standard errors are reported in brackets. ‘Uni’ stands for univariate model (for brevity, we show the results of all univariate regressions in a single column), that is a model in which we allow only one pollutant to enter into the regression. ‘Biv’ stands for bivariate, and ‘All’ stands for all variables. All regressions control for daily temperature, pressure, humidity, wind, their squares and cubes, and a set of dummies capturing the day of the week. Significance levels are as follows: *p < 0.1, **p < 0.05, ***p < 0.01.
All other pollutants are not significantly associated with the number of daily admissions. For CO we estimated an impact significant only at the 10% level but the sign of the coefficient is the opposite of the initial analysis (negative, instead of positive).
The following ten columns in Table 3 show the results of the bivariate (‘Biv’) regressions in which we allow two pollutants to enter into Equation (1). As for the ‘Uni’ regressions, this set of regressions allow for a set of control variables. Again, we observe significant coefficients for O3 levels at 1% level of significance. As for CO, in none of the regressions the estimated coefficient is significant, indicating that the result from the ‘Uni’ model is not robust. All other pollutants are estimated to have an effect not statistically different from zero. Finally, when we allow all pollutants (last column ‘All’ of Table 3) to enter into Equation (1), the coefficient of O3 remains stable and highly significant, and all other pollutants continue to remain statistically indistinguishable from zero.
As robustness checks, we repeated the analysis using (i) a linear regression model and (ii) a Poisson regression model. The evidence emerging from these alternative sets of regressions largely confirm the original findings. We have also run a set of regressions in which we have expanded the number of control variables and allowed a set of seasonal or monthly dummies to enter into Equation (1). In these regressions we obtained results virtually identical to the one presented in Table 3, as the seasonal/monthly dummies are estimated to be insignificantly different from zero. Finally, we ran a complementary set of regressions allowing up to 10 lags of each pollutant in Equation (1). The associations observed for lag 1 to lag 10 were generally lower than for lag 0 and were not statistically significant.
Discussion
We observed a statistically significant association of daily ozone levels and daily number of admissions to psychiatric emergency services. Ozone is a component of photochemical smog and a powerful oxidant, and is considered as one of the most important air pollutants (Lauer, Reference Lauer2010). Environmental ozone exposure is associated with respiratory disorders such as loss of lung function, exacerbation of asthma and lung inflammation. Adverse effects within the central nervous system (CNS) have also been described (Martinez-Lazcano et al., Reference Martínez-Lazcano, González-Guevara, del Carmen Rubio, Franco-Perez, Custodio, Hernández-Cerón, Livera and Paz2013). A number of studies found that ozone may have a relevant interference with CNS physiology, that its exposure may be linked to brain disease and contribute to inflammation and oxidative stress (Block et al., Reference Block, Elder, Auten, Bilbo, Chen, Chen, Cory-Slechta, Costa, Diaz-Sanchez, Dorman, Gold, Gray, Jeng, Kaufman, Kleinman, Kirshner, Lawler, Miller, Nadadur, Ritz, Semmens, Tonelli, Veronesi, Wright and Wright2012). Animal studies investigating the neurotoxic effects of ozone inhalation show that ozone exposure may reduce dopaminergic neurons, and increase lipid peroxidation (Pereyra-Munoz et al., Reference Pereyra-Munoz, Rugerio-Vargas, Angoa-Péres, Borgonio-Pérez and Rivas-Aranciba2006), vascular endothelial growth factor, interleukin-6, tumour necrosis factor α (Araneda et al., Reference Araneda, Commin, Atlagich, Kitahama, Parraguez, Pequignot and Dalmaz2008) and c-Fos expression in different brain regions (Gackière et al., Reference Gackière, Saliba, Baude, Bosler and Strube2011). In rodents, short-term exposure results in cerebral oedema, neurodegeneration in the hippocampus, striatum and substantia nigra, and altered behaviour (Block et al., Reference Block, Elder, Auten, Bilbo, Chen, Chen, Cory-Slechta, Costa, Diaz-Sanchez, Dorman, Gold, Gray, Jeng, Kaufman, Kleinman, Kirshner, Lawler, Miller, Nadadur, Ritz, Semmens, Tonelli, Veronesi, Wright and Wright2012); also, long-term exposure to low levels of ozone causes changes in microglial activation, changes in cell morphology in the substantia nigra and striatum, and loss of nigral dopaminergic neurons (Kirrane et al., Reference Kirrane, Bowman, Davis, Hoppin, Chen, Patel, Sandler, Tanner, Vinikoor-Imler, Ward, Luben and Kamel2015). In addition, it has been shown that ozone may interfere with cerebral blood vessels by modulating the expression of genes involved in brain vasoreactivity, affect the immune system, irritate mucous membranes and alter neurotransmitters concentrations such as serotonin (as well as dopamine). Other studies suggest that chronic ozone exposure causes cortical and hippocampal alterations that involve reduced oxygen suppression and catalase activity, and lowered central monoamine levels (Gładka et al., Reference Gładka, Rymaszewska and Zatoński2018).
In this line of thought, the abovementioned pathological alterations may be associated with a worsening in psychiatric disorders or mental distress, so that ozone may be considered a potential environmental risk factor for impaired mental health.
Furthermore, air pollutant levels may conceivably affect mental health conditions not only through biological or chemical mechanisms, but also through different mechanisms including psychological mechanisms (e.g. feeling anxious because of the elevated levels of air pollution often reported in the media).
Recent reviews of literature about epidemiological studies on ambient ozone exposure and mental health found evidence that ozone exposure may affect autism spectrum disorders, may lead to motor disorders (Parkinson's disease) and cognitive impairment (dementia), and may have an influence on the incidence of depression and suicide, although results of reviewed studies were inconclusive (Gładka et al., Reference Gao, Xu, Guo, Fan and Zhu2018; Zhao et al., Reference Zhao, Markevych, Romanos, Nowak and Heinrich2018). In a 2016 study which used a methodology similar to our study (Szyszkowicz et al., Reference Szyszkowicz, Kousha, Kingsbury and Colman2016) ozone air levels showed an association with increased risk of an emergency department visit for depression in Canada. A 2007 study (Szyszkowicz, Reference Szyszkowicz2007) showed a significant increment in daily depression-related emergency department visits and ground level ozone for female patients in the warm season.
To the best of our knowledge, the current study is one of the first studies worldwide and the first study in Italy investigating the association between daily concentration of air pollutants and the daily number of visits to a psychiatric emergency unit.
Our results add to previous literature on existing evidence for air pollution to have a role in the cause or worsening of mental distress and psychiatric disorders (Szyszkowicz et al., Reference Szyszkowicz, Rowe and Colman2009, Reference Szyszkowicz, Willey, Grafstein, Rowe and Colman2010, Reference Szyszkowicz, Kousha, Kingsbury and Colman2016; Mehta et al., Reference Mehta, Kubzansky, Coull, Kloog, Koutrakis, Sparrow, Spiroll, Vokonas and Schwartz2015; Power et al., Reference Power, Kioumourtzoglou, Hart, Okereke, Laden and Weisskopf2015; Oudin et al., Reference Oudin, Bråbäck, Åström, Strömgren and Forsberg2016, Reference Oudin, Åström, Asplund, Steingrimsson, Szabo and Carlsen2018; Attademo et al., Reference Attademo, Bernardini, Garinella and Compton2017; Attademo and Bernardini, Reference Attademo and Bernardini2017; Bernardini et al., Reference Bernardini, Trezzi, Quartesan and Attademo2019).
Contrary to our hypothesis, we did not find a positive association between most of the air pollutants considered in our study, such as PM10, PM2.5, CO and NO2. This is in contrast with previous literature on this subject (Szyszkowicz et al., Reference Szyszkowicz, Rowe and Colman2009, Reference Szyszkowicz, Willey, Grafstein, Rowe and Colman2010, Reference Szyszkowicz, Thomson, Colman and Rowe2018; Mehta et al., Reference Mehta, Kubzansky, Coull, Kloog, Koutrakis, Sparrow, Spiroll, Vokonas and Schwartz2015; Power et al., Reference Power, Kioumourtzoglou, Hart, Okereke, Laden and Weisskopf2015; Chen et al., Reference Chen, Liu, Chen, Wang, Li, Kan and Fu2018; Duan et al., Reference Duan, Cheng, Luo, Bai, Zhang, Wang, Xu, Gao, Zhang and Su2018; Eguchi et al., Reference Eguchi, Onozuka, Ikeda, Kuroda, Ieiri and Hagihara2018; Kim et al., Reference Kim, Do Shin, Song, Ro, Kong, Kim, Ko and Lee2018; Oudin et al., Reference Oudin, Åström, Asplund, Steingrimsson, Szabo and Carlsen2018; Shin et al., Reference Shin, Park and Choi2018; Song et al., Reference Song, Zheng, Lu, Gui, Xu, Wu and Liu2018; Bai et al., Reference Bai, Zhang, Zhang, Cheng, Duan, Gao, Xu, Zhang, Wang and Su2019; Lee et al., Reference Lee, Lee, Kim, Kim, Myung, Kim and Kim2019; Qiu et al., Reference Qiu, Zhu, Wang, Pan, Pu, Zeng, Zhang, Peng and Zhou2019).
This could be explained by the methodological limitations of our study, which are several.
First, our sample size is smaller than most previous studies on air pollution exposure and mental disorders. Second, air pollution levels in Umbria region are lower than in China or big cities that were sources of most previous studies on this topic, resulting in limited comparability and generalisability of our findings. Third, we only report the number of emergency department admissions; we do not have data about clinical and socio-demographic characteristics of the admitted patients. Future studies should focus on elucidating the impact of air pollution levels in specific socio-demographic or diagnostic groups. Fourth, as in most previous time-series studies, we utilised measurements from fixed-site monitor stations as a proxy for the population pollutants exposure level, with the simplified assumption that each person has the same exposure. Exposure may vary depending on different factors such as location of home and workplace, occupational setting and time spent outdoors. Fifth, the study period was relatively short. Our study has also some notable strengths. First, we provide data concerning emergent (non-scheduled) admissions to emergency department of two hospitals, while some of the previous studies on this topic reported data about hospital admissions for mental disorders which included both emergent and scheduled admissions. Second, we used air monitoring data for five types of air pollutants which were averaged across 16 monitor stations dispersed in the region, which is more representative of the general population exposure than data from one single monitor station.
Data
The data are available on request from the corresponding author.
Acknowledgements
Our special thanks go to all the staff of Arpa Umbria – Agenzia Regionale per la Protezione Ambientale dell'Umbria.
Financial support
The current study received no specific grant or other funding from any funding agency, commercial or not-for-profit sector.
Conflict of interest
The authors have no conflict of interests.


 Open access