




Introduction
The uptake of compounds across biological barriers is a fundamental process studied across various scientific disciplines, including toxicology, pharmacology and plant biology (Wang and Liu, Reference Wang and Liu2007; Basar et al., Reference Basar, Mead, Shum, Rauter, Ay, Skaletz-rorowski and Brockmeyer2024). In plants, the uptake of active ingredients (AIs) into tissues is of particular importance in determining the efficacy and environmental impact of agrochemicals. The movement of agrochemicals, biologicals and nutrients from the environment into plant structures involves complex interactions between a compound’s physicochemical properties with the plant’s anatomy and physiological processes. These processes have been explored for leaf and root tissues in both weeds and crops (Mendes et al., Reference Mendes, Mielke, D’antonino, Alberto da Silva, Mendes and Alberto da Silva2022); however, uptake of AIs into seeds, particularly weed seeds, is less well studied.
The testa (seed coat) plays a crucial role in protecting the embryo and regulating exchanges between the seed and its environment (Bewley et al., Reference Bewley, Bradford, Hilhorst and Nonogaki2013), as well as regulating seed dormancy and germination (Finch-Savage and Leubner-Metzger, Reference Finch-Savage and Leubner-Metzger2006). The application of germination stimulants and inhibitors has been an important approach in studying seed dormancy and classifying the dormancy types of different species (Baskin and Baskin, Reference Baskin and Baskin2004). Germination stimulants and inhibitors have also been studied as alternative approaches to weed control to manage the emergence timing of weeds (Donald and Tanaka, Reference Donald and Tanaka1993; Goggin and Powles, Reference Goggin and Powles2014); however, reports on the sensitivity of species to germination stimulants are highly variable between studies.
Several different methods have been used to explore these processes, including whole-seed experiments to measure compound uptake by placing seeds in solutions of different chemical compounds and monitoring concentration changes in the media (Rieder et al., Reference Rieder, Buchholtz and Kust1970; Garcinuño et al., Reference Garcinuño, Fernández-hernando and Cámara2003). Some incubation studies have also used dyes or radioactive solutes to enable the visualization of solute uptake (Querou et al., Reference Querou, Euvrard and Gauvrit1997; Salanenka and Taylor, Reference Salanenka and Taylor2008). Experiments with isolated testa have also been successfully employed to investigate solute uptake in Pisum sativum (Niemann et al., Reference Niemann, Burghardt, Popp and Riederer2013).
During imbibition, seeds swell by absorbing water. During and after this process, it has been proposed that two permeation pathways control the uptake of solutes into seeds. In the lipophilic pathway, the solute partitions into the lipophilic barrier (i.e. testa) and moves across this barrier by diffusion. By contrast, in the hydrophilic pathway, the solute does not partition into the lipophilic phase, but instead diffuses across the barrier in the aqueous phase. In systems where the lipophilic pathway dominates, solutes with a higher lipophilicity can more easily permeate the tissue (Stein, Reference Stein1986; Kerler and Schönherr, Reference Kerler and Schönherr1988). Conversely, permeability in the aqueous pathway is more determined by molecular volume, due to travel through tightly structured matrices in solution (Schönherr and Schreiber, Reference Schönherr and Schreiber2004).
Amaranthus sp. is a genus of annual or short-lived perennial plants which contains species cultivated as leafy vegetables or pseudocereals and ornamental plants but also contains some of the most difficult-to-control weed species. A. palmeri is considered one of the most economically damaging weeds globally, due to a combination of weedy traits such as multi-herbicide resistance, high crop competition and prolific seed production (Ward et al., Reference Ward, Webster and Steckel2013). A. palmeri is a dioecious species, with female plants able to produce up to 600,000 seeds per plant when growing without competition (Keeley et al., Reference Keeley, Carter and Thullen1987). Amaranthus seeds form persistent seed banks in agricultural soils, with viable seed having been recovered after 17 years of burial (Burnside et al., Reference Burnside, Wilson, Weisberg and Hubbard1996). Amaranthus spp. typically possess physiological dormancy and have an optimal temperature range for germination from 30°C to 40°C (Baskin and Baskin, Reference Baskin and Baskin1998) and do not produce mucilage during imbibition.
In this study, we aim to characterize the permeability of weedy Amaranthus seeds (A. palmeri, A. retroflexus and A. tamariscinus) to a range of solutes with differing properties. We hypothesize that the permeability of Amaranthus sp. seeds will reflect the sensitivity of these seeds to germination stimulants, and that the uptake of specific solutes will vary depending on their physical properties. We aim to determine the relative importance of the hydrophilic or the lipophilic pathways for testa permeation of organic solutes into Amaranthus sp. seeds. Using microscopy and image analysis techniques, we aim to determine if these differences in solute permeability are associated with the thickness of the testa.
Materials and methods
Seed material, viability assays and germination kinetics
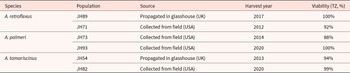
A range of seed populations of A. palmeri, A. retroflexus and A. tamariscinus (Table 1) were acquired from different sources. All populations were unrelated (i.e. glasshouse populations were not propagated from field collections included in this study). To determine the viability of the populations, a tetrazolium viability assay was performed according to the International Seed Testing Association (ISTA) guidelines on 200 seeds per population (ISTA, 2003) independently of the germination assays. All germination assays were performed in 24-well cell culture plates (Costar® 3526 Plates, Corning® New York, USA) with 1 filter paper (Whatman #1 Ø 15 mm, Whatman GmbH, Dassel, Germany) with 300 µL of media and 4 replicates of approximately 30 seeds. The germination media consisted of purified water + 0.1% dimethyl sulfoxide (DMSO; 99.9+% Purity, Alfa Aesar GmbH & Co KG, Massachusetts, USA) with differing concentrations of the germination stimulants norflurazon (CAS 27314-13-2, Duchefa Biochemie, Haarlem, Netherlands) and gibberellic acid (GA3, CAS 77-06-5, Duchefa Biochemie, Haarlem, Netherlands). Fifty millimolar stock solutions of these compounds were prepared in absolute DMSO. Control treatments contained 0.1% DMSO to control for solvent effects, but did not contain gibberellin or norflurazon. Germination assays were incubated at 20°C (suboptimal temperature) or 32°C (optimal temperature) under continuous lighting conditions in environmental test chambers (Adaptis® CMP6010, Conviron™, Pembina, USA). The cumulative proportion of seeds reaching testa rupture and endosperm rupture (Figure 1) was counted regularly over 20 days using a stereomicroscope (MZ16, Leica Camera, Wetzlar, Germany), and percentage germination was calculated on a total seed basis. Analysis of the data was performed using GraphPad Prism Software (v10.4.0, GraphPad Software, California, USA). For the seed burial experiments, 1 g of seeds was buried in nylon mesh bags with a 90 µm pore size in sandy loam soil in a large planting trough. The soil was kept moist throughout the experiment and incubated in a cold room in the dark at 4°C. Seeds were exhumed and dried after 21 weeks of burial to mimic cold soil temperatures over winter. No substantial fungal contamination was observed on the seeds after recovery, and the seeds appeared intact.
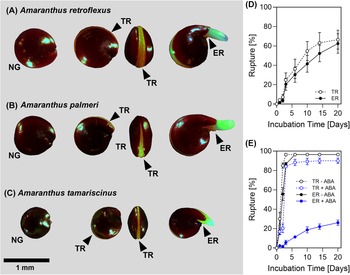
Germination kinetics of Amaranthus sp. (A–C) Visible stages during the germination of various Amaranthus sp. (D–E) Germination kinetics of A. retroflexus JH89 at (D) 20°C and (E) 32°C in the presence or absence of 10 µM ABA. NG, not germinated; TR, testa rupture; ER, endosperm rupture. Error bars represent standard error of the mean for 4 replicates of ⁓30 seeds.

Figure 1 Long description
The image A showing four seed images labeled NG, TR, TR and ER. The image B showing four seed images labeled NG, TR, TR and ER. The image C showing four seed images labeled NG, TR, TR and ER. A scale bar is labeled 1 millimeter. The image D showing a line graph. The x-axis label is Incubation Time [Days]. The y-axis label is Rupture [%]. The x-axis shows 0, 5, 10, 15, 20. The y-axis shows 0, 20, 40, 60, 80, 100. Two series are shown in the legend: TR and ER. Both series start near 0 at day 0. Points with error bars are plotted at multiple time values between 0 and 20 days. The image E showing a line graph. The x-axis label is Incubation Time [Days]. The y-axis label is Rupture [%]. The x-axis shows 0, 5, 10, 15, 20. The y-axis shows 0, 20, 40, 60, 80, 100. Four series are shown in the legend: TR plus ABA, TR minus ABA, ER plus ABA, ER minus ABA. Points are plotted from day 0 to day 20. Two series rise to near 100 by about day 5 and then remain near 100 through day 20. One series remains near 0 across the time range. One series increases gradually and is near 20 to 30 by day 20.
Information on the harvest year and viability of all Amaranthus sp. populations used in this study

Table 1 Long description
The table lists six Amaranthus populations, giving species, population code, seed source, harvest year, and viability measured by the TZ test as a percent. Viability is consistently high across all entries, spanning 88 to 100 percent. A. retroflexus includes JH89 propagated in a UK glasshouse in 2017 with 100 percent viability and JH71 collected from a US field in 2012 with 92 percent viability. A. palmeri includes JH73 collected from a US field in 2014 with 88 percent viability, the lowest value, and JH93 collected from a US field in 2020 with 100 percent viability. A. tamariscinus includes JH54 propagated in a UK glasshouse in 2013 with 94 percent viability and JH82 collected from a US field in 2020 with 99 percent viability. The most recent harvest year shown, 2020, includes two field-collected populations with near-perfect or perfect viability. Because only one viability measure is provided per population, the table does not indicate variability within populations or changes over time for the same population.
Analysis of solute uptake into seeds
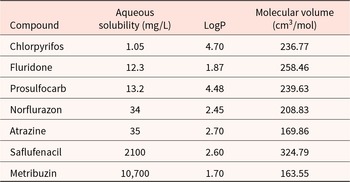
A series of pesticidal compounds were selected to have a diverse range of physical properties (lipophilicity and aqueous solubility; Table 2), as retrieved from the Pesticide Properties Database (www.sitem.herts.ac.uk/aeru/ppdb). Molecular volume of the compounds was calculated using the Percepta Software (v.2024.1.4, Build 3824; ACD Labs, Toronto, Canada). The compounds were first solubilized at 1000 ppm in an 80% (v/v) acetonitrile solution, before diluting to a 10 ppm treatment solution containing 0.8% (v/v) acetonitrile. Three replicates of approximately 60 seeds were incubated in 500 µL of a 10 ppm aqueous solution of the chemical compounds in a 2 mL PrecellysTM tube (Bertin & Cie, Montigny-le-Bretonneux, France) containing 4 mm steel homogenization beads. Seeds were incubated in the treatment solution at room temperature for 24 hours and then repeatedly washed with an excess of water to remove any residual treatment solution. Seeds were then washed with 1 mL of absolute heptane and the sample agitated to remove any compound which had adhered to the surface of the testa. After removal of the heptane, 1 mL of 80% (v/v) acetonitrile solution was added, and the samples were frozen at −20°C in a laboratory freezer. Frozen samples were then homogenized using a ball mill (Precellys Evolution Touch, Bertin & Cie, Montigny-le-Bretonneux, France) at 8800 rpm twice for 30 seconds with a 30-second pause between each cycle. The thawed supernatant was centrifuged at 10,000 rpm for 15 minutes at room temperature, and the supernatant was removed and analysed using liquid chromatography mass spectrometry (LC-MS). A calibration curve was generated by adding known concentrations (2, 1, 0.5, 0.25, 0.125 and 0.0625 ppm) of the different compounds to an untreated seed extract produced as described above. All samples were run on a VanquishTM liquid chromatograph with a HorizonTM binary Ultra-Performance Liquid Chromatography (UHPLC) pump and analysed on an Orbitrap ExplorisTM 120 high-resolution mass spectrometer (Thermo Fisher Scientific, Massachusetts, USA). A C18 Reverse Phase HPLC column was used with 0.2% aqueous solution of formic acid and absolute acetonitrile. Each 2-minute liquid chromatography cycle was run at a flow rate of 0.7 mL min−1 with a transition of 5–95% acetonitrile as a proportion of the 0.2% formic acid solution. The LC-MS data were analysed using the XcaliburTM Software (v4.6, Thermo Fisher Scientific, Massachusetts, USA).
Physical properties of all the solutes used in this study
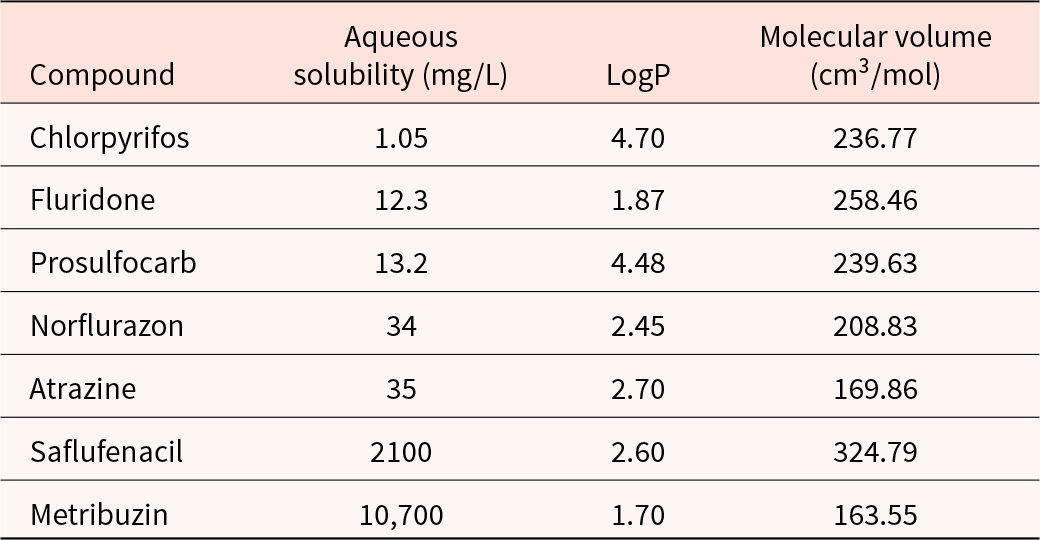
Table 2 Long description
The table lists seven compounds with their aqueous solubility in milligrams per liter, LogP, and molecular volume in cubic centimeters per mole. Solubility varies widely, from 1.05 for chlorpyrifos up to 10,700 for metribuzin, with saflufenacil also high at 2,100. Several compounds cluster at low solubility: fluridone 12.3, prosulfocarb 13.2, norflurazon 34, and atrazine 35. LogP ranges from 1.70 for metribuzin and 1.87 for fluridone to 4.48 for prosulfocarb and 4.70 for chlorpyrifos, indicating large differences in hydrophobicity. Molecular volume ranges from 163.55 for metribuzin and 169.86 for atrazine up to 324.79 for saflufenacil, with most others near 209 to 258. Higher LogP values generally coincide with lower solubility in this set, though the table does not establish causation and other chemical factors may contribute.
Scanning electron microscopy (SEM) and image analysis
Seeds were mounted on a Quorum specimen shuttle using Tissue-Tek® O.C.T. compound and plunge-cooled in a liquid nitrogen slush. Samples were transferred to a Quorum P3010T cryo-chamber (Quorum, Lewes, UK), where cross-sections were obtained manually with a scalpel. The samples were then sublimated at −90°C for 3 minutes to remove surface ice and sputter-coated with Gold/Palladium (60/40) for 60 seconds at 5 mA. Scanning electron microscopy (SEM) characterization was performed using a Hitachi SU8220 Field Emission Scanning Electron Microscope (Hitachi, Tokyo, Japan) at a temperature of −160°C and an accelerating voltage of 7 and 10 kV.
Multiple areas were examined for each seed for 10 replicate seeds, and representative images were selected for analysis. A custom image analysis tool was developed using Python (v3.7, Graphical User Interface developed with pqyt) to measure testa thickness from SEM images. The algorithm identifies the testa boundaries and calculates thickness at multiple points along the seed circumference. Ten seeds per population were analysed, with measurements performed on the testa surrounding three main areas of the seed: cotyledon, perisperm, and radicle. One hundred thickness measurements were performed per area per seed.
Statistical analysis
Statistical analysis of the data was conducted using GraphPad Prism (version 10.4.2, Graphpad Software LLC, San Diego, California, USA). Testa thickness measurements were analysed using unpaired T-tests separately for each set of measurements. For the analysis of solute uptake data, unpaired T-tests were used to compare individual compounds between the two populations. A conservative significance threshold (α = 0.01) was adopted given the number of pairwise tests performed. ‘Cohen’s d and f were calculated to measure the magnitude of effects when t-tests and multivariate analyses were conducted, respectively. Cohen (Reference Cohen1988) suggests the following guidelines for effect size interpretation when discipline-specific values are not well developed: small effect d = 0.2, f = 0.10; medium effect d = 0.5, f = 0.25; and large effect d = 0.8, f = 0.4.’
Results
Germination process in Amaranthus sp. seeds and viability
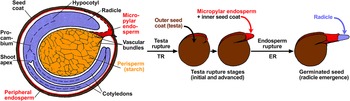
Germination in the Amaranthus sp. tested was observed as a two-step process. After imbibition, the first visible event during germination is the separation of two hemispheres of the testa to expose the peripheral endosperm, which is hereafter described as ‘testa rupture; TR’ (Figure 1A–C). Following testa rupture, the radicle expands and ruptures the micropylar endosperm, which hereafter is described as ‘endosperm rupture; ER’ (Figure 1A–C), which can be considered the completion of the germination program (sensu stricto). Germination speed and total proportion were greater at 32°C compared to 20°C (Figure 1D and E). In the absence of abscisic acid (ABA), TR and ER occur in quick succession; however, when 10 µM ABA is exogenously applied, ER is disproportionately affected, indicating that TR and ER are independently regulated (Figure 1E). A diagram showing a generalized germination process for Amaranthus sp. is shown in Figure 2. The viability of the Amaranthus sp. populations as determined by tetrazolium assays is shown in Table 1.
Diagram showing the anatomy of the germination process in Amaranthus sp. A cross-section diagram of an Amaranthus sp. Seed highlights the structures involved in the germination process. TR, testa rupture; ER, endosperm rupture.

Figure 2 Long description
A schematic illustration of a seed and germination stages. On the left, a circular seed cross section is labeled: Hypocotyl, Radicle, Micro-pylar endo-sperm, Outer seed coat (testa), Micropylar endosperm + inner seed coat, Vascular bundle, Perisperm (starch), Cotyledons, Peripheral endosperm, Shoot apex and Pro-cambium. A label near the seed reads Testa rupture, with the text TR below it. To the right, three circular stage diagrams are arranged left to right with arrows between them. The first stage has the text Testa rupture stages (initial and advanced) below it and the text TR below it. The second stage has the text Endosperm rupture above it and the text ER below it. The third stage has the label Radicle above it and the text Germinated seed (radicle emergence) below it.
Sensitivity of Amaranthus sp. populations to germination stimulants
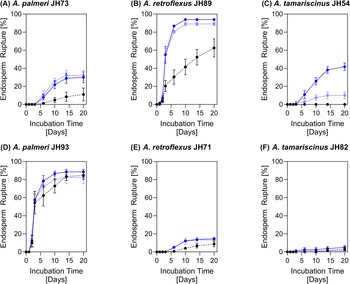
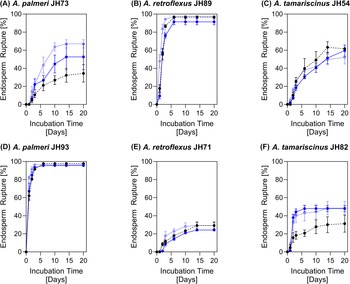
A series of populations showed variable responses to the exogenous application of gibberellin A3 (GA3) and norflurazon. Gibberellin application increased the total germination proportion of populations JH73, JH89 and JH71 but showed less pronounced stimulation of germination in populations JH93, JH54 and JH82 when incubated at 20°C (Figure 3). Exogenous application of norflurazon increased total germination of JH73 and JH82 but not the remaining populations (Figure 4A and F) when incubated at 32°C. Maximal germination was already achieved in JH89 and JH93 (Figure 4B and D); therefore, no germination stimulation was expected from these populations. Across all populations, instances of TR were only observed after 24 hours of incubation, even with the addition of germination stimulants, indicating that during the solute uptake experiments the testa remained intact.
Response of Amaranthus sp. populations to exogenously applied GA3 when incubated at 20°C, each graph (A–F) representing a different population. Lines represent the cumulative percentage of seeds at or after the endosperm rupture stage over time. The light blue represents 10 µM GA3, the darker blue line 100 µM GA3 and the black dotted line represents the untreated control. Error bars represent the standard error of the mean for 4 replicates of ⁓30 seeds.

Figure 3 Long description
The image contains six line graphs, each representing a different population′s response to gibberellin A3 over incubation time in days. The vertical axis is labeled Endosperm Rupture [%], ranging from 0 to 100. The horizontal axis is labeled Incubation Time [Days], ranging from 0 to 20. Each graph includes three lines: a light blue line for 10 micromolar GA, a darker blue line for 100 micromolar GA and a black dotted line for the untreated control. In graph A (A. palmeri JH73), all lines show a gradual increase, with the darker blue line reaching the highest rupture percentage. In graph B (A. retroflexus JH89), the darker blue line quickly rises to a high plateau, while the light blue and black lines show slower increases. Graph C (A. tamariscinus JH54) shows a moderate increase for all lines, with the darker blue line slightly higher. Graph D (A. palmeri JH93) displays a rapid increase for the darker blue line, reaching a high plateau, while the other lines rise more slowly. Graph E (A. retroflexus JH71) shows minimal increase across all lines, with the darker blue line slightly higher. Graph F (A. tamariscinus JH82) indicates a slow increase for all lines, with the darker blue line achieving a slightly higher percentage. Overall, the darker blue line generally shows the highest endosperm rupture across populations, indicating a stronger response to 100 micromolar GA.
Response of Amaranthus sp. populations to exogenously applied norflurazon when incubated at 32°C, each graph (A–F) representing a different population. Lines represent the cumulative percentage of seeds at or after the endosperm rupture stage over time. The light blue represents 10 µM norflurazon, the darker blue line 100 µM norflurazon and the black dotted line represents the untreated control. Error bars represent the standard error of the mean for 4 replicates of ⁓30 seeds.

Figure 4 Long description
The image A showing a line graph titled A. palmeri JH73. Horizontal axis label: Incubation Time with unit Days. Horizontal axis range: 0 to 20. Vertical axis label: Endosperm Rupture with unit percent. Vertical axis range: 0 to 100. Three line series are shown: two solid lines with point markers and one dotted line with point markers. Error bars are shown on points. Readable plotted values are not available as exact coordinate pairs. Trend description: all three series rise from near 0 at day 0. One solid line rises fastest and reaches a plateau around the 60 to 70 percent region by about day 10 to day 15. The second solid line rises to a lower plateau around the 50 percent region by about day 10 to day 15. The dotted line rises more slowly and remains lower, ending around the 30 to 40 percent region by day 20. The image B showing a line graph titled A. retroflexus JH89. Horizontal axis label: Incubation Time with unit Days. Horizontal axis range: 0 to 20. Vertical axis label: Endosperm Rupture with unit percent. Vertical axis range: 0 to 100. Three line series are shown: two solid lines with point markers and one dotted line with point markers. Error bars are shown on points. Readable plotted values are not available as exact coordinate pairs. Trend description: all three series rise steeply from near 0 at day 0 to near the 90 to 100 percent region by about day 2 to day 5, then remain near that level through day 20. The image C showing a line graph titled A. tamariscinus JH54. Horizontal axis label: Incubation Time with unit Days. Horizontal axis range: 0 to 20. Vertical axis label: Endosperm Rupture with unit percent. Vertical axis range: 0 to 100. Three line series are shown: two solid lines with point markers and one dotted line with point markers. Error bars are shown on points. Readable plotted values are not available as exact coordinate pairs. Trend description: all three series increase gradually from near 0 at day 0. By day 20, the dotted line is highest, ending around the 60 to 70 percent region. The two solid lines end lower, around the 50 to 60 percent region. The image D showing a line graph titled A. palmeri JH93. Horizontal axis label: Incubation Time with unit Days. Horizontal axis range: 0 to 20. Vertical axis label: Endosperm Rupture with unit percent. Vertical axis range: 0 to 100. Three line series are shown: two solid lines with point markers and one dotted line with point markers. Error bars are shown on points. Readable plotted values are not available as exact coordinate pairs. Trend description: all three series rise rapidly from near 0 at day 0 to near the 90 to 100 percent region by about day 2 to day 5, then remain near that level through day 20. The image E showing a line graph titled A. retroflexus JH71. Horizontal axis label: Incubation Time with unit Days. Horizontal axis range: 0 to 20. Vertical axis label: Endosperm Rupture with unit percent. Vertical axis range: 0 to 100. Three line series are shown: two solid lines with point markers and one dotted line with point markers. Error bars are shown on points. Readable plotted values are not available as exact coordinate pairs. Trend description: all three series rise from near 0 at day 0 and remain in the lower part of the axis. By day 20, the dotted line is highest, ending around the 30 percent region. The two solid lines end lower, around the 20 to 25 percent region. The image F showing a line graph titled A. tamariscinus JH82. Horizontal axis label: Incubation Time with unit Days. Horizontal axis range: 0 to 20. Vertical axis label: Endosperm Rupture with unit percent. Vertical axis range: 0 to 100. Three line series are shown: two solid lines with point markers and one dotted line with point markers. Error bars are shown on points. Readable plotted values are not available as exact coordinate pairs. Trend description: one solid line rises quickly to around the 40 to 50 percent region by about day 2 to day 5 and then stays near that level through day 20. The second solid line rises to a similar level and remains near it through day 20. The dotted line rises more slowly and remains lower, ending around the 30 to 40 percent region by day 20. Overall across the six graphs, the three series show different rates of increase and different plateau levels depending on the population, with some populations reaching near 100 percent early and others remaining below about 70 percent by day 20.
Microscopic characterization of Amaranthus sp. seeds
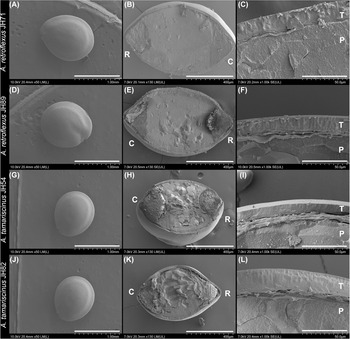
SEM revealed the distinct morphological characteristics of the Amaranthus sp. examined (Figure 5). Cross-sectional views (Figure 5B, E, H and K) provided insights into the overall seed structure, while higher magnification images (Figure 5C, F, I and L) highlighted the specific features of the testa. A. retroflexus seeds exhibited a robust testa structure (Figure 5A–F). The testa appeared as a defined multi-layered structure that suggests enhanced integrity. A. tamariscinus JH54 seeds displayed a comparatively thinner testa (Figure 5G–L). The layering was less pronounced, with a more compact overall structure.
Morphological characterization of seeds and testa. SEM images of mature seeds from two contrasting populations of two Amaranthus species: A. retroflexus (JH71 and JH89, A–F) and A. tamariscinus (JH54 and JH82, G–I). A low-magnification image of whole seeds for each population is shown (A, D, G, F) alongside a cross-sectional view showing the overall seed architecture, including the embryo, cotyledon and surrounding testa (B, E, H, K). High-resolution images show a cross-section of the testa’s structure, showing its multi-layered composition and relative thickness (C, F, I, L). Scale bars are shown for each image. C, cotyledon area of the seed; R, radicle area of the seed; T, testa; P, perisperm. Error bars: A, D, G and J = 1.00 mm; B, E, H and K = 400 µm; and C, F, I and L = 50.0 µm.

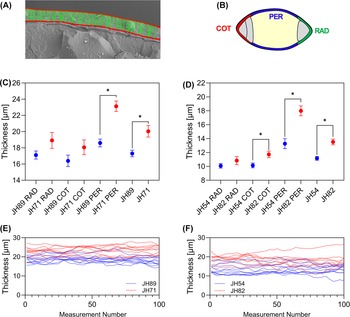
Testa thickness measurements were obtained using a custom imaging tool (Figure 6A) by measuring the thickness of the testa in three distinct regions of the seed from the SEM images (Figure 6B). Unpaired T-tests revealed very large population effects on average whole seed testa thickness for A. retroflexus (d = 1.50, t(18) = 5.6111, p = .0036) and A. tamariscinus (d = 2.15, t(18) = 4.803, p < .0001; Figure 6C and D). Likewise, a considerable tissue effect was present in both species. For example, a very large effect of the perisperm region on testa thickness was detected between populations of A. retoflexus (d = 2.51, t(18) = 5.611, p < .001; Figure 6C) and A. tamariscinus (d = 2.10, t(18) = 4.701, p = .0002; Figure 6D). However, the effects of the tissue areas surrounding the cotyledons or radicle on testa thickness for populations of both species were small and not statistically significant. These differences in the perisperm area of the testa are further illustrated by the profile plots of individual replicates, which give an approximation of the thickness profile of the testa for the two contrasting populations of each species (Figure 6E and F).
Testa thickness measurements. (A) Illustration demonstrating the method employed to measure the thickness of the testa by approximating the testa boundaries (red lines) and measuring the distance between adjacent points (green lines). (B) Diagram of the seed structure, showing the position of the different regions of the testa, which were measured. The boxplots (C and D) show the average thickness measurements of seeds in different regions of the seed for two A. retroflexus populations (JH89 and JH71, C) and two A. tamariscinus populations (JH54 and JH82, D). Box plots show the mean and range of measurements. Statistically significant differences (α = 0.05), as determined by unpaired t-tests, are indicated by an asterisk. Profile plots (E, F) are shown for the perisperm region of seeds for the two A. retroflexus (E) and A. tamariscinus (F) populations, where each line represents 100 individual thickness measurements for one seed, coloured by population. COT, testa surrounding cotyledon region; PER, testa surrounding perisperm region; RAD, testa surrounding radicle region.

Figure 6 Long description
Panel A shows an illustration demonstrating the method for measuring testa thickness by approximating boundaries and measuring distances between points. Panel B is a diagram of seed structure with regions labeled as COT (cotyledon), PER (perisperm) and RAD (radicle). Panel C presents a point plot with the vertical axis labeled Thickness in micrometers, ranging from 16 to 26. The horizontal axis lists categories: JH89 RAD, JH71 RAD, JH89 COT, JH71 COT, JH89 PER, JH71 PER. Statistically significant differences are marked with an asterisk, notably between JH89 PER and JH71 PER. Panel D shows a similar point plot with Thickness in micrometers from 10 to 22. Categories include JH54 RAD, JH82 RAD, JH54 COT, JH82 COT, JH54 PER, JH82 PER, with significant differences between JH54 COT and JH82 COT and JH54 PER and JH82 PER. Panel E displays a line graph with Thickness in micrometers from 0 to 30 and Measurement Number from 0 to 100. Lines represent JH89 and JH71, showing consistent thickness across measurements. Panel F features a similar line graph for JH54 and JH82, with lines showing slight variation. The graphs collectively illustrate that thickness varies by region and population, with significant differences in certain regions. The micrograph and diagram provide context for where measurements are taken, while the plots compare thickness across regions and populations, highlighting variability and significant differences.
Uptake of differing compounds
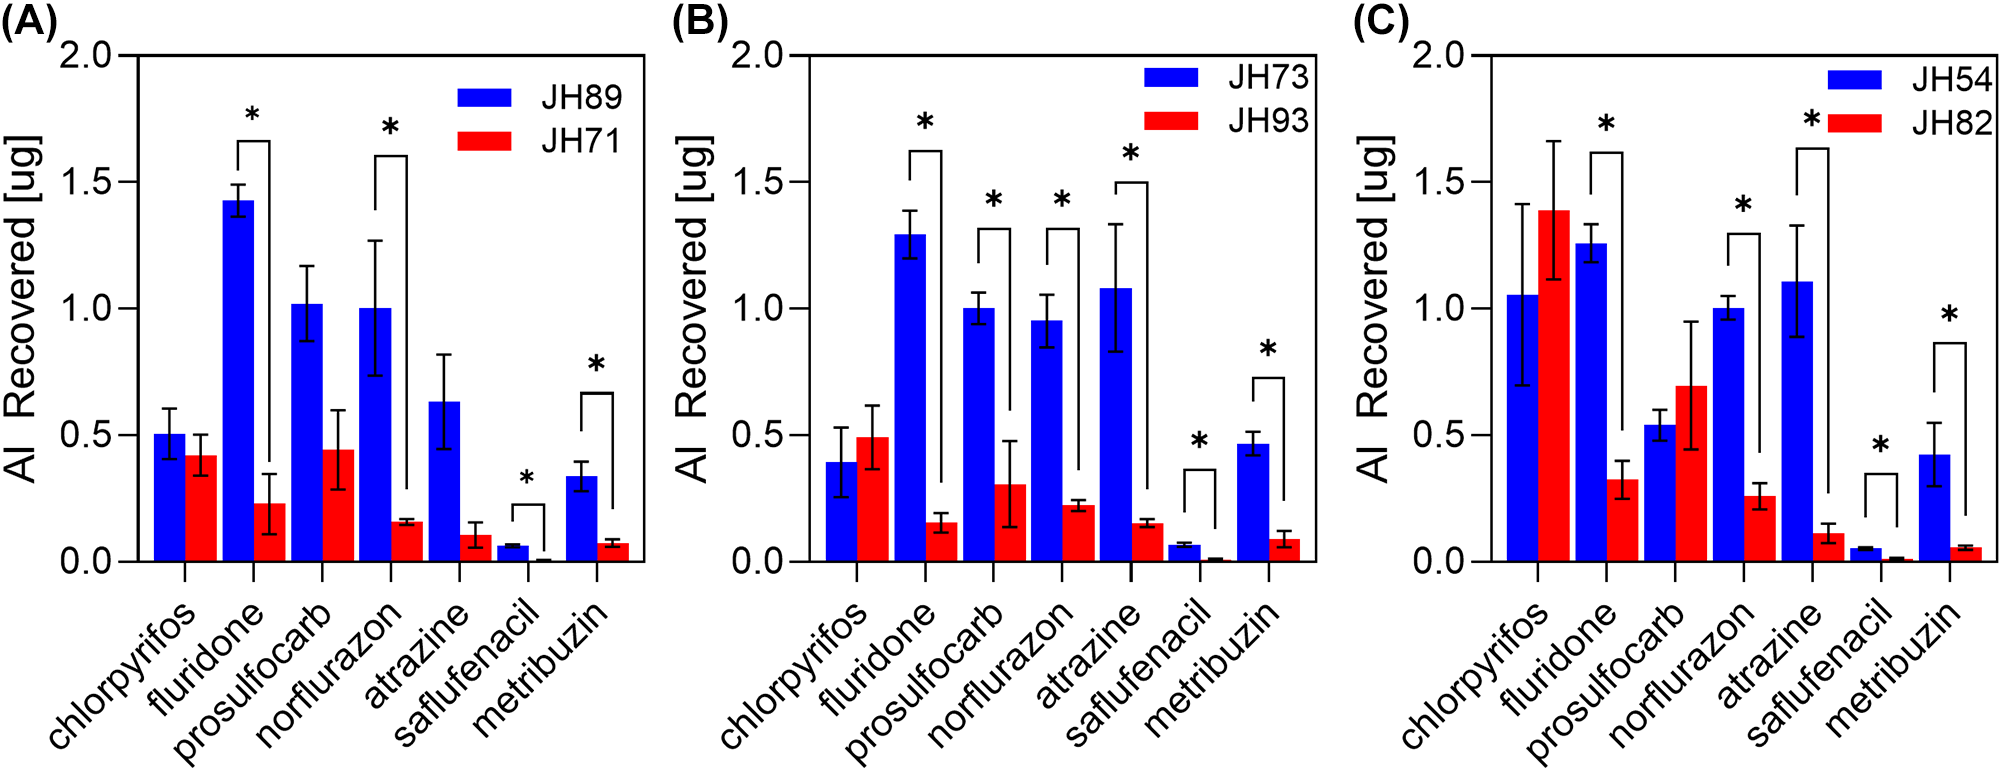
Across all three species, the amount of AI recovered from the seeds (solute uptake) differed substantially between the populations and AIs (Figure 7). Unpaired T-tests were used to determine the significance of differences between the population pairs for each AI, and statistical differences (p < .01) are represented on the graphs by an asterisk. Very large and statistically significant differences in uptake between different AIs (f = 1.35, F(96,84) = 26.62, p < .0001). Chlorpyrifos showed no detectable population differences in uptake, with all comparisons non-significant (ps = .50–.62) and negligible effect sizes across population comparisons (Cohen’s d = −0.60 to 0.53). In contrast, fluridone and norflurazon demonstrated robust and statistically significant population differences, with very large to extremely large effect sizes (fluridone d = 7.17–9.15; norflurazon d = 2.59–8.69; all ps < .035). Overall, relative AI recovery patterns were similar between A. retroflexus and A. palmeri (Figure 7A and B), whereas A. tamariscinus populations displayed distinct recovery profiles consistent with larger observed effect sizes (Figure 7C).
Uptake of solutes by Amaranthus sp. seeds. A series of graphs showing the uptake of seven different compounds (AIs) into contrasting populations of (A) A. retroflexus, (B) A. palmeri and (C) A. tamariscinus. The coloured bars represent the amount of solute recovered after 24 hours of incubation in a 10 ppm solution of solute, for two contrasting populations (blue and red) for each species. Error bars represent the standard error of the mean. Asterisks indicate statistically significant differences based on unpaired t-tests evaluated at α = 0.01.

Figure 7 Long description
The image contains three bar graphs comparing the recovery of active ingredients across two populations for seven compounds. The x-axis lists the compounds: chlorpyrifos, fluridone, norflurazon, prothioconazole, atrazine, safener and metribuzin. The y-axis is labeled ′AI Recovered′ in micrograms, ranging from 0.0 to 2.0. Bars are vertical and grouped by compound, with two bars per compound representing different populations. Populations are distinguished by color: blue and red. Error bars indicate the standard error of the mean. Asterisks denote statistically significant differences. In graph A, the blue population (JH89) generally shows higher recovery than the red population (JH71), with fluridone and norflurazon having the largest differences. In graph B, the blue population (JH73) also tends to have higher recovery than the red population (JH93), with significant differences in fluridone and norflurazon. In graph C, the blue population (JH54) shows higher recovery than the red population (JH82), particularly for fluridone and norflurazon. Overall, fluridone and norflurazon exhibit the highest recovery differences across all graphs, while chlorpyrifos shows minimal differences between populations.
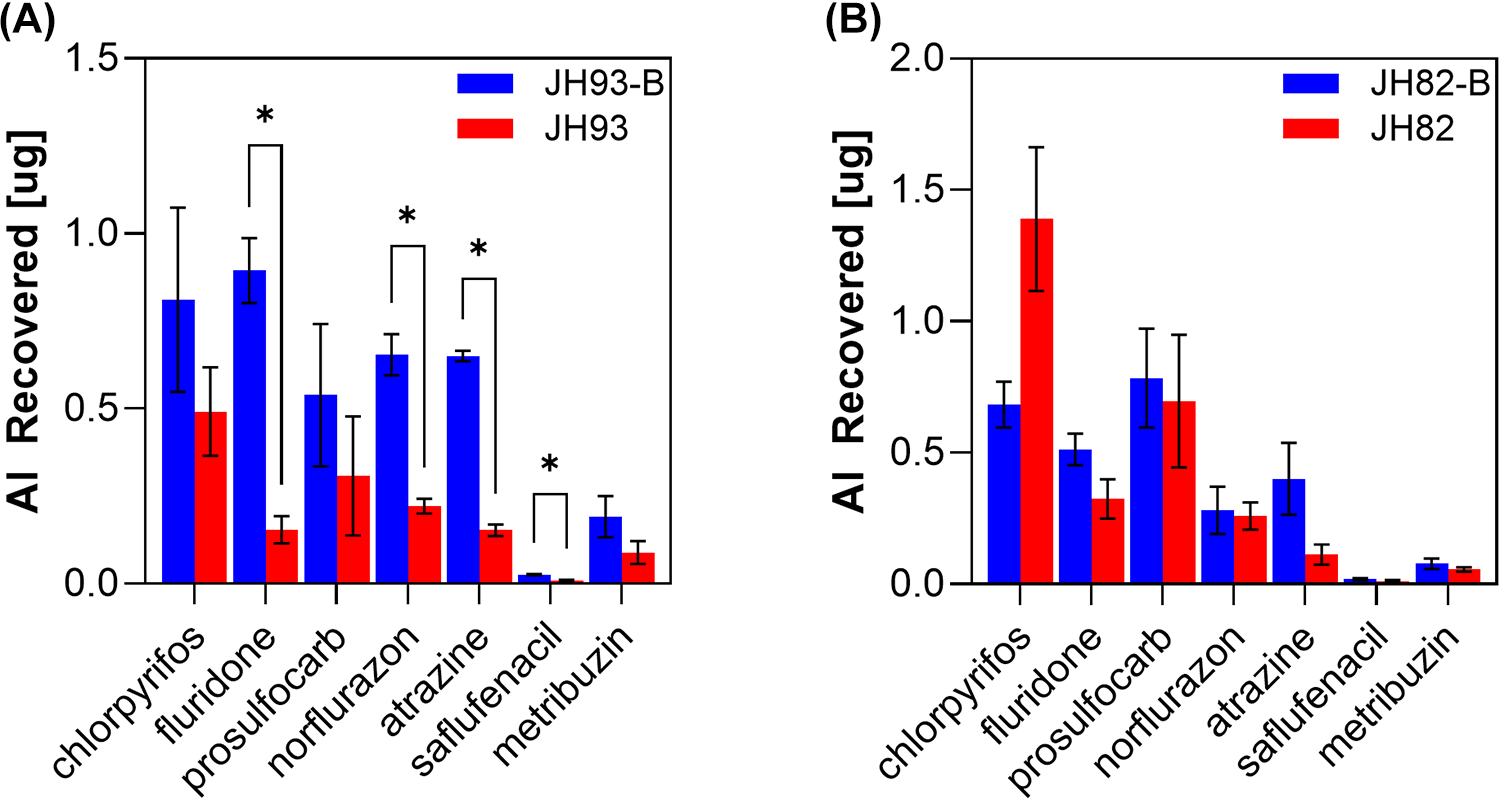
In A. palmeri JH93 burial significantly increased uptake for most AIs, with large and statistically significant effects for fluridone (p = .0018, d = −6.02), norflurazon (p = .0023, d = −5.63), atrazine (p < .001, d = −18.40) and saflufenacil (p = .0156, d = −3.30). In contrast, prosulfocarb and metribuzin showed no significant changes following burial (ps = .43 and .20; d = −0.71 and −1.24, respectively). In A. tamariscinus JH82, burial did not significantly alter uptake for any compound (ps = .07–.84), and effect sizes were small (Cohen’s d = −0.17 to 2.00), indicating no evidence of burial-driven changes in seed permeability across the tested solutes (Figure. 8).
Effect of burial on the uptake of solutes (AIs) by Amaranthus sp. seeds. Graphs showing the recovery of seven different solutes from (A) A. palmeri (JH93) and (B) A. tamariscinus (JH82) seeds. The red lines represent seeds which have not been buried, and the blue line represents seeds which have been buried for 21 weeks before treatment. Error bars represent the standard error of the mean. Asterisks indicate statistically significant differences based on unpaired t-tests evaluated at α = 0.01.

Figure 8 Long description
Two bar graphs show the recovery of seven solutes from seeds. The x-axis lists solutes: chlorpyrifos, fluridone, prosulfuron, norflurazon, atrazine, sulfentrazone and metribuzin. The y-axis represents AI recovered in micrograms, ranging from 0 to 1.5. Graph (a) compares JH93-B (blue) and JH93 (red) seeds, while graph (b) compares JH82-B (blue) and JH82 (red) seeds. Bars are vertical and grouped by solute. Error bars indicate standard error. Asterisks denote statistically significant differences. JH93-B shows higher recovery for most solutes compared to JH93, with significant differences in chlorpyrifos, prosulfuron and atrazine. JH82-B shows higher recovery than JH82, but with less pronounced differences.
Discussion
It is common practise in seed biology to exogenously apply different germination-modifying compounds, such as phytohormones and plant growth regulators, to seeds to characterize their viability, dormancy and to understand the phytohormone-mediated regulation of seed germination. For example, Baskin and Baskin (Reference Baskin and Baskin2004) proposed a commonly used seed dormancy classification system which relies in part on the sensitivity of seeds to treatment with gibberellic acid. Germination stimulants such as fluridone and norflurazon, both herbicidal phytoene desaturase inhibitors, have also been used to implicate de novo ABA biosynthesis in the regulation of thermoinhibition of germination (Toh et al., Reference Toh, Imamura, Watanabe and Nakabayashi2008). Chemical modification of phytohormones, for example, 3′-alkylsulfanyl ABAs like ‘AS6’, has also shown differences in potency when applied directly to Arabidopsis thaliana seeds (Takeuchi et al., Reference Takeuchi, Okamoto, Akiyama, Muto, Yajima, Sue, Seo, Kanno, Kamo, Endo and Nambara2014). Seed germination-based bioassays have also been employed to identify new gibberellin signalling agonists, such as ‘67D’ (Jiang et al., Reference Jiang, Shimotakahara, Luo, Otani and Nakamura2017). However, it is usually not clear in these studies how much of the AIs can directly reach the sites of action (the embryo, micropylar endosperm, etc.) to cause physiological changes to the seeds. In this study, we aimed to determine if there were population- and species-level differences in testa permeability to selected solutes and what might drive these differences, using Amaranthus sp. as a model.
Our morphological examination of Amaranthus sp. seeds showed that the embryo and perisperm are surrounded by a continuous, thick and layered testa between 10 and 25 µm in thickness depending on the species. In the contrasting populations selected for this study, those populations which had, on average, a thicker testa were less permeable to many AIs. This indicates that thickness plays a role in the permeability of the testa, depending on the solute in question.
Across a range of different solutes, uptake of the solutes into seeds varied across different populations. However, with a limited number of populations of diverse provenance, comparisons between populations and species should be made with caution. Some solutes more easily penetrated Amaranthus sp. seeds (e.g. fluridone and norflurazon), whereas other solutes had very limited recovery (e.g. saflufenacil). Previous studies on crop seeds have proposed two uptake pathways – either through lipophilic or hydrophilic routes (Stein, Reference Stein1986; Kerler and Schönherr, Reference Kerler and Schönherr1988). Our results indicate that lipophilicity alone did not explain the differences in uptake. For example, chlorpyrifos and prosulfocarb have similar measured lipophilicity (LogP = 4.7 and4.5, respectively) but differed substantially in their recovery in most populations. Additionally, the compound with the lowest uptake was saflufenacil (LogP = 2.6), which is more lipophilic than metribuzin (LogP = 1.7), which had substantially greater uptake. Molecular volume was also not clearly related to solute uptake; however, the compound with the greatest molecular volume (saflufenacil) had minimal uptake across all the populations. Taken together, the results indicate that the relationship between the physicochemical properties of a compound and testa permeability is complex. No single physical property investigated explained the differences in uptake between solutes; however, the lipophilic pathway plays a more important role than the hydrophilic pathway in Amaranthus sp. seeds, given that the most water-soluble compounds (e.g. metribuzin and saflufenacil) had the lowest uptake.
The application of gibberellic acid and norflurazon to different Amaranthus sp. elicited a wide range of responses. However, our results do not clearly indicate that either testa thickness or solute permeability influenced the seeds’ sensitivity to gibberellin or norflurazon application. The germination kinetics for the control treatments in these experiments were also highly variable between populations, which is likely due to their diverse provenance (age, viability, dormancy, etc.). Previous studies have shown that environmental conditions during seed maturation and storage affect seed germination physiology (reviewed by Finch-Savage and Leubner-Metzger, Reference Finch-Savage and Leubner-Metzger2006; Long et al., Reference Long, Gorecki, Renton, Scott, Colville, Goggin, Commander, Westcott, Cherry and Finch-Savage2015). A. tamariscinus was the species with the thinnest testa in both populations and exhibited similar levels of compound recovery compared to the other two species, yet appeared less sensitive to germination stimulants in both populations studied. Interestingly, the differences in permeability between populations of the same species appeared greater than the differences between the three Amaranthus spp. themselves. Based on the results generated in this study, it is challenging to disentangle the influence of testa permeability from the seeds’ life history to determine whether thickness or permeability impacts the sensitivity of different populations to germination stimulants. Future studies with further populations grown in differing controlled environments could help to clarify this.
Our burial experiments demonstrated that the permeability of the testa can change over time as part of a simulated weed seed bank. In this study, the effect depended on the species and population in question. Permeability to a range of solutes was increased in the A. palmeri population JH93, and less so in the case of A. tamariscinus population JH82. These effects could be the result of the action of abiotic factors, such as wetting and drying cycles (Berrie and Drennan, Reference Berrie and Drennan1971), or biotic factors such as the growth of microorganisms on the testa (Sperber et al., Reference Sperber, Steinbrecher and Graeber2017).
Aside from the uptake of solutes from the environment, the testa also plays an important role in the regulation of dormancy and germination, firstly as a physical barrier restraining the growth of the embryo (reviewed by Steinbrecher and Leubner-Metzger, Reference Steinbrecher and Leubner-Metzger2017) and secondly in regulating the exchange of gases and phytohormones from the seed (Upretee et al., Reference Upretee, Bandara and Tanino2024). For example, in the transparent testa (tt) mutants, where testa pigmentation is reduced and permeability to tetrazolium dyes is increased, germination is also more rapid than wildtype seeds (Debeaujon et al., Reference Debeaujon, Léon-kloosterziel and Koornneef2000). Exudation of positive regulators of seed dormancy, such as ABA, has also been shown to be an important process regulating germination in Beta vulgaris (Hermann, Reference Hermann, Meinhard and Dobrev2007). We observed more rapid germination in those A. tamariscinus and A. retroflexus populations with a thinner testa, indicating a role for testa thickness in regulating the speed of germination in Amaranthus sp. Further experiments would be required to determine if these populations germinated more rapidly due to a reduction in mechanical restraint, increases in water/gas exchange or increases in the exudation of inhibitory compounds.
The Amaranthus sp. included in this study are noxious weeds which cause substantial economic impacts on global agriculture. Increases in herbicide resistance have made Amaranthus sp. more challenging to control (Ward, Reference Ward, Webster and Steckel2013), and the formation of persistent weed seed banks exacerbates this problem (Burnside et al., Reference Burnside, Wilson, Weisberg and Hubbard1996). Alternative approaches to managing weed seed banks have been proposed, using either germination stimulants or inhibitors to manage the emergence timing of weeds (Donald and Tanaka, Reference Donald and Tanaka1993; Goggin and Powles, Reference Goggin and Powles2014). This study highlights one of the key challenges of this approach, in that the testa may be a barrier to the uptake of such compounds and that inherent variability in testa properties between populations could prevent the uniform efficacy of such compounds when applied to a heterogeneous weed seedbank. In Amaranthus hybridus, environmental conditions during seed development can lead to marked differences in testa thickness and seed dormancy (Fernández Farnocchia et al., Reference Fernández Farnocchia, Benech-arnold, Mantese and Batlla2021). Further work on understanding the testa properties of important weed species will contribute to the development of more robust approaches to manage the emergence timing of weeds in the field.
Conclusion
This study provides valuable insights into the interaction between testa structure, permeability and germination responses in weedy Amaranthus species. Our findings reveal intra- and interspecific variations in testa thickness and solute permeability, highlighting the heterogeneity of seed biology in this important genus. We observed that testa thickness may influence permeability to certain solutes, but this relationship is not straightforward and varies depending on the solute and population studied. Due to the variable responses of the populations to gibberellin and norflurazon, it was not possible to directly correlate testa permeability with sensitivity to germination stimulants. Further studies could focus on the biochemical composition of the testa and how this influences the uptake of solutes into seeds.
Acknowledgements
We would like to acknowledge the support of Diane Grant, Sarah Rabjohn and Robyn Dennehy from Syngenta Ltd. for sourcing the seed populations and Joseph Cortvriend from Syngenta Ltd. for support with LC-MS. We acknowledge Eddie McIndoe from Syngenta Ltd. for support with the statistical analysis and Leanne Yeung from Royal Holloway University of London for critical review of the manuscript. We would also like to acknowledge the work of the Official Seed Testing Station for Scotland (OSTS) in conducting the tetrazolium staining.
Funding statement
This work was funded by Syngenta Ltd.
Competing interests
The author(s) declare none.

 Open access

