


Lipid metabolism influences all aspects of dairy production and health. Lipids are broadly classified into eight categories; glycerophospholipids (PL), fatty acyls (FA), glycerolipids, sphingolipids, sterol lipids, phenol lipids, saccharolipids and polyketides (Sud et al., Reference Sud, Fahy, Cotter, Brown, Dennis, Glass, Merrill, Murphy, Raetz, Russell and Subramaniam2007). The PL typically contribute around 41–50% (w/w%) of serum or plasma lipids, with cholesteryl esters (44–50%), unesterified cholesterol (5–9%), free FA (1–2%) and triacylglycerols (trace-3%) also present (Yamdagni and Schultz, Reference Yamdagni and Schultz1970; Raphael et al., Reference Raphael, Dimick and Puppione1973; Bitman et al., Reference Bitman, Wood, Tyrrell, Bauman, Peel, Brown and Reynolds1984). Though much dairy research has been performed on free FA, especially non-esterified fatty acids, until recently there has been comparatively little emphasis on the PL class. Advances in and availability of bioinformatics and lipidomics are enabling researchers to precisely quantify low-abundance lipids, including the FA composition of specific PL classes (Zehethofer and Pinto, Reference Zehethofer and Pinto2008; Li et al., Reference Li, Yang, Bai and Liu2014; Han and Gross, Reference Han and Gross2021; Liu et al., Reference Liu, Wang, Hemsworth, Reich, Bath, Berkhout, Tahir, Ezernieks, Marett, Chamberlain, Goddard and Rochfort2025). Subsequently, specific PL and their FA compositions are increasingly recognised as being significantly associated with dairy cows’ health and longevity (Humer et al., Reference Humer, Khol-Parisini, Metzler-Zebeli, Gruber and Zebeli2016; Rico et al., Reference Rico, Saed Samii, Zang, Deme, Haughey, Grilli and McFadden2021; Sheedy et al., Reference Sheedy, Golder, Garcia, Liu, Reddy, Rochfort, Hemsworth, Vincent, Pryce and Lean2026). These roles include hepatic lipid export during the transition period, aging processes, reproduction and modulation of inflammatory responses. The purpose of this narrative review was to (1) introduce readers to basic glycerophospholipid biochemistry, (2) consolidate current knowledge on the major PL classes in adult dairy cows, (3) to identify emerging evidence on the role of PL in circulation and tissue in relation to cattle longevity through their associations with age, health and reproduction, and (4) highlight areas for further research. Unless otherwise stated, all references are to adult cattle.
This review should be considered in the context of dietary precursors for fatty acids, especially the essential fatty acids that are not only potent anti-inflammatory agents, antioxidants but precursors for critical hormones that have profound effects on metabolism. For details on other lipid categories and classes on dairy production, we direct readers to reviews on sphingolipids (McFadden and Rico, Reference McFadden and Rico2019), essential or omega fatty acids (Palmquist, Reference Palmquist2009; Rodney et al., Reference Rodney, Celi, Scott, Breinhild and Lean2015; Moallem, Reference Moallem2018; Veshkini et al., Reference Veshkini, Ceciliani, Bonnet and Hammon2023) and endocannabinoids (Myers et al., Reference Myers, Zachut, Tam and Contreras2021; Zachut et al., Reference Zachut, Butenko and Dos Santos Silva2025).
Introduction to glycerophospholipid biochemistry
The basic structure of a PL is the glycerol backbone that has three attachment sites denoted as sn-1, sn-2 and sn-3. Generally, the sn-1 position is esterified to saturated fatty acids, sn-2 to unsaturated fatty acids and sn-3 always attached to a phosphate moiety (Yamashita et al., Reference Yamashita, Hayashi, Nemoto-Sasaki, Ito, Oka, Tanikawa, Waku and Sugiura2014). Provided that both the sn-1 and sn-2 positions are attached to FA, ester linkages between the sn-3 phosphate and head groups of choline, ethanolamine, inositol or serine create the phosphatidylcholine (PC), phosphatidylethanolamine (PE), phosphatidylinositol (PI) and phosphatidylserine (PS) lipid classes, respectively (Fig. 1). For ease of discussion, this review will examine the influence of each of these PL on cattle health longevity in turn, while recognising this categorisation is a necessary simplification of the interconnected nature of PL metabolism and that the functional boundaries of PL are not discrete (Fig. 1).
Glycerophospholipid metabolism depicting the most common pathways for production of phosphatidic acid, phosphatidylinositol (PI), phosphatidylcholine (PC), phosphatidylserine (PS) and phosphatidylethanolamine (PE). Enzymes are in grey boxes; fatty acyl chains are simplified as wavy chains esterified to the glycerol backbone. Phosphate and the specific head groups are depicted by the circled colored letter described in the bottom of the figure. Intracellular locations and lysophospholipids are not shown. ATGL – adipose triglyceride lipase; CDP – cytidine diphosphate; CDS – phosphatidate cytidylyltransferase; CEPT – choline/ethanolamine phosphotransferase; ChoK – choline kinase; CTP – cytidylyltransferase; DAGK – diacylglycerol kinase; DGAT – Diacylglycerol acyltransferases; EthK – ethanolamine kinase; GPAT – glycerol-3-phosphate acyltransferase; LPAAT – lysophosphatidic acid acyltransferases; PAP – phosphatidate phosphatase; PEMT – phosphatidylethanolamine-N-methyltransferase; PIS – phosphatidylinositol synthase; PLD – phospholipase D; PMT – Phosphoethanolamine methyltransferases; PSD – phosphatidylserine decarboxylase; PSS – phosphatidylserine synthase. Figure adapted from KEGG glycerophospholipid metabolism and Cayman Chemical lysophospholipid signaling poster (map00564) (Kanehisa et al., Reference Kanehisa, Furumichi, Sato, Matsuura and Ishiguro-Watanabe2025; Cayman Chemical, 2020).

The two most abundant PL are PC and PE and have an overall neutral charge that are composed of a positive head group balanced by the negative phosphate at sn-3 (zwitterionic), whereas PI and PS are overall negatively charged with neutral head groups. The consequence of having hydrophilic head groups and long, hydrophobic FA tails allow PL to form the cellular phospholipid bilayers and lipoprotein micelles for which they are most well recognized. There can be profound differences in the relative abundance of PL classes between the two leaflets of a membrane bilayer, as well as among the cytoplasmic and intracellular organelle membranes. These differences contribute to the unique structural and functional properties of cells and their compartments (Holthuis et al., Reference Holthuis, van and Huitema2003; Harayama and Riezman, Reference Harayama and Riezman2018). The PS are a notable example, with essentially all cytoplasmic membrane PS on the cytosolic side and none exposed to extracellular space (Leventis and Grinstein, Reference Leventis and Grinstein2010; Fairn et al., Reference Fairn, Schieber, Ariotti, Murphy, Kuerschner, Webb, Grinstein and Parton2011).
The enzymatic breakdown of dietary PL and triglycerides in the rumen to free-FA is rapid, and most PL in the body must therefore be synthesised de novo from glycerol-3-phosphate (Dawson and Hemington, Reference Dawson and Hemington1974; Jenkins et al., Reference Jenkins, Wallace, Moate and Mosley2008; Moate et al., Reference Moate, Boston, Jenkins and Lean2008). Figure. 1 shows the most common pathways for PL production, but notably omits lysophospholipids, the subcellular compartmentalisation of enzymatic reactions and FA composition or remodelling pathways, all of which are important aspects of lipid metabolism.
Fatty acids that esterify to PL can be obtained from the diet, rumen microbe de novo synthesis or de novo synthesis by the cow. Although the fat content in pasture-fed cows may contain more than 80% as the essential omega-3 FA alpha-linolenic acid (C18:3;n-3 ALA), the extensive lipolysis and biohydrogenation of fats by rumen microbial activity result in duodenal flow of mostly (∼90%) saturated and mono-unsaturated FA (Scollan et al., Reference Scollan, Dhanoa, Choi, Maeng, Enser and Wood2001; Jenkins et al., Reference Jenkins, Wallace, Moate and Mosley2008; Glasser et al., Reference Glasser, Doreau, Maxin and Baumont2013). Despite this, the cow requires sufficient ALA and linoleic acid (C18:2; n-6) to reach the duodenum, as these FA can only be obtained from the diet and are important precursors for the bioactive very-long chain omega FA (see section: Glycerophospholipids and long chain polyunsaturated fatty acids).
The PLs are transported by the circulatory system in water-soluble lipoproteins that are composed of cholesterols, triacylglycerols, PL and specialised proteins called apolipoproteins. Lipoproteins are categorised in increasing density order as: chylomicrons, VLDL, intermediate density lipoproteins, low-density lipoproteins and high-density lipoproteins (Bauchart, Reference Bauchart1993). Generally, triacylglycerol content decreases and PL increases with increasing lipoprotein density (Raphael et al., Reference Raphael, Dimick and Puppione1973; Grummer and Davis, Reference Grummer and Davis1984). The VLDL are typically reported as very low abundance in ruminants, that is <5% of lipoproteins in plasma or serum (Raphael et al., Reference Raphael, Dimick and Puppione1973; Grummer and Davis, Reference Grummer and Davis1984). Duran et al. (Reference Duran, Kannampuzha-Francis, Nydam and Behling-Kelly2021) reported approximately 15–20% using a high-resolution polyacrylamide gel electrophoretic assay, and suggested an insensitivity of previous assays to the relatively high saturated FA content, due to extensive rumen biohydrogenation, in bovine VLDL compared to monogastric animals. Regardless, the VLDL are the primary method to transport triacylglycerols from the liver into circulation and compromised VLDL export may contribute to lipid accumulation in the liver during the transition period (See section ‘Phosphatidylcholine: hepatic lipidosis’).
Glycerophospholipids and long-chain polyunsaturated fatty acids
The PL are important donors and transporters of FA and are subsequently involved in FA metabolism (Engelmann and Wiedmann, Reference Engelmann and Wiedmann2010). Of specific relevance to dairy cow health and production are the very long-chain polyunsaturated fatty acids (LC-PUFA), including the omega fatty acids of docosahexaenoic acid (C22:6 n-3; DHA), eicosapentaenoic acid (C20:5 n-3; EPA) and arachidonic acid (C20:4 n-6; ARA) (Palmquist, Reference Palmquist2009; Moallem, Reference Moallem2018). The omega FA are active in signalling pathways, including the eicosanoid and inflammatory pathways (Goerig et al., Reference Goerig, Habenicht and Schettler1985; Funk, Reference Funk2001; Palmquist, Reference Palmquist2009) and are positively associated with cattle health (Silvestre et al., Reference Silvestre, Carvalho, Francisco, Santos, Staples, Jenkins and Thatcher2011; Moallem et al., Reference Moallem, Lehrer, Livshits and Zachut2020; Veshkini et al., Reference Veshkini, Ceciliani, Bonnet and Hammon2023), reproduction (Rodney et al., Reference Rodney, Celi, Scott, Breinhild and Lean2015; Sinedino et al., Reference Sinedino, Honda, Souza, Lock, Boland, Staples, Thatcher and Santos2017; Moallem, Reference Moallem2018; Moallem et al., Reference Moallem, Lehrer, Livshits and Zachut2020), inter-generational health (Gulliver et al., Reference Gulliver, Friend, King and Clayton2012; Roque-Jiménez et al., Reference Roque-Jiménez, Rosa-Velázquez, Pinos-Rodríguez, Vicente-Martínez, Mendoza-Cervantes, Flores-Primo, Lee-Rangel and Relling2021) and aging (Sheedy et al., Reference Sheedy, Golder, Garcia, Liu, Moate, Reddy, Rochfort, Pryce and Lean2025). To avoid replication of work from other authors, this review limits discussion to the specific implications of LC-PUFA when esterified to PL and not their metabolism after disassociation from PL, for which we refer readers to other reviews (Palmquist, Reference Palmquist2009; Rodney et al., Reference Rodney, Celi, Scott, Breinhild and Lean2015; Moallem, Reference Moallem2018; Veshkini et al., Reference Veshkini, Ceciliani, Bonnet and Hammon2023).
Aging
The risk of mortality and disease increase with increasing parity of dairy cows (Lean et al., Reference Lean, Golder, LeBlanc, Duffield and Santos2023a) and could be related to age-associated metabolic changes. There are few cattle studies that have investigated lipid changes specifically associated with increasing age or parity. In non-ruminant studies, the ‘oxidative-stress’ theory of aging suggests that reactive oxygen species damage biological molecules and promote cellular senescence (Pamplona et al., Reference Pamplona, Barja and Portero-Otín2002; Hulbert et al., Reference Hulbert, Pamplona, Buffenstein and Buttemer2007). Relatedly, the ‘cell membrane’ or ‘membrane pacemaker’ theory of aging mechanistically recognises an association between declining membrane integrity with the progression of age (Hulbert, Reference Hulbert2005; Calhoon et al., Reference Calhoon, Ro and Williams2015; Das, Reference Das2021). In support of these theories is the observation that long-lived species, such as humans and horses, have relatively low concentrations of membrane PUFA compared to short-lived species such as mice and guinea pigs (Alba Naudi et al., Reference Naudí, Jové, Ayala, Portero‐Otín, Barja and Pamplona2013; Hulbert et al., Reference Hulbert, Pamplona, Buffenstein and Buttemer2007; Mariona Jové et al., Reference Jové, Naudí, Aledo, Cabré, Ayala, Portero-Otin, Barja and Pamplona2013; Zaloga, Reference Zaloga2021; Zimniak, Reference Zimniak2011) and FA double bonds are at greater risk of peroxidation compared to saturated FA (Holman, Reference Holman1954; Bielski et al., Reference Bielski, Arudi and Sutherland1983; Niki, Reference Niki2009; Yin et al., Reference Yin, Xu and Porter2011).
Peroxidation of membrane lipids is associated with signalling for oxidative cell death (Dixon and Olzmann, Reference Dixon and Olzmann2024) and decreased membrane fluidity (Choe et al., Reference Choe, Jackson and Yu1995). Membrane fluidity is an important component of membrane integrity and is increased by increasing the PC:PE of membranes (Fajardo et al., Reference Fajardo, McMeekin and LeBlanc2011) and, contrary to the oxidative-stress theory of aging, decreasing the FA saturation of PL (Brenner, Reference Brenner1984; Stubbs and Smith, Reference Stubbs and Smith1984; Rawicz et al., Reference Rawicz, Olbrich, McIntosh, Needham and Evans2000). In non-ruminant studies, increasing age is generally associated with PL with increased saturated FA and hence more rigid cell membranes and increased potential for dysfunction (Hegner, Reference Hegner1980; Prisco et al., Reference Prisco, Rogasi, Paniccia, Abbate and Gensini1991; Hashimoto et al., Reference Hashimoto, Hossain and Masumura1999; Das UN, Reference Das2021). Observations that challenge the oxidative-stress theories of aging are inconsistent associations between LC-PUFA levels and longevity within a single species, FA saturation decreasing cell membrane fluidity, and inconsistent responses to antioxidative interventions that theoretically should reduce membrane peroxidation and dysfunction (Buffenstein et al., Reference Buffenstein, Edrey, Yang and Mele2008; Calhoon et al., Reference Calhoon, Ro and Williams2015; Iakovou and Kourti, Reference Iakovou and Kourti2022).
There are currently very few studies specifically investigating PL composition and aging in cattle. A multi-site, cross-sectional lipidomics study that purposively recruited 1st, 2nd, 3rd and >4th lactation animals reported that EPA and DHA associated PC, PE and PI had the largest relative change in concentration out of the 185 analysed lipids, and decreased with increasing age (n = 1492 cows) (Sheedy et al., Reference Sheedy, Golder, Garcia, Liu, Moate, Reddy, Rochfort, Pryce and Lean2025). Similarly, serum PUFA-PL were significantly lower in early lactation multiparous cows (n = 20 cows) compared to heifers (n = 10 cows) (Humer et al., Reference Humer, Khol-Parisini, Metzler-Zebeli, Gruber and Zebeli2016). At face value, these results of lower LC-PUFA in older cattle support the oxidative-stress theories of aging in dairy cattle; however, longitudinal studies will be required to address issues of survivorship bias across parity groups. Lower concentrations of PL containing EPA and DHA in older cows may also impact biological fitness by; increasing the endocannabinoid system activity and impairing reproductive efficiency (see section ‘Phosphatidylinositol: precursor to endocannabinoids’) or decreasing flux through the PE N-methyltransferase pathway during the transition period. This decreased flux may increase the risk of hepatic lipidosis (see section ‘Phosphatidylethanolamine: precursor to PC’), a condition also associated with increased age.
Glycerophospholipid omega acid supplementation
Supplementation with the essential omega-3 FA ALA (C18:3;n-3) or with marine products high in the omega-3 LC-PUFA of EPA and DHA consistently have positive effects on cattle health and reproduction (Rodney et al., Reference Rodney, Celi, Scott, Breinhild and Lean2015; Moallem, Reference Moallem2018; Veshkini et al., Reference Veshkini, Ceciliani, Bonnet and Hammon2023). Supplementation with FA that are esterified to PL have altered bioavailability and metabolic activity when compared to FA esterified to triacylglycerols in non-ruminants (Murru et al., Reference Murru, Banni and Carta2013; Schuchardt and Hahn, Reference Schuchardt and Hahn2013; Alijani et al., Reference Alijani, Hahn, Harris and Schuchardt2025) and dairy cows (Spain et al., Reference Spain, Polan and Watkins1995), and may be a superior dietary form for supplementation. Oil-based products high in omega-3 content, such as flaxseed (ALA ∼50% total FA) or fish oil (combined EPA and DHA ∼50% total FA) are the most common omega-3 supplements available for cattle diets (Moallem, Reference Moallem2018), and deliver FA that are predominately esterified in triacyclglycerols (Elgersma, Reference Elgersma2015; Makay et al., Reference Makay, Griehl, Schilling and Grewe2026). There are limited studies in cattle that directly compare whether different FA dietary forms could alter health and longevity.
Temperate pastures are naturally high in ALA esterified to structural PL and ALA is 50–89% of total FA (Glasser et al., Reference Glasser, Doreau, Maxin and Baumont2013; Elgersma, Reference Elgersma2015; NASEM, 2021), but there are no studies that isolate the effect of PL-ALA from pasture with the triacylglycerol-ALA provided in oil seeds. Leduc et al. (Reference Leduc, Létourneau-Montminy, Gervais and Chouinard2017) performed a meta-analysis exploring lactation performance with different dietary forms of flaxseed, including free oil (n = 22 studies), flax hulls (n = 8) and whole seed (subdivided into intact: n = 32, mechanical processed: n = 35 and extruded: n = 42). Mechanically processed flax had the greatest energy correct milk and feed efficiency, while protected flax (including seed and oil forms) and flax hulls had the greatest milk ALA concentrations. While the review reports clear differences in production outcomes with dietary forms of flaxseed, the extent that can be attributed to differences in PL and triacylglycerol content remains unknown, and the impact on cattle health was not assessed.
Algae biomass and fish meal, compared to algal or fish oils, provide FA with greater amounts esterified to PL (Mika et al., Reference Mika, Swiezewska and Stepnowski2016; Makay et al., Reference Makay, Griehl, Schilling and Grewe2026). In a series of experiments, Spain et al. (Reference Spain, Polan and Watkins1995) reported different EPA, DHA and ARA plasma profiles between rumen-unprotected fish meal and rumen-unprotected fish oil supplementation, suggesting bioavailability differs with the dietary form of FA. Heravi Moussavi et al. (Reference Heravi Moussavi, Gilbert, Overton, Bauman and Butler2007a, Reference Heravi Moussavi, Gilbert, Overton, Bauman and Butler2007b) explored milk production, liver, uterine and ovarian responses to total mixed ration diets supplemented with either fish oil or three levels of fish meal (n = 6 cows per treatment) and reported broadly equivalent and improved responses in follicular counts and size, endometrial FA profiles, dry matter intake, milk production, glucose and insulin responses between the fish meal and fish oil treatments compared to the control diet. Stamey et al. (Reference Stamey, Shepherd, de and Corl2012) reported that rumen-protected algal biomass supplementation, compared to rumen-protected algal oil (n = 4 cows, 4 × 4 Latin square), had greater DHA content in plasma and milk after 7 days of feeding, and AbuGhazaleh et al. (Reference AbuGhazaleh, Potu and Ibrahim2009) reported that variation in the FA profile of milk between algae biomass supplementation and fish oil (n = 6 cows per treatment). An alternate marine source with a high abundance of LC-PUFA esterified to PL is krill meal or oil (Burri and Johnsen, Reference Burri and Johnsen2015), which may have superior bioavailability according to studies in non-ruminants (Ulven and Holven, Reference Ulven and Holven2015; Lindqvist et al., Reference Lindqvist, Dominguez, Dragøy, Ding and Burri2023), but has yet to be explored in ruminants. It is important to note that nations have variably prohibited protein-meal derived from marine sources (European Union, 2001; Animal Health Australia, 2023).
Ultimately, it remains unknown if the dietary form of LC-PUFA supplementation in cows is clinically relevant to health and longevity; costs, local availability, rumen-bypass techniques, ability to incorporate into rations, effect on milk production and quality must be considered in determining optimal interventions.
Phosphatidylcholine
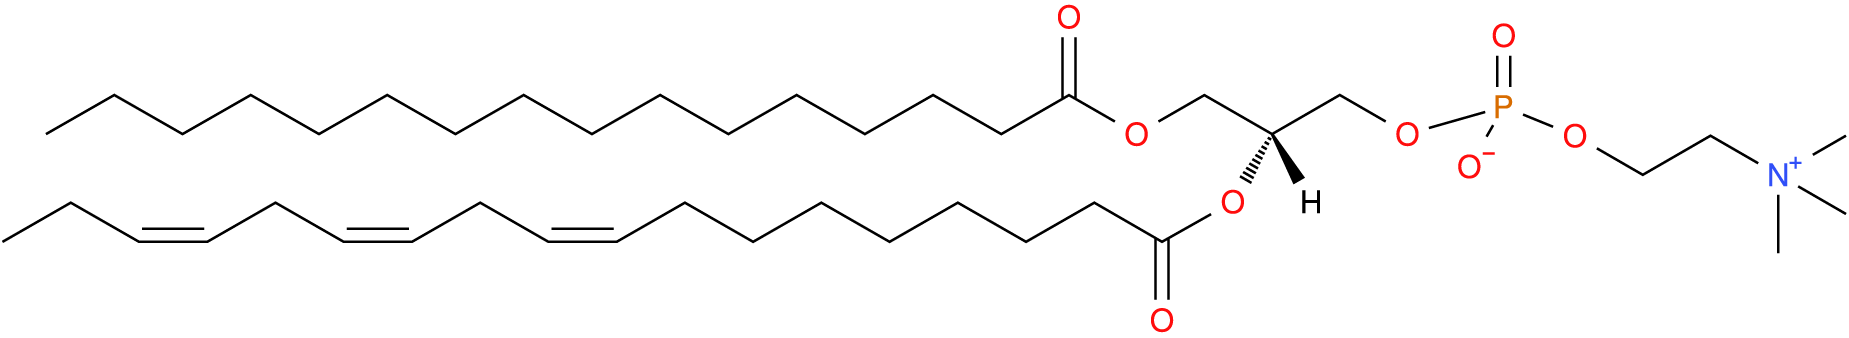
Choline is the head group in PC which is the most abundant PL in the body, and in mammals typically comprises 40–50% of cellular phospholipids (Vance, Reference Vance2015; van der Veen et al., Reference van der Veen, Kennelly, Wan, Vance, Vance and Jacobs2017) and 65–70% of plasma phospholipids (Phillips and Dodge, Reference Phillips and Dodge1967; Liu et al., Reference Liu, Wang, Hemsworth, Reich, Bath, Berkhout, Tahir, Ezernieks, Marett, Chamberlain, Goddard and Rochfort2025) (Fig. 2). The PC class is the primary PL that establishes the lipid bilayers of cell membranes and lipoproteins due its large, non-polar head group and its generally cylindrical shape (Harayama and Riezman, Reference Harayama and Riezman2018). Subsequently, most dairy research on PC relates to its structural role.
Phosphatidylcholine with palmitic at sn-1, alpha linolenic (n-3) at sn-2 and phosphocholine at sn-3. Common name: PC(16:0/18:3(6Z,9Z,12Z)). Image sourced from lipid maps: LMGP01010601.

Hepatic lipidosis
Hepatic lipidosis, also known as fatty liver, is a major metabolic disease of cattle during their transition period, and is associated with decreased milk production, cattle health and reproductive performance (Reid, Reference Reid1983; Gerloff et al., Reference Gerloff, Herdt and Emery1986; Bobe et al., Reference Bobe, Young and Beitz2004). During the transition period from late pregnancy to early lactation, there is a homeorhetic drive to mobilise energy stored in adipose tissue to meet the increased energy demands of lactation (Bauman and Currie, Reference Bauman and Currie1980; Bobe et al., Reference Bobe, Young and Beitz2004). Fatty acids stored in adipose tissue circulate in blood to the liver as non-esterified fatty acids (NEFA), where they may undergo oxidation, partial oxidation and export as ketones, or lipogenesis to be re-esterified with triacylglycerols and exported from the liver in VLDL. If VLDL production and export from the liver is restricted, NEFA and triacylglycerol levels in hepatocytes increase, and hepatic lipidosis and dysfunction may develop (Reid, Reference Reid1973; Bobe et al., Reference Bobe, Young and Beitz2004).
The PL content of plasma VLDL is comprised mostly of PC (70%), with minor contributions from sphingomyelin (11%), PI (10%), PE (4%) and other lipid species in murine studies (Hamilton and Fielding, Reference Hamilton and Fielding1989; Ågren et al., Reference Ågren, Kurvinen and Kuksis2005). Given the high PC content of VLDL, the rate of PC production in the liver is directly related to VLDL production and transport of triacylglycerol from the liver into circulation (Vance, Reference Vance2008; Cole et al., Reference Cole, Vance and Vance2012). However, the rate of VLDL production in ruminant species is less than in other mammals and may predispose ruminants to accumulate lipids in the liver and to develop fatty liver (Kleppe et al., Reference Kleppe, Aiello, Grummer and Armentano1988; Pullen et al., Reference Pullen, Liesman and Emery1990).
In the liver, PC is produced via two main pathways, the cytidine diphosphate (CDP)-choline pathway (Kennedy pathway) and the PE N-methyltransferase (PEMT) pathway that converts PE to PC (Fig. 1) (Vance, Reference Vance2008). The PEMT pathway only significantly contributes to PC production in hepatocytes with 20–30% under normal conditions in murine models (Sundler and Akesson, Reference Sundler and Akesson1975; DeLong et al., Reference DeLong, Shen, Thomas and Cui1999) and is discussed in more detail in the ‘Phosphatidylethanolamine: precursor to PC’ section.
An adequate supply of choline is required to support PC synthesis in the liver. Dietary supplementation with rumen-protected choline (RPC) is theorised to support the production of PC primarily through activating the CDP-choline pathway (Zhou et al., Reference Zhou, Zhou, Batistel, Martinez-Cortés, Pate, Luchini and Loor2018; Myers et al., Reference Myers, Zenobi, Reyes, Santos, Staples and McFadden2025), in-turn supporting VLDL production and export (Arshad et al., Reference Arshad, Zenobi, Staples and Santos2020; McFadden et al., Reference McFadden, Girard, Tao, Zhou, Bernard, Duplessis and White2020). However, the clinical effect of RPC supplementation is complicated by choline's involvement in other important metabolic pathways, including acetylcholine synthesis (Wurtman et al., Reference Wurtman, Cansev, Ulus, Lajtha, Tettamanti and Goracci2009) and transmethylation pathways that use the universal methyl-donor S-adenosylmethionine (Finkelstein, Reference Finkelstein1990; Mato et al., Reference Mato, Alvarez, Ortiz and Pajares1997) (Fig. 3). Specifically, choline can be oxidised to betaine by choline dehydrogenase and then donates a methyl group to homocysteine via betaine aldehyde dehydrogenase to produce methionine and subsequently S-adenosylmethionine (Finkelstein, Reference Finkelstein1990; Mato et al., Reference Mato, Alvarez, Ortiz and Pajares1997) (Fig. 3).
The two main pathways for phosphatidylcholine (PC) production in the liver. The cytidine diphosphate (CDP)-choline pathway predominates, accounting for around 70% of PC production under normal conditions. The CDP-choline pathways progresses from choline (encircled green C), to phosphocholine, CDP-choline and PC. The alternative pathway to produce PC is the phosphatidylethanolamine-N-methyltransferase (PEMT) pathway, which consumes three S-adenosylmethionine (SAM) to convert phosphatidylethanolamine (PE) to PC. Choline may also contribute to the PEMT pathway via the transmethylation cycle. DMG – dimethylglycine; E (encircled purple) – ethanolamine; HCY – homocysteine; mTHF – methyltetrahydrofolate; P (encircled red) – Phosphate; SAH – S-adenosylhomocysteine; THF – tetrahydrofolate.

A meta-analysis of 21 experiments feeding RPC to transition cows (median 12.9 g choline/day [range 5.6–25.2 g/day], 21 experiments, 66 treatment groups, 1313 cows) was conducted (Arshad et al., Reference Arshad, Zenobi, Staples and Santos2020). The report found significantly improved feed intake (0.5 ± 0.7[SEM]kg/day at median [12.9 g/day] of RPC supplementation), energy corrected milk (1.7 ± 1.6 kg/day), milk fat (0.07 ± 0.07 kg/day) and milk protein (0.05 ± 0.05 kg/day), with numerically reduced risk of retained placenta (odds ratio:0.69, 95% CI: 0.46, 1.02) and mastitis (odds ratio: 0.76, 95% CI: 0.55, 1.06) (Arshad et al., Reference Arshad, Zenobi, Staples and Santos2020). However, there was no effect of metritis, milk fever, displaced abomasum and ketosis (Arshad et al., Reference Arshad, Zenobi, Staples and Santos2020). Perhaps of most relevance to hepatic lipidosis, feeding RPC to transition cows decreased liver triacylglycerol concentrations in some (Cooke et al., Reference Cooke, Río, Caraviello, Bertics, Ramos and Grummer2007; Elek et al., Reference Elek, Newbold, Gaal, Wagner and Husveth2008; Zom et al., Reference Zom, van, Goselink, Bakker, Mj de and Vuuren2011; Goselink et al., Reference Goselink, van, Widjaja, Dekker, Zom, Veth and Vuuren2013; Lima et al., Reference Lima, Sá Filho, Greco and Santos2024; Myers et al., Reference Myers, Zenobi, Reyes, Santos, Staples and McFadden2025), but not all studies (Piepenbrink and Overton, Reference Piepenbrink and Overton2003; Zahra et al., Reference Zahra, Duffield, Leslie, Overton, Putnam and LeBlanc2006; Zhou et al., Reference Zhou, Vailati-Riboni, Trevisi, Drackley, Luchini and Loor2016; Zenobi et al., Reference Zenobi, Scheffler, Zuniga, Poindexter, Campagna, Castro Gonzalez, Farmer, Barton, Santos and Staples2018) and was ultimately not significant in two different meta-analytical reviews (Humer et al., Reference Humer, Bruggeman and Zebeli2019; Arshad et al., Reference Arshad, Zenobi, Staples and Santos2020). The authors suggested that the natural variation in the concentration of triacylglycerol in the liver during the postpartum period was too great and may have obscured the effects of supplementation in under-powered studies (Humer et al., Reference Humer, Bruggeman and Zebeli2019) and that choline supplementation rates in many studies have often been too low to result in a detectable effect (Arshad et al., Reference Arshad, Zenobi, Staples and Santos2020). Transcription factors associated with VLDL production and export, including hepatocyte mRNA abundances of critical apolipoprotein and microsomal triglyceride transfer proteins, increase with supplementation of RPC (Goselink et al., Reference Goselink, van, Widjaja, Dekker, Zom, Veth and Vuuren2013, Reference Zhou, Garrow, Dong, Luchini and Loor2017; Zhou et al., Reference Zhou, Zhou, Batistel, Martinez-Cortés, Pate, Luchini and Loor2018; Arshad et al., Reference Arshad, Husnain, Poindexter, Zimpel, Nelson and Santos2023). The 8th edition of the Nutrient Requirements of Dairy Cattle noted the production and potential health benefits of RPC supplementations, but did not establish a dietary requirement for choline as ‘it is synthesised by cows and because of potential variability in commercial products’ (National Academies of Sciences, Engineering & Medicine, 2021).
Phosphatidylethanolamine
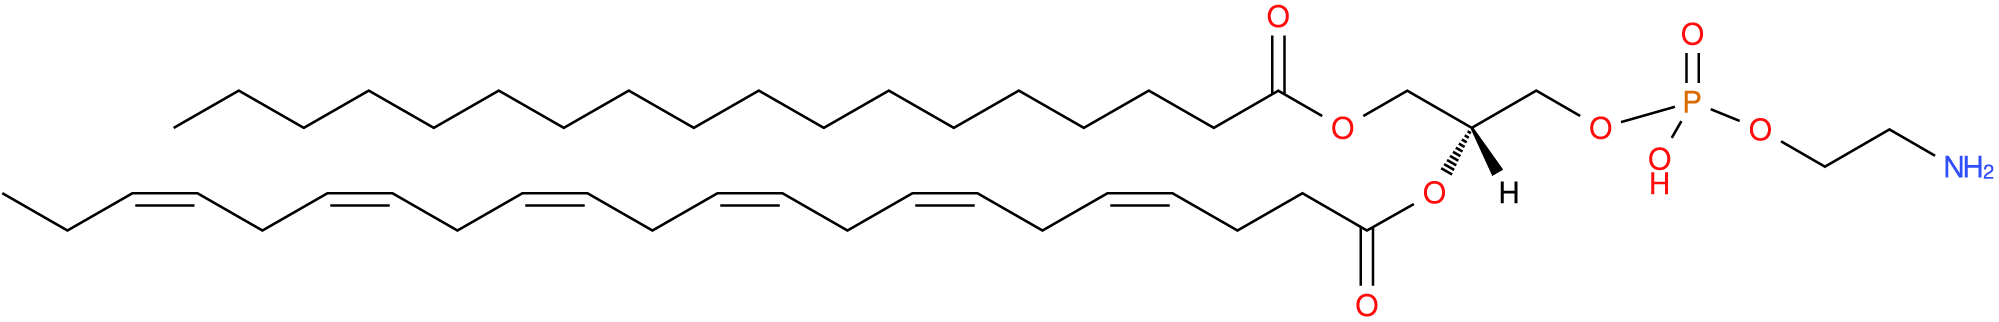
Ethanolamine is the small head group of the PE, does not spontaneously form bilayers, and comprises 15–25% of cellular phospholipids (Vance, Reference Vance2015; van der Veen et al., Reference van der Veen, Kennelly, Wan, Vance, Vance and Jacobs2017) and around 1.1–3.6% of plasma phospholipids (Phillips and Dodge, Reference Phillips and Dodge1967; Liu et al., Reference Liu, Wang, Hemsworth, Reich, Bath, Berkhout, Tahir, Ezernieks, Marett, Chamberlain, Goddard and Rochfort2025) (Fig. 4). The PE are associated with protein biogenesis, oxidative phosphorylation, autophagy, membrane fusion, mitochondrial stability and are an important precursor for other lipids and signalling pathways (Calzada et al., Reference Calzada, Onguka and Claypool2016).
Phosphatidylethanolamine with stearic acid at sn-1, docosahexaenoic acid at sn-2 and phosphoethanolamine at sn-3. Common name: PE[18:0/22:6(4Z,7Z,10Z,13Z,16Z,19Z)]. Image sourced from lipid maps: LMGP02010094.

The PE are primarily produced by two independent pathways, the CDP-ethanolamine pathway and the mitochondrial PS decarboxylase pathways (Fig. 1) (Vance and Tasseva, Reference Vance and Tasseva2013). The PS decarboxylase pathway preferentially synthesises PE with PUFA in the sn-2 position, while the CDP-ethanolamine pathway is enriched with mono or di-unsaturated FA in the sn-2 position (Bleijerveld et al., Reference Bleijerveld, Brouwers, Vaandrager, Helms and Houweling2007). The PE also produce the endocannabinoid N-arachidonoylethanolamine (anandamide, AEA) and the structurally similar N-acylethanolamines (Liu et al., Reference Liu, Wang, Harvey-White, Huang, Kim, Luquet, Palmiter, Krystal, Rai, Mahadevan, Razdan and Kunos2008), which are discussed in ‘Phosphatidylinositol – precursor to endocannabinoids’.
Precursors to PC
The PEMT pathway transforms PE to PC via three successive methylation reactions that each consume one universal donor, S-adenosylmethionine (Fig. 1). The PEMT pathway preferentially enriches PC with LC-PUFA (Pynn et al., Reference Pynn, Henderson, Clark, Koster, Bernhard and Postle2011; Myers et al., Reference Myers, Rico, Davis, Fontoura, Dineen, Tate and McFadden2019) and subsequently produces more diverse PC species than the CDP-choline pathway (DeLong et al., Reference DeLong, Shen, Thomas and Cui1999). The PEMT pathway is most important for producing PC within hepatocytes, which represent around 20–30% of PC under normal circumstances in murine models (Sundler and Akesson, Reference Sundler and Akesson1975; DeLong et al., Reference DeLong, Shen, Thomas and Cui1999). Selective activation of the PEMT pathway in hepatocytes may increase PC and hence VLDL production, reducing hepatic lipid accumulation in the transition period.
Research on the use of specific methyl-donor supplementation strategies that target PEMT activation and its impact on modulating fatty liver accumulation in dairy cattle is still emerging. There is a growing consensus that specific substrates will preferentially select between PC production pathways. Choline preferentially utilises the CDP-choline pathway and methionine the PEMT pathway (Vance and Vance, Reference Vance and Vance1986; Osorio et al., Reference Osorio, Ji, Drackley, Luchini and Loor2014; Chandler and White, Reference Zhou, Garrow, Dong, Luchini and Loor2017; Zhou et al., Reference Zhou, Zhou, Batistel, Martinez-Cortés, Pate, Luchini and Loor2018). An in vitro study reported increased PEMT activity in Holstein primary liver cells following methionine but not choline supplementation, and increased CDP-choline pathway activity with choline but not methionine supplementation (Zhou et al., Reference Zhou, Zhou, Batistel, Martinez-Cortés, Pate, Luchini and Loor2018). Another in vitro study using neonatal Holstein primary liver cells supplemented with choline reported a simultaneous decrease in PEMT activity and increased VLDL secretion suggesting CDP-choline activation; however, methionine supplementation also decreased PEMT activity but did not affect VLDL secretion (Chandler and White, Reference Chandler and White2017). The in vivo PEMT gene expression in hepatocytes of transition cows was increased when the cows were given diets supplemented with methionine (Osorio et al., Reference Osorio, Ji, Drackley, Luchini and Loor2014; Zhou et al., Reference Zhou, Garrow, Dong, Luchini and Loor2017), but had no change when diets were supplemented with choline (Zhou et al., Reference Zhou, Garrow, Dong, Luchini and Loor2017). Contrastingly, Potts et al. (Reference Potts, Brady, Scholte, Moyes, Sunny and Erdman2023) did not report any differences in PEMT regulation in hepatocytes between transition cows given a control diet or diets supplemented with either choline or methionine. However, several milk LC-PUFA PC species were increased by more and earlier with methionine supplementation compared to choline supplementation in multiparous cows. More diverse LC-PUFA indicates PE to PC conversion (DeLong et al., Reference DeLong, Shen, Thomas and Cui1999), hence the PEMT pathway was facilitated by methionine supplementation. Potts et al. (Reference Potts, Brady, Scholte, Moyes, Sunny and Erdman2023) found no changes in the LC-PUFA PC species in primiparous cows; the authors suggested that primiparous cows had sufficient choline before dietary supplementation to meet PC production without a need to enhance flux through the PEMT pathway.
Overall, the activation of specific PC pathways by different substrates opens the possibility of co-supplementation to target both the CDP-choline and PEMT pathways to optimise PC production and hence VLDL production and reduce lipid accumulation in the liver. The few studies that report co-supplementation offer mixed results. Zhou et al. (Reference Zhou, Vailati-Riboni, Trevisi, Drackley, Luchini and Loor2016) saw no additional benefits to milk measures with the addition of choline over methionine supplementation alone (n = 20 cows per treatment). Çetin et al. (Reference Çetin, Türkmen, Kara, Udum, Orman and Gençoğlu2022) reported no difference in health, reproduction or a blood metabolite panel including NEFA, BHB, insulin and VLDL, with co-supplementation compared to supplementation with either methionine or choline alone in transition cows (n = 8 cow per treatment). Similarly, Potts et al. (Reference Potts, Brady, Scholte, Moyes, Sunny and Erdman2023) reported no consistent difference in blood metabolites including a PL panel and amino acid panel or milk constituents when choline and methionine were provided together in the prepartum. However, only methionine was supplemented postpartum in this study (n = 5 per treatment). Zang et al. (Reference Zang, Samii, Myers, Bailey, Davis, Grilli and McFadden2019) supplemented transition cows with a range of rumen-protected methyl-donors including methionine, choline, betaine, riboflavin and vitamin B12, in addition to the control diet that already had methionine with 199% and 115% of requirements in the pre- and postpartum diets, respectively. Their study found no difference in DMI and milk yield but decreased accumulation of liver lipids during day 5 to day 14 postpartum. Further studies are necessary to explore co-supplementation strategies that activate both PC production pathways, and possible health or production benefits.
Supplementation with specific FA can also preferentially select between PEMT or CDP-choline pathways for PC production (Pynn et al., Reference Pynn, Henderson, Clark, Koster, Bernhard and Postle2011). Myers et al. (Reference Myers, Rico, Davis, Fontoura, Dineen, Tate and McFadden2019) abomasally infused C22:6 (DHA), C16:0 or C22:0 into late-pregnant, cannulated cows (n = 5 per treatment) and observed that the total amount of PC produced was not different between treatment groups, but DHA-infused cows had increased concentration of PC species with diverse LC-PUFA, not only DHA and lower concentration of PC with fewer than three double bonds. This result indicated that DHA either did not activate the CDP-choline pathway or that DHA was preferentially incorporated into PE before conversion to PC via the PEMT pathway. Similarly, PEMT activity is associated with circulating PC-DHA in pregnant murine (Chalil et al., Reference Chalil, Kitson, Aristizabal Henao, Marks, Elzinga, Lamontagne-Kam, Chalil, Badoud, Mutch and Stark2018) and human models (da Costa et al., Reference da Costa, Sanders, Fischer and Zeisel2011). Mechanistically, insufficient LC-PUFA reaching the liver may reduce capacity to activate the PEMT pathway. This is also supported by the observation that PC and PE with LC-PUFA is decreased in periparturient cows with increased liver lipid content (Rico et al., Reference Rico, Saed Samii, Zang, Deme, Haughey, Grilli and McFadden2021) and DHA supplementation significantly reduces liver fat in human non-alcoholic fatty liver (Lee et al., Reference Lee, Fu, Yang and Chi2020). Lower plasma concentrations of PL with LC-PUFA are found in multiparous cows compared to nulliparous cows (Sheedy et al., Reference Sheedy, Golder, Garcia, Liu, Moate, Reddy, Rochfort, Pryce and Lean2025), which may indicate that high parity cows have limited capacity to utilise the PEMT pathway, and could hypothetically increase their risk of fatty liver and associated disease complexes (Lean et al., Reference Lean, LeBlanc, Sheedy, Duffield, Santos and Golder2023b). The effect of FA nutrition, choline or methionine supplementation and PC production via the PEMT pathway are worthy of further investigation in periparturient cows (McFadden et al., Reference McFadden, Girard, Tao, Zhou, Bernard, Duplessis and White2020).
As systemic inflammation has been associated with increased hepatic triacylglycerol accumulation in dairy cattle (Bradford et al., Reference Bradford, Mamedova, Minton, Drouillard and Johnson2009; Eckel and Ametaj, Reference Eckel and Ametaj2016), Javaid et al. (Reference Javaid, Wang, Horst, Diaz-Rubio, Wang, Baumgard and McFadden2022) conducted a preliminary investigation to investigate the effect of endotoxin in transition cows. To mimic a transition cows’ metabolic status, they used late-lactation cows and induced hyperlipemia using an intravenous triglyceride infusion and feed restriction (n = 5 per treatment). The hepatocyte PC:PE ratio was decreased in the endotoxin-stimulated cows, suggesting PEMT may have been inhibited. The authors proposed that PE increased as less was converted to PC via PEMT, and note that the PC:PE ratio was reported as decreased in PEMT knockout mice (van der Veen et al., Reference van der Veen, Kennelly, Wan, Vance, Vance and Jacobs2017). A decreased hepatocyte PC:PE ratio increases membrane permeability and rigidity (Fajardo et al., Reference Fajardo, McMeekin and LeBlanc2011), and hence hepatocyte dysfunction, and is observed in non-alcoholic fatty liver disease of humans (Li et al., Reference Li, Agellon, Allen, Umeda, Jewell, Mason and Vance2006; Arendt et al., Reference Arendt, Ma, Simons, Noureldin, Therapondos, Guindi, Sherman and Allard2013; van der Veen et al., Reference van der Veen, Kennelly, Wan, Vance, Vance and Jacobs2017). The role and clinical significance of endotoxin to inhibit specific PC production pathways remain unclear.
Phosphatidylinositol
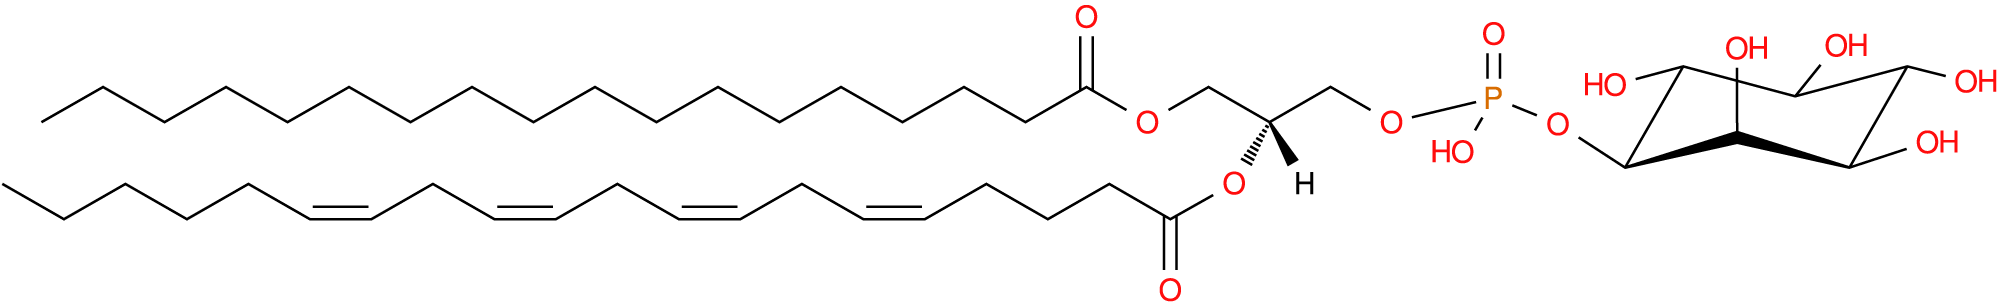
PI contains the six-carbon ring inositol head group and constitutes around 10–15% of cellular phospholipids (Fig. 5) (Vance, Reference Vance2015) and around 2% of plasma phospholipids (Liu et al., Reference Liu, Wang, Hemsworth, Reich, Bath, Berkhout, Tahir, Ezernieks, Marett, Chamberlain, Goddard and Rochfort2025). The most common of the six naturally occurring stereoisomers of inositol is myo-D-inositol, with one axial hydroxyl group at carbon position two and the remaining hydroxyl groups equatorial, with a turtle-shaped mnemonic often used to aid visualisation (Fig. 6) (Agranoff, Reference Agranoff2009; Irvine, Reference Irvine2016). In contrast with other PL, the FA composition of membrane PI is highly conserved, with upwards of 70% of PI esterified to stearic acid (C18:0) in the sn-1 position and arachidonic acid (C20:4; n-6 ARA) in sn-2 (Barneda et al., Reference Barneda, Cosulich, Stephens and Hawkins2019). Though PI bovine plasma concentrations appear notably more diverse, with approximately 23% PI (18:0_20:4) and 22% PI (18:0_20:3) (Liu et al., Reference Liu, Wang, Hemsworth, Reich, Bath, Berkhout, Tahir, Ezernieks, Marett, Chamberlain, Goddard and Rochfort2025; Sheedy et al., Reference Sheedy, Golder, Garcia, Liu, Reddy, Rochfort, Hemsworth, Vincent, Pryce and Lean2026). Owing to the high conservation of ARA, PI are disproportionately significant contributors to eicosanoids and leukotriene pathways compared to their relative abundance (Goerig et al., Reference Goerig, Habenicht and Schettler1985; Hokin, Reference Hokin1990; Kim et al., Reference Kim, Sengupta, Sohn, Mandal, Pemberton, Choi and Balla2022).
Phosphatidylinositol with stearic acid at sn-1, arachidonic acid (n-6) at sn-2 and phospho-(1’-myo-inositol) at sn-3. Common name: PI(18:0/20:4(5Z,8Z,11Z,14Z)). Image sourced from lipid maps: LMGP06010010.

‘Argranoff's turtle’ is a useful visual mnemonic for inositol. Using the D numbering convention, carbons are numbered anticlockwise beginning with turtle's right-flipper. The turtle is ‘right-handed’ and so is esterified to the phosphate group of phosphatic acid. The turtle's head is raised (hydroxyl group is axial) and the remaining limbs and tail are flat (hydroxyl groups equatorial).

Precursor for phosphoinositides
The PI are the precursors for all PI phosphates (phosphoinositides, PIP). The PIP have up to three phosphate moieties attached to the inositol ring at carbon 3, 4 or 5, totalling seven unique configurations. Each PIP is tightly regulated by substrate and intracellular location specific kinases and phosphatases (Balla, Reference Balla2013; Dickson and Hille, Reference Dickson and Hille2019). The PIP are extensively bioactive with roles in membrane signalling, regulating vesicular trafficking, ion channels, pumps, and transporters, modulating lipid distribution and controlling both endocytic and exocytic processes (Di Paolo and De Camilli, Reference Di Paolo and De Camilli2006; Balla, Reference Balla2013; Irvine, Reference Irvine2016; Dickson and Hille, Reference Dickson and Hille2019). There is growing recognition within medicine of the role PIP have in disease regulation, reflecting their broad activity, however there are still relatively few studies specific to dairy cattle.
Phosphoinositide-3-kinase (PI3K) phosphorylates phosphatidylinositol-4,5-bisphosphate to phosphatidylinositol-3,4,5-trisphosphate. The PI3K/protein kinase B (AKT) axis controls cell survival, cycle progression, growth and inflammatory responses and is perhaps best recognised as frequently altered in human cancers (Vara et al., Reference Vara, Casado, de Castro, Cejas, Belda-Iniesta and González-Barón2004; Troutman et al., Reference Troutman, Bazan and Pasare2012; He et al., Reference He, Sun, Zhang, Yang, Chen, Xu and Li2021). The role of the PI3K/AKT axis in dairy cow inflammatory pathways has recently been investigated in endometritis (Jiang et al., Reference Jiang, Cai, Jiang, Loor, Deng, Li and Yang2024), systemic inflammation and hepatitis (Häussler et al., Reference Häussler, Ghaffari, Seibt, Sadri, Alaedin, Huber, Frahm, Dänicke and Sauerwein2023), and mastitis (Cai et al., Reference Cai, Fan, Li, Sun, Dai, Lei, Dai and Liao2021).
Bovine endometrial cells exposed to endotoxin in-vitro downregulated both the PI3K and AKT pathways, leading to apoptosis (Jiang et al., Reference Jiang, Cai, Jiang, Loor, Deng, Li and Yang2024). The addition of interferon-tau upregulated PI3K/AKT and alleviated the endotoxin-induced apoptosis in a dose-dependent response, indicating a potential treatment modality for endometritis in cattle (Jiang et al., Reference Jiang, Cai, Jiang, Loor, Deng, Li and Yang2024). Häussler et al. (Reference Häussler, Ghaffari, Seibt, Sadri, Alaedin, Huber, Frahm, Dänicke and Sauerwein2023) reported increased hepatic mRNA abundance of AKT genes but not PI3K genes following endotoxin induced systemic inflammation. Cows that were supplemented with a rumen-protected L-carnitine reduced PI3K mRNA following endotoxin exposure, potentially modulating the severity of the pro-inflammatory response. Cai et al. (Reference Cai, Fan, Li, Sun, Dai, Lei, Dai and Liao2021) reported that in vitro, bovine mammary epithelial cells with simulated Staphylococcus aureus infection (with lipoteichoic acid treatment) activated the PI3K/AKT signalling pathway and that the pathway could be blocked by inhibiting Toll-Like Receptor 2.
These early studies demonstrated modulation of the inflammatory and apoptotic response to infection and inflammation through the PI3K/AKT axis. This indicates the potential for new treatment paradigms for diseases relevant to dairy cattle, though practical applications may take considerable time to develop.
Precursor to endocannabinoids
The endocannabinoid system (ECS) is an important neuromodulator and regulator of energy metabolism, immune function and reproduction in mammals (Silvestri and Di Marzo, Reference Silvestri and Di Marzo2013; Lu and Mackie, Reference Lu and Mackie2016), and consequently is relevant to dairy cow production. For a more comprehensive exploration of the emerging and complex role of ECS in dairy cattle, we refer readers to two recent review articles (Myers et al., Reference Myers, Zachut, Tam and Contreras2021; Zachut et al., Reference Zachut, Butenko and Dos Santos Silva2025).
The two most well-studied endocannabinoids are N-arachidonoylethanolamine (anandamide, AEA; derived from PE associated with ARA) (Liu et al., Reference Liu, Wang, Harvey-White, Huang, Kim, Luquet, Palmiter, Krystal, Rai, Mahadevan, Razdan and Kunos2008) and 2-arachidonoylglycerol (2-AG, derived from PI associated with ARA) (Murataeva et al., Reference Murataeva, Straiker and Mackie2014). In addition to being endogenous ligands for cannabinoid receptors, AEA and 2-AG can also contribute to the eicosanoid pathway by transformation to ARA (Ahn et al., Reference Ahn, McKinney and Cravatt2008). Endocannabinoid synthesis is rapid and on demand, in contrast to classical neurotransmitters that are pre-formed and stored in synaptic vesicles (Silvestri and Di Marzo, Reference Silvestri and Di Marzo2013; Lu and Mackie, Reference Lu and Mackie2016).
Activation of the ECS in murine and human studies is typically associated with increased adipogenesis, lipogenesis, suppression of lipolysis and increased appetite (Myers et al., Reference Myers, Zachut, Tam and Contreras2021) and is accordingly relevant to transition cow research. However, results from early research into the ECS activation of transition cows has generally been contrary to expectations, with a positive association with lipolysis (Zachut et al., Reference Zachut, Butenko and Dos Santos Silva2025). Zachut et al. (Reference Zachut, Kra, Moallem, Livshitz, Levin, Udi, Nemirovski and Tam2018) observed increased AEA and 2-AG, and upregulation of pro-inflammatory pathways in the adipose tissue of cows 4-days postpartum that had high body weight loss compared to cows with low body weight loss. Similarly, an in vitro study from Myers et al. (Reference Myers, Abou-Rjeileh, Chirivi, Parales-Girón, Lock, Tam, Zachut and Contreras2023) recognised differential regulation of the ECS according to stage of production, with adipose tissue from periparturient cows not responding to ECS stimulus whereas tissue from non-lactating, non-gestating cows had reduced lipolysis and increased adipogenesis with ECS stimulus, as expected from non-ruminant studies. In a review, Zachut et al. (Reference Zachut, Butenko and Dos Santos Silva2025) proposed that studies of ECS must consider the gender and reproductive state of their subjects. The paucity of comparative non-ruminant research with female subjects of different reproductive and lactating states may explain why transition-cow studies on the ECS system have results contrary to expectation (Zachut et al., Reference Zachut, Butenko and Dos Santos Silva2025).
The FA composition of diets can modulate ECS activation (Kim et al., Reference Kim, Li and Watkins2013; Kra et al., Reference Kra, Daddam, Moallem, Kamer, Kočvarová, Nemirovski, Contreras, Tam and Zachut2022). By decreasing the amount of omega-6 FA in the diet, less ARA is available for esterification to PE and PI and as a result less precursors are available for AEA and 2-AG endocannabinoid production, respectively (Kim et al., Reference Kim, Li and Watkins2013). This relation has been supported in a study in dairy cows (Kra et al. (Reference Kra, Daddam, Moallem, Kamer, Kočvarová, Nemirovski, Contreras, Tam and Zachut2022), in which the cows were fed a diet supplemented with flaxseed, as a source of omega-3 ALA and reported 49.7% less plasma AEA compared to the control cows. To what degree the production benefits associated with increased dietary omega-3 FA (see section ‘Glycerophospholipid long-chain poly unsaturated fatty acids’) are directly attributed to the ECS remains to be elucidated (Kra et al., Reference Kra, Daddam, Moallem, Kamer, Kočvarová, Nemirovski, Contreras, Tam and Zachut2022, Reference Kra, Daddam, Moallem, Kamer, Mualem, Levin, Kočvarová, Nemirovski, Contreras, Tam and Zachut2023; Zachut et al., Reference Zachut, Butenko and Dos Santos Silva2025). A plausible link between increased dietary omega-3 FA supplementation, reduced ECS activation and improved reproduction has been made (Zachut, Reference Zachut2020). Increasing omega-3 FA intake is associated with increased reproductive function (Rodney et al., Reference Rodney, Celi, Scott, Breinhild and Lean2015; Sinedino et al., Reference Sinedino, Honda, Souza, Lock, Boland, Staples, Thatcher and Santos2017; Moallem, Reference Moallem2018; Moallem et al., Reference Moallem, Lehrer, Livshits and Zachut2020), and though levels of endocannabinoids fluctuate throughout a pregnancy, reducing the ECS activity is generally associated with improved reproductive function in ruminants (Weems et al., Reference Weems, Lewis, Neuendorff, Randel and Weems2009; Tsutahara et al., Reference Tsutahara, Weems, Arreguin-Arevalo, Nett, LaPorte, Uchida, Pang, McBride, Randel and Weems2011; Abolghasemi et al., Reference Abolghasemi, Dirandeh, Ansari Pirsaraei and Shohreh2016; Dirandeh et al., Reference Dirandeh, Ansari-Pirsaraei, Deldar, Shohreh and Ghaffari2020).
Phosphatidylserine
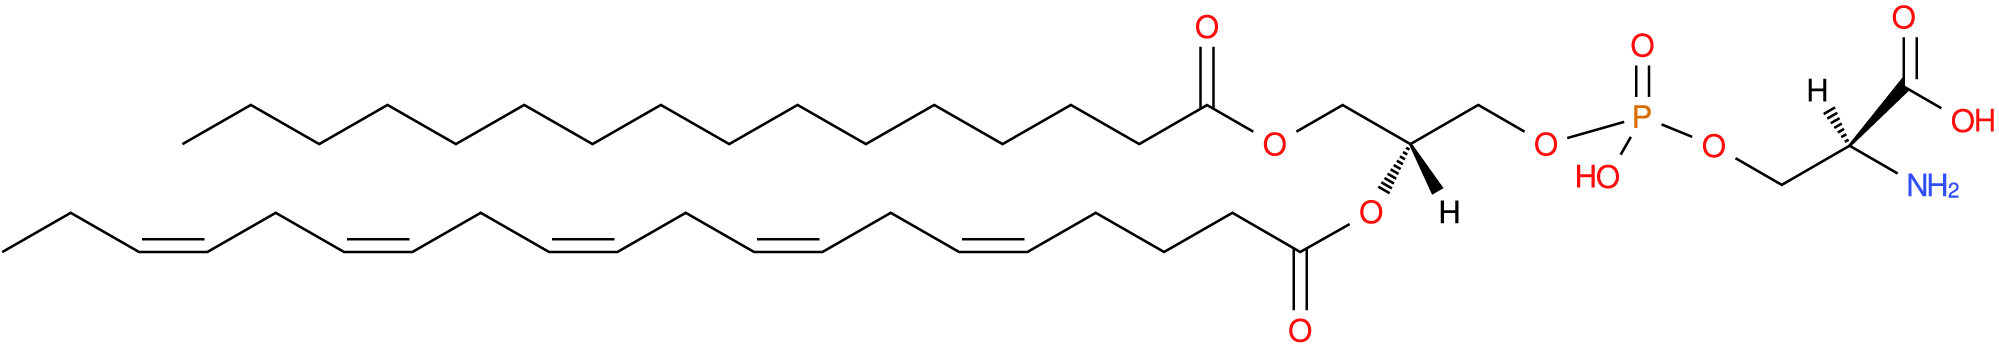
PS has a serine head group and can be produced from either PC or PE by specific PS synthases in the endoplasmic reticulum (Fig. 7). The PS can be decarboxylated back to PE via PS decarboxylase (Fig. 1) but cannot similarly be directly converted back to PC. The PS are the most abundant anionic PL at around 5–10% of total cell phospholipids (Leventis and Grinstein, Reference Leventis and Grinstein2010; Vance, Reference Vance2015) and 0.4–1.9% of plasma phospholipids (Phillips and Dodge, Reference Phillips and Dodge1967; Liu et al., Reference Liu, Wang, Hemsworth, Reich, Bath, Berkhout, Tahir, Ezernieks, Marett, Chamberlain, Goddard and Rochfort2025).
Phosphatidylserine with palmitic at sn-1, eicosapentaenoic acid at sn-2 and phosphoserine at sn-3. Common name: PS[16:0/20:5(5Z,8Z,11Z,14Z,17Z)). Image sourced from lipid maps: LMGP03010902.

The PS are unevenly distributed within a cell, with virtually all of the plasma membrane PS on the cytosolic side and none exposed to extracellular space (Leventis and Grinstein, Reference Leventis and Grinstein2010; Fairn et al., Reference Fairn, Schieber, Ariotti, Murphy, Kuerschner, Webb, Grinstein and Parton2011). A well-characterised function of PS metabolism is its ability to instigate apoptosis (Fadok et al., Reference Fadok, Voelker, Campbell, Cohen, Bratton and Henson1992; Miyanishi et al., Reference Miyanishi, Tada, Koike, Uchiyama, Kitamura and Nagata2007) and, in red blood cell, coagulation (Zwaal et al., Reference Zwaal, Comfurius and Bevers1998; Majumder et al., Reference Majumder, Quinn-Allen, Kane and Lentz2008), which is achieved by flipping the distribution of PS from the inner membrane leaflet to the outer leaflet (Leventis and Grinstein, Reference Leventis and Grinstein2010). The exposed PS becomes a signal for phagocytic cells (Fadok et al., Reference Fadok, Voelker, Campbell, Cohen, Bratton and Henson1992; Miyanishi et al., Reference Miyanishi, Tada, Koike, Uchiyama, Kitamura and Nagata2007) and clotting factors (Zwaal et al., Reference Zwaal, Comfurius and Bevers1998; Majumder et al., Reference Majumder, Quinn-Allen, Kane and Lentz2008). Additional functions of PS include contributing to the electrostatic maintenance of membranes (Leventis and Grinstein, Reference Leventis and Grinstein2010) and are associated with many brain functions including neurotransmission and neuroinflammation (Glade and Smith, Reference Glade and Smith2015; Ma et al., Reference Ma, Li, Wang, Zhang, Yang and Miao2022). Currently, ruminant PS research exclusively relates PS membrane externalisation.
The mechanistic cause of anaemia associated with cattle infected with Theileria sargenti (Japanese bovine theileria) was investigated by measuring the level of PS exposure on red blood cells in infected cattle (Shiono et al., Reference Shiono, Yagi, Chikayama, Miyazaki and Nakamura2003). The relative abundance of exposed PS was associated with the level of parasitic burden and degree of anaemia (Shiono et al., Reference Shiono, Yagi, Chikayama, Miyazaki and Nakamura2003).
A recent murine study showed that sperm are required to externalise PS to be recognised by PS receptors on oocytes for successful fusion and fertilisation (Rival et al., Reference Rival, Xu, Shankman, Morioka, Arandjelovic, Lee, Wheeler, Smith, Haney, Isakson, Purcell, Lysiak and Ravichandran2019). Traditionally, PS externalisation on bovine sperm was a sign of apoptosis, associated with cryopreservation and an indicator of reduced viability (Anzar et al., Reference Anzar, He, Buhr, Kroetsch and Pauls2002; Januskauskas et al., Reference Januskauskas, Johannisson and Rodriguez-Martinez2003; Wu et al., Reference Wu, Wu, Qin and Li2014). However, Haines (Reference Haines2021) reported that capacitated bovine sperm, a required maturation step, exposed more PS compared to uncapacitated sperm (60% vs 18%), and questioned the validity of PS exposure on sperm as a measure of viability.
Study limitations
Lipidomic studies exploring cattle health and production have increased rapidly with greater access to high-throughput analytical techniques and bioinformatics (Liu and Rochfort, Reference Liu and Rochfort2023). However, many currently published reports examining PL metabolism and its associations with cattle health or longevity are limited by small study size or observational study designs, restricting inference regarding causality and practical impact. These studies should therefore be considered foundational and hypothesis-generating. Progress toward a more causal understanding of PL metabolism and its potential benefits for cattle health will require adequately powered, controlled intervention studies, ideally conducted under commercial farming conditions and using defined endpoints of relevance to dairy producers and industry.
Conclusion
Glycerophospholipids are important regulators of dairy cow health, with influences on hepatic lipid metabolism, inflammatory signalling, aging and fertility. Many of the processes discussed within this review appear to be modified through nutritional management, yet critical questions remain. These include whether specific selection of PC production pathways, that is CDP-choline and PEMT, in the liver can enhance VLDL production and mediate lipid accumulation during the transition period; or the efficacy of different dietary forms of LC-PUFA such as triacylglycerol-rich oils vs. PL-rich formulations to modify the endocannabinoid system, aging and hepatic lipidosis. The exploration of inflammatory pathways associated with PI and PE metabolism, including eicosanoid, phosphoinositides and endocannabinoid systems, is an emerging area of dairy cattle research, but early studies indicate exciting possibilities of new treatment or management modalities for diseases of economic importance, including metritis and mastitis.
Although each PL class was addressed individually in this review, many lipid pathways overlap and an integrated approach to lipid metabolism and research is required to understand which pathways have the most quantitative effects on productive outcomes and which methods of supplementation, or other nutritional and metabolic states might influence the outcomes. The diversity of enzymatic pathways, FA remodelling, tissue specificity and the production status of cows create an intricate, dynamic and challenging network for investigators. As lipidomic technologies become increasingly available, a deeper understanding of PL biology promises to improve dairy cattle health, productivity and longevity.
Acknowledgements
This review was funded by Dairy UP, a joint project between the University of Sydney (Camperdown, NSW, Australia), Scibus (Camden, NSW, Australia), the New South Wales Department of Primary Industry and Regional Development (Orange, NSW, Australia), and Dairy Australia (Southbank, VIC, Australia); funded through the Australian and New South Wales Government’s Bushfire Local Economic Recovery Fund (Orange, NSW, Australia) with co-contributions by Australian Fresh Milk Holding Ltd. (Orange NSW, Australia), Dairy Australia (Southbank, VIC, Australia), DairyNSW (Shellharbour, NSW, Australia), eastAUSmilk (North Quay, QLD, Australia), Hunter Local Land Services (Taree, NSW, Australia), Leppington Pastoral Co. (Bringelly, NSW, Australia), Norco Dairy Co-Op (South Lismore, NSW, Australia), NSW Farmers (St Leonards, NSW, Australia), the New South Wales Department of Primary Industries and Regional Development (Orange, NSW, Australia), Scibus (Camden, NSW, Australia), South East Local Land Services (Bega, NSW, Australia), and the University of Sydney’s Dairy Research Foundation (Brownlow Hill, NSW, Australia).
Conflicts of interest
The authors have no conflicts of interest to state.


 Open access