





Recent media reports, as well as candidates’ personal statements, suggest that hostility and even physical violence against politicians have become increasingly common across many of the world’s most stable and established democracies (Corea Reference Courea2024; Le Monde 2025; Scott Reference Scott2019; Seewer Reference Seewer2025; Stroud Reference Stroud2024). Even more troubling, such abuse appears disproportionately directed at female candidates and elected officials (Håkansson Reference Håkansson2024; Herrick and Thomas Reference Herrick and Thomas2022b). Many women elected to public office report that they routinely receive abusive or threatening comments (often sexualized or violent in nature), most commonly via social media (Krook and Restrepo Sanín Reference Krook and Restrepo Sanín2020; Morgan Reference Morgan2020). While its specific motives vary – and while not all abuse and violence against women in politics (VAWIP) is explicitly driven by gendered motives (Bardall, Bjarnegård, and Piscopo Reference Bardall, Bjarnegård and Piscopo2020) – such behaviors often reflect backlash against recent gains women have made in politics and are intended to silence or marginalize them (Krook and Restrepo Sanín Reference Krook and Restrepo Sanín2020; Matfess, Kishi, and Berry Reference Matfess, Kishi and Berry2023). Indeed, it appears that such abuse sometimes achieves these goals by shortening women’s tenure in politics, limiting their engagement with their constituents, and potentially reducing their overall representation in elected institutions (Collingnon and Rüdig Reference Collingnon and Rüdig2021; NDI 2017; Wood Reference Wood2024). To the extent these actions succeed in driving women out of politics or to its fringes, they may ultimately degrade the overall quality of democracy.
Because ordinary citizens are the most frequent perpetrators of violence and abuse against women in politics in Western democracies (Collignon and Rüdig Reference Collingnon and Rüdig2021; Håkansson Reference Håkansson2021), the gender gap in hostility toward politicians could arguably be viewed as an expression of broader societal gender biases and voters’ general lack of enthusiasm – if not outright animosity – toward women holding positions of political leadership. And yet, two key empirical observations cast doubt on this perspective. First, mounting cross-national evidence suggests that the long-observed gender disparity in citizens’ voting preferences has rapidly diminished in recent decades, with voters now expressing a slight preference for women over men as candidates in national elections (Lust and Benstead Reference Lust and Benstead2024; Schwarz and Coppock Reference Schwarz and Coppock2022). Second, contrary to the societal attitudes and biases implied by the disproportionate level of abuse targeting female politicians, recent experimental studies have found that the general public is somewhat less understanding of hostility toward female officials (Håkansson Reference Håkansson2024), more averse to sexist comments targeting female politicians (Petersen, Pedersen, and Thau Reference Petersen, Pedersen and Thau2025), and views hostile comments toward female candidates as more toxic and more threatening (Eady and Rasmussen Reference Eady and Rasmussen2025).Footnote 1 Taken together, these findings imply that citizens in Western democracies are not, as a whole, outwardly hostile toward women holding elected office. If anything, they suggest that the broader public is more sensitive to threats and overtly hostile comments directed toward female politicians than to those leveled against their male counterparts.
The surprising contradiction between the observed frequency of abuse against women politicians and the recent empirical evidence of rising public support for such women was acutely highlighted by the results from the experimental study that provided the impetus and data for this article.Footnote 2 In our pre-registration plan, which includes a vignette-based survey experiment fielded on a representative sample of the British electorate during the lead-up to the 2024 general elections, we hypothesized that respondents would express greater tolerance for threats and abuse when they were directed against female politicians compared to male politicians. Specifically, we anticipated that respondents who viewed a hypothetical social media post that included an explicitly violent threat against a political candidate would be less likely to report the offending comment when the target candidate was a woman. While this expectation was motivated by the (largely anecdotal) evidence illustrated above and existing research on societal gender biases and related literature on VAWIP, our results revealed a contrary relationship. Rather than tolerating such abuse, respondents were, on average, more sensitive to hostility toward women candidates (compared to men) and more likely to report threats made against them. Two other recent studies (Eady and Rasmussen Reference Eady and Rasmussen2025; Petersen, Pedersen, and Thau Reference Petersen, Pedersen and Thau2025) published after we pre-registered our original study similarly found that audiences expressed greater disapproval for online abuse and harassment when they were directed against women politicians compared to their male counterparts. Coupled with the unexpected results from our initial study, these findings not only highlight an interesting and important contradiction between the anecdotal and empirical evidence but also suggest the possibility that the frequently observed open hostility toward women occupying positions of political authority reflects the attitudes of a specific (but highly motivated) subset of the population rather than broad-based societal gender biases in Western democracies.
Previous studies (e.g., Håkansson Reference Håkansson2021; Reference Håkansson2024) have theorized that hostile sexism motivates such abuse. However, they have often implicitly assumed that these attitudes pervade society as a whole and, as such, have neglected to explicitly examine how variation in the strength of sexism (as a dispositional characteristic) across individuals shapes their attitudes and behaviors toward violence and abuse against women in politics. Recognizing this oversight, we use the data from our initial pre-registered study to further explore these questions. The purpose of this exploratory extension of our initial study is therefore to more closely scrutinize the roles of attitudinal variables and, in particular, to examine the role of respondent sexism as a microfoundation of the gendered patterns of abuse and violence experienced by political candidates. In simpler terms, we ask whether individuals who hold sexist beliefs are disproportionately more tolerant of violent threats against female politicians.
To explore this question, we examine a subset of data from our initial, pre-registered study. As we elaborate below, that study included multiple different treatment arms. We focus here specifically on the group of respondents who viewed the violent treatment condition rather than the parallel non-violent condition. Within this subset of data, we then examine the effects of the candidate’s sex (male versus female) on audience willingness to report the violent comment directed toward the candidate and, more importantly, the moderating influence of respondent sexism on their willingness to report. The central finding from our analysis is that the relationship between the sex of a candidate and tolerance for violent online threats against them depends heavily on a respondent’s pre-existing gender attitudes. Specifically, respondents who hold more sexist attitudes express greater tolerance for violent online threats, both in general and against female candidates in particular.
We extend the investigation beyond the narrow confines of social media to consider whether the factors identified above influence respondents’ beliefs about the acceptability and understandability of violent threats against politicians more broadly (irrespective of their sex). Our conjecture is that the sex of the candidate in the vignette primes a particular association between gender and politicians, especially among hostile sexists viewing the female candidate condition. If so, we might expect the same interaction between candidate sex and respondent sexism to shape respondents’ attitudes about the acceptability and understandability of abusive and threatening actions against politicians in general. Consistent with this expectation, when primed with the vignette depicting threats toward a female candidate, sexist respondents are not only more immediately forgiving of those specific threats but subsequently express greater tolerance for various forms of political harassment and threatening behavior.
Our study contributes to the understanding of abuse and violence against politicians in several important ways. First, the results join the growing evidence that sexist attitudes strongly influence individuals’ beliefs about the acceptability of political violence as a means to achieve social and political goals. Taken alongside other recent findings (Kalmoe and Mason Reference Kalmoe and Mason2022; Piazza and O’Rourke Reference Piazza and O’Rourke2025), our results place sexism in a constellation of variables, including the ‘dark triad’ of narcissism, psychopathy, and Machiavellianism (e.g., Berntzen, Kelsall, and Harteveld Reference Berntzen, Kelsall and Harteveld2024; Gluck, Heesacker, and Choi Reference Gluck, Heesacker and Dorothy Choi2020) and the ‘lethal union’ of right-wing authoritarianism and social dominance orientation (Austin and Jackson Reference Austin and Jackson2019), that go beyond political ideology and partisanship in predicting various anti-social behaviors and tolerance of political violence. Second, by demonstrating that the gender attitudes of respondents moderate the influence of candidate sex on tolerance for threats and abuse, our results help explain the simultaneous, yet seemingly contradictory, trends of rising preference for female candidates among voters and the increased and disproportionate levels of violence and threats against women in politics. Similarly, by focusing on individual-level gender attitudes, we can help distinguish between the broader societal norms that have long disadvantaged women seeking elected office and the dispositional characteristics of individuals that motivate and facilitate specific behaviors towards these women. By highlighting the latter, we encourage scholars not only to assess the strength of general norms against political violence but also to identify the subcultures in which those norms may be a good deal weaker (e.g., Barnes and Karim Reference Barnes and Karim2026).
Harassment, abuse, and (violent) backlash against women in politics
While abuse of politicians is a pervasive feature of contemporary local and national politics, it is often highly gendered in both its targets and its presentation (Bardall, Bjarnegård, and Piscopo Reference Bardall, Bjarnegård and Piscopo2020; Herrick, Thomas, Franklin et al. Reference Herrick, Thomas, Franklin, Godwin, Gnabasik and Schroedel2021; Herrick and Thomas Reference Herrick and Thomas2023; Mechkova and Wilson Reference Mechkova and Wilson2021; Rheault, Rayment, and Musulan Reference Rheault, Rayment and Musulan2019). For example, regional and global surveys of female parliamentarians conducted by the IPU documented that some 80% of respondents reported experiencing harassment or psychological violence, 40% reported experiencing threats of physical violence, including death threats and rape, and some 25% reported being the victim of physical or sexual violence (IPU 2016; 2018). Recent surveys comparing male and female politicians (both local and national) in the UK (Collingnon and Rüdig Reference Collingnon and Rüdig2021), US (Herrick, Thomas, Franklin et al. Reference Herrick, Thomas, Franklin, Godwin, Gnabasik and Schroedel2021; Herrick and Thomas Reference Herrick and Thomas2022a; Reference Herrick and Thomas2022b; Porten and Locke Reference Porten and Locke2024), Sweden (Häkansson Reference Håkansson2021), and Ireland (Buckley, Keenan, and Mariani Reference Buckley, Keenan and Mariani2025) illustrate that, across political systems, women politicians are disproportionally targeted for threats and physical abuse.
Recent studies likewise highlight qualitative differences in the abuse that women and men candidates receive. For example, compared to their male colleagues, women MPs in the UK were not only more likely to be the targets of uncivil and abusive social media posts (‘Tweets’), but they were also more likely to receive messages that included stereotypes about their identity and questioned their position and authority (Southern and Hammer Reference Southern and Harmer2021). Women candidates competing in state-level legislative races in the US were more likely to report experiencing physical and sexualized violence compared to male candidates (Herrick and Thomas Reference Herrick and Thomas2022b), while female campaign workers are more likely to receive offensive and ‘silencing’ messages than male volunteers (Yan and Berhard Reference Yan and Bernhard2024). Notably, it appears that women politicians face a ‘double burden’ with respect to threatening and abusive behavior from the public: they are not only exposed to higher rates of abuse but also experience it in a more severe manner due to their perception of its gendered motivations (Eady and Rasmussen Reference Eady and Rasmussen2025). It is therefore unsurprising that abuse, incivility, and toxic discourse can lead women candidates to reduce the time they spend canvassing and their social media use (Collignon and Rudig Reference Collingnon and Rüdig2021); dampen their desire to remain active in politics (Maisel Reference Maisel2015);Footnote 3 and encourage them to reconsider their political careers (Buckley, Keenan, and Mariani Reference Buckley, Keenan and Mariani2025; Herrick, Thomas, Franklin et al. Reference Herrick, Thomas, Franklin, Godwin, Gnabasik and Schroedel2021; Porten and Locke Reference Porten and Locke2024). Thus, gendered patterns of abuse against politicians both harm the individual target and potentially adversely impact the gender composition of elected bodies.
While the scale, severity, and consequences of gendered harassment and abuse of politicians are now well-documented, their motivations and origins are more difficult to establish empirically. At the core, scholars examining public opposition to female political leaders often draw upon social role theory to explain the negative reactions women candidates routinely receive relative to their male competitors. According to social role theory (e.g., Koenig and Eagly Reference Koenig and Eagly2014), historically and cross-culturally prevalent gender-based divisions of labor produce (and reproduce) gender stereotypes that influence individuals’ behaviors and perceptions of others’ behaviors. These effects then manifest in negative evaluations of role-incongruent behavior, where individuals are judged more harshly when they fail to conform to societal expectations associated with their gendered roles (Eagly and Karau Reference Eagly and Karau2002; Koenig and Eagly Reference Koenig and Eagly2014). Thus, women who occupy or aspire to political leadership roles are penalized for exhibiting gender role-incongruent behavior (Schneider and Bos Reference Schneider and Bos2019; Teele, Kalla, and Rosenbluth Reference Teele, Kalla and Rosenbluth2018), judged more harshly for mistakes or perceived failures compared to their male counterparts (Carlin, Carreras, and Love Reference Carlin, Carreras and Love2020), and less likely to receive the same boosts in public approval during international crises that male leaders have traditionally enjoyed (Holman, Merolla, and Zechmeister Reference Holman, Merolla and Zechmeister2022). Consequently, women who occupy or pursue positions of political leadership are often devalued or vilified for challenging gender norms.
The sentiments that motivate gendered criticism of women leaders may likewise contribute to explicit abuse and provoke violence against women’s presence in politics. Mechkova and Wilson (Reference Mechkova and Wilson2021), for instance, demonstrate that the prevalence of hateful Twitter posts targeting women candidates in the 2018 US mid-term elections was most pronounced for women candidates who broke with gender stereotypes. Similarly, electoral violence often manifests in highly gendered ways and is employed with the explicit intention of marginalizing and silencing women candidates, thereby preserving the prevailing (patriarchal) socio-political order (Bardall Reference Bardall2011; Krook and Restrepo Sanín Reference Krook and Restrepo Sanín2020). Consistent with these claims, Matfess, Kishi, and Berry (Reference Matfess, Kishi and Berry2023) show that violence targeting women has increased as women have gained larger numbers of seats in Kenya’s parliament, suggesting a backlash against women’s political gains. Multiple studies likewise demonstrate that greater public visibility and holding higher-ranking positions increase the risk of threats and abuse toward women politicians (Bardall Reference Bardall2011: 13–14; Häkansson Reference Håkansson2021; Herrick and Thomas Reference Herrick and Thomas2022a). These findings jointly highlight how women’s increasing success and expanding authority within historically male-dominated domains can, at least under some conditions, produce resentment and engender abuse, harassment, and violence against women politicians.
However, the propensity for abusive behavior to disproportionately target women who run for and win elected office stands in stark contrast to the empirical record: female candidates are at least as popular as male candidates in most contemporary democratic settings. For instance, a recent meta-analysis including dozens of published experimental studies fielded across six continents suggests that the public expresses a small (two percentage point) but significant preference for female candidates over their male counterparts (Schwarz and Coppock Reference Schwarz and Coppock2022). Observational studies in several advanced democracies also indicate that any tendency for women to be disadvantaged at the ballot box has largely disappeared in recent decades (e.g., King and Leigh Reference King and Leigh2010; Thomsen Reference Thomsen2020). Women’s increasing success as political candidates and the corresponding normalization of their roles in the political arena suggest there may be potential limits to the explanatory power of social role theory in the contemporary political context.
Surprisingly, few studies have explicitly examined public attitudes towards abuse and threats leveled against politicians or investigated the gendered dimensions of those attitudes, while empirical results from the few experimental studies probing this relationship suggest that the public is, if anything, less accepting of threats against women candidates and is particularly sensitive to the gendered nature of such abuse. Similar to our initial expectations, Håkansson (Reference Håkansson2024) hypothesized greater respondent lenience towards hostility directed at women politicians but ultimately found (amid largely null effects) that the American and Swedish publics were, on average, marginally less understanding of hostile online messaging directed toward female political leaders. Since then, two studies of specifically online abuse reflect a similar finding. Petersen, Pedersen, and Thau (Reference Petersen, Pedersen and Thau2025) likewise found that Danish respondents generally expressed greater aversion to negative comments targeting female politicians compared to male politicians, particularly when the comments contained explicitly sexist remarks. In their multi-country study, Eady and Rasmussen (Reference Eady and Rasmussen2025) found both politicians and citizens viewed abusive social media messages targeting women politicians as more toxic than those targeting men, particularly when the comments employed gendered messaging or when the perpetrator was male. Notably, such results are not specific to the targeting of politicians: research in criminology likewise suggests that the public perceives online hate speech targeting women as more transgressive than other forms of hate speech (Obermaier, Schmid, and Reiger Reference Obermaier, Schmid and Rieger2023).
These findings appear at odds with social role theory and its implication of broader public resentment (and potentially punishment) for women who challenge traditional gender roles and hierarchies. We contend that any disconnect likely stems, at least partly, from failure to explicitly consider individual differences in gender beliefs and attitudes. While the experimental studies discussed above consider sexism as a likely contributing factor in tolerance for gender-based hostility toward candidates, they do not explicitly account for respondent sexism in their empirical analyses.Footnote 4 This oversight is all the more important given that misogynistic dispositions likely influence not only respondents’ attitudes toward female leadership but also their attitudes to political violence more generally. We therefore unpack below why the sexist beliefs of a subset of citizens – who not only resist the normalization of women in politics but are also generally more tolerant of violence – help to explain public attitudes towards candidate abuse and, in turn, may facilitate the disproportionate abuse observed against women politicians. This discussion leads to a set of empirical expectations about the relationships between candidate sex, gendered beliefs of respondents, and attitudes toward violent threats against politicians.
Sexism, misogyny, and tolerance of violent threats online
The link between sexism – understood as disposition rather than contextual sentiment – and tolerance of violence is well established. According to a recent meta-analysis (Agadullina, Lovakov, Balezina et al. Reference Agadullina, Lovakov, Balezina and Gulevich2022), benevolent and (especially) hostile sexism are positively associated with the acceptance of violence against women, while hostile sexism also predicts tolerance of violent behaviors more generally (e.g., Rottweiler, Clemmow, and Gill Reference Rottweiler, Clemmow and Gill2025). This echoes multiple previous studies reporting a strong association between participation in (or support for) political and social violence and gender inegalitarian attitudes (Bjarnegård, Engvall, Jitpiromsri et al. Reference Bjarnegård, Engvall, Jitpiromsri and Melander2023; Wood and Ramirez Reference Wood and Ramirez2018), patriarchal ‘honor’ cultures (Bjarnegård, Brounéus, and Melander Reference Bjarnegård, Brounéus and Melander2021; Nisbett and Cohen Reference Nisbett and Cohen1996), and societies where women possess fewer rights and freedoms (Hudson, Caprioli, Ballif-Spanvill et al. Reference Hudson, Caprioli, Ballif-Spanvill, McDermott and Emmett2012). Recent surveys in established democracies such as the US and UK similarly suggest that hostile, sexist, or misogynistic attitudes predict support for partisan (Kalmoe and Mason Reference Kalmoe and Mason2022; Piazza and O’Rourke Reference Piazza and O’Rourke2025) and extremist violence (Rottweiler, Clemmow, and Gill Reference Rottweiler, Clemmow and Gill2025). Piazza and O’Rourke (Reference Piazza and O’Rourke2025) additionally find that politically illiberal attitudes and social dominance orientation mediate this relationship. Thus, sexist beliefs coincide with a worldview oriented toward hierarchical social structures, which in turn motivates support for the use of violence as a legitimate means of achieving social and political goals. Notably, there is also evidence that the relationship between support for political violence (as well as against women specifically) is strongest among men who perceive violations of their (masculine) entitlement and threats to their (male) in-group (Rottweiler, Clemmow, and Gill Reference Rottweiler, Clemmow and Gill2025).
Collectively, these findings suggest that sexism predisposes individuals to endorse (or wield) violence as a strategy of maintaining a traditional social order, including the subordination of women (the female) to men (the male), and confronting challenges to that established order or perceived threats to existing (male) privilege. Because women seeking or holding positions of political authority necessarily represent a threat to the patriarchal order, they often provoke anger and resentment among the subset of the population who possess strongly sexist and misogynistic attitudes. This animosity toward such transgressive women is observed empirically in the high degree of opposition to women candidates observed among hostile sexist respondents in surveys (e.g., Winter Reference Winter2023). In its more sinister manifestation, the desire to subordinate women and (re)assert traditional gendered hierarchies motivates explicit acts of violence against women in politics (Bourdieu Reference Bourdieu2001; Krook and Restrepo Sanín Reference Krook and Restrepo Sanín2020). In this sense, violence and abuse represent a strategy of ‘gender role enforcement’ that seeks to punish, silence, and marginalize transgressive women (Krook and Restrepo Sanín Reference Krook and Restrepo Sanín2016, 466; Reference Krook and Restrepo Sanín2020), thus protecting the status quo.
Importantly, though, the strength of these sentiments is distributed unevenly across the population. The animosity provoked by the presence of empowered women and the desire to retaliate (sometimes violently) against them is therefore likely to be most intensely felt by the subset of the population that adheres to a worldview in which women should be subordinate to men. Individuals who possess such sexist dispositions are likely to perceive women candidates and politicians as a threat to their preferred social order and, by extension, to men’s dominant position within it. Because these individuals are the most likely to feel invested in the prevailing patriarchal status hierarchy, they are also the most sensitive to the threats posed by powerful women and thus the most likely to support violence as a means to preserve (or re-establish) it. This dynamic likely explains Herrick and Thomas’ (Reference Herrick and Thomas2022b) finding that threats and abuse against women candidates occur more frequently in geographic areas where traditional gender norms and practices are most prevalent. Extending this logic to the individual level, we expect that sexist attitudes are associated with significantly greater tolerance for online abuse and violent threats against women politicians and political candidates.
The preceding discussion produces a set of empirical expectations regarding public attitudes towards abusive social media posts and violent threats against politicians. Due to the dissonance between the experimental record showing public intolerance of abuse targeted at women and the comparatively higher rates at which women report experiencing threats and abuse, we do not expect candidate sex to exert a significant independent influence on the broader public’s tolerance for violent threats made against candidates. However, given recent empirical findings regarding the linkages between sexism and violence, we anticipate that sexist attitudes influence respondents’ tolerance for violent threats against politicians. We additionally expect that sexism exerts a powerful moderating influence on the relationship between candidate sex and tolerance of violence against political candidates. Specifically, we expect that those with more sexist attitudes will express greater tolerance for overtly violent social media comments made against candidates (regardless of sex) (H1). We further contend that respondent sexism serves as a key moderator shaping the relationship between target candidate sex and public tolerance of violent threats toward politicians. We expect respondents with more sexist attitudes to be disproportionately tolerant of violent social media comments when made against female candidates (H2).
Gendered priming, sexism, and tolerance for abuse against politicians
The discussion above focused on a specific episode of online abuse. However, a central concern is that witnessing such toxic behaviors online de-sensitizes observers and normalizes aggression, thereby promoting tolerance for abuse, threats, or even assaults on politicians in the real world. The purpose of this section is to assess whether that process might be similarly gendered. If the way that sexists react to a specific case of online abuse against a female politician is to justify or explain it, perhaps through the common assertion ‘that’s just politics’, then they might perceive subsequent offenses or behaviors in that same dismissive light.
We acknowledge that the evidence for de-sensitization or spillover from online to offline violence is somewhat controversial. Some studies have found that short-term exposure to violence through a variety of media (films and television, video games, and social media) promotes aggression, increases tolerance for violence, and reduces sympathy for its targets (Bushman Reference Bushman1995; Bushman and Anderson Reference Bushman and Anderson2009; Funk, Baldacci, Pasold et al. Reference Funk, Baldacci, Pasold and Baumgardner2004; Krahé, Möller, Huesmannm et al. Reference Krahé, Möller, Huesmann, Kirwil, Felber and Berger2011). Others, however, report null effects (e.g., Lengersdorff, Leopold, Wagner et al. Reference Lengersdorff, Wagner, Mittmann, David Sastre-Yagüe, Olsson, Petrovic and Lamm2023; Przybylski and Weinstein Reference Przybylski and Weinstein2019), thus prompting a debate about the robustness and replicability of these findings and about the role of publication bias in shaping the subfield (Anderson and Bushman Reference Anderson and Bushman2023; Devilly, Drummond, Sauer et al. Reference Devilly, Drummond, Sauer, Copenhaver, Kneer and Ferguson2023). Even assuming robustness, there are questions about the external validity and the durability of such experimentally induced effects. Nonetheless, on balance, the published evidence suggests a short-term post-exposure effect, whereby individuals who witness or participate in violence within a digital domain become somewhat more accepting of such behaviors in the physical world.
The same could occur in the context of exposure to violent online political discourse and attitudes regarding violence against politicians more broadly. That is, observing violent threats made against politicians may (at least temporarily) increase respondents’ beliefs in the acceptability of harassment and threatening behaviors toward politicians in the real world, such as at their homes, offices/surgeries, and via direct correspondence (i.e., email and telephone). As argued above, however, these effects are likely to depend heavily on the characteristics of both the observer and the target. For example, previous studies find that the positive effects of exposure to violence on respondents’ sensitivity to it appear strongest among individuals with a pre-existing stable tendency toward aggression (i.e., trait aggression) (Bushman Reference Bushman1995). Similarly, Kalmoe (Reference Kalmoe2014) reports that exposure to violent political rhetoric or statements that insinuate political violence against adversarial groups promotes support for political violence more broadly, but only among trait-aggressive individuals.
Partisan allegiance and ideological positioning also drive respondents’ attitudes towards a politician target and, in turn, whether abuse of that target is likely to activate a defensiveness of politicians or a tolerance for such abuse. The ingroup/outgroup divisions generated by ideology and partisanship often powerfully shape reactions to the more ‘everyday’ forms of abuse and cruelty (Barber and Davis Reference Barber and Davis2022; Webster, Glynn, and Motta Reference Webster, Glynn and Motta2024). In one vivid example, Nai, van Erkel, and Bos (Reference Nai, van Erkel and Bos2025) find that violent attacks against right-wing Dutch politician Thierry Baudet during the 2023 elections corresponded to only a small increase in tolerance of political violence generally. However, among those who already viewed Baudet and his party unfavorably, the attack produced a pronounced uptick in the belief that such violence was justifiable. Observing violent online threats directed against a female candidate may produce a parallel effect among respondents whose sexist attitudes generate hostility towards women politicians as a group.
The logic underpinning this expectation is thus two-fold. The first is rooted in the arguments and evidence presented, which suggested a link between sexism/misogyny and support for violence. Based on this, we expect that respondents who hold more pronounced sexist attitudes are readier to endorse abuse and threats against politicians more generally (H3). Second, and perhaps more insidiously, we anticipate that individuals who possess such attitudes are more likely to feel specific and substantial animosity towards women who have contravened traditional gender norms or threatened the gender hierarchy, such as those who acquire (or actively pursue) positions of power traditionally reserved for men. Priming respondents to think about women in positions of political authority is expected to trigger resentment and anger among those who possess the most sexist attitudes; moreover, highlighting violent threats directed against these figures is likely to promote acceptance or approval of abuse. Thus, we suggest that the tendency posited in H3, for sexist respondents to be more tolerant of wider threats and abuse of politicians, will be stronger if they observe violent social media abuse directed towards a female candidate rather than towards a male candidate (H4).
Experimental design and data
We investigate the validity of these hypotheses using an image-based experiment embedded in an online survey, for which we recruited a sample of 1,996 UK-based respondents via the Prolific platform. This well-respected panel provider offers UK-based samples stratified by age, sex, and ethnicity, thus permitting a demographically representative sample. After receiving the necessary ethical approval to begin data collection, the survey was fielded between June 29 and July 6 (during the week prior to the 2024 UK General Election).Footnote 5 This choice of fieldwork period was deliberate: both incidences of violence and public tolerance of such violence are most likely in the febrile atmosphere of an election campaign, making the topic more salient for respondents.
All respondents were exposed to a vignette comprising a social media post by a fictitious candidate on the controversial issue of immigration and two responses to the initial post from fictitious users of the social media platform. The first of these responses depicted a mildly uncivil (but non-violent) message, while the second response contained either an additional (slightly more) uncivil (non-violent) message or a message that both evoked violent imagery (knifing) and was framed as an oblique threat directed toward the candidate. We also manipulated three additional elements of the vignette: the candidate’s sex (man vs. woman), their party affiliation (Conservative vs. Labour), and their immigration position as reflected in the content of the post (pro vs. anti). The first two of these elements are of principal interest to this paper. The latter two, however, are not, and we therefore control for them in our empirical analyses.Footnote 6
Examples of the two relevant manipulations are illustrated in Figure 1 (i.e., female/violent and male/non-violent). Notably, the sex of the candidate is not explicitly referenced in the vignette; rather, it is signaled subtly but directly via the candidates’ names (Sarah vs. Simon) and the small profile images. Both versions of the response also begin with the statement ‘You should stop running off your stupid mouth’; however, the violent condition then alludes to violence by the explicit reference to a ‘knife’. Similar to other recent studies, we simulate a post on the social media platform ‘X’ (formerly Twitter) because, at least at that time, it was the most realistic and widely-known context for such exchanges between politicians and a potentially hostile public.
Sample vignettes.
Note: Two examples of the vignettes illustrate variation in candidate sex and nature of abuse.

After viewing the post and the subsequent comments, respondents were asked the following about each comment: 1) In thinking about social media platforms that you are familiar with, do you think the first/second response breaks the rules of that social media platform? 2) Would you report the first/second response to that social media platform? The response option for each question was a 4-point Likert scale ranging from ‘definitely wouldn’t’ break the rules/report to ‘definitely would’ break the rules/report. The second question, querying the respondents’ willingness to report the second response, serves as the dependent variable used to evaluate our first set of hypotheses (H1–H2).
Tolerance has both attitudinal and behavioral dimensions: how people feel about the abuse and what (if anything) they would do about it. Our dependent variable taps the latter. This choice was driven partly by pressures on space and partly by the origins of this experiment, which was co-designed with organizations more interested ultimately in shaping behavior than in gauging public opinion. But there is also a content validity argument for focusing on behavioral intentions: someone who regards abuse as unacceptable but would do nothing about it is, in essence, tolerating it. In any case, results from two of the studies cited above strongly suggest that our results will not depend much on the choice of the outcome variable. Håkansson (Reference Håkansson2024) and Petersen, Pedersen, and Thau (Reference Petersen, Pedersen and Thau2025) include both attitudinal and behavioral measures and report the same pattern of results across these different dependent variables. Indeed, they use a similar ‘willingness to report’ question as our own and find that responses correlate strongly enough with attitudinal reactions to online abuse to be considered an indicator of the same underlying variable.
The second pair of hypotheses (H3–H4) concerns whether the effects of the treatment extend beyond the confines of the digital environment. These are tested using two batteries of items that were asked several questions after the experimental phase. Specifically, we asked respondents whether it was ever a) ‘acceptable’ and b) ‘understandable’ for someone to engage in the following behaviors if they were angry at a politician for doing or saying something they disagreed with: 1) insult the politician via email; 2) threaten the politician via email; 3) shout insults at the politician in their office; 4) physically threaten the politician in their office; 5) paint insulting slogans on the walls of the politician’s office; and 6) paint insulting slogans on the walls of the politician’s home. Following Håkansson (Reference Håkansson2024), we view acceptability and understandability as distinct but closely related concepts. The former reflects elements of social desirability and an individual’s beliefs about broader social norms regarding a given behavior (i.e., violence toward politicians), while the latter is more related to an individual’s ability to appreciate the actions of another individual (i.e., a generic hypothetical aggressor) or to ‘put themselves in the shoes’ of the other.
Like Håkansson, we expect respondents to regard behaviors as more understandable than acceptable; however, we have no a priori reason to expect different relationships with our key gender variables. Thus, we treat them as parallel outcome variables by which to test H3 and H4, but we remain cognizant that they could pick up different relationships between distinct concepts. Both measures are indices created by averaging the individuals’ responses (on a seven-point Likert scale) across the six questions noted above. The Cronbach’s alphas (0.85 [acceptability] and 0.88 [understandability]) indicate that the items scale well, and the correlation of 0.66 between the two measures vindicates using them as indicators of the same general variable of tolerance and should function as a reliable measure of general tolerance of abuse.
Sexism, our key moderating variable, is also a composite measure similarly constructed by summing and subsequently averaging respondent scores on four Likert items about gender equality and the status of women in society: 1) Women exaggerate problems they have at work; 2) Women seek to gain power by getting control over men; 3) I am concerned about women being treated fairly in life; and 4) It is important to work toward greater gender equality in society. According to Schaffner (Reference Schaffner2022), items 1 and 2 are the most informative of the numerous questions in the Ambivalent Sexism Inventory (ASI), and combining them creates an adequate measure of hostile sexism. The remaining items (3 and 4) are adapted from the Feminist Identity Development Scale (FIDS) (Bargad and Hyde Reference Bargad and Shibley Hyde1991). These items serve as a reliable measure of individual support for gender equality among both men and women (Moradi, Subich, and Phillips Reference Moradi, Subich and Phillips2002) and have been used to proxy gender egalitarian beliefs in examining the influence of gender attitudes on support for political violence (Wood and Ramirez Reference Wood and Ramirez2018). Including these latter two items allows us to construct a longer (and more reliable) scale that is better balanced against acquiescence bias than the two ASI items alone. Principal component analysis confirms that this scale has one dominant factor (explaining 66% of the covariation among the items, with all four item loadings exceeding 0.6) and a Cronbach’s alpha of 0.83.Footnote 7 These results echo the persistent finding that different dimensions of sexism are routinely quite strongly correlated, thus vindicating the use of a general measure.Footnote 8
In each model, we adjust for various demographic or political factors that may alternatively influence tolerance of candidate abuse. This includes a measure of respondent ideological congruence with the message they viewed (a 7-point Likert scale matching the level of agreement between the immigration position expressed in the original post and the respondent’s expressed ideological position), their age (in 5-year cohorts from 18–24 to 70+), their sex (woman or man, with any other response dropped from main models), their ethnicity (a binary measure coded ‘1’ if ‘White’ was selected and ‘0’ for any other ethnicity), and their level of education (a binary measure coded ‘1’ for anyone with at least a university degree and ‘0’ for any other response). Additional descriptive statistics are included in the online Appendix (Tables A1–A5).
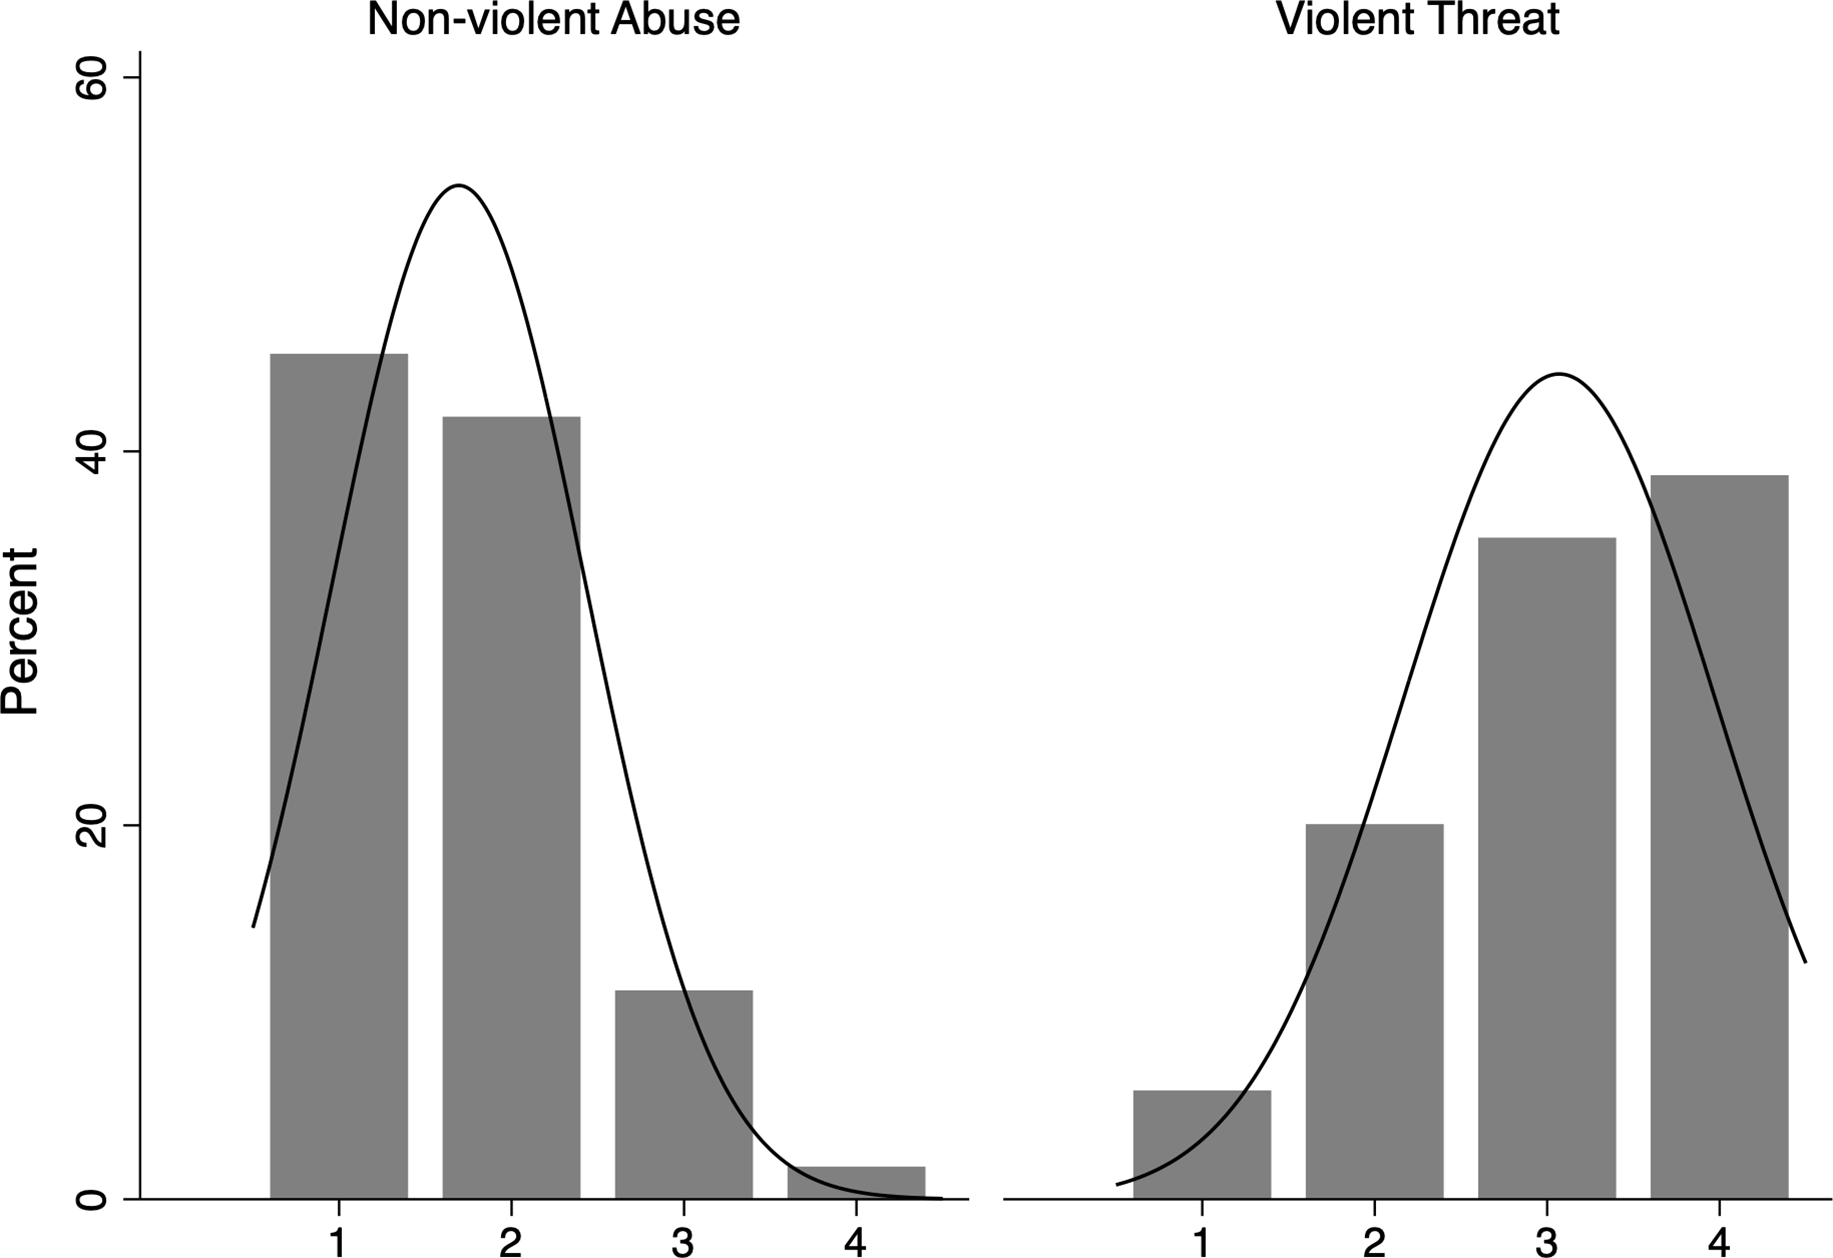
Figure 2 shows the distributions of responses for Would Report by whether the respondent saw the non-violent or violent abuse, since this dependent variable was directly tied to the vignette experiment. For the non-violent condition (left), only 13% of respondents said that they would either ‘definitely’ or ‘probably’ report the post to the platform. This compares to 74% of respondents viewing the violent condition (right).Footnote 9 Clearly, respondents successfully discriminate between nominally abusive comments and those that threaten violence. The data further suggest that the clear majority of respondents recognized that violence constitutes a norm violation and also expressed a hypothetical willingness to undertake action to counter it. This implies that overt tolerance for violently abusive messaging on social media is limited to a minority of the population.
Distribution of ‘would report’ responses by violent/non-violent condition.
Note: Distribution of responses across categories (bars) of Would Report and scaled normal density plot (lines) by condition. Non-violent Abuse: X̄ = 1.69, s = 0.74, n = 927; Violent Threat: X̄ = 3.07, s = 0.90, n = 743.

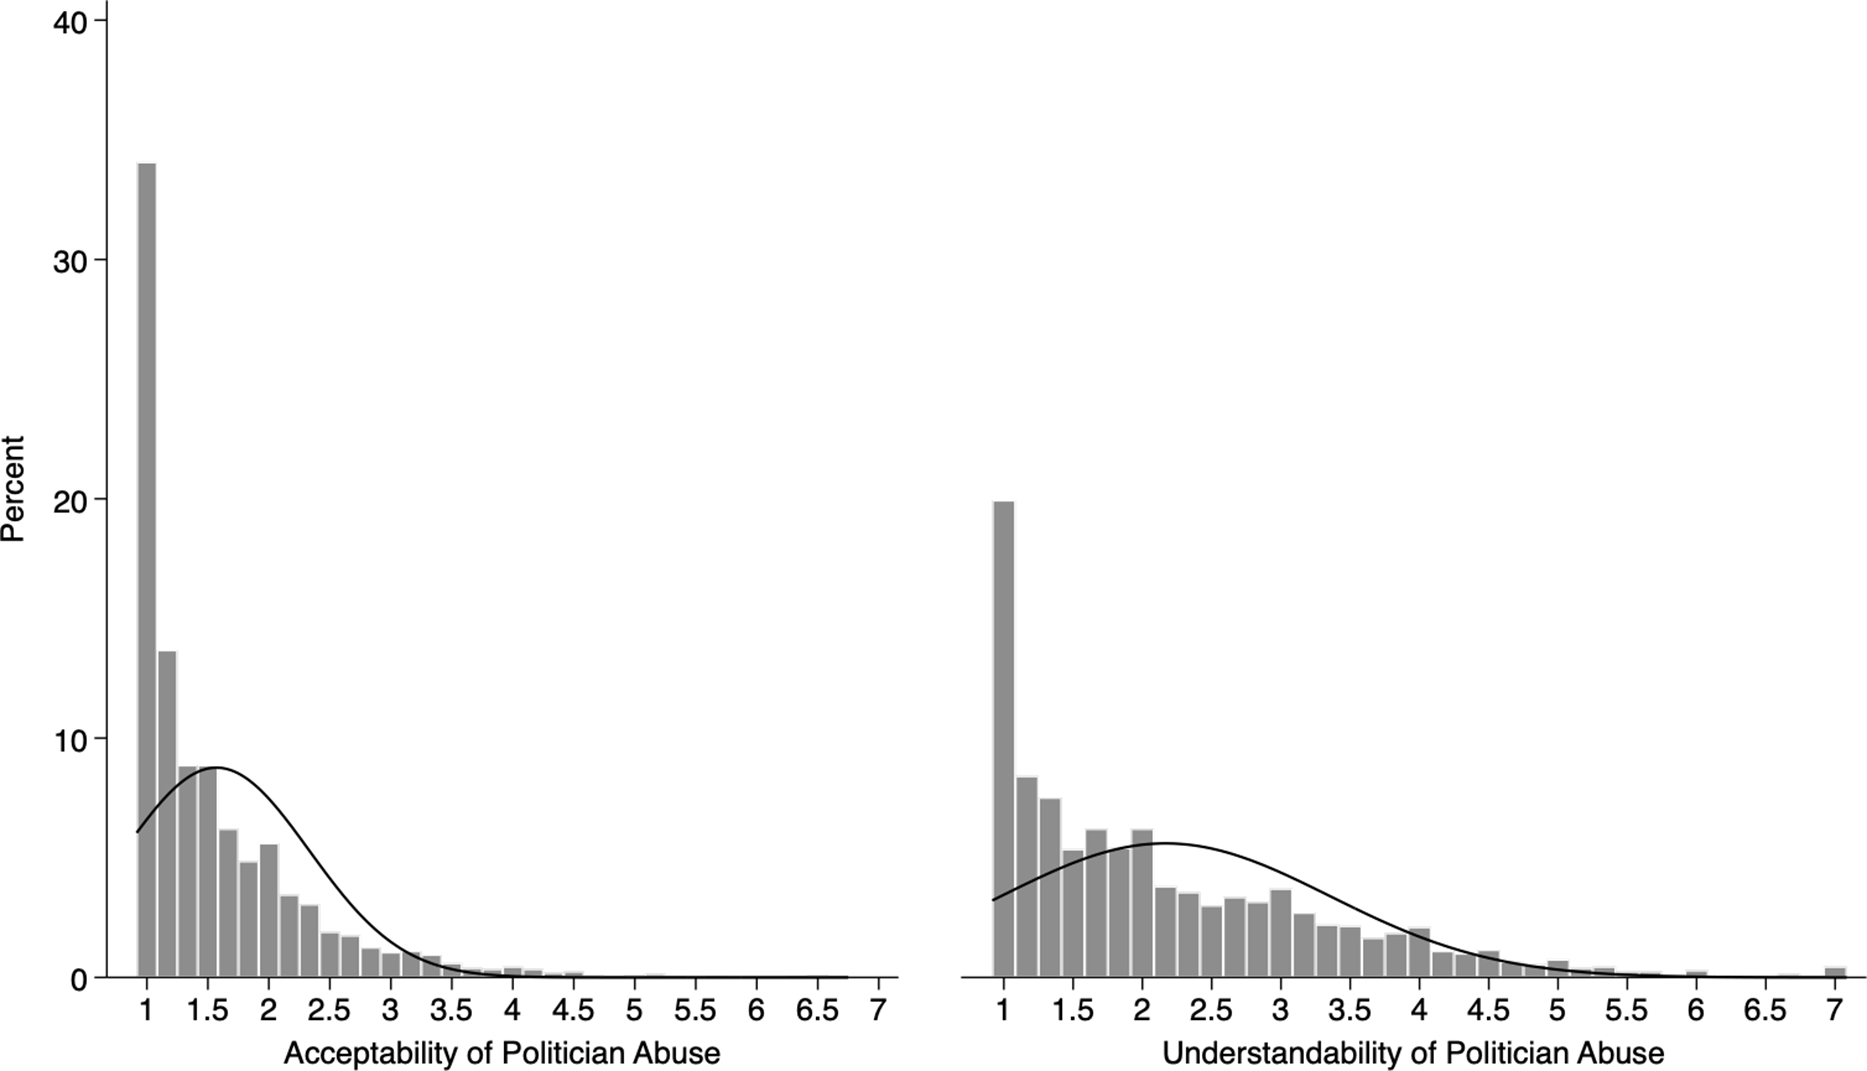
Our second set of analyses is based on a composite index of beliefs about the acceptability and understandability of abuse against politicians more broadly. Figure 3 confirms that most respondents believe that most such abuse and threats are unacceptable, while there is more understanding of it. The minimum value of 1 on the scale would be scored by someone answering ‘never acceptable’ (‘never understandable’) to each of the six questions included in the scale, and the distributions are heavily skewed towards that value (acceptability X̄ = 1.57, s = 0.76; understandability X̄ = 2.17, s = 1.19). Less than 2% of respondents scored at the midpoint or above on the 1–7 acceptability scale, compared with less than 10% at the midpoint or above on the 1–7 understandability scale, meaning a non-trivial proportion of respondents consider such behaviors acceptable and a larger proportion considers such behaviors understandable at least sometimes.Footnote 10 Figure 3 also supports the idea that although acceptability and understandability may tap into a similar construction of tolerance, they are not identically distributed in the population.
Distribution of acceptability/understandability of abuse scores.
Note: Distribution of respondent scores across indicator categories (bars) and scaled normal density plot (line).

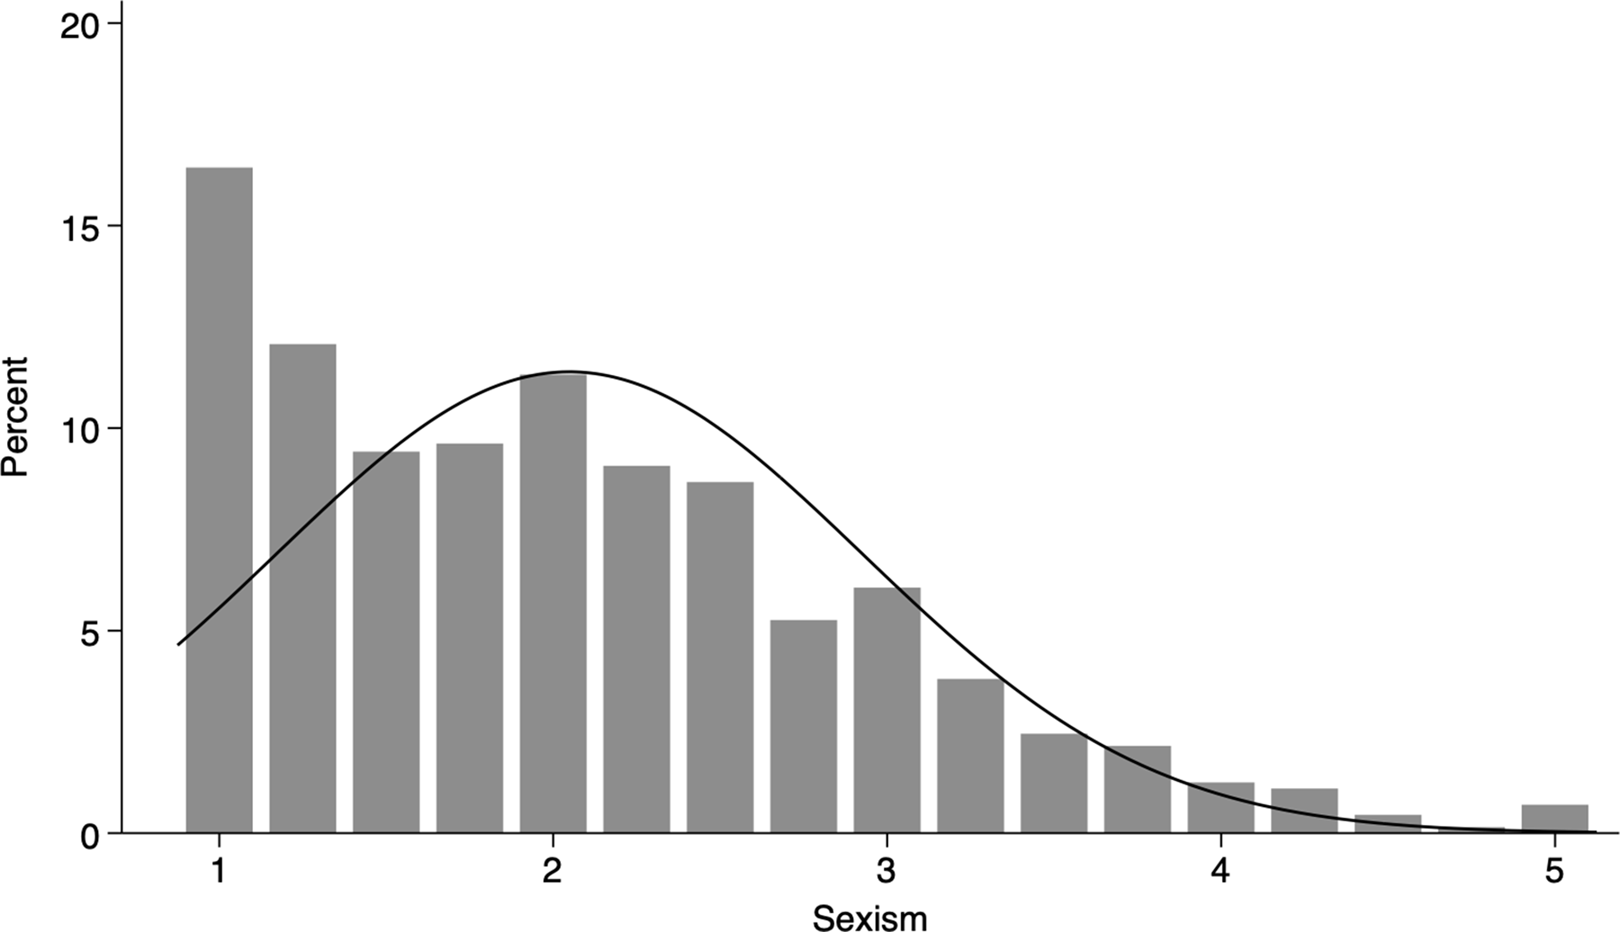
Lastly, Figure 4 displays the distribution of Sexism (X̄ = 2.05, s = 0.88) along the 1–5 scale. Approximately 60% of respondents across both conditions score at 2 or below on the scale, indicating a very low level of sexism (or high degree of anti-sexism), while only about 2.5% score four or above, indicating strongly and overtly sexist attitudes. However, because their middling scores suggest indifference to sexist statements and/or weak support for expressions of gender equality, the remaining 37% arguably possess at least mildly sexist attitudes.
Distribution of sexist attitudes scale scores.
Note: Distribution of responses across categories (bars) of Sexism and scaled normal density plot (line).

Results and analyses
We present the results of our analyses below. We first discuss the relationships between candidate sex, respondent sexism, and the likelihood of reporting the abusive social media post and whether and how that depends on the level of violence in that post. We then turn to whether the experimental treatment has downstream effects on beliefs about the acceptability and understandability of abuse and violent threats against politicians more broadly and beyond the confines of social media.
Likelihood of reporting online abuse
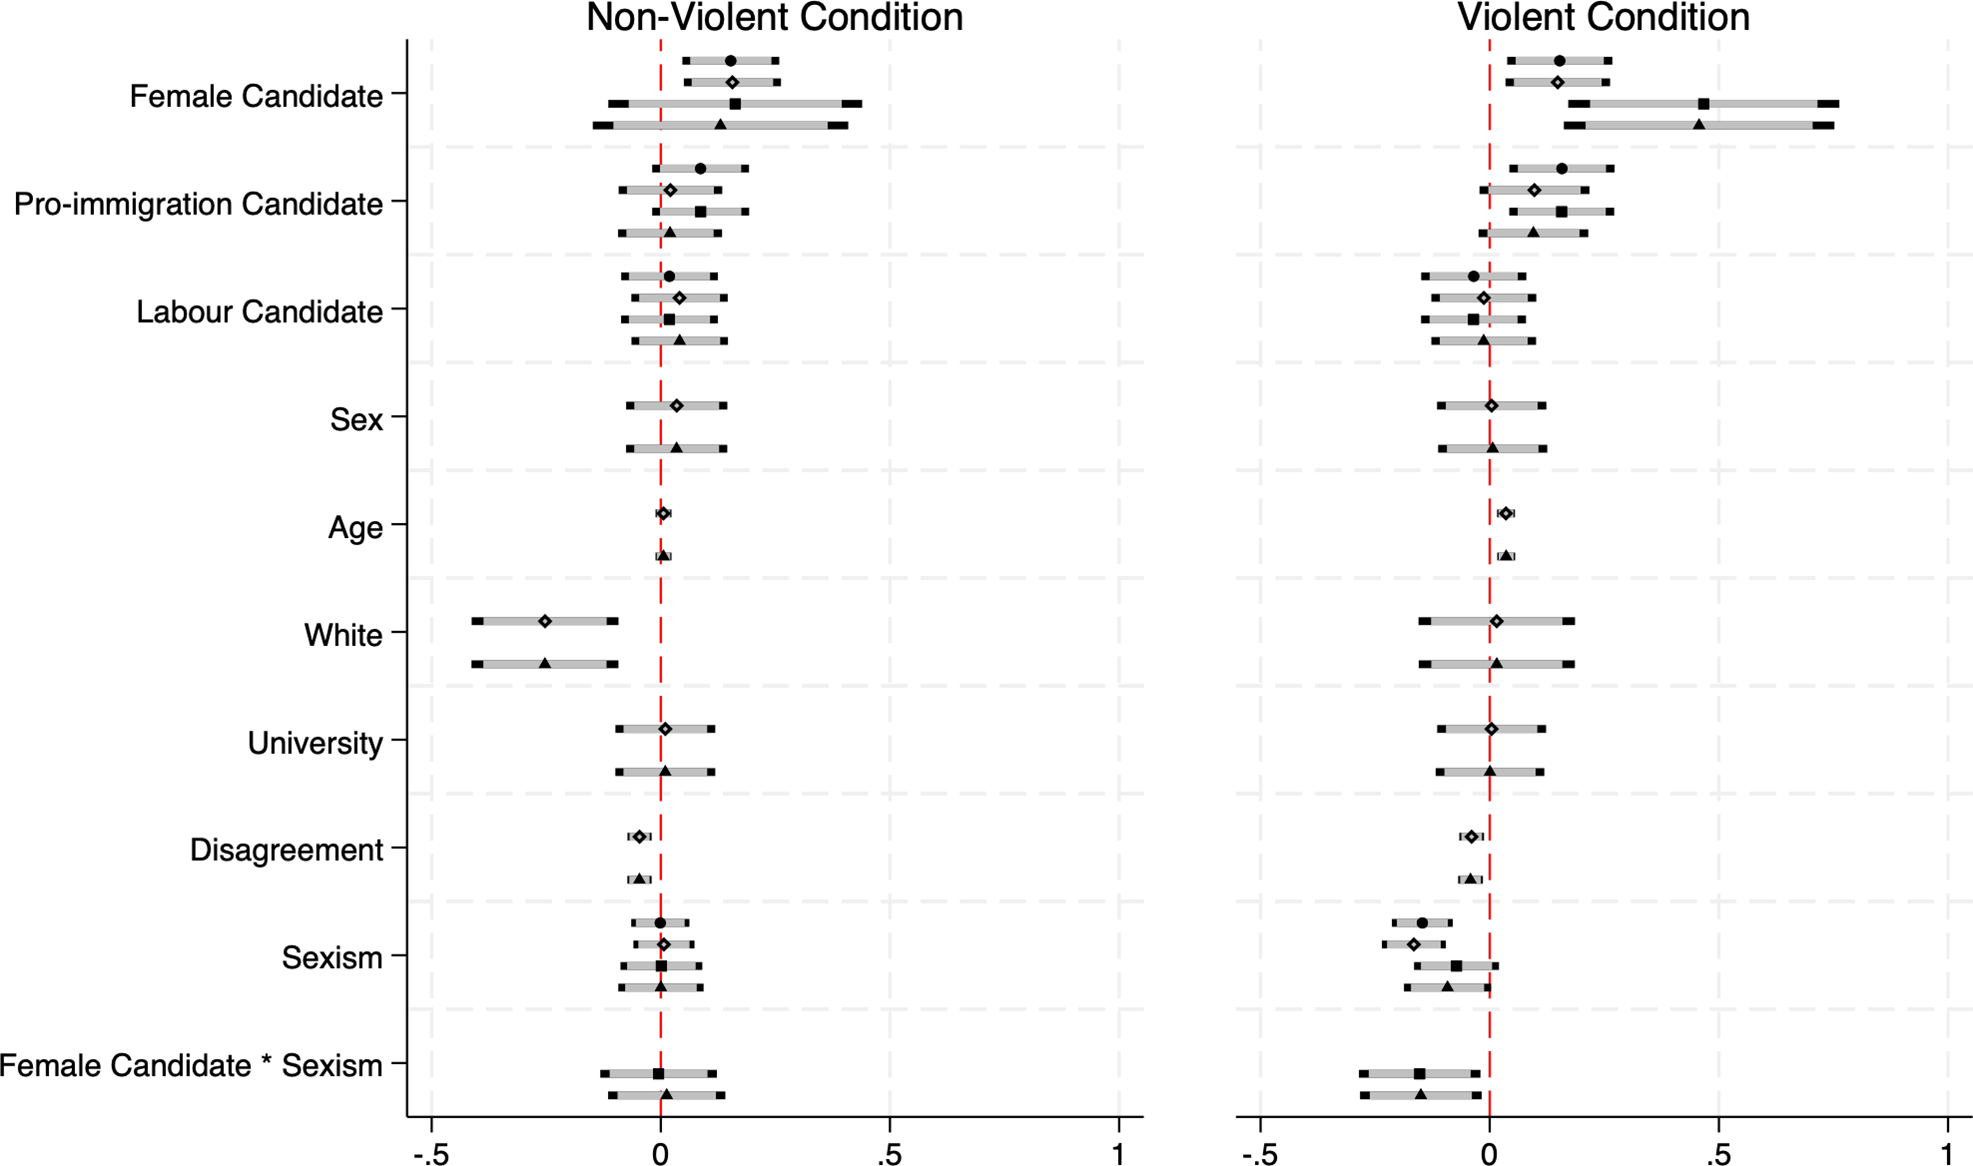
We report the results of models predicting Would Report in Figure 5 separated by whether the respondents were assigned to the treatment condition including an abusive but non-violent response (left) or the condition featuring a violent response (right).Footnote 11 In each plot, Model 1 (circles) includes only the treatment variables and Sexism; Model 2 (diamonds) adds key covariates, and Model 3 (squares) and Model 4 (triangles) include the interaction term (respectively excluding and including covariates). These results reveal that for both the non-violent and violent conditions, respondents who viewed abuse directed against a female candidate were significantly more likely to indicate that they would report that abuse relative to those who viewed the male candidate.Footnote 12 As with Håkansson (Reference Håkansson2024), this result is opposite to what we expected in our pre-registered hypothesis. This pattern is therefore consistent with both that work and other recent findings suggesting that the publics of liberal democracies are actually more sensitive to and somewhat less tolerant of abuse directed against women political figures (Eady and Rasmussen Reference Eady and Rasmussen2025; Petersen, Pedersen, and Thau Reference Petersen, Pedersen and Thau2025).
Effects on willingness to report abusive comments.
Note: Coefficient estimates (Model 1: circles/Model 2: diamonds/Model 3: squares/Model 4: triangles) and 95%/90% confidence intervals (darker/lighter shaded bars). Full results are presented in the Appendix (Table A6).

Figure 5. Long description
Two side-by-side graphs compare the effects of non-violent and violent conditions on willingness to report abusive comments. Panel A: Non-Violent Condition. Panel B: Violent Condition. Each panel features a series of horizontal error bars representing different candidate types and demographic factors. The horizontal axis ranges from -0.5 to 1, with a red vertical line at 0 indicating the neutral point. The vertical axis lists factors such as Female Candidate, Pro-immigration Candidate, Labour Candidate, Sex, Age, White, University, Disagreement, Sexism, and Female Candidate * Sexism. Each factor is represented by multiple error bars, indicating different data points or studies. The error bars show the range of effects, with some extending significantly to the right or left of the neutral line, indicating positive or negative effects on willingness to report abusive comments. The graphs highlight how different factors influence reporting behavior under non-violent and violent conditions.
As we discussed previously, our principal aim in this manuscript is to further probe this somewhat surprising relationship. We seek to explicitly assess how respondent sexism influences attitudes toward candidate abuse. To do so, we first examine the independent influence of Sexism. In the context of non-violent abuse toward a candidate, respondent sexism appears unrelated to decisions to report the response. However, as demonstrated by the negative and statistically significant coefficients in Models 1 and 2, more sexist respondents were comparatively less willing to report the violent threat than were their less sexist counterparts. More interestingly, we also find compelling evidence that respondent sexism moderates the previously noted effect of the female candidate condition on willingness to report the violent threat. Specifically, the results in Models 3 and 4 suggest that more sexist respondents were significantly less likely to report the threat when it was directed against a female candidate. Consequently, these results are consistent with the first set of hypotheses.
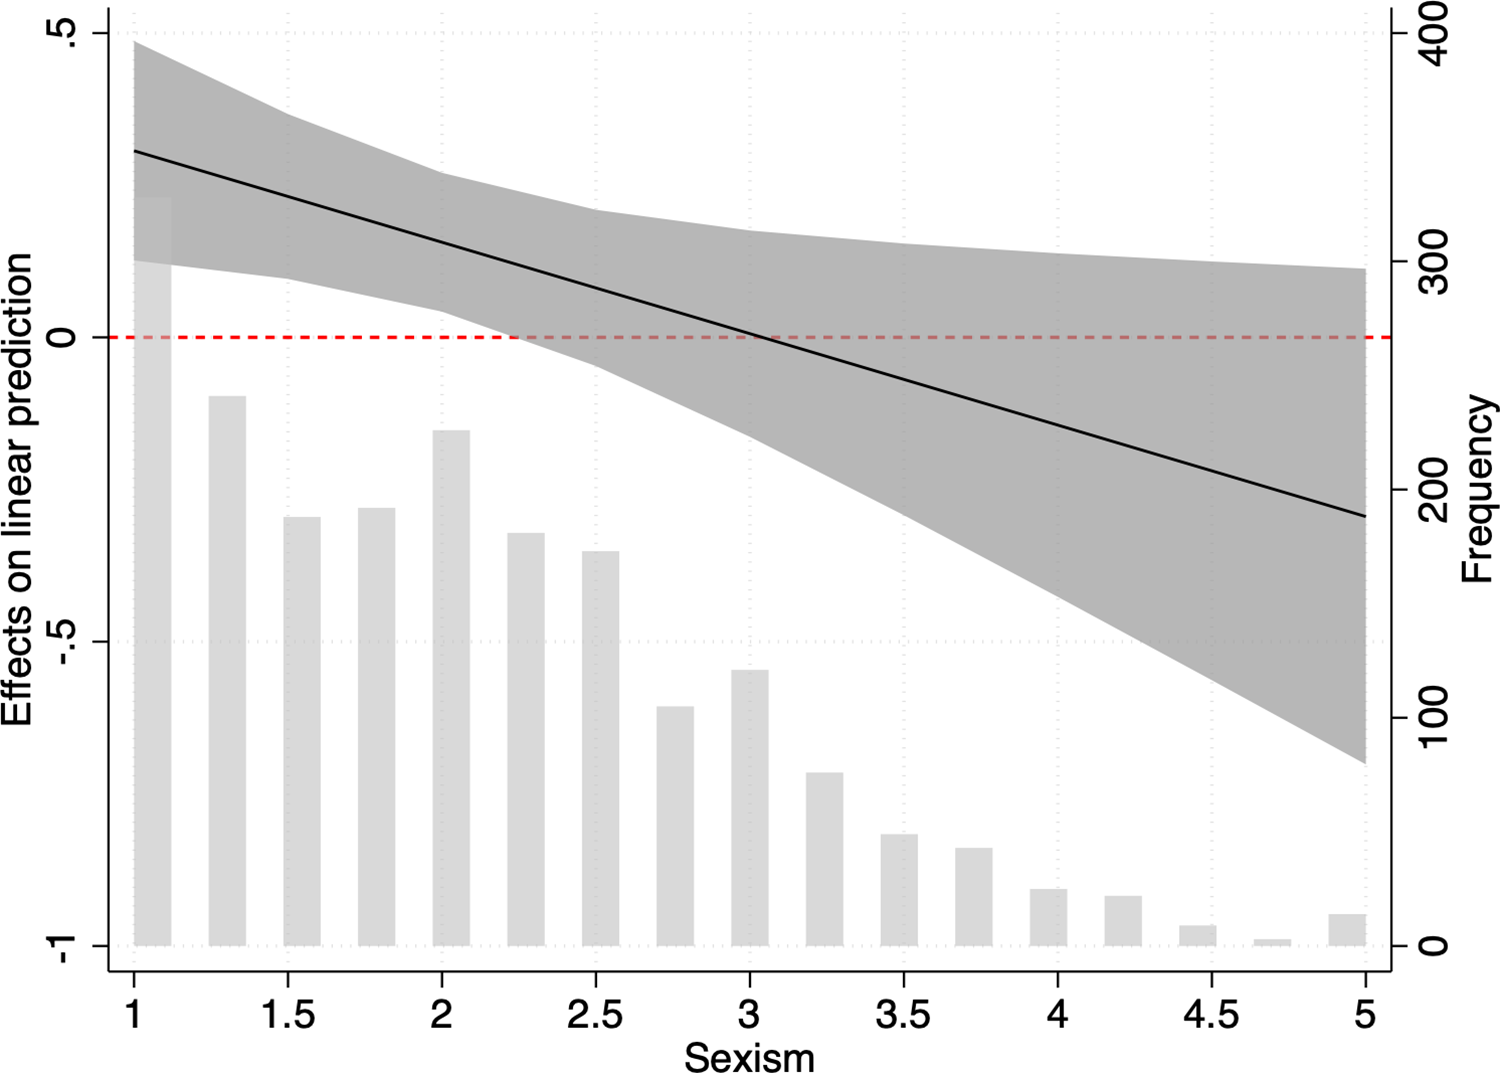
This relationship is illustrated in Figure 6. The marginal effects imply that among the least sexist respondents, violent threats against women candidates evoke a greater willingness to report the comment. However, this is not the case for those respondents who exhibit more sexist attitudes, for whom this treatment generally provokes a contrary (though statistically insignificant) response. Specifically, compared to the most sexist respondents, the least sexist are 0.5 points more willing to report violent threats when they are made against women candidates (relative to men). While there is considerable uncertainty around point estimates at the high end of the sexism scale, there is little uncertainty around the two broader implications of the results. The first is simply that gendered attitudes are an important part of the story when understanding public reactions to threats against men and women in politics. The second, rather more sinister, is that sexist attitudes are not activated by the lower-level abuse; rather, it is when violence is threatened that sexists and non-sexists diverge in their discrimination based on the sex of the candidate.
Sexism moderates the effect of candidate sex on willingness to report.
Note: Left vertical axis: estimated treatment effect of Female Candidate at specified levels of Sexism (solid line) and 95% confidence intervals (shading). Right vertical axis: distribution of Sexism scores for the sub-sample used in the analysis.

Priming effects on acceptability of abuse against candidates
As a next step, we examine the relationship between those attitudes and the Acceptability and Understandability of a range of abusive behaviors directed against politicians in the physical world. This permits us to test our conjecture that highlighting the presence of female candidates and the types of threats they receive could have knock-on consequences for respondents’ subsequent perceptions about abuse of politicians in general (rather than the specific target of the abuse in the vignette). We limit the empirical analysis presented below to the half of the sample (n = 998) who were exposed to the violent treatment. This is for two reasons. First, our earlier discussion of priming focused on the potential of the spillover effects of violence and vicarious effects of observing violence directed toward an outgroup. Second, Sexism was only significant – as either an independent predictor or moderator – in the context of the violent threat condition.Footnote 13
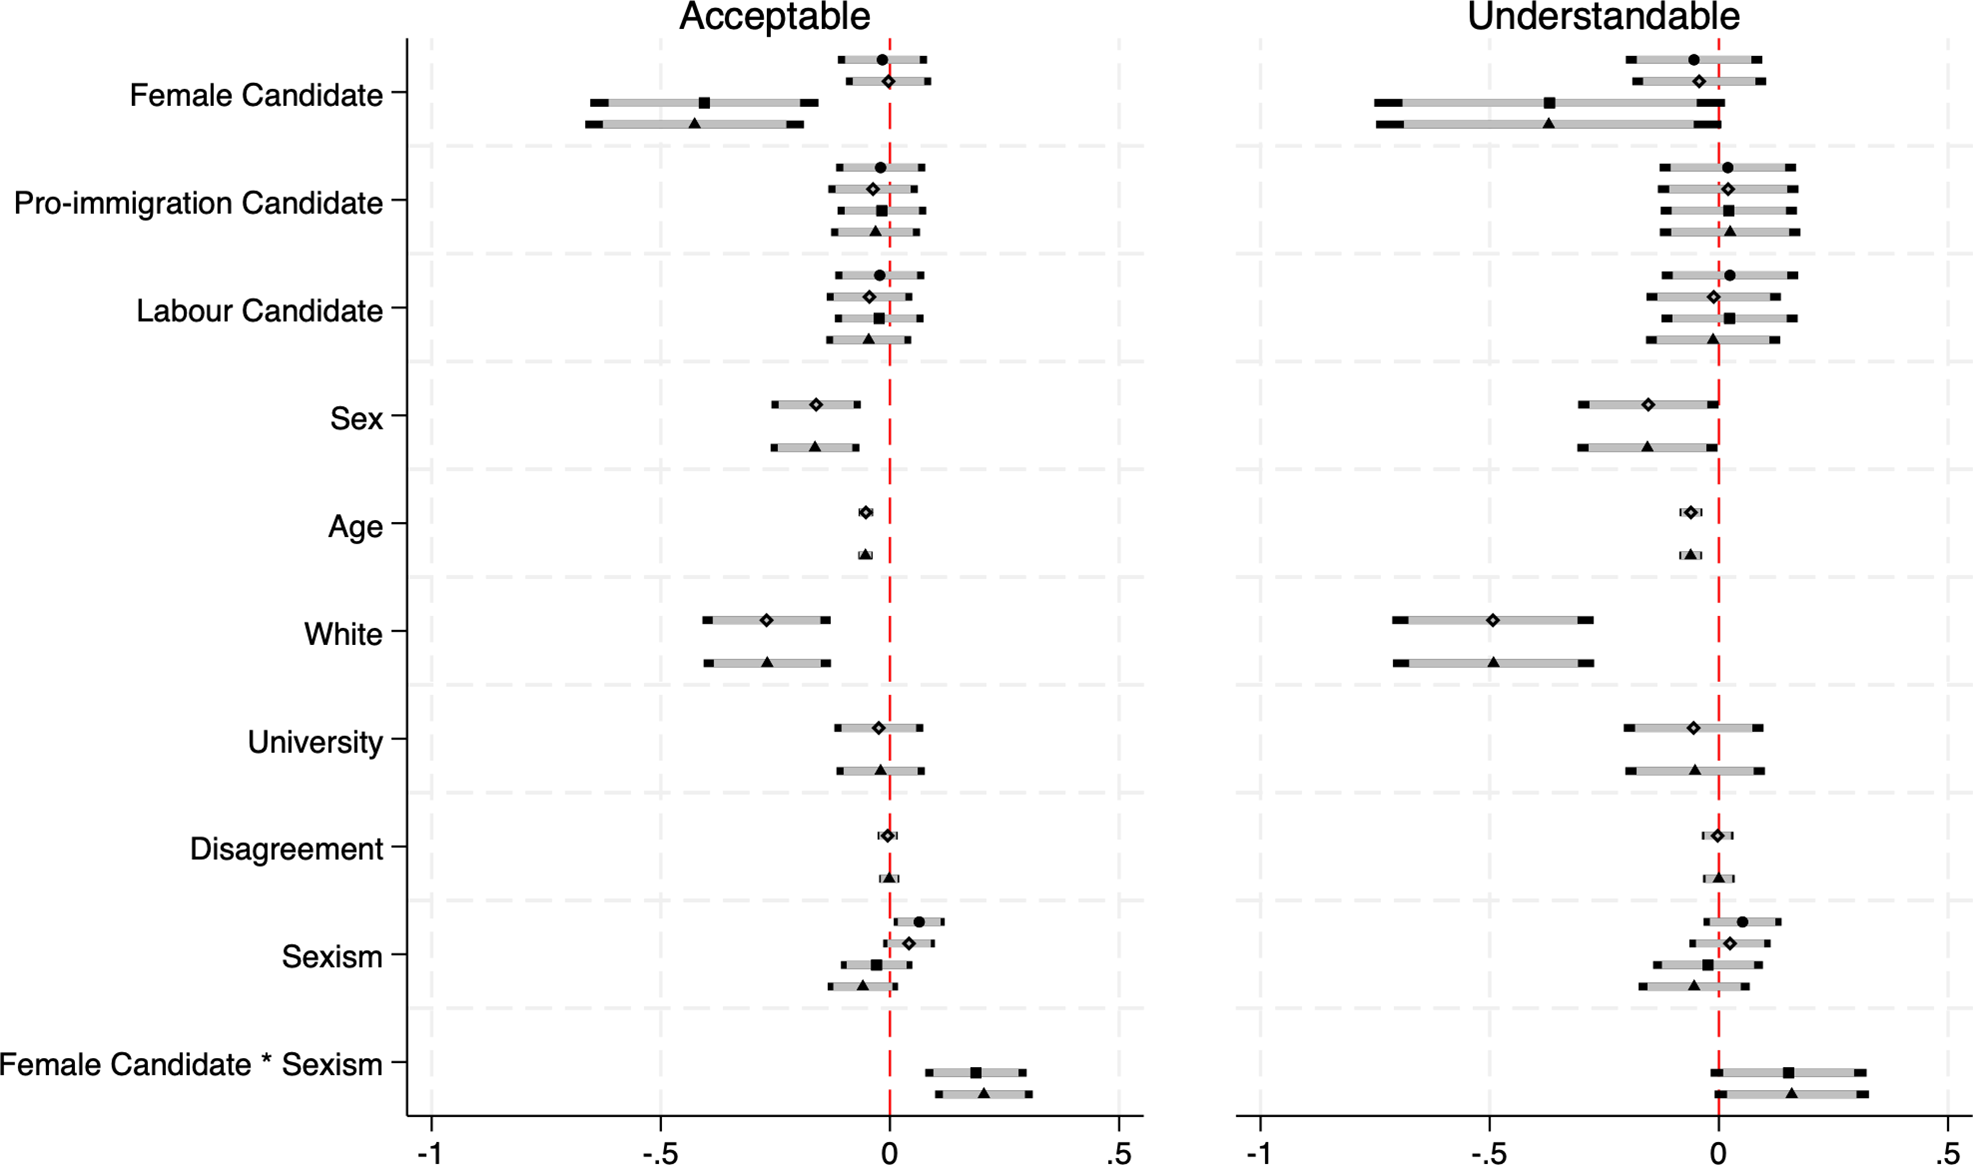
Figure 7 reports the results for the models predicting respondent beliefs about the Acceptability (left panel) and Understandability (right panel) of violence against politicians. First, the results show that respondent Sexism is positively associated with belief in the Acceptability of violence. This relationship is significant at the 95% level in the model excluding other confounders, but it becomes insignificant once we control for other respondent characteristics. This weakened significance appears to be driven particularly by the inclusion of Sex in the model, which also highlights the clear gender divide in respondents’ sexist attitudes.Footnote 14 This is also reflected in the significant coefficient for this variable across both models, which indicates that men (women) are more (less) accepting and understanding of violence toward politicians relative to women (men). With respect to Understandability, our measure of Sexism fails to achieve significance in any specification. Consequently, despite the significant relationship observed in the most parsimonious models evaluating acceptability, we ultimately do not find robust support for Hypothesis 3.
Effects on perceptions of threats and abuse against politicians.
Note: Coefficient estimates (Model 1: circles/Model 2: diamonds/Model 3: squares/Model 4: triangles) and 95%/90% confidence intervals (darker/lighter shaded bars). Full results are presented in the Appendix (Tables A7 and A8).

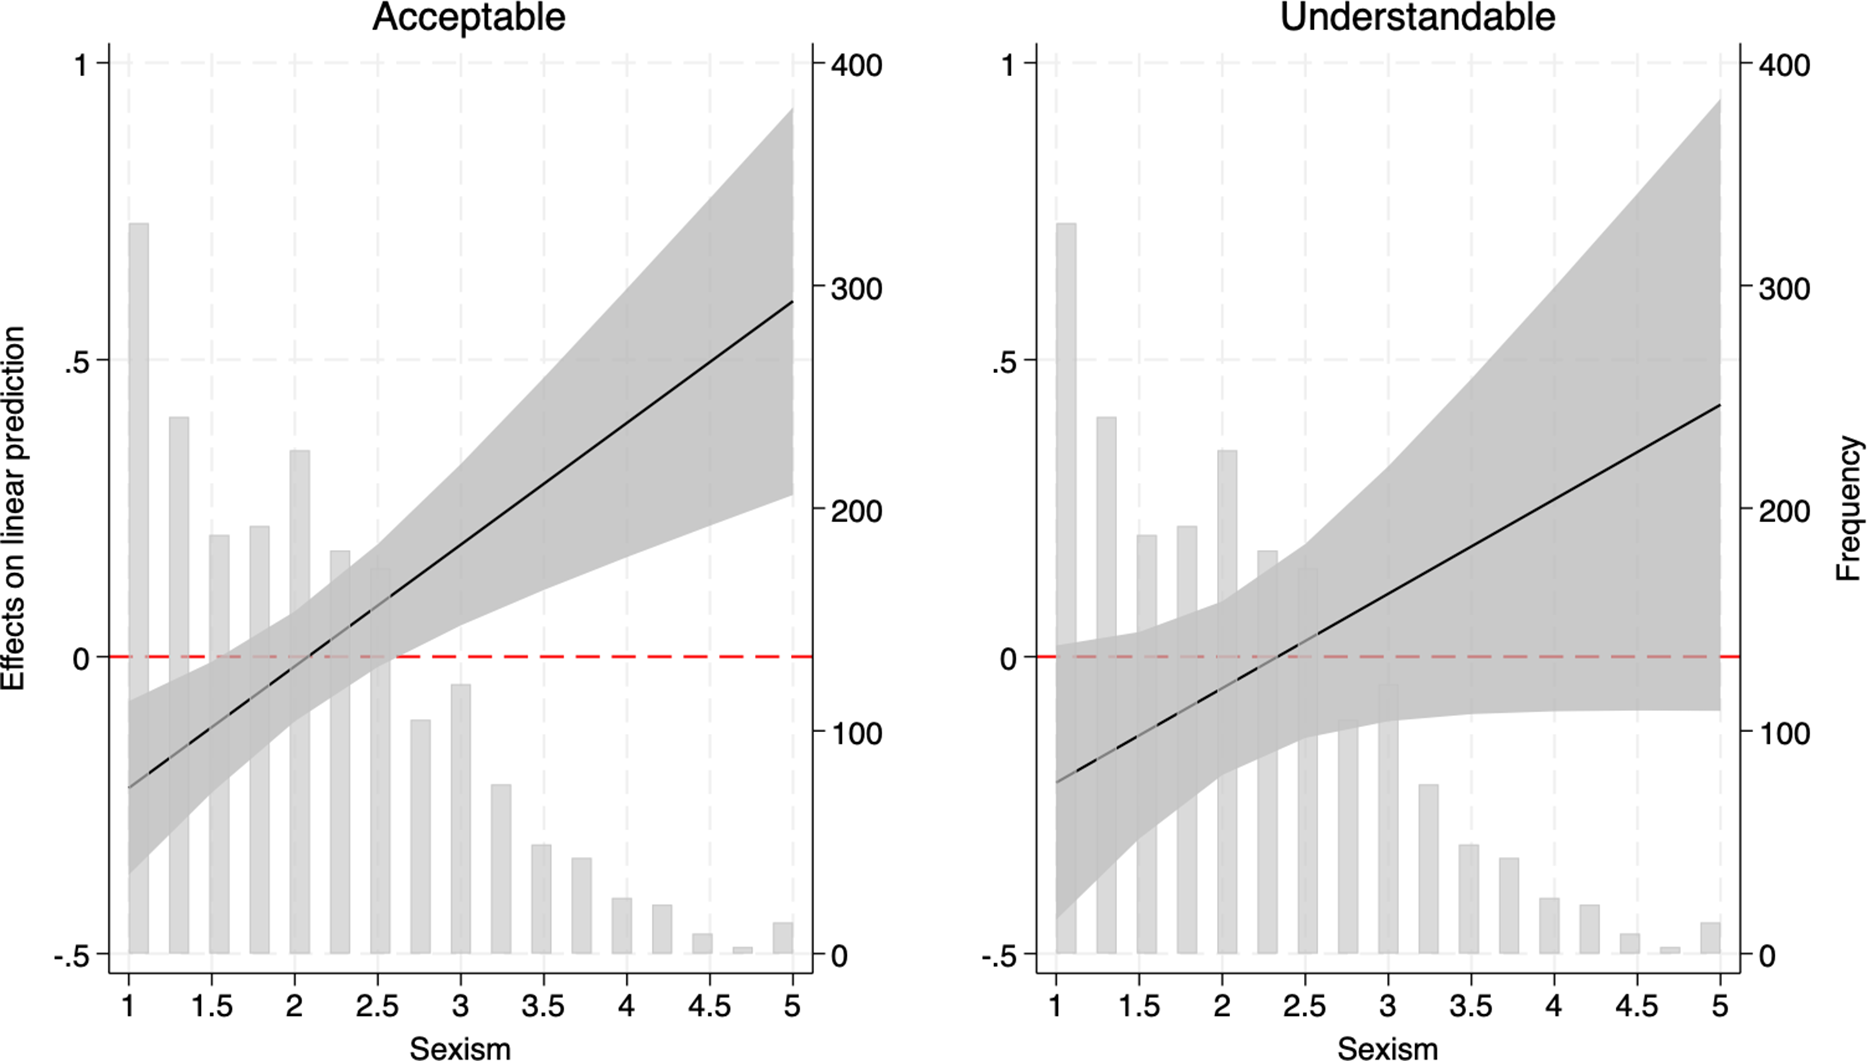
By contrast, we find empirical support for the conditional relationship proposed in Hypothesis 4. The interaction term composed of the sexism measure and the variable for the female treatment condition is significant in the Acceptability model and achieves marginal significance (p = 0.06) in the Understandability model. Thus, respondent sexism moderates the relationship between the sex of the politician the respondent observed in the earlier vignette and that respondent’s beliefs about the acceptability and understandability of threats against politicians. We report the marginal effects for the interaction terms in Figure 8. Among the least sexist respondents, the perceived acceptability of abuse was 0.25 points lower if they had been primed to think of a female politician being threatened with violence rather than a male politician receiving such a threat. However, among the most sexist, the corresponding gap was positive and around 0.6 points (left panel). The corresponding values for understandability are −0.21 and 0.42 (right panel). Given that the standard deviation of scores on this (skewed) scale was only 0.76, these effects are substantial. This is all the more noteworthy given the indirectness (bordering on irrelevance) of the treatment. The sex of the candidate was only subtly introduced into the earlier vignette, about which respondents had already answered several questions. Questions about the acceptability (and understandability) did not specifically reference the exchange in the vignette and were separated from it by multiple buffer items. It is therefore striking that specific elements of that exchange produced a durable priming influence on some respondents, particularly those who held more sexist attitudes.
Sexism moderates the effect of candidate sex on perceptions of threats and abuse against politicians.
Note: Estimated treatment effect at specified level of Sexism (solid line) and 95% confidence intervals (shading).

Figure 8. Long description
The image contains two side-by-side graphs, each combining a histogram and a line plot. The left graph is titled ‘Acceptable,’ and the right graph is titled ‘Understandable.’ Both graphs have the x-axis labeled ‘Sexism’ with a range from 1 to 5 and the left y-axis labeled ‘Effects on linear prediction’ with a range from -0.5 to 1. The right y-axis is labeled ‘Frequency’ with a range from 0 to 400. Each graph features a histogram showing the frequency distribution of sexism scores and a line plot showing the effects on linear prediction. The line plot includes a shaded area representing the confidence interval. In both graphs, as sexism increases, the effects on linear prediction also increase, indicating a positive relationship. The red dashed line at 0 on the y-axis serves as a reference point for the effects on linear prediction.
These results – particularly those from the acceptability model – largely support Hypothesis 4. The comparatively weaker results from the understandability model could perhaps be viewed as a failed robustness test. However, the size of the coefficients is similar across the two outcome variables (0.20 [acceptability] and 0.16 [understandability]), indicating that they are more similar to one another than either is to zero. This makes it more difficult to dismiss the influence of the interaction term on acceptability as simply a rogue result, partly assuaging doubts that gender and sexism do matter when it comes to the understandability of threats and harassment.
More interesting is the possibility that the difference in the results is reflective of the distinct concepts measured by the dependent variables. As discussed above, ‘acceptability’ is related to the perceived social desirability of the action, while ‘understandability’ taps appreciation for the motives responsible for it. Viewed in this way, our results may be particularly revealing. For Acceptability, this suggests that the viewing of violent threats against female politicians reduces social desirability bias among the most sexist respondents, leading them to believe that such behavior is more socially acceptable than they otherwise would and enabling them to express intolerance. Put otherwise, viewing examples of threatening behaviors toward disliked targets might serve to reveal the true beliefs of respondents by signaling that others also hold those views. At the same time, the results for Understandability would then imply a somewhat more muted influence on (sexist) respondents’ ability to empathize with the motives of the perpetrators of abuse. This could be because neither the experimental treatment nor the questions about abuse provided any information about the aggressor, thus severely limiting the opportunity for the respondent to reflect on the motives. In either case, this distinction perhaps warrants additional scrutiny in future work.
As a whole, these results underscore the profound influence that sexism exerts on public reactions to hostility and abuse against politicians. The mere reminder of women’s engagement in political leadership may trigger the most sexist individuals. Moreover, observing open hostility to these figures might, in turn, promote support for abuse and threats against politicians more broadly. Most troubling, the results suggest the possibility that the feelings of hostility and resentment provoked by images or representations of women in political roles could spill over from the digital world into real-world politics.
Discussion and conclusion
Even as female candidates have closed the electability gap with their male counterparts, women remain disproportionately likely to suffer abuse and harassment (most often by members of the public) in the course of campaigning and serving in elected office. This paradox poses an uncertain future for women’s political aspirations and participation when they are viewed by the public as being equally electable to men and yet subjected to greater abuse as their presence in electoral contests and offices grows. Determining the source(s) of public tolerance of abuse and harassment, which is often intended to silence the voices of those being targeted, thus becomes important in contextualizing the gender inequality of targeting.
Our results strongly suggest that sexism plays a key role in determining observers’ tolerance for abuse and harassment and demonstrate that sexism is associated with greater tolerance for online violent threats targeting candidates, especially in the case of female candidates. This complements recent studies showing that the public is generally more sensitive to online targeting of female candidates (Eady and Rasmussen Reference Eady and Rasmussen2025; Petersen, Pedersen, and Thau Reference Petersen, Pedersen and Thau2025). However, we extend this observation to examine attitudes toward an abusive threat that is itself ungendered and, more importantly, to explicitly examine the role of respondent sexism in shaping attitudes about abuse and threats against politicians. Beyond this association in online space, we also show that priming a sexist individual by exposing them to a vignette about a female candidate increases their tolerance for other forms of politician abuse and harassment, both online and in person. This implies that sexism works in multiple ways to influence tolerance of abuse, through direct acceptance when the target of abuse is female and by indirectly triggering acceptance of more general abuse with the mere reminder of women’s presence in politics.
Our findings expand upon recent work wherein psychological rather than political factors have been shown to drive tolerance for violent behavior and political violence among the general public. Yet, the role of sexism is often overlooked despite being significant to an improved understanding of a world where the political space occupied by women is increasing alongside gains by political parties and leaders who push gender inegalitarian views and policies. While the literature on political behavior has traditionally observed a gender gap in voting for the Far Right and/or populists who often pursue democratic rollback for their own political gains, our findings highlight that sexism and gender-based distinctions can work to undermine democracy in a more fundamental way through fostering tolerance of behaviors that have been shown to drive women out of political life. Identifying the role of sexism helps to solve at least part of the paradox that audiences generally appear more sensitive to threats against women candidates, and yet, women receive a disproportionate amount of the abuse directed toward politicians. Our results suggest that such abuse is perpetrated by a small, yet aggressive, group who hold and possess sexist dispositions.
While we have probed sexism’s role in determining respondents’ tolerance for abuse and harassment of political candidates and politicians, our study has a few limitations that future work could address. First, given that our study represented an exploratory effort to understand the divergence between our pre-registered hypotheses and our initial empirical results, scholars may wish to examine the robustness of these results using independent data. Second, while our measure of sexism includes aspects of both hostile sexism and generalized gender inegalitarianism, we do not account for indicators of benevolent sexism that might be driving some of the ‘protective’ inclinations towards female candidates to which our results allude. Although such measures have previously been shown to have limited effect in studies of political outcomes (e.g., Schaffner Reference Schaffner2022), in this particular context such indicators may be able to help distinguish specific mechanisms in future work on the sources of public tolerance of candidate abuse and harassment. Third, our study was able to take advantage of an actual within-campaign moment in British politics, providing a heightened salience to the topic. Yet, this comes with a potential cost to variation in our outcome measure. Ongoing news coverage of the election, where abuse and harassment of politicians were routinely discussed and heavily scrutinized, potentially worsened social desirability bias. We therefore potentially observed less variation in our outcome measure than would occur in a non-election period. It is possible that conducting a similar study in a non-election period would show greater variation in the dependent variables that would allow for exploration of a more nuanced relationship with the predictors; this would come with a trade-off in political salience and external validity.
Supplementary material
The supplementary material for this article can be found at https://doi.org/10.1017/S1475676526101455.
Data availability statement
The data that support the findings of this study are openly available in the Open Science Framework at https://osf.io/x9nkj.
Funding statement
Not applicable.
Competing interests
The author(s) declare none.
Ethical standards
This project was approved by the University of York Economics, Law, Management, Politics, and Sociology (ELMPS) Ethics Committee on 26 March 2024 (ELMPS 882324).



 Open access

