


While there is widespread agreement in individual differences research about the existence of g as a major psychometric variable underlying cognitive aptitude (Warne, Reference Warne2020), significant debates persist regarding the nature of this factor. One key debate concerns whether phenotypic g is best understood as a reflective construct — representing a latent causal entity that drives correlations among subtests — or as a formative construct, arising from genetic and environmental factors that generate correlations among fundamental cognitive abilities (e.g., via pleiotropy). From the formative perspective, these underlying genetic and environmental influences shape variation in subtests, which collectively give rise to the observed phenotypic g, which itself is not a causal entity.
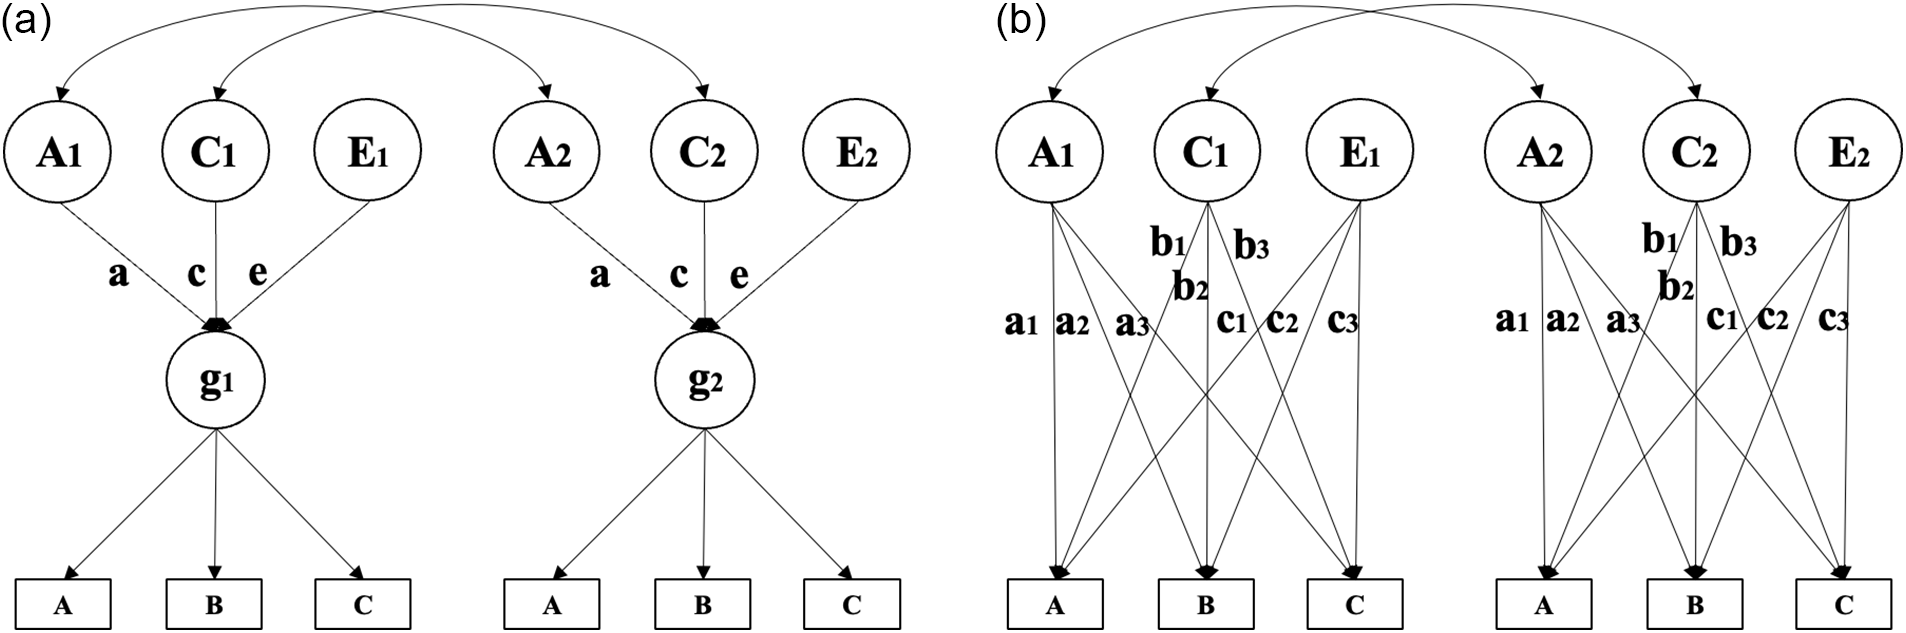
Up until recently reflective versus formative research on g has centered on the use of classical behavioral genetic models, utilizing twins (e.g., Bollen & Pearl, Reference Bollen, Pearl and Morgan2013; Borsboom et al., Reference Borsboom, Mellenbergh and van Heerden2003; Bruins et al., Reference Bruins, Franic, Borsboom, Dolan, Boomsma and Hoyle2023; Franić et al., Reference Franić, Dolan, Borsboom, Hudziak, van Beijsterveldt and Boomsma2013; Jonas & Markon, Reference Jonas and Markon2016). The theoretical framework proposed by these researchers typically involves contrasting models in which common and independent pathways are fitted to the relevant data as in the examples shown in Figure 1.
Behavior genetic path models illustrating (a) a common pathway model (left) and (b) an independent pathways model (right). Image modified from Franić (Reference Franić2014, p. 16).

In the first path diagram (Figure 1a), behavioral genetic variance components (for twins 1 and 2) act directly on g, which reflects these genetic and environmental contributions by mediating their effects on the lower level manifest variables (subtests A, B, and C). In the second path diagram (Figure 1b), the behavioral genetic variance components act directly on the manifest variables, with g instead emerging as a formative construct that summarizes the influence of these variance components on the manifest variables.
Bruins et al. (Reference Bruins, Franic, Borsboom, Dolan, Boomsma and Hoyle2023) highlight the utility of comparing structural models for addressing methodological questions about the conceptual status of latent variables. These authors also note that ‘ideally, if the common factor obtained in a phenotypic analysis represents a substantive unitary construct that acts as a common cause with respect to its indicators … one expects the genetic and environmental influences on the indicators of the construct to be fully mediated by the phenotypic latent variable’ (p. 658). Bruins et al. go on to note:
… if the independent pathway fits better than the corresponding common pathway model, we may conclude that the genetic and environmental influences on the indicators in the model are not fully mediated by the phenotypic latent variable (i.e., the psychometric factor). This may shift the theoretical interpretation from one in which the latent variable acts as a common cause of the indicators … to one in which it merely describes common variance among the indicators. (p. 658)
Only a couple of studies have implemented these model comparison procedures using relevant behavior genetic data. In the first such study, Shikishima et al. (Reference Shikishima, Hiraishi, Yamagata, Sugimoto, Takemura, Ozaki, Okada, Toda and Ando2009) used a sample of 448 young adult Japanese twins to estimate both common and independent pathway models. These researchers found that the former better fit the data, indicating the presence of a phenotypic g that was reflective of genetic and environmental factors. Panizzon et al. (Reference Panizzon, Vuoksimaa, Spoon, Jacobson, Lyons, Franz, Xian, Vasilopoulos and Kremen2014) also found, using the Vietnam Era Twin Study of Aging, strong evidence that g is reflective with a common pathway model fitting the data best, and with most of the additive genetic variance being concentrated at the level of the superordinate g factor in their Carroll-Horn-Cattell-type hierarchical model (the path coefficient was .93). Some group-factor and subtest-specific independent contributions were also noted, but these were considerably weaker than the direct effects noted at the level of g. In another study, Bates (Reference Bates2025) investigated the heritability of rationality. It was found that high IQ accounts for rationality. A common pathway model involving a three-factor measure of general ability was found to outperform an independent pathway model, suggesting the presence of a reflective general ability factor in these data (Bates, personal communication, Reference Bates2025).
An important study by de la Fuente et al. (Reference de la Fuente, Davies, Grotzinger, Tucker-Drob and Deary2021), using genomic structural equation models (SEMs), additionally found that specific genetic variants are correlated across traits, consistent with a reflective model in which phenotypic g is shaped by common genetic contributions. However, the authors also found that narrow abilities retain heritability even after controlling for g, indicating that subtest-specific variation is influenced by genetic factors independent of g, which could also be consistent with a formative perspective, where g emerges from the interplay of shared and specific influences.
The Present Study
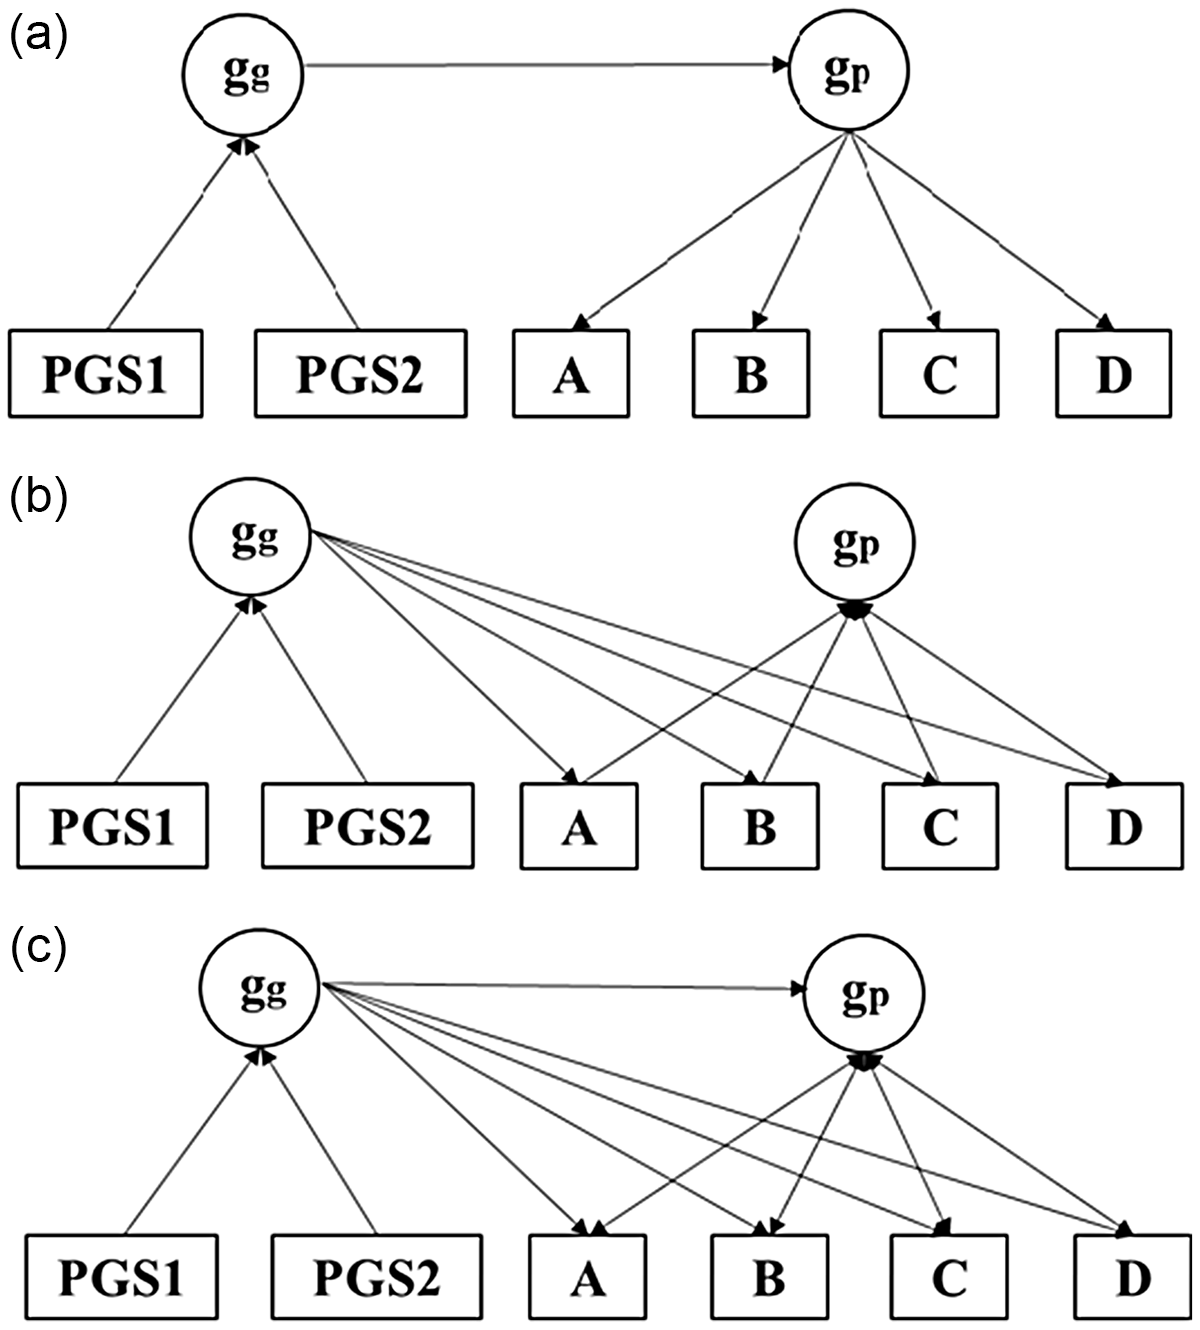
Confirmatory Factor Analysis (CFA) will be used along with genetic gs composed of multiple correlated polygenic scores (PGSs)Footnote 1 to test common pathway, independent pathways, and merged models. These three-way model comparisons will be estimated using data from four large publicly available and genetically informed databases, three of which are sourced from the US and a fourth from the UK. The structures of the three models are illustrated in Figure 2.
a) Common pathway model: phenotypic g (gp) completely mediates the effect of genetic g (gg) on its four abilities (A through D). b) Independent pathways model: gg directly affects the abilities independent of gp, c) Merged model: g g has both g p-mediated and independent effects on the four abilities.

To the best of our knowledge, this is the first time that model comparisons of this sort have been directly conducted using PGSs (all known prior comparative efforts involved the use of structural biometric models employing twins). These studies suggest that phenotypic g is strongly reflective of behaviour genetic variance components. In Panizzon et al. (Reference Panizzon, Vuoksimaa, Spoon, Jacobson, Lyons, Franz, Xian, Vasilopoulos and Kremen2014) some weaker indications of independent influences of additive and environmental variances sources were also found (at the level of distinct effects on group factors and subtests). It is predicted therefore that the best fitting models in the case of these analyses will be a common pathway model, consistent with a simple reflective interpretation of g.
Nonetheless, in line with the results of Panizzon et al. (Reference Panizzon, Vuoksimaa, Spoon, Jacobson, Lyons, Franz, Xian, Vasilopoulos and Kremen2014) and de la Fuente et al. (Reference de la Fuente, Davies, Grotzinger, Tucker-Drob and Deary2021) we anticipate that genetic g may also have influences on subtests independent of phenotypic g.
Methods
Data Sources
The data used in this study were sourced from four, large, genetically informed and publicly accessible datasets. These are described below:
1. The English Longitudinal Study of Aging (ELSA). This prospective longitudinal cohort study involves a large sample of adults, who are aged ≥50 years and who completed a previous survey (the Health Survey for England, 1998–2001) (Banks et al., Reference Banks, David, Breedvelt, Coughlin, Crawford, Marmot, Nazroo, Oldfield, Steel, Steptoe, Wood and Zaninotto2024). Participants are reinterviewed on a biennial basis, with the most recent (11th) wave of data collection having been completed in 2023. ELSA is modeled on the US Health and Retirement Survey (HRS), allowing meaningful comparisons among participants sourced from both countries. Subjects were genotyped if they met certain health requirements. Genotyping and quality control is described by Ajnakina and Steptoe (Reference Ajnakina and Steptoe2022). Several educational attainment and cognitive ability PGSs were available, from which three were chosen for the estimation of genetic g. The sample-specific characteristics of these PGSs are described in full in Ajnakina and Steptoe (Reference Ajnakina and Steptoe2022, pp. 17–18 and pp. 73–75). Information on how to access ELSA can be found here: https://www.elsa-project.ac.uk/accessing-elsa-data.
2. Midlife in the US Genetics (MIDUS G). MIDUS is a longitudinal study that tracks a variety of traits throughout the life course. MIDUS G involved the genotyping of a subsample of individuals from two previous waves of data collection, MIDUS 2, and MIDUS Refresher. Full details are given on genotyping, quality control, and PGS estimation here: https://midus-study.github.io/public-documentation/Genetics/DNA/MRM2/M2MR_P6_PolygenicRiskScores_Documentation_20211129.pdf. Information on how to access MIDUS G can be found here: https://www.midus.wisc.edu/data/index.php
3. The Health and Retirement Survey (HRS). HRS is a biennial longitudinal broadly representative survey of the older US population organized by the University of Michigan (around 20,000 individuals born in the decades spanning the 1890s to 1950s). It tracks a large number of both phenotypes and genotypes related to health and cognition. Full information on genetic data collection, genotyping, quality control, and PGS construction can be found in Ware et al. (Reference Ware, Hornish, Noltye and Faul2024). Details on the sample-specific properties of IQ PGS can be found on pages 15–16, and for the EA3 PGS, these can be found on page 41.
4. The Harmonised Cognitive Assessment Protocol (HCAP). HCAP is a more intensive cognitive screen which involved the random selection of 5500 individuals sourced from the 2016 US HRS panel, and who were all aged ≥65 years (Gross et al., Reference Gross, Li, Briceño, Arce Rentería, Jones, Langa, Manly, Nichols, Weir, Wong, Berkman, Lee and Kobayashi2023). This cohort possesses data on a much larger number of cognitive tests than do other HRS cohorts. The purpose of this study is to identify with greater precision the sorts of age-related cognitive decline that best predicts dementia. As with HRS, details on the two cognitive PGSs employed can be found in Ware et al. (Reference Ware, Hornish, Noltye and Faul2024). Also, as with HRS, information on how to access these data can be found at https://hrs.isr.umich.edu/about.
Variables
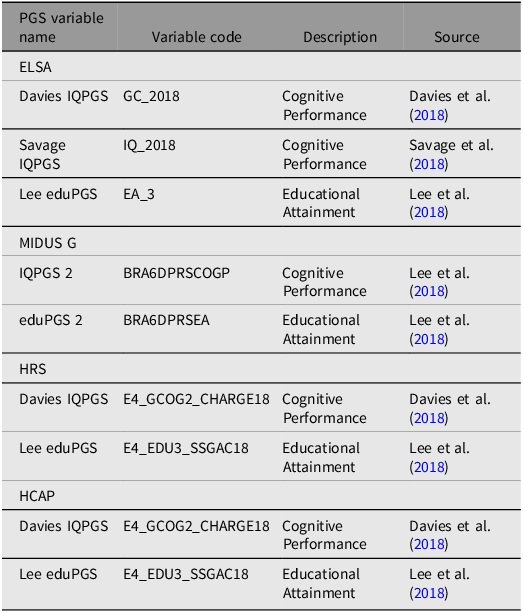
All of the genetic variables used in the construction of genetic g in the current study are detailed in Table 1.
The characteristics the PGSs for educational attainment and cognitive performance used in the construction of genetic gs for each of the four datasets, along with variable codes and descriptions of target phenotypes

Note: PGSs, polygenic scores; ELSA, English Longitudinal Study of Aging; MIDUS G, Midlife in the US Genetics; HRS, Health and Retirement Survey; HCAP, Harmonised Cognitive Assessment Protocol.
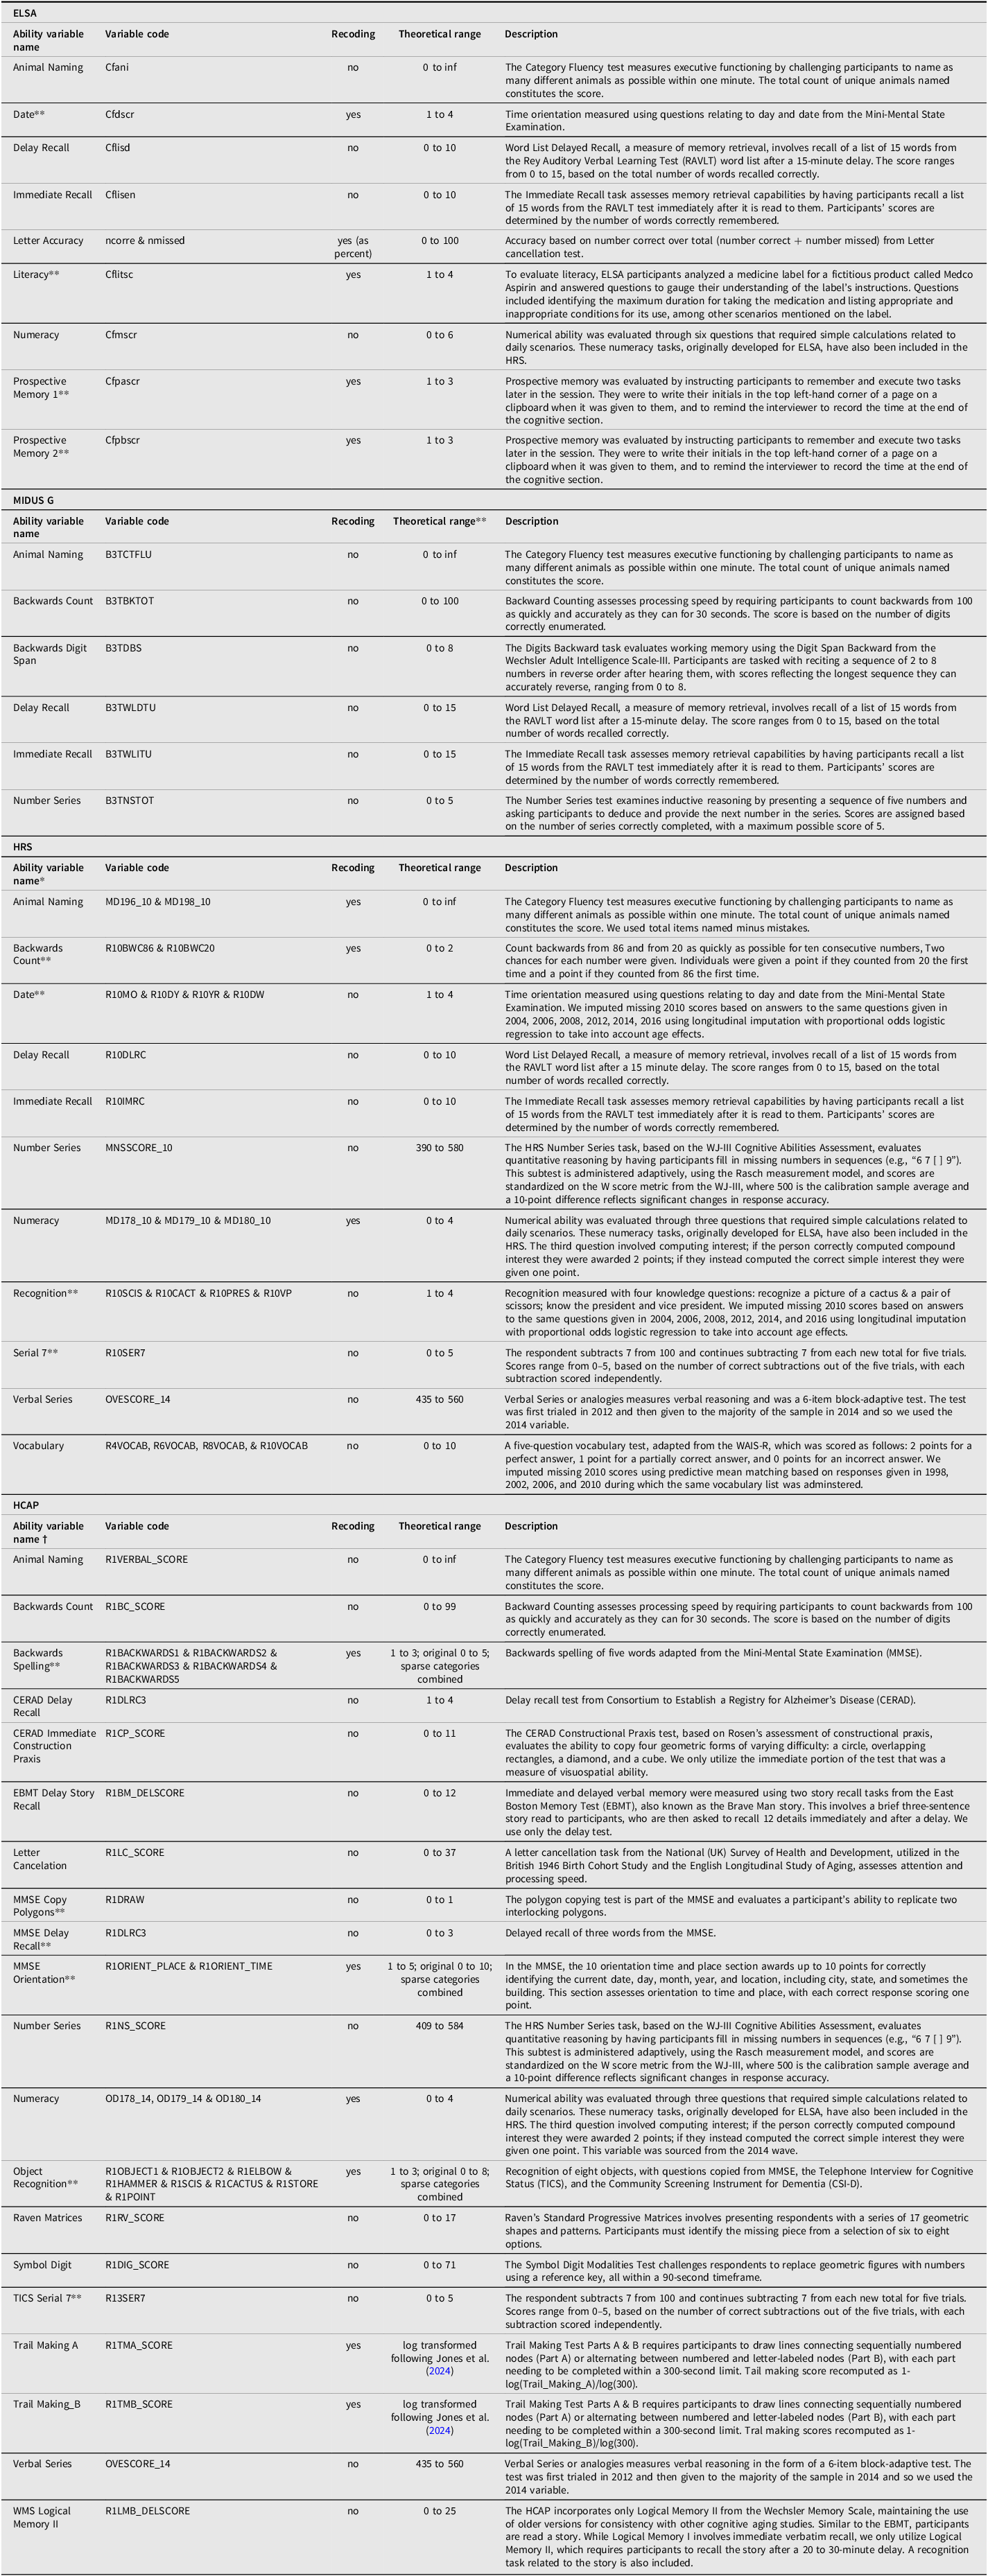
Table 2 contains detailed information on the subtests used in each of the four datasets to construct phenotypic g.
The characteristics of the cognitive scales used to construct phenotypic g in each of the four studies for educational attainment and cognitive performance for each of the four datasets, along with variable codes, an indication as to whether recoding was used, theoretical range, and detailed descriptions of test content
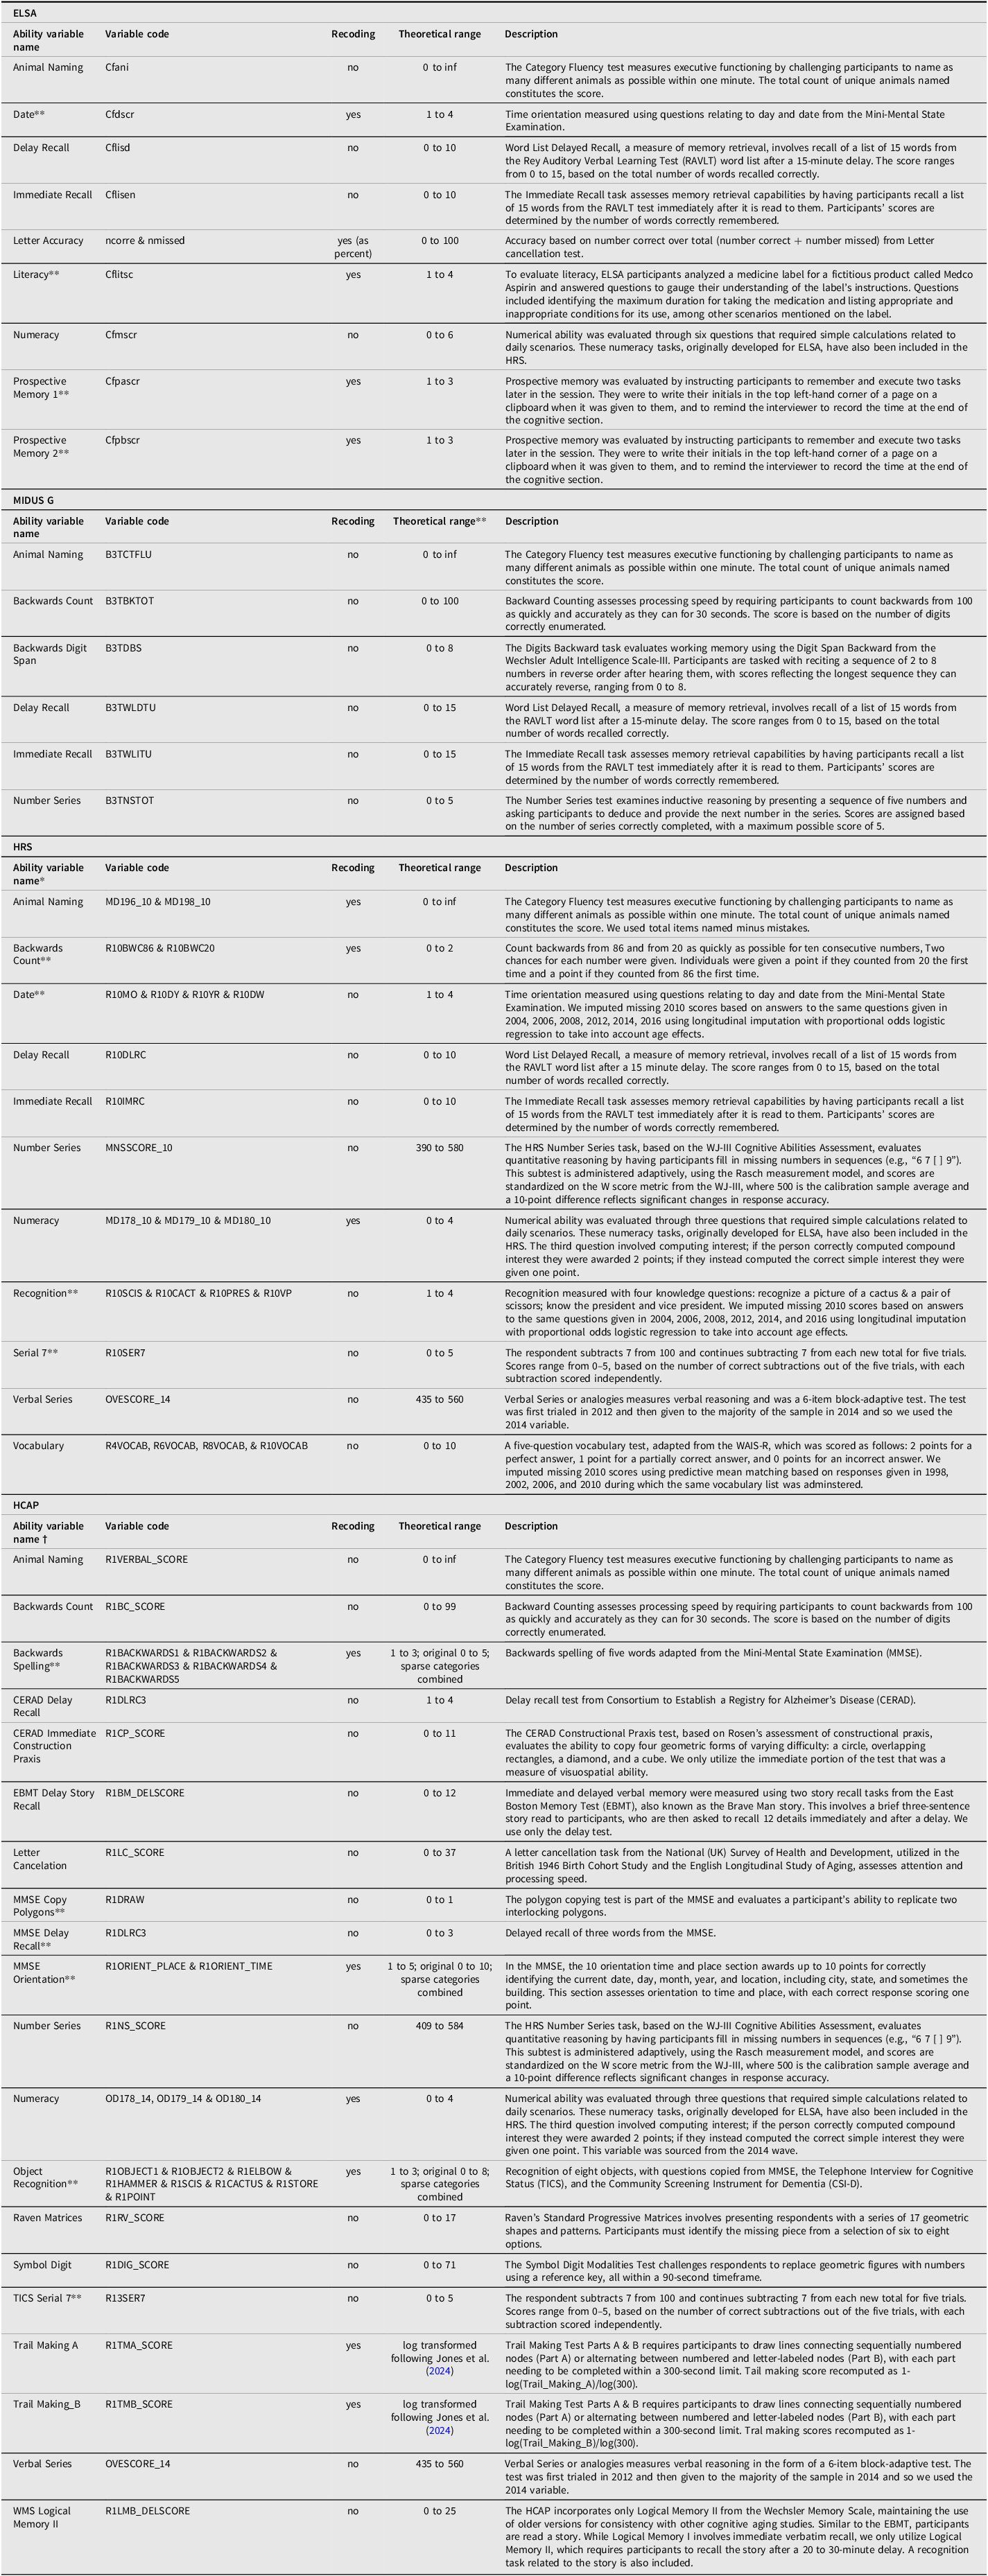
Note: *We picked 2010 as our base wave since the largest number of people had the largest number of tests for this wave. We used longitudinal imputation (based on previous scores) for only 3 variables. **Variable treated as ordered categorical in the SEM models. †We borrowed two tests for 2014, everything else was in HCAP.
General Sample Preprocessing
All data cleaning and analyses were conducted in R (4.3.3; R Core Team, 2024). For all samples, we subset cases to non-Hispanic Whites at or below the age of 90 who had PGSs. Specific handling of cases varied across datasets due to their unique attributes and requirements:
ELSA Dataset. We removed cases with neurological diseases or stroke (based on the variables: hedim01 through hedim07 and hedib01 through hedib10). Next, since relatively few cases were lost when doing so, we subset to the 5349 cases that had no missing age, sex, or subtest data. Finally, 53 multivariate outliers, defined in terms of Mahalanobis distance, calculated with the mahalanobis function in the base-R stats package (R Core Team, 2024), were removed, leading to a final analytic sample of N = 5296. Owing to both limited number of categories and right censoring we treated four variables (Date, Literacy, Prospective Memory 1, and Prospective Memory 2) as ordered categorical using the ordered command in the lavaan package. Doing so implements the diagonally weighted least squares (DWLS) estimator. Within the SEM model, effects of age, age2, and sex were regressed out of subtests. To control for population stratification, as recommended (e.g., Ware et al., Reference Ware, Hornish, Noltye and Faul2024), the effects of the 10 ancestral principal components provided (PCs, variable codes: pc1 to pc10) were also regressed out of the PGS scores. The mean age of this sample was 63.04 (SD = 9.25, range = 31 to 90). Owing to the large age range, and given the large sample available, for a robustness analyses, we additionally subset to the 1826 individuals aged 60 to 70 and reran the analyses.
MIDUS G Dataset. We excluded cases with neurological diseases, as identified by the variables B1SA11Y and BACAS11Y, resulting in 676 cases. We then imputed missing data for the Delay Recall subtest for 18 cases using the norm.predict function from the mice package (Zhang, Reference Zhang2016). After this imputation, there were no missing age, sex, or subtest data. One multivariate outlier, as defined previously, was removed, leading to a final analytic sample of N = 675. All variables were normally distributed, so none were treated as ordered categorical and the ML estimator was used. Within the SEM model, effects of age, age2, and sex were regressed out of subtests. To control for population stratification, the effects of the five ancestral principal components provided (PCs, variable codes: BRA6DPC1 to BRA6DPC5) were also regressed out of the PGS scores. The mean age of this sample was 55.44 (SD = 11.59, range = 34 to 84).
HRS Dataset. In the HRS dataset, we excluded cases that were included in the HCAP analysis, discussed subsequently, to prevent overlap, and we also removed cases where the probability of having dementia exceeded 50% in 2010. Hudomiet et al. (Reference Hudomiet, Hurd and Rohwedder2022) computed this variable, in which the probability of dementia was determined by longitudinal changes in cognitive scores, and made it publicly available. We established 2010 as the base year for our analysis, subsetting to individuals with valid scores for Delay Recall and Immediate Recall from that year; however, data for the Verbal Series were sourced from 2014. A significant portion of the data from the 2010 round were missing for three subtests — Date, Recognition, and Vocabulary — totalling 25% missing data. For Date and Recognition, we implemented longitudinal imputation using LMM-based FCS (FCS-2L) via the mice package, spanning waves from 2004 to 2016, and including sex and birth year as covariates. This resulted in 7948 cases (in the final analytic sample) having valid scores for both subtests. For Vocabulary, we employed predictive mean matching (PMM) using responses from the 1998, 2002, 2006, and 2010 waves, where the same set of words were used, and including age as a covariate. PMM selects the observed value that is closest to the predicted value as an imputed value. After this imputation, we had 6746 cases with valid vocabulary scores (in the final analytic sample). We removed 34 multivariate outliers, as defined previously, leaving a final analytic sample size of N = 8309 cases. In addition to Date, Recognition, and Vocabulary, the following variables had missing data (out of 8309): Animal Naming (16), Numeracy (82), Number Series (309), and Verbal Series (1562). To handle missingness, we used the pairwise subcommand in Lavaan’s cfa command (Rosseel, Reference Rosseel2012). Owing to both limited number of categories and right censoring, we treated Backwards Count, Date, Recognition, and Serial 7 as ordered categorical variables. We controlled for the effects of age, age2, and sex on all subtests within the SEM model. To control for population stratification the effects of the 10 ancestral principal components provided (variable codes: PC15A to PC610E) were also regressed out of the PGS scores. The mean age of this sample was 66.62 (SD = 11.85, range = 30 to 90). Owing to the large age range, for a robustness analysis, we additionally subset to the 2167 individual aged 60 to 70 in 2010 and reran the analyses.
HCAP Dataset. We removed cases where the probability of having dementia was greater than 50% in the 2016 wave. We also removed 8 multivariate outliers, as defined previously, leaving a final analytic sample size of N = 1878 cases. The following variables had missing data (out of 1878): Backwards Spelling (60), MMSE Copy Polygons (11), MMSE Delay Recall (16), Numeracy (12), Object Recognition (4), TICS Serial 7 (9), Trail Making A (9), Trail Making B (124), Verbal Series (12). To handle missingness, we used the pairwise subcommand in Lavaan’s cfa command. Owing to both limited number of categories and right censoring, we treated Backwards Spelling, MMSE Copy Polygons, MMSE Delay Recall, MMSE Orientation, Object Recognition, and TICS Serial 7 as ordered categorical variables. Within the SEM model, the effects of age, age2, and sex were regressed out of the ordered categorical subtests. To reduce the number of parameters, given the large number of subtests used, we regressed out the effects of age and sex from the continuous variables using a generalized additive model from the mgcv package (Wood, Reference Wood2015) prior to running SEM. To control for population stratification the effects of the 10 HRS ancestral principal components provided were also regressed out of the PGS scores. The mean age of this sample was 76.02 (SD = 6.67, range = 65 to 90).
Statistical Procedures
CFA models were fitted using the lavaan package. The goodness-of-fit for the baseline model, which excluded PGSs, was evaluated using the following criteria: Bentler-Hu comparative fit index (CFI) and Tucker-Lewis index (TLI), both set above 0.95; root mean square error of approximation (RMSEA) below 0.10, and standardized root mean square residual (SRMR) below 0.08. These cutoffs are typically associated with maximum likelihood (ML) estimators. While the appropriateness of CFI, TLI, and RMSEA depends on the estimation method, Shi and Maydeu-Olivares (Reference Shi and Maydeu-Olivares2020) have noted that SRMR is robust across different estimators. For the fit indexes based on the DWLS estimator we consider scaled values, which adjust the fit indices to better reflect the model’s performance when ordinal data are analyzed using DWLS, which does not assume multivariate normality.
Subsequently, three models were compared per sample: a common pathway model with a direct path from genetic g (gg) to phenotypic g (gp); an independent pathways model with independent paths from gg to subtests and then to gp; and a model that estimated both direct and independent paths. In the merged model, nonsignificant PGS-to-subtest paths were set to zero to address model estimation issues as a result of Heywood cases and variance-covariance matrix being nonpositive definite.
For evaluating nested models, we primarily utilized the likelihood ratio test (LRT), recommended by Franić (Reference Franić2014, p. 20), through the lavTestLRT function in lavaan. This method assesses whether a more constrained model significantly worsens the fit compared to a less constrained one. The function computes a chi-square statistic from the differences in degrees of freedom and log-likelihoods between models. The Pr(>Chisq) value indicates the probability that the observed chi-square statistic could occur under the null hypothesis, where the simpler model fits as well as the more complex one. A high Pr(>Chisq) value (typically above 0.05) suggests that the simpler model does not significantly worsen the fit, favoring it for its parsimony. We also considered changes in CFI, RMSEA, and SRMR. Given that the ordered command in lavaan uses the DWLS estimator, which does not assume normality, some fit indices are inappropriate. Moreover, changes in fit metrics are not well established for the DWLS estimator, as noted by Xia and Yang (Reference Xia and Yang2019), leading us to place less emphasis on these values. When two models showed similar fits, we opted for the model with greater parsimony, indicated by a higher number of degrees of freedom.
All code used will be made available upon request.
Results
ELSA
The overall measure for Kaiser-Meyer-Olkin factor adequacy (calculated using the KMO command in psych package; Revelle, Reference Revelle2020) was 0.74 for the nine subtests in the ELSA dataset. A three-factor model, which we retained, was indicated by exploratory factor analysis (EFA), parallel analysis using the fa.parallel command in the psych package and by inspection of the number of eigenvalues above 1.0. We fit a bifactor model with three broad factors: Complex cognition (Date, Letter Accuracy, Literacy, and Numeracy), Recall (Immediate Recall and Delay Recall), and Prospective memory (Prospective Memory 1 and Prospective Memory 2). Animal naming did not load on any of the broad factors, but only on g.
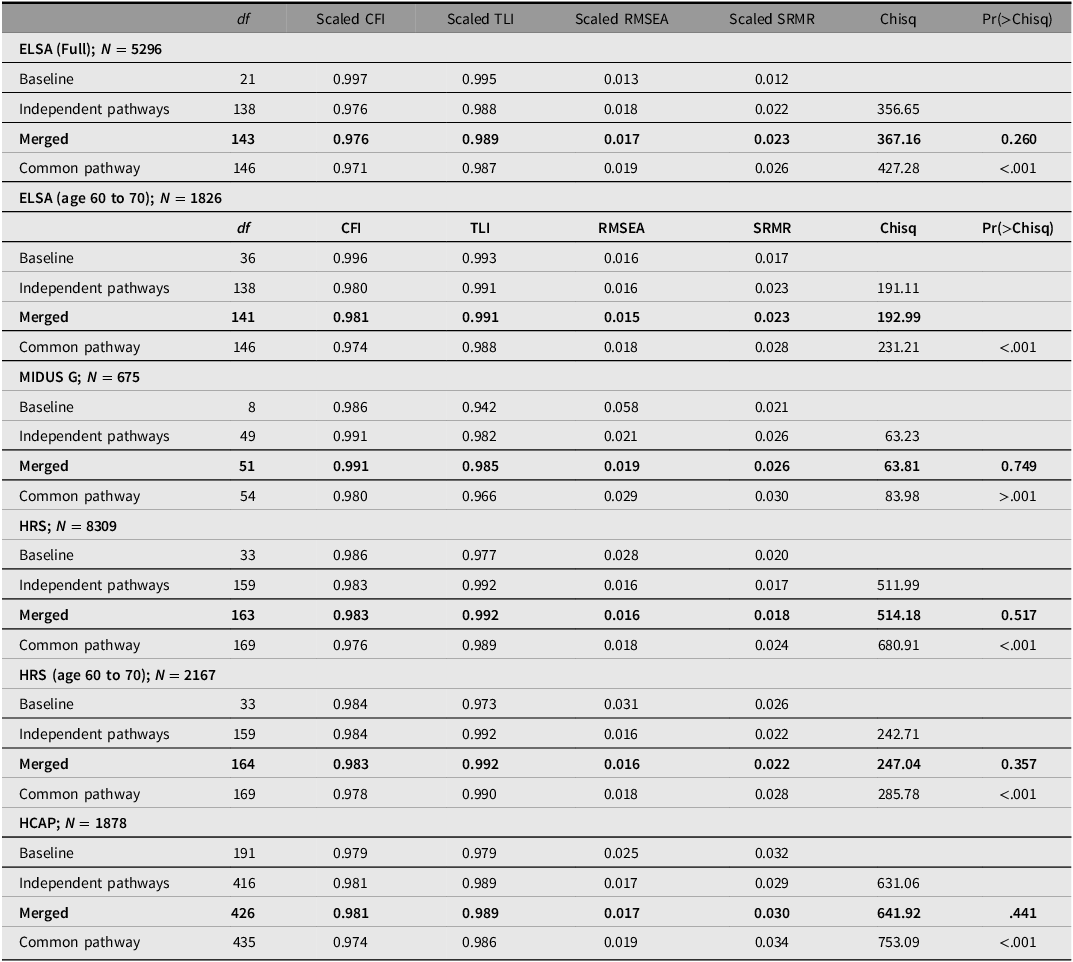
As shown in Table 3, the baseline CFA model demonstrated good fit, evidenced by a CFI of 0.997, a TLI of 0.995, a RMSEA of 0.013, and a SRMR of 0.012.
Comparative model fits for ELSA, MIDUS G, HRS, and HCAP

Note: ELSA, English Longitudinal Study of Aging; MIDUS G, Midlife in the US Genetics; HRS, Health and Retirement Survey; HCAP, Harmonised Cognitive Assessment Protocol; CFI comparative fit index; TLI, Tucker-Lewis index; RMSEA, root mean square error of approximation; SRMR, standardized root mean square residual.
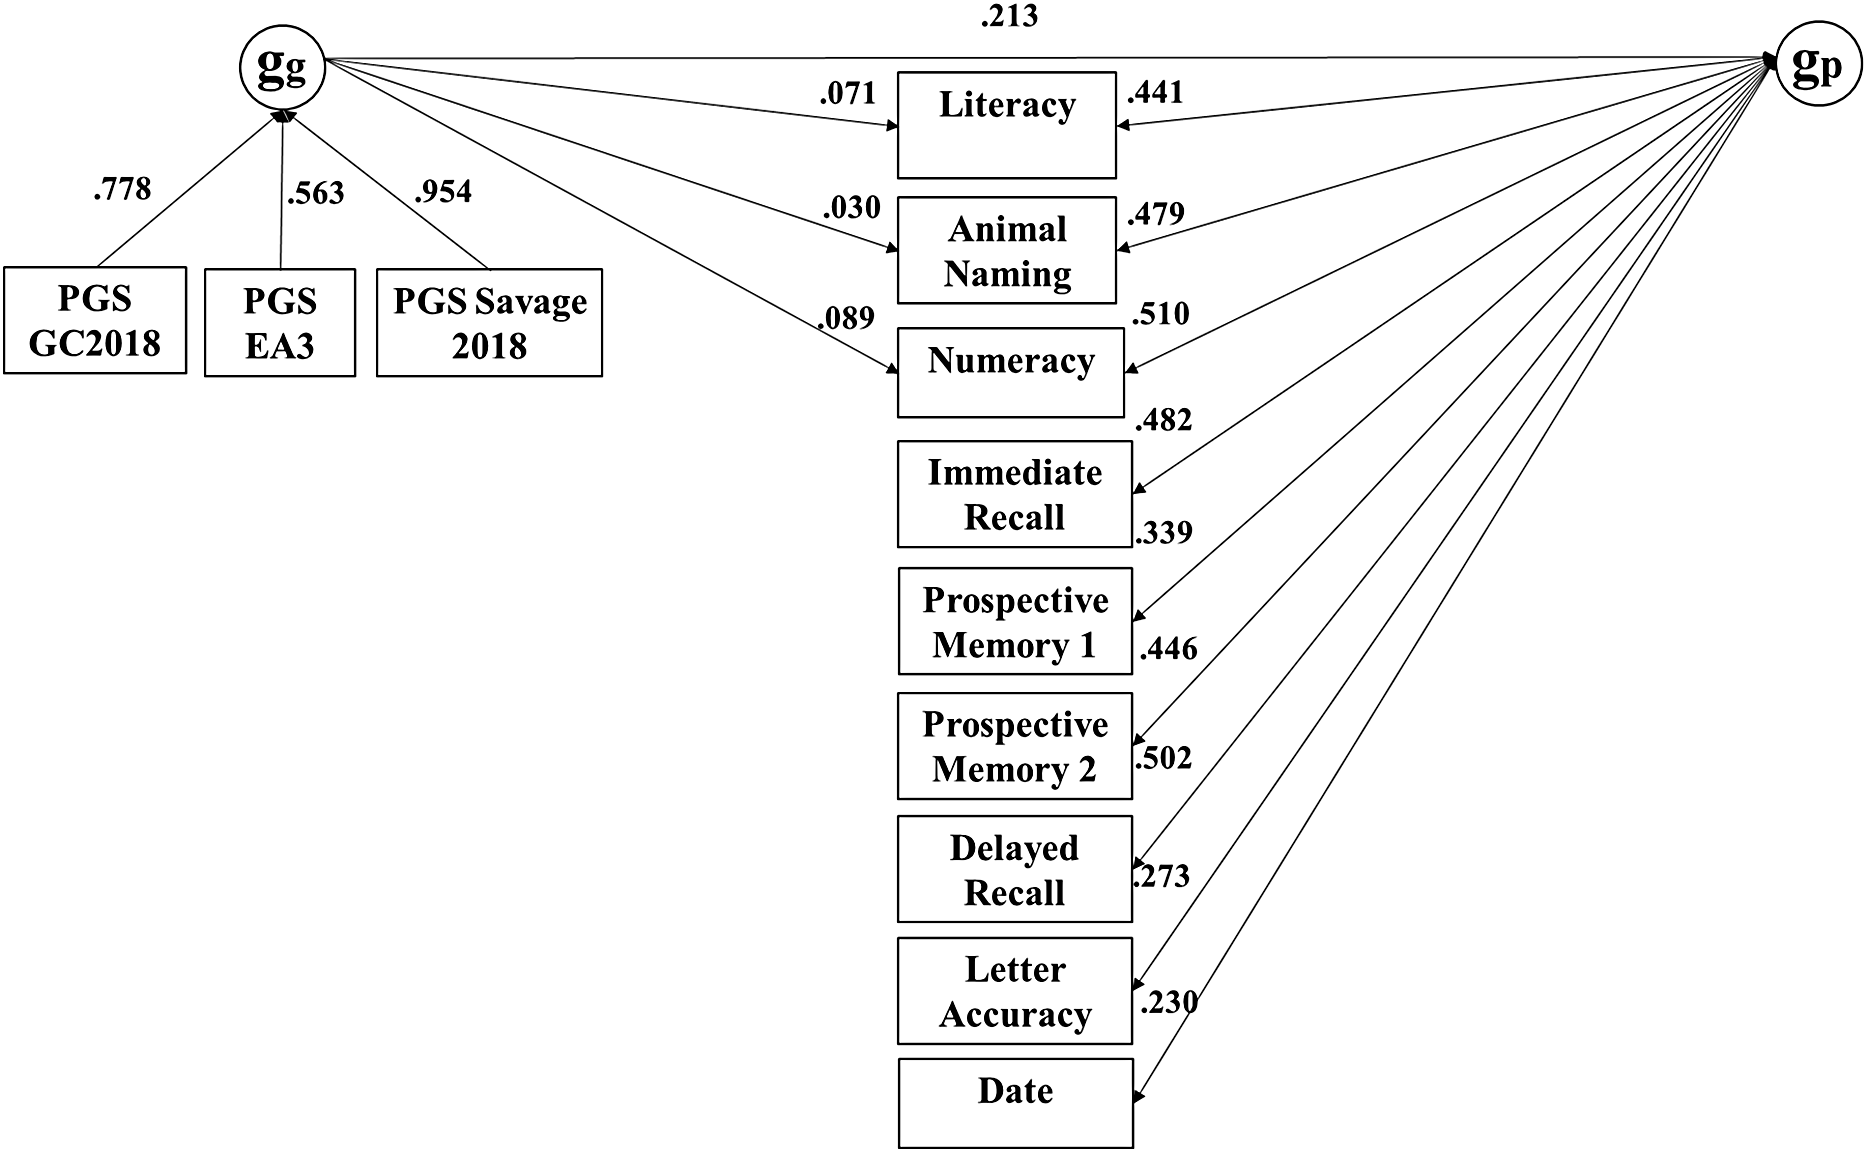
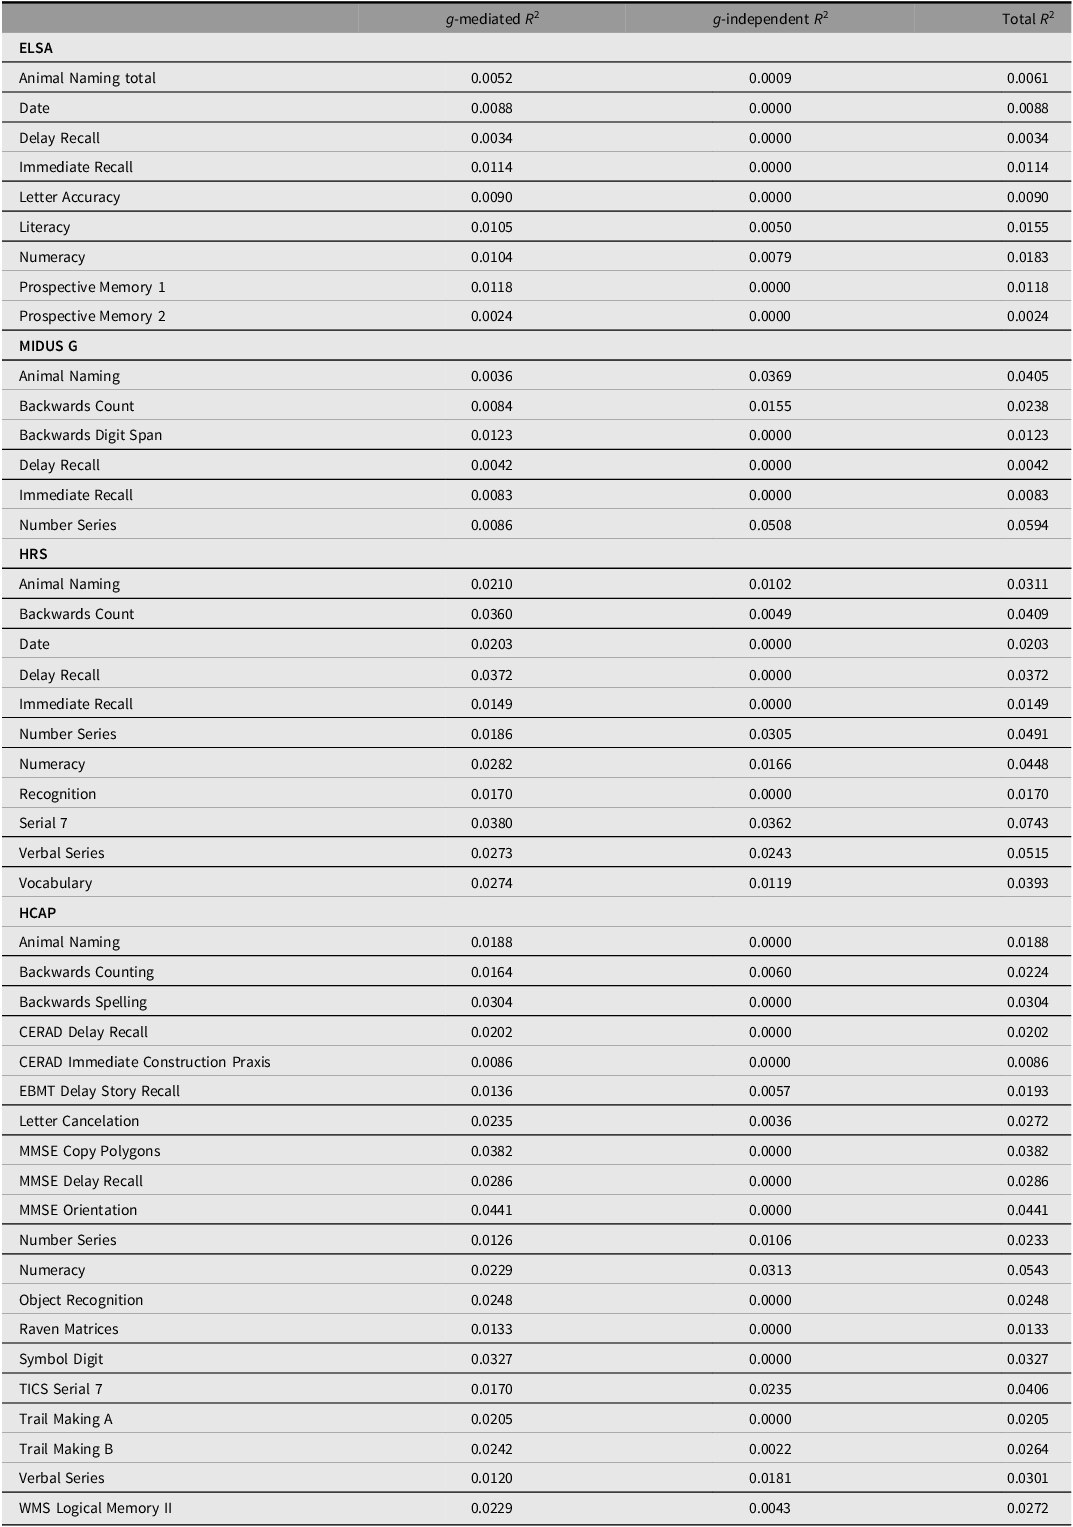
The common pathway model fit substantially worse as indicated by the highly significant Pr(>Chisq) and the somewhat lower ΔCFI (≥ .005), while the independent pathways and merged models were statistically indistinguishable. The merged model, with df = 143, was more parsimonious than the independent pathways models. In this merged model, depicted in Figure 3, 84% of the effect of genetic g on subtests was mediated through phenotypic g. Table 4 reports the R 2 of the PGS effects on subtests in the merged model, both independent and mediated by g.
Merged model for the ELSA dataset, with nonsignificant paths constrained to zero (broad factors not shown).
Note: ELSA, English Longitudinal Study of Aging.

Effects of genetic g on subtests mediated and independent of phenotypic g

Note: ELSA, English Longitudinal Study of Aging; MIDUS G, Midlife in the US Genetics; HRS, Health and Retirement Survey; HCAP, Harmonised Cognitive Assessment Protocol.
The age 60 to 70 ELSA subsample showed a similar pattern to that of the full ELSA sample. Both the merged and the independent pathways model exhibited better fit than the common pathway model. While the merged model was statistically indistinguishable from the independent pathways model, it was more parsimonious having higher df. In the merged model for this subsample, 84% of the effect of genetic g on subtests was mediated through phenotypic g.
MIDUS G
The overall measure of Kaiser-Meyer-Olkin factor adequacy was 0.68 for the six subtests in the MIDUS G dataset. A two-factor model was initially suggested by both parallel analysis and the number of eigenvalues above 1.0. However, due to poor fit, we adopted the model from Nelson et al. (Reference Nelson, Barber, Temkin, Dams-O’Connor, Dikmen, Giacino, Kramer, Levin, McCrea, Whyte, Bodien, Yue and Manley2021), which included a general factor with the six subtests loading on it and a residual covariance between Immediate and Delay Recall.
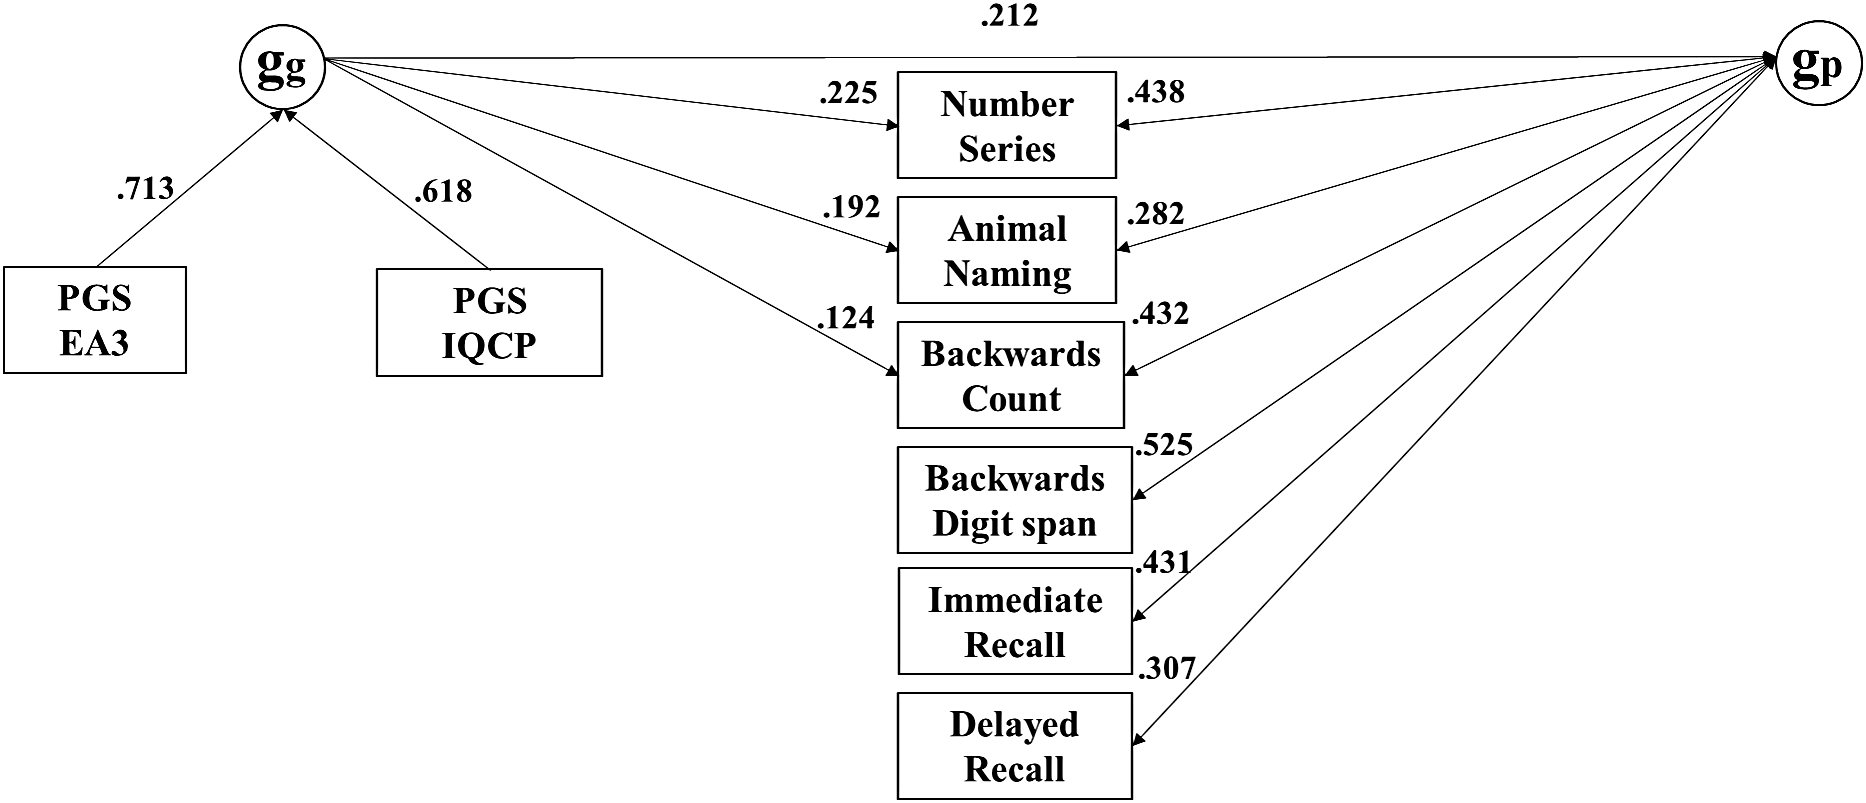
As shown in Table 3, the baseline CFA model demonstrated acceptable fit, evidenced by a CFI of 0.986, a TLI of 0.942, a RMSEA of 0.058, and a SRMR of 0.021. The common pathway model fit substantially worse, as indicated by the highly significant Pr(>Chisq) and also the large ΔCFA (≥.010), while the independent pathways and merged models were statistically indistinguishable. With df = 51, the merged model, depicted in Figure 4, was more parsimonious than the independent pathways model. In the merged model, 31% of the effect of genetic g on subtests was mediated through phenotypic g.
Merged model for the MIDUS G dataset, with nonsignificant paths constrained to zero.
Note: MIDUS, Midlife in the US Genetics

HRS
The overall measure of Kaiser-Meyer-Olkin factor adequacy was 0.83 for the 11 subtests in the HRS dataset. Parallel analysis indicated four factors, while number of eigenvalues above 1.0 pointed to three. Based on EFA, we settled on a bifactor model with three broad factors: Complex cognition (Animal Naming, Number Series, Numeracy, Serial 7, Verbal Series, and Vocabulary), Memory (Delay Recall and Immediate Recall), and Orientation (Backwards Count, Date, Recognition, and Serial 7). This model aligned with previous findings and was thus retained. The baseline CFA model demonstrated good fit, evidenced by a CFI of 0.986, a TLI of 0.977, RMSEA of 0.028, and a SRMR of .020 (Table 3).
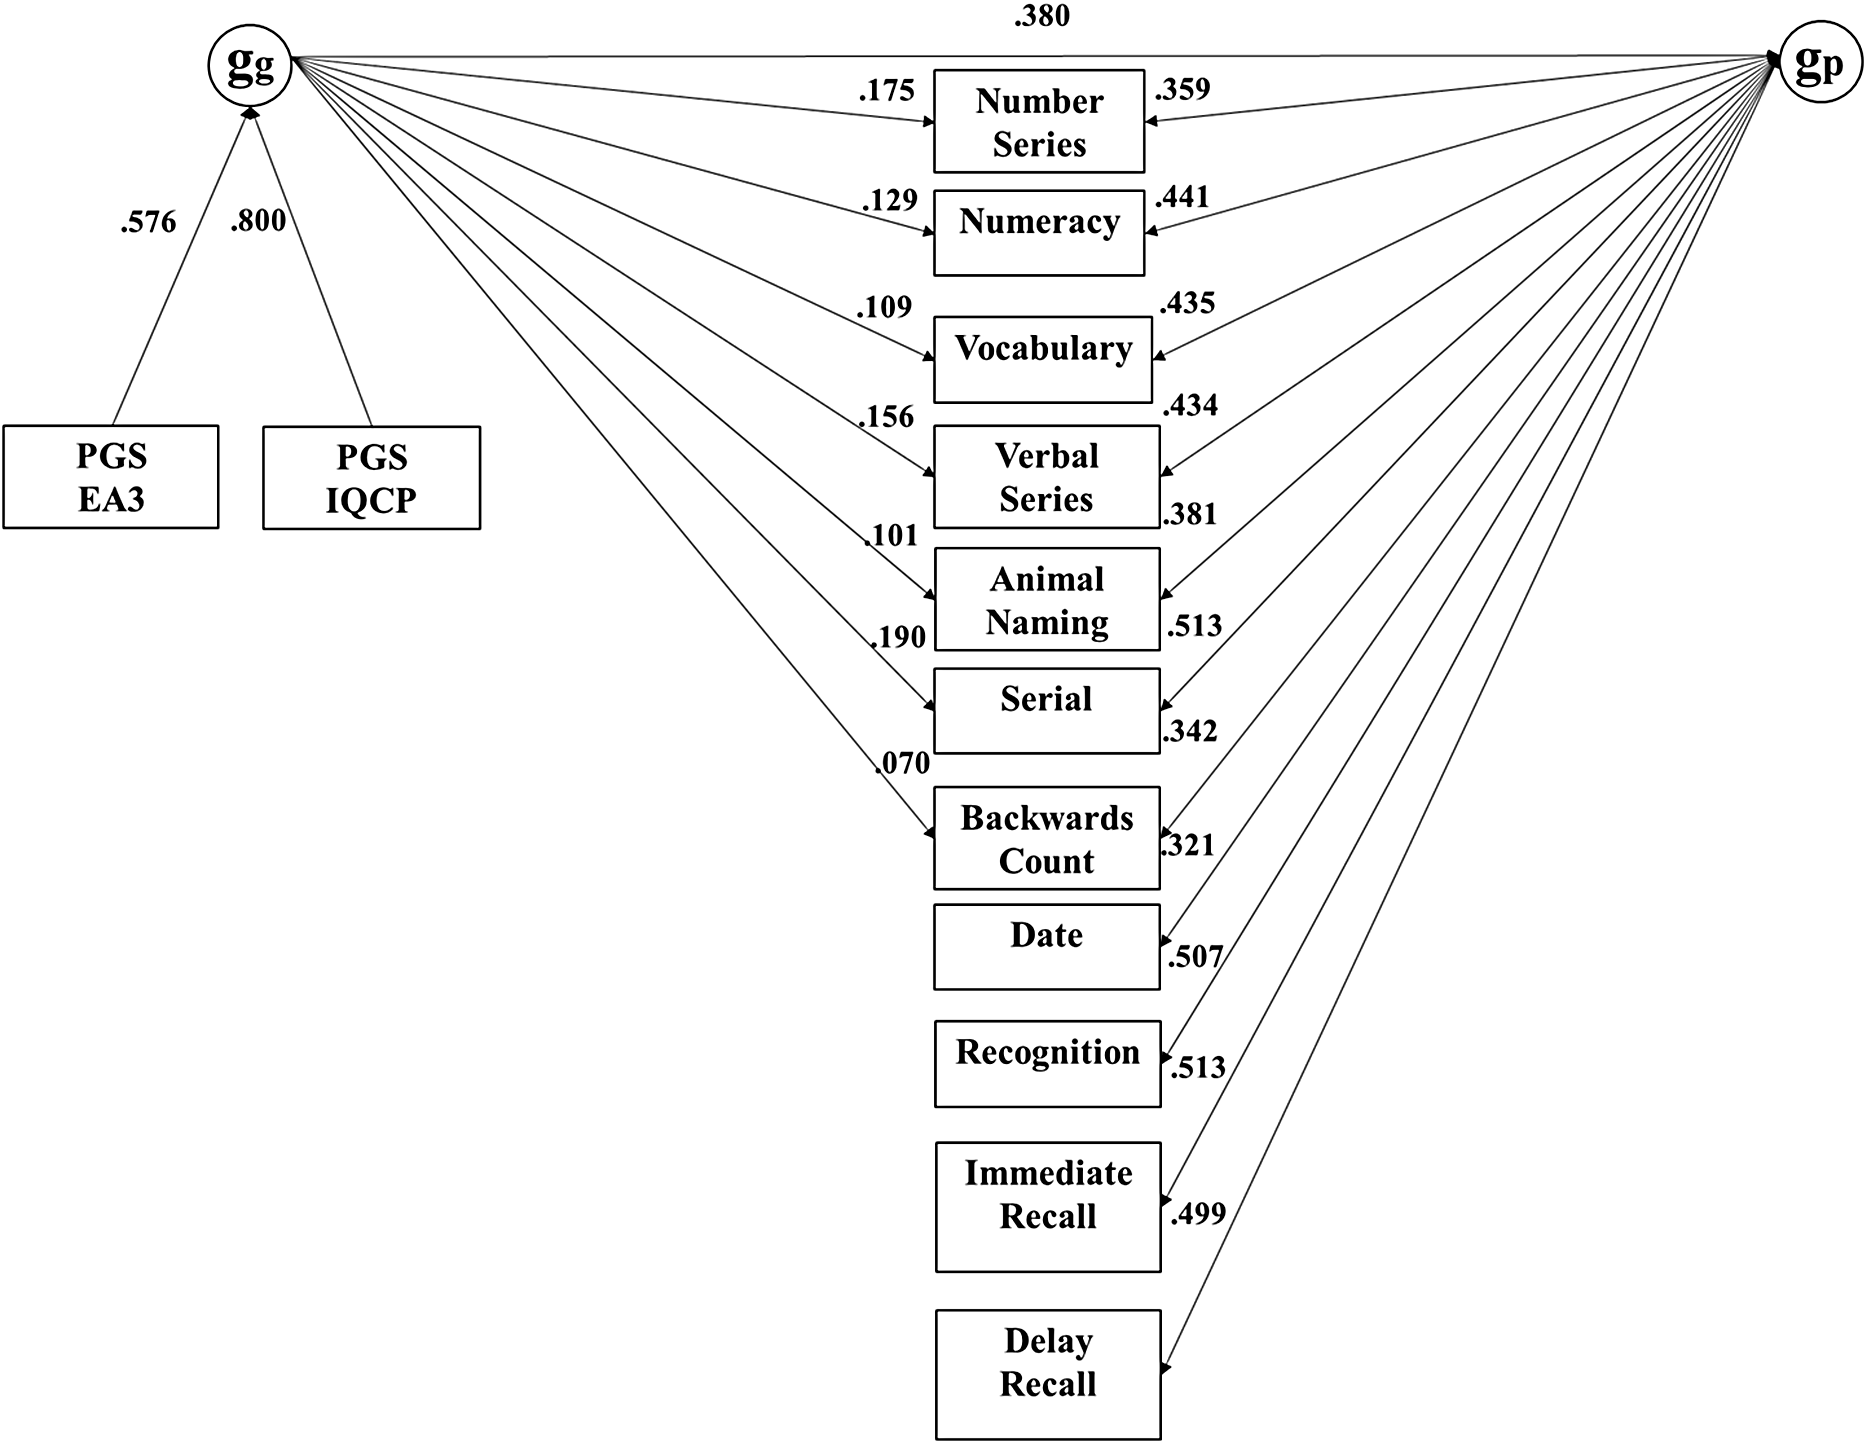
The common pathway model fit substantially worse, as indicated by the highly significant Pr(>Chisq), and the somewhat lower ΔCFI and ΔSRMR (≥ .005), while the independent pathways and merged models were statistically indistinguishable. The merged model, with df = 163, was more parsimonious than the independent pathways models. In this merged model, depicted in Figure 5, 68% of the effect of genetic g on subtests was mediated through phenotypic g. See Table 4 for the R 2 of the PGS effects on subtests in the merged model.
Merged model for the HRS dataset, with nonsignificant paths constrained to zero (broad factors not shown).
Note: HRS, Health and Retirement Survey.

The age 60 to 70 HRS subsample showed a similar pattern to that as the full HRS sample. Both the merged and the independent pathways model exhibited better fit than the common pathway model. While the merged model was statistically indistinguishable from the independent pathways model, it was more parsimonious having higher df. In the merged model with this subsample, 69% of the effect of genetic g on subtests was mediated through phenotypic g.
HCAP
The overall measure for Kaiser-Meyer-Olkin factor adequacy was 0.92 for the 20 subtests in the HCAP dataset. Both parallel analysis and number of eigenvalues above 1.0 indicated a five-factor model, which aligned with results from EFA. The bifactor model had five broad factors: Complex cognition (Backwards Counting, Number Series, Numeracy, Raven Matrices, TICS Serial 7, and Verbal Series), Memory (Animal Naming, CERAD Delay Recall, EBMT Delay Story Recall, MMSE Delay Recall, and WMS Logical Memory II), Visuospatial (CERAD Immediate Construction Praxis, Raven Matrices, and MMSE Copy Polygons), Working memory (Backwards Counting, Trail Making A, Trail Making B, Letter Cancelation, Symbol Digit, and Backwards Spelling), and Orientation (MMSE Orientation and Object Recognition). The baseline CFA model demonstrated good fit, evidenced by a CFI of 0.979, a TLI of 0.979, a RMSEA of 0.025, and a SRMR of 0.032 (Table 3).
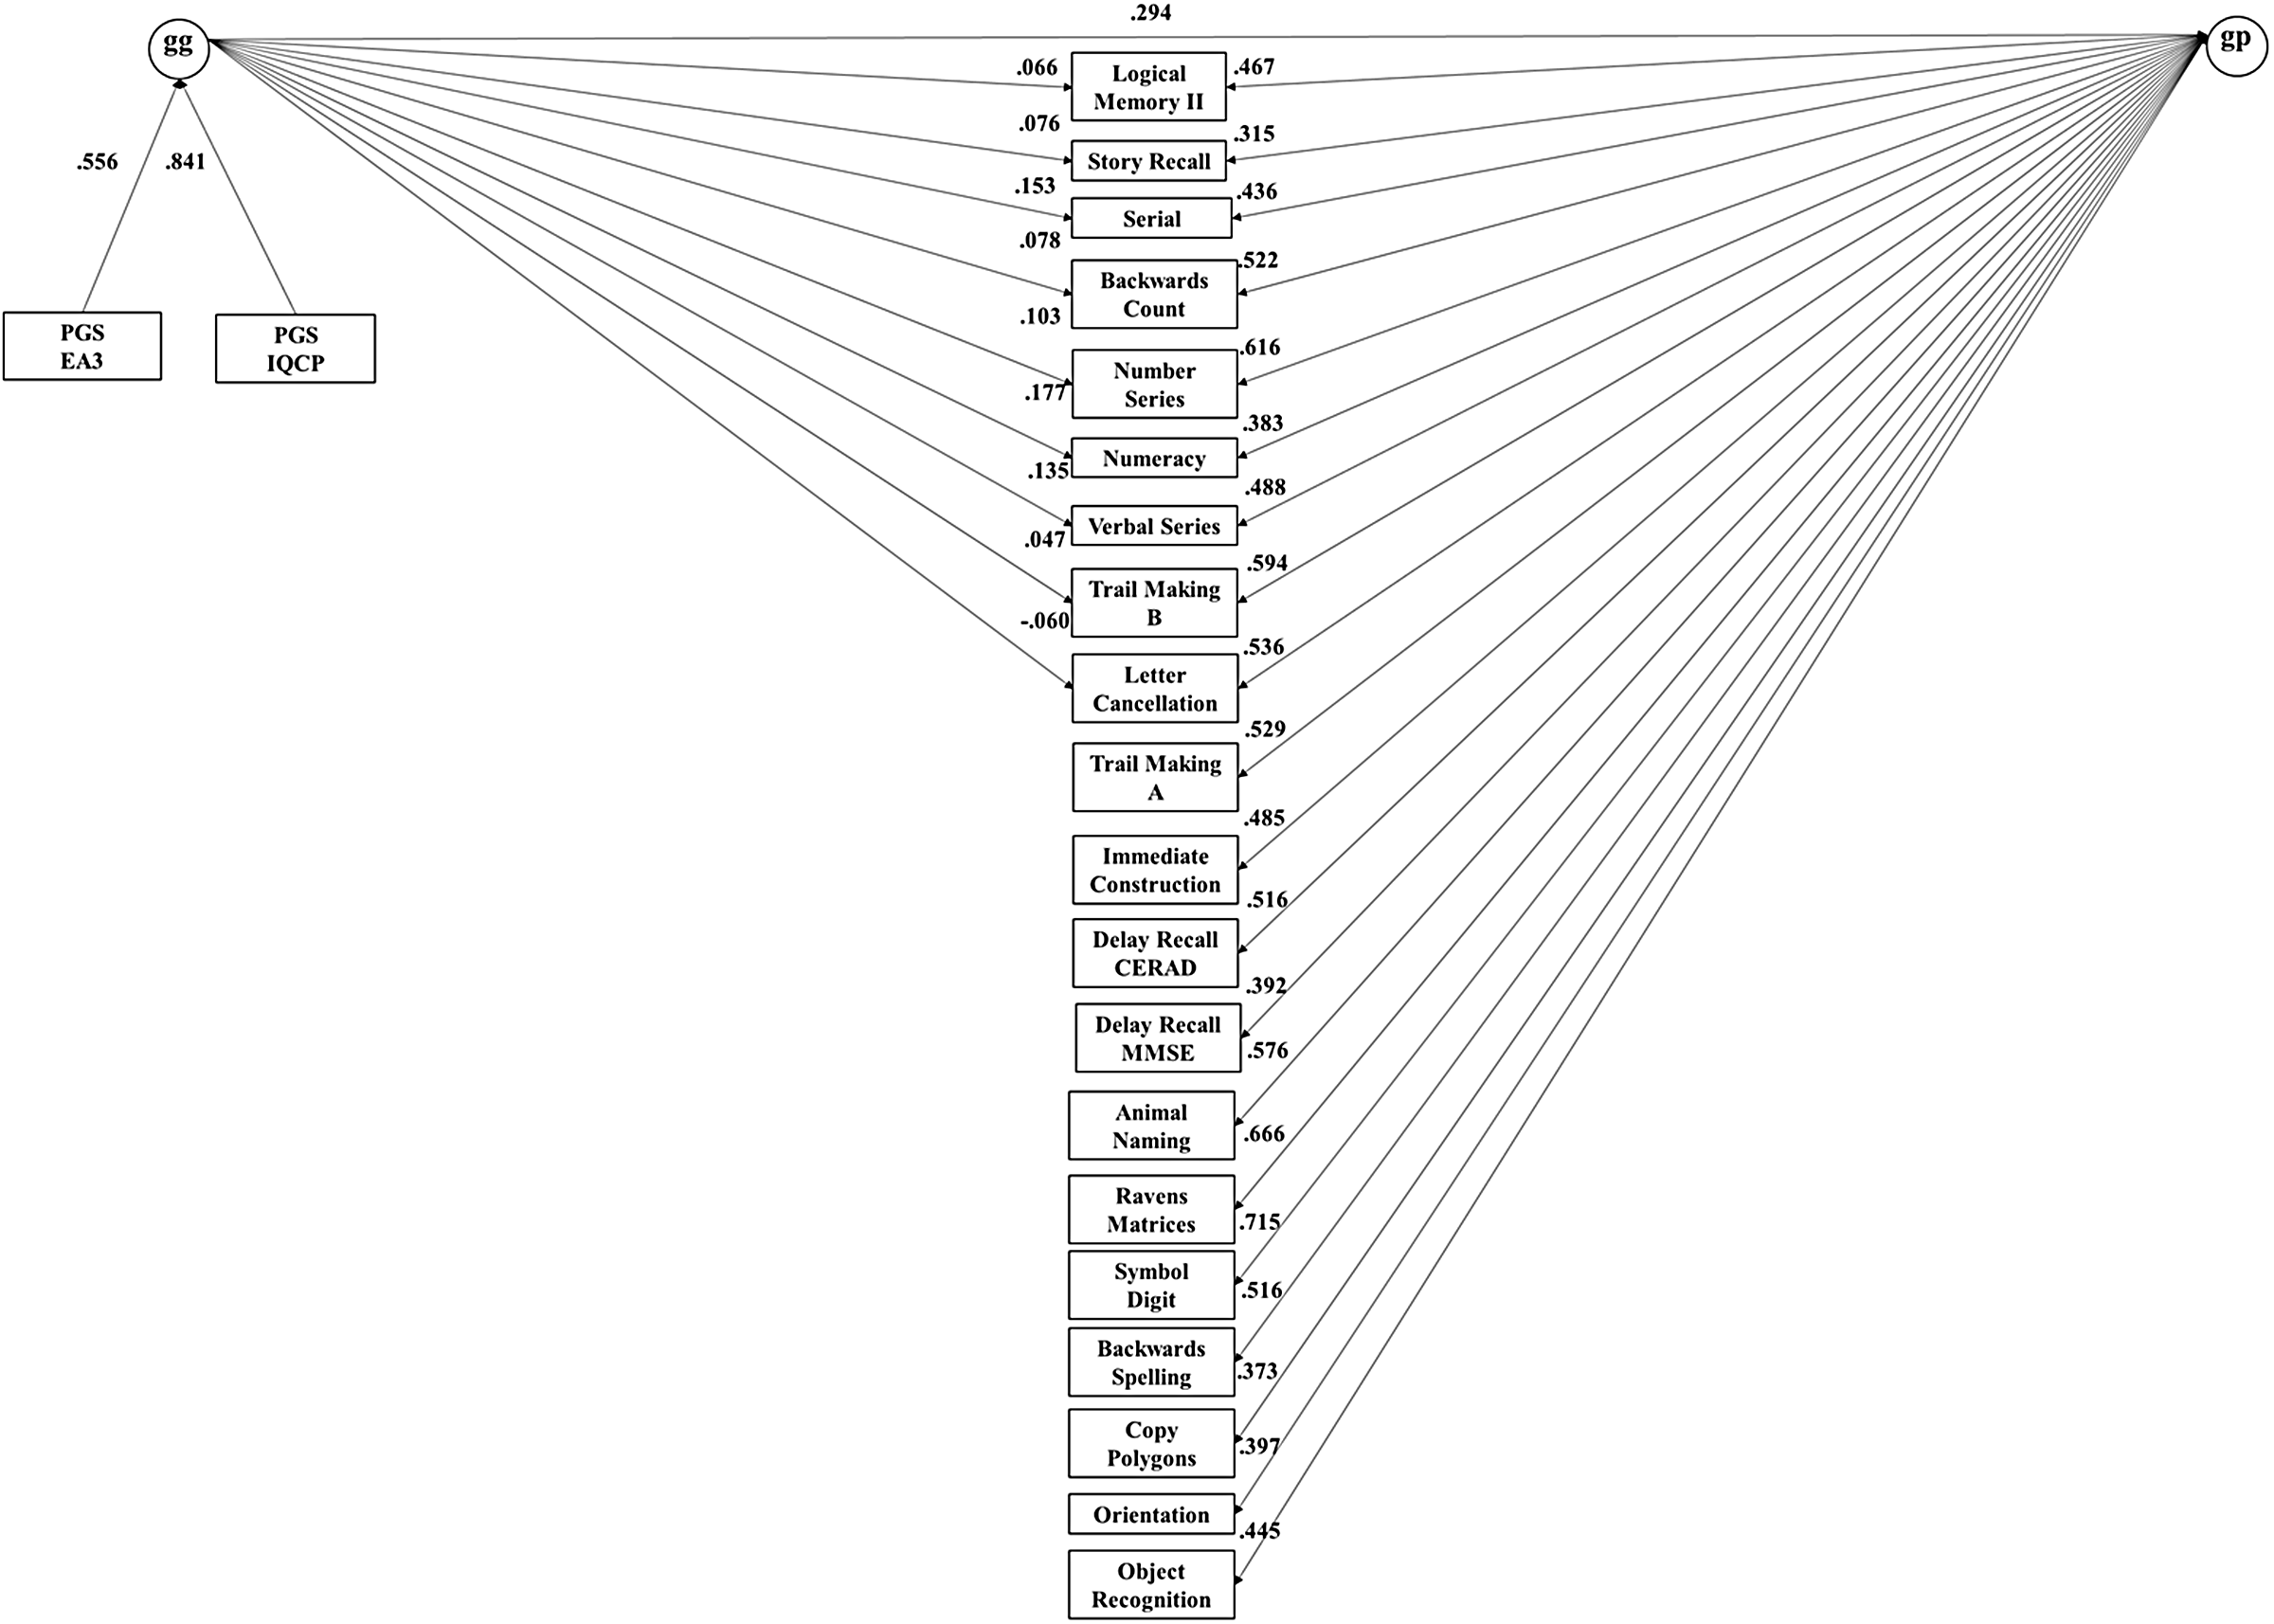
The common pathway model fit substantially worse, as indicated by the highly significant Pr(>Chisq), and the somewhat lower ΔCFI and ΔSRMR (≥ .005), while the independent pathways and merged models were statistically indistinguishable. The merged model, with df = 163, was more parsimonious than the independent pathways models. In this merged model, depicted in Figure 6, 81% of the effect of genetic g on subtests was mediated through phenotypic g. See Table 4 for the R 2 of the PGS effects on subtests in the merged model.
Merged model for the HCAP dataset, with nonsignificant paths constrained to zero (broad factors not shown).
Note: HCAP, Harmonised Cognitive Assessment Protocol.

Discussion
Based on the previous results (Bates, Reference Bates2025; Shikishima et al., Reference Shikishima, Hiraishi, Yamagata, Sugimoto, Takemura, Ozaki, Okada, Toda and Ando2009; Panizzon et al., Reference Panizzon, Vuoksimaa, Spoon, Jacobson, Lyons, Franz, Xian, Vasilopoulos and Kremen2014), we predicted that the common pathway model would fit best. We found, however, that the common pathway fits worse than the independent pathways and merged models. Based on both goodness of fit and pasimony, the merged models —incorporating both direct paths from genetic g to phenotypic g and independent paths from genetic g to specific subtests— is better fitting. This would be consistent with a model of g as both a reflective and formative entity, indicating that g is more complex than usually thought.
While contrary to Shikishima et al. (Reference Shikishima, Hiraishi, Yamagata, Sugimoto, Takemura, Ozaki, Okada, Toda and Ando2009) and Bates (Reference Bates2025) we found strong disconfirmation of a pure common pathway model, our findings are in line with genetically informed comparisons previously reported by Panizzon et al. (Reference Panizzon, Vuoksimaa, Spoon, Jacobson, Lyons, Franz, Xian, Vasilopoulos and Kremen2014) and de la Fuente et al. (Reference de la Fuente, Davies, Grotzinger, Tucker-Drob and Deary2021) in that we found additional effects of genetic g on subtests independent of phenotypic g. The results based on the merged model are, nonetheless, consistent with the notion that phenotypic g partially operates as a reflective construct, where causality flows from the latent variable to its indicators. Specifically, phenotypic g explained between 31% and 81% of the effects of PGS on subtests.
Separate research has demonstrated that specific cognitive abilities possess modest to high heritabilities independent of g (Coyle et al., Reference Coyle, Woodley Menie, Peñaherrera-Aguirre, Sarraf and Madison2023; Procopio et al., Reference Procopio, Zhou, Wang, Gidziela, Rimfeld, Malanchini and Plomin2022). This finding might explain why genetic effects were observable for subtests independent of g in the current study, which employed PGSs to index genetic influences, as well as in Panizzon et al. (Reference Panizzon, Vuoksimaa, Spoon, Jacobson, Lyons, Franz, Xian, Vasilopoulos and Kremen2014), which utilized kinship-based genetic effect estimates. An additional potential explanation for these findings is that our genetic g scores are constructed using mixtures of PGSs derived from assessments of cognitive ability and educational attainment. The latter often relies heavily on crystallized intelligence measures, which may be inadequately represented by the batteries typically used here, such as those designed to identify memory deficits in aging populations (e.g., the HRS battery). If these genetic g scores are linked to domains poorly represented or absent in these subtests, it is likely that the unassessed cognitive variance is instead manifested in a direct genetic contribution to phenotypic g.
Previous studies, such as those by Shikishima et al. (Reference Shikishima, Hiraishi, Yamagata, Sugimoto, Takemura, Ozaki, Okada, Toda and Ando2009) and Panizzon et al. (Reference Panizzon, Vuoksimaa, Spoon, Jacobson, Lyons, Franz, Xian, Vasilopoulos and Kremen2014), have been limited by relatively small sample sizes, while others like de la Fuente et al. (Reference de la Fuente, Davies, Grotzinger, Tucker-Drob and Deary2021), Bates (Reference Bates2025), and again Shikishima et al. (Reference Shikishima, Hiraishi, Yamagata, Sugimoto, Takemura, Ozaki, Okada, Toda and Ando2009), utilized a restricted number of subtests. In contrast, our study includes samples ranging from 675 to 8309 individuals, completing between 6 and 20 different tests. There are, however, several limitations.
First, in using PGSs as an index of genes, we cannot take into account all genetic effects, let alone environmental effects, as can be done with biometric modelling. Second, our analyses were cross-sectional and our samples were all elderly. Kazali et al. (Reference Kazali, Spanoudis and Demetriou2024) suggest that g is a reflective construct influenced by a core of relational integration and mental awareness, which undergoes developmental changes. Specifically, they describe how g is predominantly governed by attention control and perceptual awareness from ages 4 to 6, by inferential awareness and working memory from ages 7 to 9, and by inhibition, inferential awareness, and complex inductive reasoning from ages 10 to 12. They further note that these specific processes may also serve as formative influences on g at different developmental stages. Given that our model was cross-sectional and our samples involved elderly adults, it did not capture potential developmental shifts in how genetic g might exert formative effects on phenotypic g through its subscales. These shifts may not only be limited to childhood but could also occur during late adulthood.
Indeed, the violation of age invariance at the metric level during late adulthood, as evidenced in several cognitive tests, including those used in this study (Blankson & McArdle, Reference Blankson and McArdle2015; Williams et al., Reference Williams, Chandola and Pendleton2018), suggests that the latent constructs underlying g may differ across ages. This aligns with the view that g’s formative influences might change over time, with specific cognitive processes contributing differently across development. For instance, older adults might increasingly rely on accumulated knowledge (crystallized intelligence) to compensate for declines in fluid cognitive processes. These shifts in the balance of cognitive contributions could explain the varying influences of genetic components on phenotypic g across age groups. However, while these changes are significant, they cannot fully account for our results, which are consistent even in age-range restricted subsamples. These findings highlight the importance of accounting for developmental dynamics in future studies.
Third, we did not investigate mediators of the relationship between genetic and phenotypic g. We also did not presuppose a mechanism by which genes as indexed by the PGSs employed here relate to phenotypic g. A common view in behavioral genetics is that genes act via cognitively enriching environments, which individuals seek out in the form of active gene-environment covariance (Plomin, Reference Plomin2018). This gene-environment interplay reflects how genetically influenced propensities for academic motivation or social engagement may lead individuals to actively seek out environments that align with and reinforce these traits, thereby amplifying the heritability of g over the course of development (Briley & Tucker-Drob, Reference Briley and Tucker-Drob2013). These findings underscore the necessity of incorporating longitudinal measures of environmental influences — such as parental investment, educational quality, or occupational complexity — as mediators in future studies to disentangle these pathways.
Additionally, genes could act on phenotypic g via neural physiological mechanisms (one example might be lung functioning influencing levels of blood oxygen, which has been found in GWAS to be positively associated with levels of cognitive functioning; Deary et al., Reference Deary, Harris and Hill2019). This aligns with emerging evidence that general health traits — including cardiovascular fitness and metabolic efficiency — are moderately correlated with g and may represent biological substrates through which genetic influences are exerted (Calvin et al., Reference Calvin, Deary, Fenton, Roberts, Der, Leckenby and Batty2011).
This extraordinarily large degree of trait polygenicity and pleiotropy (Huguet et al., Reference Huguet, Schramm, Douard, Tamer, Main, Monin, England, Jizi, Renne, Poirier, Nowak, Martin, Younis, Knoth, Jean-Louis, Saci, Auger, Tihy, Mathonnet and Jacquemont2021) is itself likely a reflection of the extremely strong selection pressures that have acted on g over the last 10 million years (relative to most other traits), as indicated by comparative phylogenetic analysis of both measured and reconstructed (via phylogenetic bracketing) values of species-level G — this being the species-level equivalent of g at the individual differences level (Peñaherrera-Aguirre et al., Reference Peñaherrera-Aguirre, Sarraf, Woodley Menie and Miller2023). This broad pattern of polygenicity and pleiotropy in g likely reflects not only species-level selection pressures but also localized genomic adaptations. For instance, studies of accelerated evolution in specific genomic regions (e.g., Human Accelerated Regions) indicate that specific genetic loci have contributed both to brain development and the cognitive architecture underlying g (Guardiola-Ripoll & Fatjó-Vilas, Reference Guardiola-Ripoll and Fatjó-Vilas2023).
Future research could consider common versus independent pathways models in the context of personality traits. One such study (Lewis & Bates, Reference Lewis and Bates2014) found that in the case of the HEXACO model, common pathway models of personality heritability generally exhibited the best fit, which suggests that major personality domains contained within this model are biologically substantive. Applications of these methods to genetically informed personality datasets from which higher-order factors, such as the General Factor of Personality, can be estimated could be used to test whether or not these mediate genetic influences on lower-order personality traits.
Acknowledgments
MIDUS is supported by multiple grants from the National Institute on Aging (5R37AG027343, 5P01AG020166, 1R03AG046312, 1U19AG051426) and also by the University of Wisconsin Institute on Aging.
Funding
All authors received no external funding to conduct this research. ELSA is funded by the National Institute on Aging (R01AG017644), and by UK Government Departments coordinated by the National Institute for Health and Care Research (NIHR). The HRS (Health and Retirement Study) and HCAP (Harmonised Cognitive Assessment Protocol) are sponsored by the National Institute on Aging (NIA U01AG009740) and is conducted by the University of Michigan.
Competing interests
The authors declare no financial interests in the outcome of this work.
Ethics statement
All analyses were based on publicly accessible databases and did not require an IRB review.