


I. INTRODUCTION
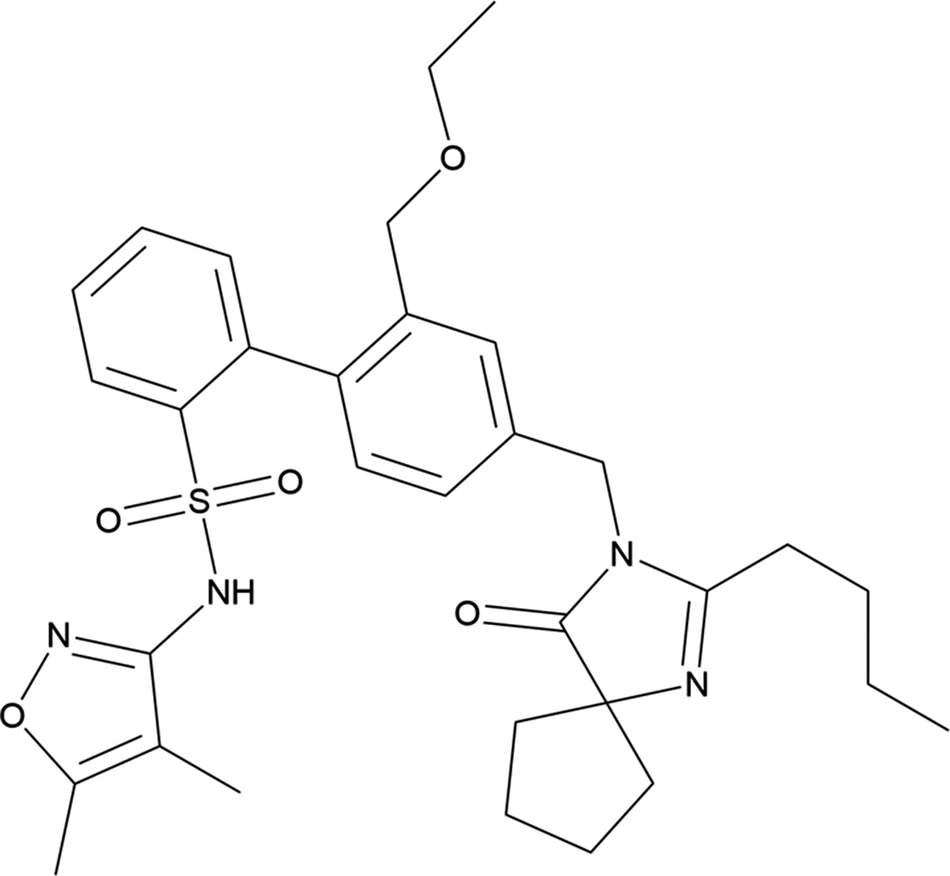
Sparsentan (marketed under the trade name Filspari®) is used to slow kidney decline in adults diagnosed with primary immunoglobulin A neuropathy. It functions by reducing proteinuria (excess proteins in the urine). The systematic name (Chemical Abstracts Service (CAS) Registry Number 254740-64-2) is 2-[4-[(2-butyl-4-oxo-1,3-diazaspiro[4.4]non-1-en-3-yl)methyl]-2-(ethoxymethyl)phenyl]-N-(4,5-dimethyl-1,2-oxazol-3-yl)benzenesulfonamide. A two-dimensional molecular diagram of sparsentan is shown in Figure 1.
The two-dimensional structure of sparsentan.
Processes for preparing sparsentan are claimed in International Patent Application WO 2000/01389 A1 (Murugesan et al., Reference Murugesan, Tellew, Macor and Gu2000; Bristol-Myers Squibb), U.S. Patent 6638937 (Murugesan et al., Reference Murugesan, Tellew, Macor and Gu2003; Bristol-Myers Squibb), and International Patent Application WO 2018/071784 A1 (Komers and Shih, Reference Komers and Shih2018; Retrophin, Inc.). Crystalline products were isolated, but no powder diffraction data were reported. Both amorphous sparsentan and formulations containing it are claimed in U.S. Patent Application US 2022/0048900 A1 (Macikenas et al., Reference Macikenas, Ruby, Hulvat and Wu2022; Travere Therapeutics, Inc.), and a powder pattern for amorphous sparsentan is provided.
This work was carried out as part of a project (Kaduk et al., Reference Kaduk, Crowder, Zhong, Fawcett and Suchomel2014) to determine the crystal structures of large-volume commercial pharmaceuticals and include high-quality powder diffraction data for them in the Powder Diffraction File™ (PDF®) (Kabekkodu et al., Reference Kabekkodu, Dosen and Blanton2024).
II. EXPERIMENTAL
Sparsentan was a commercial reagent, purchased from TargetMol (Batch #145074), and was used as received. The white powder was packed into a 0.5-mm-diameter Kapton capillary and rotated during the measurement at ~2 Hz. The powder pattern was measured at 298(1) K at the Wiggler Low Energy Beamline (Leontowich et al., Reference Leontowich, Gomez, Moreno, Muir, Spasyuk, King, Reid, Kim and Kycia2021) of the Brockhouse X-Ray Diffraction and Scattering Sector of the Canadian Light Source using a wavelength of 0.819563(2) Å (15.1 keV) from 1.6 to 75.0° 2θ with a step size of 0.0025° and a collection time of 3 minutes. The high-resolution powder diffraction data were collected using eight Dectris Mythen2 X series 1 K linear strip detectors. NIST SRM 660b LaB6 was used to calibrate the instrument and refine the monochromatic wavelength used in the experiment.
The pattern was indexed using JADE Pro (MDI, 2024) on a primitive triclinic unit cell with a = 11.41168, b = 11.99743, c = 14.12132 Å, α = 97.62, β = 112.43, γ = 110.25°, V = 1596.62 Å3, and Z = 2. The space group was assumed to be P-1, which was confirmed by the successful solution and refinement of the structure. A reduced cell search of the Cambridge Structural Database (Groom et al., Reference Groom, Bruno, Lightfoot and Ward2016) yielded one hit (for a Zn coordination complex) but no structures for sparsentan or its derivatives.
Coordinates for the sparsentan molecule were downloaded from PubChem (Kim et al., Reference Kim, Chen, Cheng, Gindulyte, He, He and Li2023) as Conformer3D_COMPOUND_CID_10257882.sdf. It was converted to a *.mol2 file using Mercury (Macrae et al., Reference Macrae, Sovago, Cottrell, Galek, McCabe, Pidcock and Platings2020) and a Fenske–Hall Z-matrix using OpenBabel (O’Boyle et al., Reference O’Boyle, Banck, James, Morley, Vandermeersch and Hutchison2011). The crystal structure was solved using parallel tempering techniques as implemented in FOX (Favre-Nicolin and Černý, Reference Favre-Nicolin and Černý2002), using (sinθ/λ)max = 0.26 Å−1.
Rietveld refinement was carried out with GSAS-II (Toby and Von Dreele, Reference Toby and Von Dreele2013). Only the 3.5–40.0° portion of the pattern was included in the refinements (d min = 1.198 Å). All non-H bond distances and angles were subjected to restraints, based on a Mercury/Mogul Geometry Check (Bruno et al., Reference Bruno, Cole, Kessler, Luo, Motherwell, Purkis and Smith2004; Sykes et al., Reference Sykes, McCabe, Allen, Battle, Bruno and Wood2011). The Mogul average and standard deviation for each quantity were used as the restraint parameters. The unsaturated 5- and 6-membered rings were restrained to be planar. The restraints contributed 8.9% to the overall χ 2. The hydrogen atoms were included in calculated positions, which were recalculated during the refinement using Materials Studio (Dassault Systèmes, 2023). The Uiso of the heavy atoms were grouped by chemical similarity. The Uiso for the H atoms were fixed at 1.3× the Uiso of the heavy atoms to which they are attached. The peak profiles were described using the generalized microstrain model (Stephens, Reference Stephens1999). The background was modeled using a six-term shifted Chebyshev polynomial, with a peak at 10.48° to model the scattering from the Kapton capillary and any amorphous component of the sample.
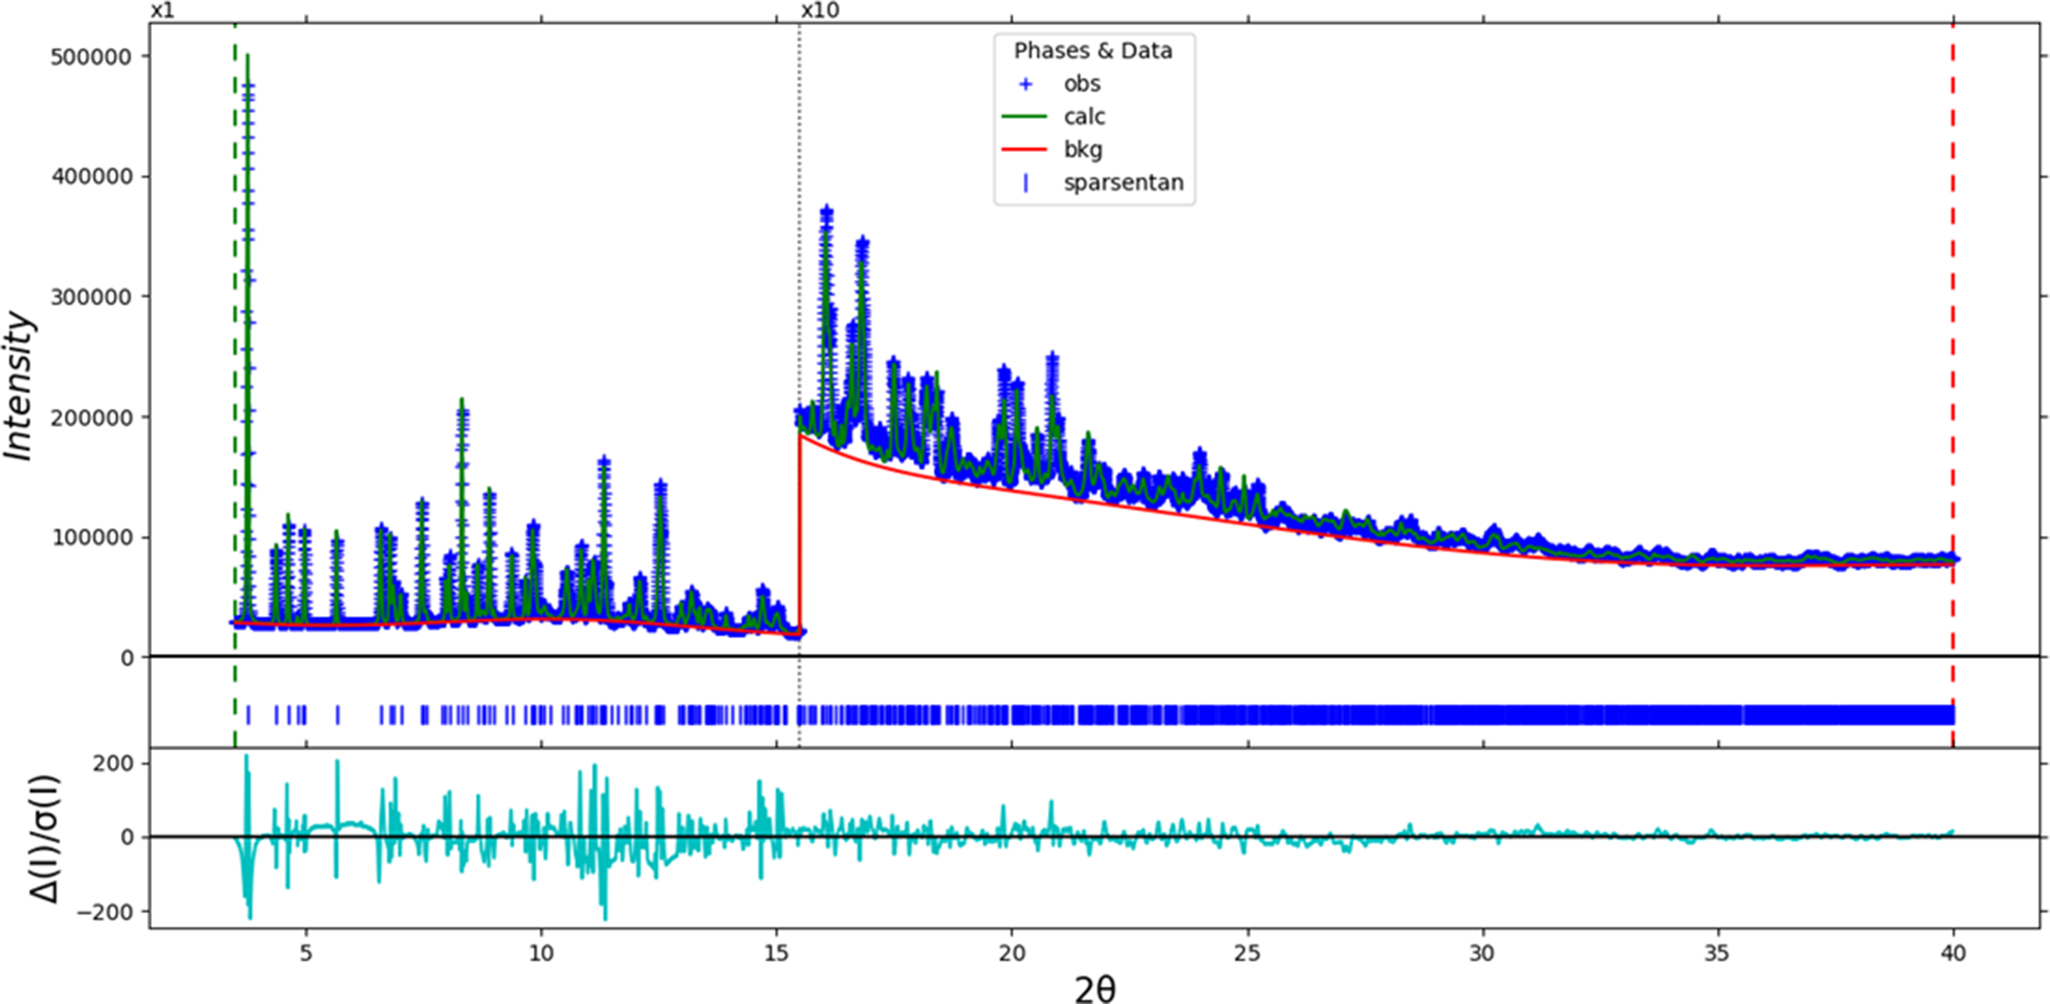
The final refinement of 163 variables using 14,601 observations and 117 restraints yielded the residual R wp = 0.0526. The largest peak (0.81 Å from C28) and hole (1.34 Å from C25) in the difference Fourier map were 0.24(6) and − 0.22(6) eÅ−3, respectively. The final Rietveld plot is shown in Figure 2. The largest features in the normalized error plot are in the shapes and positions of some of the low-angle peaks. These misfits probably indicate a change in the specimen during the measurement.
The Rietveld plot for sparsentan. The blue crosses represent the observed data points, and the green line is the calculated pattern. The cyan curve is the normalized error plot, and the red line is the background curve. The blue tick marks indicate the positions of the sparsentan peaks. The vertical scale has been multiplied by a factor of 10× for 2θ > 15.5̊.
The crystal structure of sparsentan was optimized (fixed experimental unit cell) with density functional theory (DFT) techniques using VASP (Kresse and Furthmüller, Reference Kresse and Furthmüller1996) through the MedeA graphical interface (Materials Design, 2024). The calculation was done on 32 cores of a 144-core (768 GB memory) HPE Superdome Flex 280 Linux server at North Central College. The calculation used the GGA-PBE functional, a plane wave cutoff energy of 400 eV, and a k-point spacing of 0.5 Å−1, leading to a 2 × 2 × 2 mesh, and took ~17 hours. Single-point density functional calculations (fixed experimental cell) and population analysis were carried out using CRYSTAL23 (Erba et al., Reference Erba, Desmarais, Casassa, Civalleri, Donà, Bush and Searle2023). The basis sets for the H, C, N, and O atoms in the calculation were those of Gatti et al. (Reference Gatti, Saunders and Roetti1994), whereas the basic set for the S atom was that of Peintinger et al. (Reference Peintinger, Oliveira and Bredow2013). The calculations were run on a 3.5-GHz PC using eight k-points, and the B3LYP was functional and took ∼4.7 hours.
III. RESULTS AND DISCUSSION
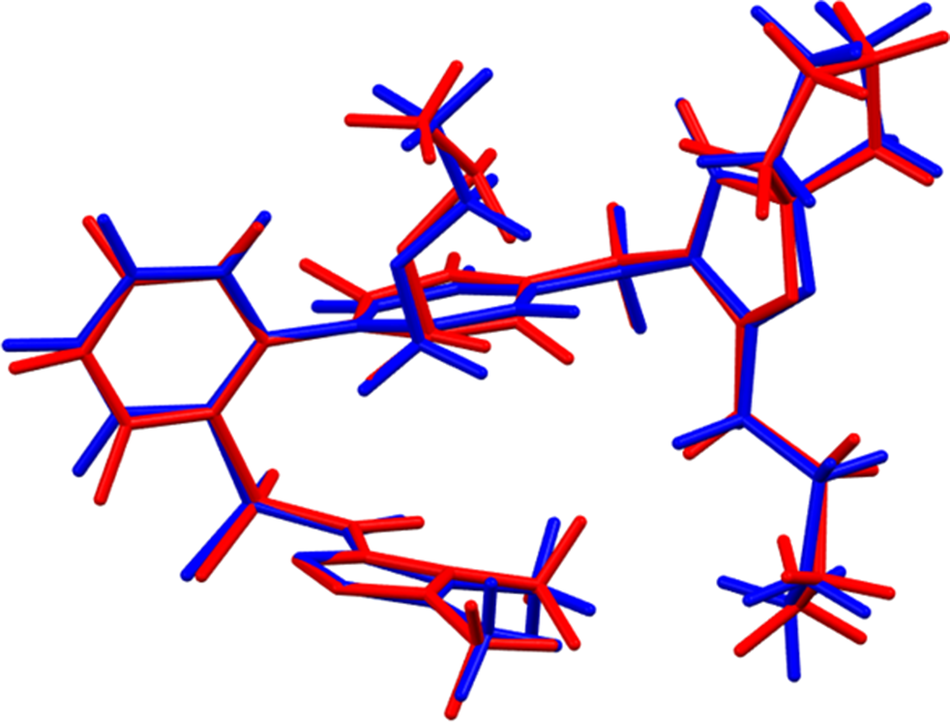
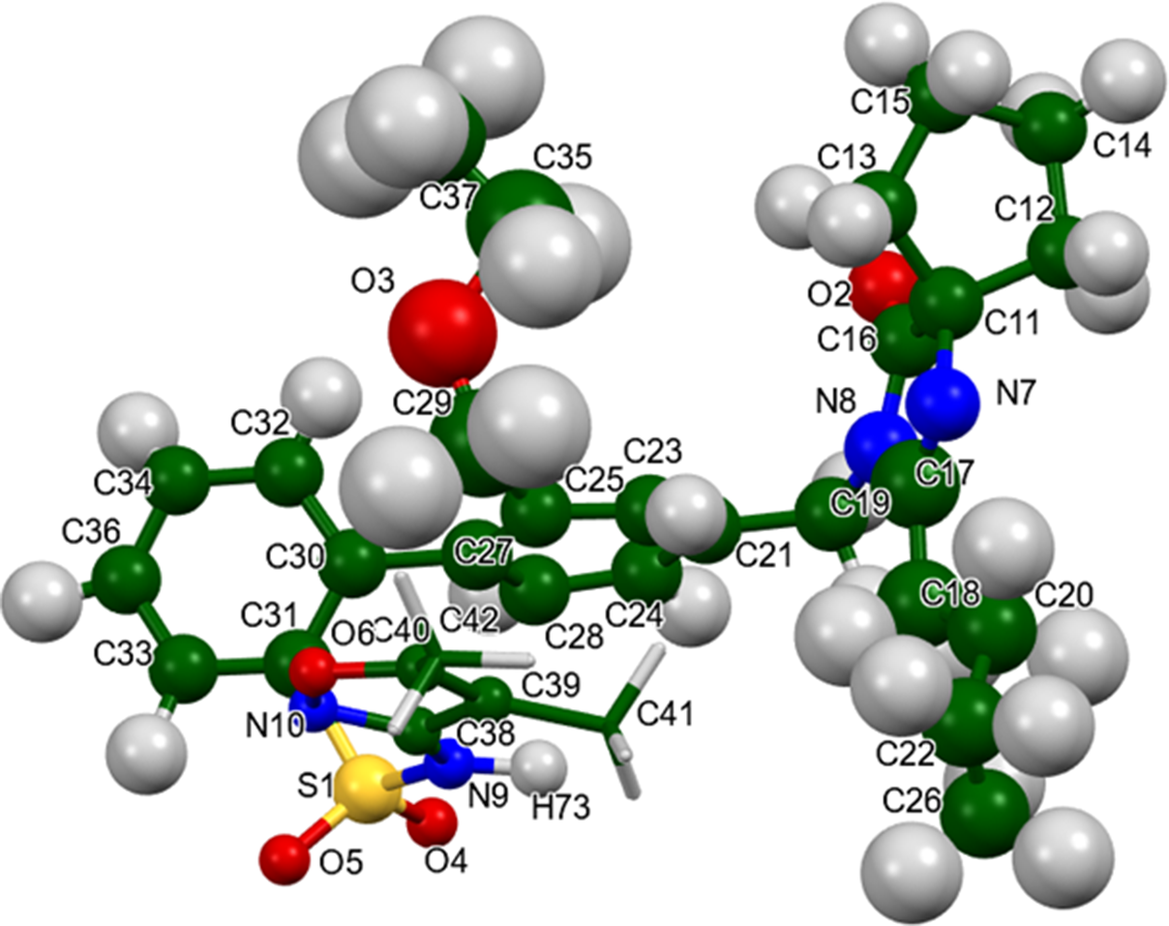
The root-mean-square Cartesian displacement of the non-H atoms in the Rietveld-refined and VASP-optimized molecules is 0.228 Å (Figure 3). The agreement is within the normal range for correct structures (van de Streek and Neumann, Reference van de Streek and Neumann2014). The largest difference is 0.492 Å at C20. The asymmetric unit is illustrated in Figure 4. The remaining discussion will emphasize the VASP-optimized structure.
Comparison of the Rietveld-refined (red) and VASP-optimized (blue) structures of sparsentan. The root-mean-square Cartesian displacement is 0.228 Å. Image generated using Mercury (Macrae et al., Reference Macrae, Sovago, Cottrell, Galek, McCabe, Pidcock and Platings2020).
The asymmetric unit of sparsentan, with the atom numbering. The atoms are represented by 50% probability spheroids. Image generated using Mercury (Macrae et al., Reference Macrae, Sovago, Cottrell, Galek, McCabe, Pidcock and Platings2020).
Almost all of the bond distances and bond angles fall within the normal ranges indicated by a Mercury/Mogul Geometry check (Macrae et al., Reference Macrae, Sovago, Cottrell, Galek, McCabe, Pidcock and Platings2020). Only the C38–C39–C40 angle of 102.9° (average = 104.5(4)°, Z-score = 3.7) is flagged as unusual. The standard uncertainty on this average is exceptionally low, inflating the Z-score. Torsion angles involving rotations about the C31–S1 and C38–N9 bonds are flagged as unusual. These lie on tails of bimodal distributions, and so are unusual, but not unprecedented.
Quantum chemical geometry optimization of the isolated molecule (DFT/B3LYP/6-31G*/water) using Spartan ‘24 (Wavefunction, 2023) indicated that the observed conformation is 295.1 kcal/mol higher in energy than a local minimum, which has a very similar conformation. The major difference is in the orientation of the C18–C20–C22–C26 butyl chain. The global minimum-energy conformation is 248.7 kcal/mol lower in energy, and has a very different conformation, showing that intermolecular interactions are important in determining the solid-state conformation.
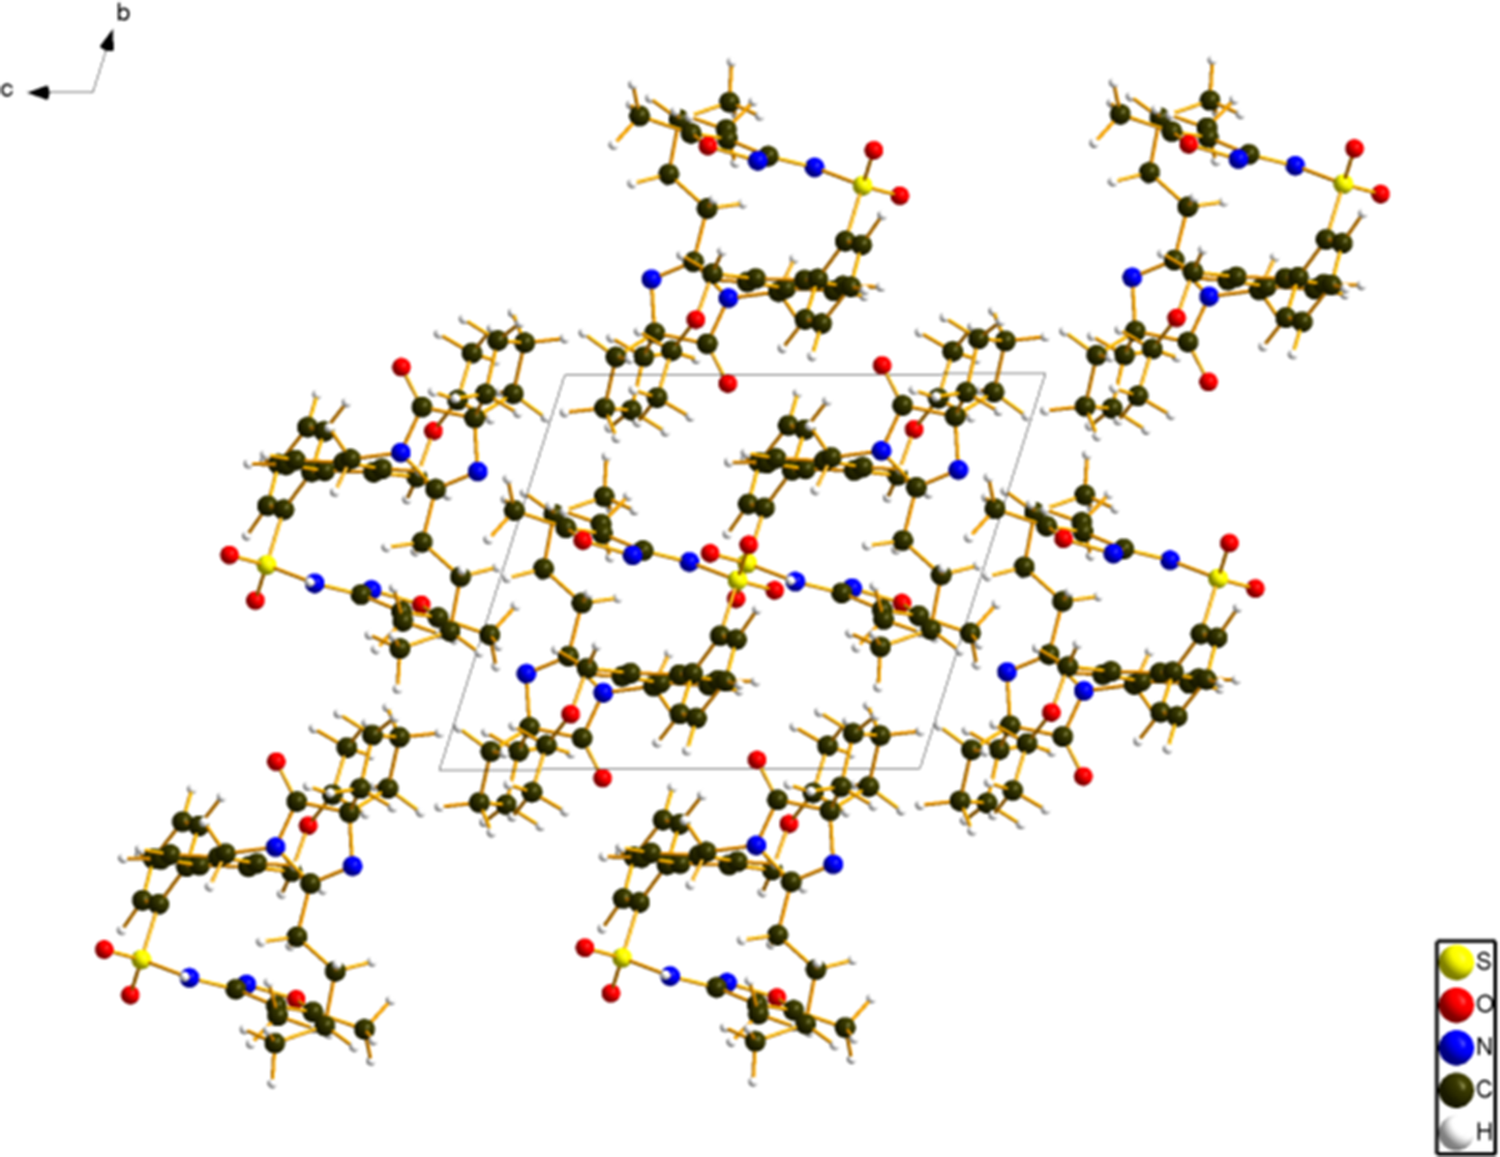
The crystal structure (Figure 5) consists of an isotropic packing of dimers of sparsentan molecules. There is apparently a small void (probe radius = 1.2 Å) at the origin, of 0.7% of the cell volume. Placing an atom there led to zero refined occupancies. The Mercury Aromatics Analyser indicates two strong phenyl–phenyl interactions, with a distance of 5.01 Å, and two medium-strength interactions, at 6.46 and 6.96 Å.
The crystal structure of sparsentan, viewed down the a-axis. Image generated using Diamond (Crystal Impact, 2023).
Analysis of the contributions to the total crystal energy of the structure using the Forcite module of Materials Studio (Dassault Systèmes, 2023) indicates that angle distortion terms dominate the intramolecular energy. The intermolecular energy is dominated by electrostatic repulsions, which in this force field-based analysis also include hydrogen bonds. The hydrogen bonds are better discussed using the results of the DFT calculation.
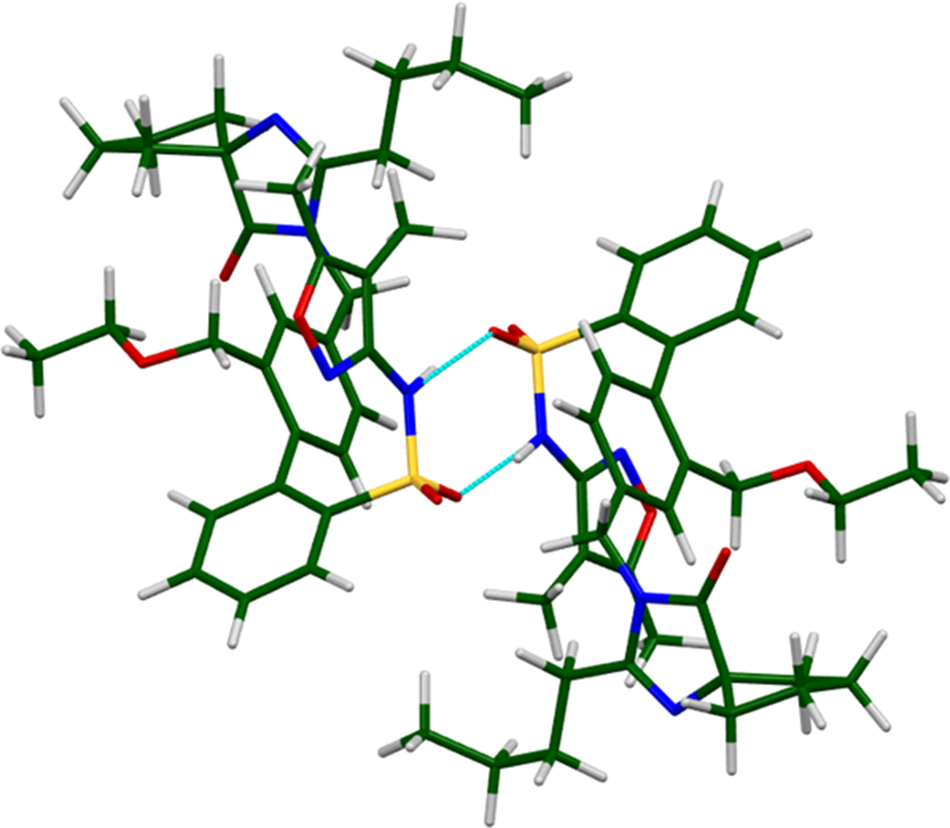
There is one classical hydrogen bond in the structure (Table I), N9–H73···O4. Two of these link the molecules into centrosymmetric dimers (Figure 6), with a graph set (Etter, Reference Etter1990; Bernstein et al., Reference Bernstein, Davis, Shimoni and Chang1995; Shields et al., Reference Shields, Raithby, Allen and Motherwell2000), R2,2(8). The energy of this typical N–H···O hydrogen bond was calculated using the correlation of Wheatley and Kaduk (Reference Wheatley and Kaduk2019). Several intra- and intermolecular C–H···O and C–H···N hydrogen bonds also link the molecules. Although individually weak, their sum contributes significantly to the crystal energy.
Hydrogen bonds (CRYSTAL23) in sparsentan
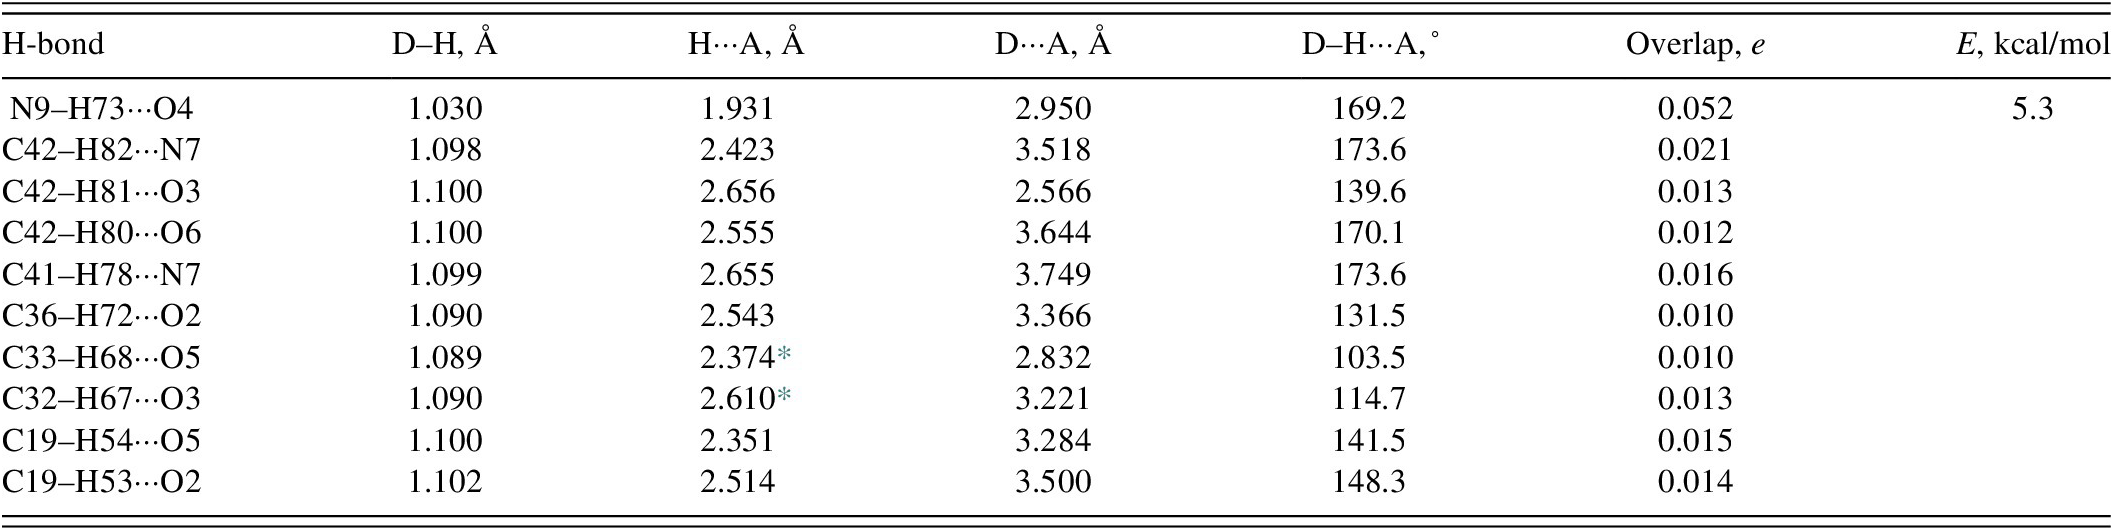
* Intramolecular.
The hydrogen-bonded dimers in sparsentan. Image generated using Mercury (Macrae et al., Reference Macrae, Sovago, Cottrell, Galek, McCabe, Pidcock and Platings2020).
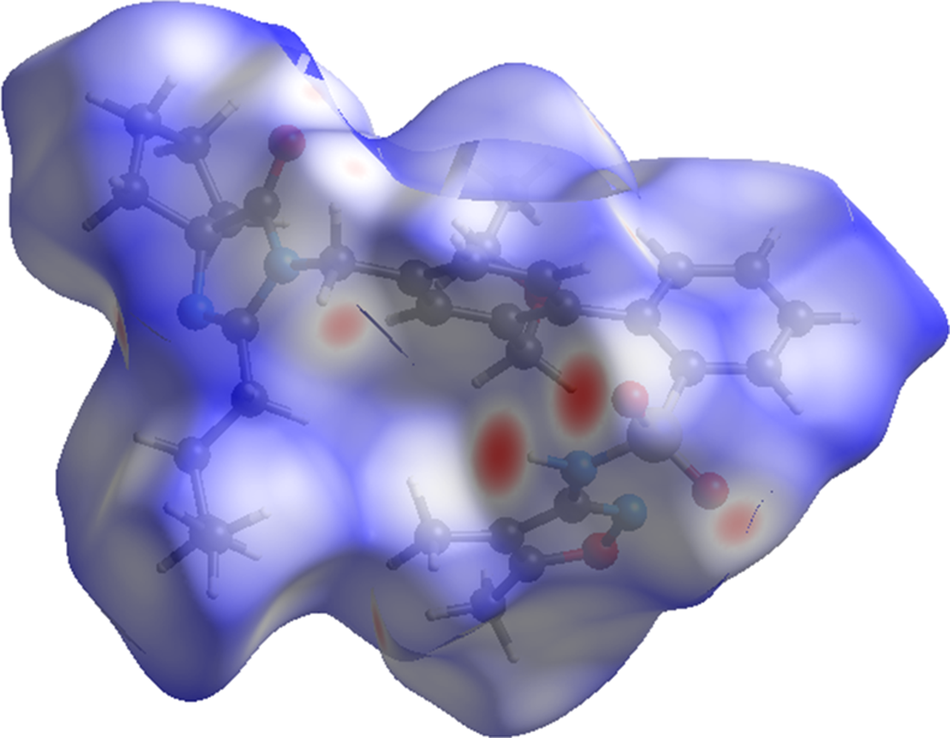
The volume enclosed by the Hirshfeld surface of sparsentan (Figure 7, Hirshfeld, Reference Hirshfeld1977, Spackman et al., Reference Spackman, Turner, McKinnon, Wolff, Grimwood, Jayatilaka and Spackman2021) is 790.47 Å3, 98.85% of half the unit cell volume. The packing density is thus fairly typical. The only significant close contacts (red in Figure 7) involve the hydrogen bonds. The volume per non-hydrogen atom is larger than normal, at 19.0 Å3, consistent with the presence of the small void.
The Hirshfeld surface of sparsentan. Intermolecular contacts longer than the sums of the van der Waals radii are colored blue, and contacts shorter than the sums of the radii are colored red. Contacts equal to the sums of radii are white. Image generated using CrystalExplorer (Spackman et al., Reference Spackman, Turner, McKinnon, Wolff, Grimwood, Jayatilaka and Spackman2021).
The Bravais–Friedel–Donnay–Harker (Bravais, Reference Bravais1866; Friedel, Reference Friedel1907; Donnay and Harker, Reference Donnay and Harker1937) algorithm suggests that we might expect isotropic morphology for sparsentan. No preferred orientation model was necessary, indicating that preferred orientation was not significant in this rotated capillary specimen.
IV. DEPOSITED DATA
The powder pattern of sparsentan from this synchrotron dataset has been submitted to the International Centre for Diffraction Data (ICDD) for inclusion in the PDF. The Crystallographic Information Framework files containing the results of the Rietveld refinement (including the raw data) and the DFT geometry optimization were deposited with the ICDD. The data can be requested at pdj@icdd.com.
ACKNOWLEDGEMENTS
Part of the research described in this paper was performed at the Canadian Light Source, a national research facility of the University of Saskatchewan, which is supported by the Canada Foundation for Innovation (CFI), the Natural Sciences and Engineering Research Council (NSERC), the Canadian Institute of Health Research (CIHR), the Government of Saskatchewan, and the University of Saskatchewan. This work was partially supported by the International Centre for Diffraction Data (ICDD). We thank Adam Leontowich for his assistance in the data collection. We also thank the ICDD team – Megan Rost, Steve Trimble, and Dave Bohnenberger – for their contribution to research, sample preparation, and in-house XRD data collection and verification.
CONFLICTS OF INTEREST
The authors have no conflicts of interest to declare.


 Open access