

1. Introduction
Ogives are one of the most enigmatic indicators of glacier flow and are of two main types: wave ogives and band ogives, which often occur in association. Ogives originally caught the attention of glaciologists in the mid-19th century, when the fundamentals of glacier flow were first being established (e.g. Reference AgassizAgassiz, 1840; Reference ForbesForbes, 1859). Despite much subsequent interest in ogives, the literature contains conflicting terminology and is lacking in detailed information regarding their morphology and internal structure. Although the physical principles of wave-ogive formation are well understood, no single theory of band-ogive formation has received universal acceptance.
A variety of terms have been used to describe the series of arcuate light and dark bands that characterize many glaciers with icefalls. Terms such as “Forbes bands” (following Reference ForbesForbes, 1859), “ogives” (Reference LeightonLeighton, 1951), “Alaskan bands” (Reference FisherFisher, 1947) and “wave ogives” (Reference FisherFisher, 1962) have often been used interchangeably. In this paper, the term “band ogive” refers to a single pair of light and dark bands. The term “wave ogive” refers to arcuate glacier surface undulations often found at the base of an icefall.
The nature of “typical” band ogives is difficult to ascertain from the literature, as there are many contradictory observations concerning these features (Table 1). Band ogives consist of alternating light and dark bands. The reason for the colour difference in band ogives is a highly contentious issue. Several hypotheses have been proposed for the genesis of band ogives (Table 1), though none adequately explains their structural attributes.
Summary of hypotheses of ogive formation (based in part on Reference LeightonLeighton, 1951), and the relationships between wave ogives and band ogives. Hypotheses have been simplified to fit this table

Wave ogives form by a combination of variations in ablation and plastic deformation as ice travels down an icefall (Reference NyeNye, 1958, Reference Nye1959; Reference WaddingtonWaddington, 1986). This hypothesis is well founded on physical principles. The exact relationship between band ogives and wave ogives is another contentious issue (Table 1), with few hypotheses that adequately explain both band and wave ogives.
A large tunnel excavated in Bas Glacier d’Arolla, Switzerland (then referred to as Glacier du Mont Collon), is of specific relevance to this study (Reference HaefeliHaefeli, 1951). The tunnel was excavated at the foot of the icefall with an uphill incline of 5° for 202 m, until vertical bedrock was encountered. The ice flowing down over this cliff, “as does a waterfall”, was detached from bedrock in one location by up to 4 m (Reference HaefeliHaefeli, 1951, p.496). On another branch of the tunnel, only a small gap was found. The so-called “bedding” of the ice was parallel to the rock over which it flowed, and some “strata” were impregnated with sand. The exact structures to which Reference HaefeliHaefeli (1951) refers are uncertain, but are likely to be some form of foliation. Dips of the so-called “bedding” were taken along the length of the tunnel, and found to form a pronounced syncline. Haefeli also stressed the high amount of extension occurring in the tunnel close to the rock: some 20% extension in 40 days, with no associated fracturing. Haefeli concluded that the ogives formed in response to differences in speed according to an annual rhythm, resulting in the synclinal folding of strata and the formation of a new pressure wave at the foot of the icefall system each year.
The aim of this paper is to describe the relationships between band ogives and structures such as stratification, foliation, folds and crevasse traces on Bas Glacier d’Arolla, with a view to developing a structurally based model of band-ogive formation. Structural glaciology can potentially offer insight into the dynamics of glaciers and how ice movement changes through time. This paper focuses on band-ogive formation through comprehensive three-dimensional structural mapping of a glacier in the Swiss Alps, using a range of geological and geophysical techniques. It also examines the morphological relationship between band and wave ogives on this glacier, and highlights the need for long-term kinematic data in order to develop a fully integrated model of wave- and band-ogive formation.
2. Field Site
Bas Glacier d’Arolla is situated at the southern end of the Val d’Hérens, Valais, Switzerland, below the foot of Mont Collon (Fig. 1). It is a glacier tongue, fed from Glacier du Mont Collon (the name given to the area above the icefall), and from ice and snow avalanches from the hanging glaciers on Mont Collon’s summit. It was also previously fed by its well-researched partner, Haut Glacier d’Arolla, but they became separated some time between 1930 and 1948. Bas Glacier d’Arolla did not obtain its own geographical name until around 1949. For this reason, Bas Glacier d’Arolla has been referred to in previous literature as Glacier du Mont Collon (Reference HaefeliHaefeli, 1951, Reference Haefeli1957). Bas Glacier d’Arolla is ∼1.3 km long and ∼0.6 km wide, and flows from south to north with an average surface slope of 7°. The icefall that connects Glacier du Mont Collon to Bas Glacier d’Arolla drops from an altitude of ∼2940 m to ∼2460 m at an average angle of ∼28°. Glacier du Mont Collon reaches a height of 3716 m and covers approximately 6 km.
(a) Location map for Bas Glacier d’Arolla. (b) Enlargement of glacier below the icefall, showing the location of two ground-penetrating radar profiles (A and B) location of sediment samples L1–L4, location of “gully”, crevasses and other features referred to in the text.

Bas Glacier d’Arolla was known to be advancing between 1972 and 1990 (Reference WarburtonWarburton, 1990), but is currently receding. A large rockfall from the cliffs of Mont Collon fell onto the glacier in 1995 (Fig. 1a). Previous research on Bas Glacier d’Arolla is restricted to Haefeli’s observations on flow and ogive formation in 1951 and 1957, a brief examination of its foliation by Reference HambreyHambrey (1977) and more recent work on its proglacial streams (e.g. Reference WarburtonWarburton, 1990, Reference Warburton1992).
3. Methodology
Mapping of structures on the glacier was undertaken using structural geological techniques, with a compass–clinometer to obtain strikes, dips and dip directions. Band ogives are numbered from ogive 1 at the foot of the icefall to ogive 27, the last distinguishable ogive towards the glacier snout (Fig. 1a). The spacing of structural measurements depended on the regularity of the structure being measured. Foliation was typically measured five times at four locations across each dark and light band that comprises one ogive, resulting in 40 foliation readings for each complete band ogive. Fold-axis orientations were much less visible, and were thus measured only wherever a clear example was found. Crevasses and crevasse traces are uncommon in the glacier tongue, and again were measured only where observed.
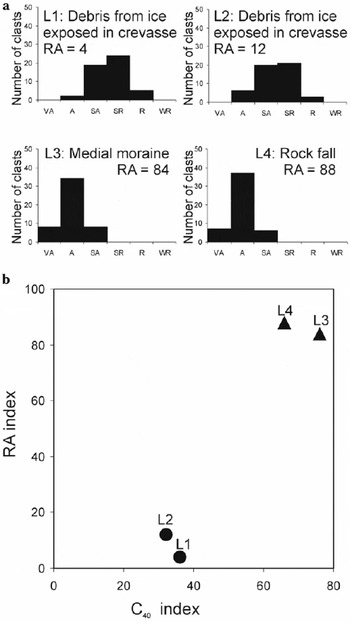
Clast roundness and an RA/C40 plot of samples of 50 pebble-sized clasts were also determined using the approach of Reference Benn and BallantyneBenn and Ballantyne (1994). Roundness histograms facilitate comparison with data from other glacial environments where the mode of transport has been observed. Roundness was estimated visually using the six roundness classes according to Reference KrumbeinKrumbein (1941) and Reference PowersPowers (1953). RA index is the percentage of angular and very angular clasts in a sample. High RA values imply passive transport of rockfall-derived debris, and low RA values imply either transport in the zone of traction at the base of the glacier, or reworking of previously rounded debris (Reference Benn and BallantyneBenn and Ballantyne, 1994). The samples were also plotted on a RA/C40 plot, which is a powerful means of differentiating between transport histories (Reference Benn and BallantyneBenn and Ballantyne, 1994). An RA/C40 plot is a covariant plot of RA index and C40 index. The C40 index is the percentage of clasts with a c/a axial ratio of ≤0.4.
Ice characteristics were recorded for both the light and dark bands of ogives 6, 14 and 23. Weathered surface ice was removed in a 2 m linear strip in the western, central and eastern area of each band, and underlying crystals were described in terms of colour, crystal size, bubble content and the percentage of the strip consisting of blue bubble-free or white bubble-rich ice.
Ground-penetrating radar (GPR) data were obtained during January 2000 and January 2001. The data were collected in winter to minimize reflections caused by the presence of liquid water at the ice surface and within the glacier, a factor that decreases the penetration depth of the radar (Reference Macheret, Moskalevsky and VasilenkoMacheret and others, 1993; Reference Arcone, Lawson and DelaneyArcone and others, 1995). Data were collected using a sledge-mounted “Sensors and Software Pulse Ekko 100” GPR system with 100 MHz antennae. During constant-offset surveys, the antennae were fixed 1 m apart. The system was programmed to stack 128 traces, for a time window of 1200 ns and a sampling interval of 1600 ps. Data were collected at 60 cm intervals ±1 cm along compass bearings, and positions were checked regularly by GPS. A number of transects, a grid system and central midpoint (CMP) surveys were undertaken. The locations of the profiles used in this paper are marked in Figure 1b. Data were collected with both “broadside” and “inline” antennae orientations. Topographic correction has not been applied to the profiles presented in this paper, as most of the glacier tongue has a gradual, continuous rise of ∼7°. The profiles do not pass over “wave-ogive topography”. As they cross no major topographic variations, the uncorrected profile does not significantly affect the appearance or interpretations of the section, but merely increases or decreases the apparent dip of reflection surfaces (e.g. a reflector with an apparent upslope dip of 40° has a true dip of 33°, and an apparent downslope dip of 40° has a true dip of 47°). During profile interpretation, an average velocity of 0.167 m ns−1 is applied for the propagation of radar waves into the glacier.
From analysis of CMP surveys (not presented here) it was found that the velocity of the propagating radar wave was spatially non-uniform, varying with depth, the type of ice being crossed and possibly the orientation of the CMP survey. The phenomenon of non-uniform velocity of radar wave propagation has been recognized by Reference Murray, Stuart, Fry, Gamble and CrabtreeMurray and others (2000), who described how differing water content causes such a problem. At Bas Glacier d’Arolla, the differences are far larger and are also likely to stem from debris content and ice type. Since the propagation of radar waves was inhomogeneous within the glacier, an accurate velocity structure was not determined, and transects are therefore presented as unmigrated data.
4. Surface Observations of Band Ogives
The nature of the band ogives
The band ogives of Bas Glacier d’Arolla first appear at the foot of the icefall. The “light” ogive bands appear as white to light blue, or white to light brown (depending on weather conditions; see below). The “dark” ogive bands appear as a darker shade of blue or brown. The colour difference between light and dark bands does not fully develop until some distance down-glacier of the foot of the icefall, at about ogive 3 (ogive numbers are given in Fig. 1b). This enhanced colour differentiation coincides with the declining relief of the wave ogives. The boundaries between the light and dark bands are diffuse (Fig. 2), a feature apparently noted previously only by Reference LeightonLeighton (1951). Within the light bands there are thinner zones of “dark highly foliated ogive”, with a higher concentration of surface debris. Similarly, there are zones of light ogive within predominantly “dark” ogive bands (Fig. 2).
Diffuse boundaries of ogives in the lower section of Bas Glacier d’Arolla. Zones of “dark” ogive within dominantly “light ogive” and vice versa, are clearly visible. Width of exposed glacier surface ∼200 m.

Ogive widths are 12–51 m, with a general but irregular decrease in width down-glacier (Fig. 3). The dark bands are 6.6–29.5 m wide, and the light bands 4.4–30 m wide. Thick dark bands do not necessarily coincide with thin white bands and vice versa (Fig. 3).
Ogive widths, total ogive widths and widths of light and dark zone of each ogive. Ogive numbers correspond to the ogive numbers in Figure 1.

Natural cross-sections of band ogives
A natural cross-section at a gully cut into the first band ogive at the base of the icefall (Fig. 1b) revealed crevasse traces and sedimentary stratification, which was displaced several tens of centimetres on either side of crevasse traces. Within the cross-section provided by the gully, some areas had a higher intensity of crevasse traces than surrounding areas. Two crevasses on the west side of the glacier also revealed oblique cross-sections through dark ogive bands, exposing alternating zones of fine-grained, white ice and folded, sediment-rich dark ice. This sediment-rich ice was traced to accumulations of debris on the glacier surface, as described below.
Debris content and crystal structure of band ogives
One of the most striking differences between the light and dark ogive bands is that the darker bands are characterized by a higher density of foliae (consisting of coarse, bubble-free blue ice) and more surface debris. This surface debris comprises fine sand to mud-sized particles (Fig. 4), with a high content of dark, organic material (particles of grass, moss, leaf, pine needle and insect). When the weathered surface of the ice is removed, no visible debris is left (Fig. 4). Similarly, after heavy rainfall, the glacier is effectively washed clean of this surface debris. However, it is uncertain if low concentrations of debris are actually present within the ice, as no direct measurements were made. On cleaned surfaces, the foliation appears as thin layers of coarse crystalline bubble-poor blue ice (∼4 cm increasing down-glacier to 6 cm crystal diameter) within finer crystalline white ice (0.5 cm increasing down-glacier to 3 cm diameter). The foliae comprising coarse, bubble-poor ice are more common in the dark ogive bands than in the light bands, eventually dominating light and dark bands down-glacier. For example, in ogive 6, the light band consists of an average 25% by width of blue, coarse foliation-type ice, compared with 60% by width in the dark ogive band. This increases to 60% coarse blue ice in the light band and 90% in the dark band of ogive 23. The differences in ice type cause variations in the albedo of the glacier surface. The difference in ice-type concentrations is best observed from a distance after heavy rainfall when superficial debris has been removed; the ogive banding appears as alternating blue and white bands rather than debris-rich dark bands and debris-poor light bands.
Nature of the foliation in the dark zone of an ogive towards snout of glacier (ogive 20) Here foliae are closely packed, with alternating white and blue bands according to ice type. Foliae are closely spaced and no folds are present. A section of ice at left has been scraped clean of weathered surface ice, exposing clean ice underneath. Debris is fine sand and silt.

Sand and gravel-sized surface debris are observed at two locations: (i) near the west margin of the glacier, in particular in the area around, and down-glacier of, the crevasse field (Fig. 1b), and (ii) at an isolated area ∼150 m up-glacier of the glacier snout. The shape distribution for two of the clast samples collected is presented in Figure 5, along with comparative samples and a RA/C40 plot. This predominantly sub-angular/sub-rounded material emerges in situ from discrete layers of debris-rich ice at the crevassed area on the western margin of the glacier, both in crevasse walls and from foliation exposed by a supraglacial stream. Again, near the glacier snout, thin debris layers intersect the glacier surface. At these locations, there is no coarse debris above the layer, and below there is washed-down debris. This debris differs from the previously described debris in that it contains coarse clasts, has no obvious organic content, and the clay-rich matrix is a bluish/grey colour. Samples of thinly stratified, bubble-free ice were also extracted from the area around the crevasses (Fig. 6). This ice shows fine debris layers between clear ice layers, as well as the occasional inclusion of coarser debris, in this case a sub-rounded clast of 3 cm diameter.
(a) Clast-roundness data and (b) RA/C40 plot for four sets of 50 clasts taken from glacier. L1 and L2 are from debris-rich foliation-parallel ice exposed in a dark ogive band by crevassing on western margin of the glacier, L3 is from a medial moraine exposed in central part of glacier and L4 is from 1995 rock fall on central part of glacier. Sample locations are shown in Figure 1b, as L1–L4.
Close-up view of ice removed from part of foliation-rich dark band exposed at surface of glacier, next to crevasses on western margin of the glacier. The ice is finely stratified, with sand and silt in between each layer. In middle-left section of ice sample is an in situ sub-rounded pebble.

Relationship between band ogives and wave ogives
The first recognizable wave ogive at Bas Glacier d’Arolla forms the lowest part of the icefall. The waves can be traced with certainty to ogive 8, after which the glacier surface is smoothed to a uniform slope by ablation. The relationship between the wave ogives and the light and dark band ogives is best observed after heavy rainfall, which “cleans” the glacier of temporary surface debris, exposing the banding. The dark bands of the ogives are then observed to coincide with the relatively steep, down-glacier slope of the wave ogives.
5. Structural Sequence
To help understand the structural history of the glacier, several stages of deformation can be distinguished on the basis of cross-cutting relationships (cf. Reference Hambrey and MilnesHambrey and Milnes, 1977). Planar structures are termed S0–S2, in order of formation, and fold phases F1 and F2, according to conventions in structural geology. The structural notation used for Bas Glacier d’Arolla is summarized below:
S0 Sedimentary stratification derived from snowfall
S1 Crevasses and crevasse traces
S2 Transverse foliation
F1 Folds formed before or during the descent of the icefall
F2 Folds having an axial planar relationship with the transverse foliation below the icefall
Structural maps of S2 and F2 are presented in Figures 7 and 8, respectively.
Foliation measurements from glacier, presented in Schmidt lower-hemisphere equal-area projections. Each point represents the stereographic projection of a line perpendicular to the plane of foliation (poles to planes). Each stereogram represents measurements taken in both light and dark part of each ogive. “End” marks the disappearance of ogives near snout.

Structural maps of measured fold axes of glacier, on dark and light zones of each ogive. Alongside are plunges of folds presented in Schmidt lower-hemisphere equal-area projections.

Sedimentary stratification (S0)
The earliest formed structure found at Bas Glacier d’Arolla is the remnant of sedimentary stratification, recognized on the basis of decimetre-thick layers of dirty coarse granular ice. Stratification comprises laterally continuous (except where cut by crevasses and crevasse traces) alternating thick light and thin dark bands in the gully in ogive 1 (Fig. 1b) at the base of the icefall. The sedimentary stratification, originating in the upper reaches of Glacier du Mont Collon, has survived passage through the icefall.
Folding (F1)
Where sedimentary stratification (S0) is first observed in the accessible part of the glacier, above the base of the icefall, it has already been gently folded (F1) into large open folds with fold axes approximately parallel to ice flow.
Crevasses and crevasse traces (S1)
During descent through the icefall, the ice becomes heavily crevassed. Aerial photographs indicate that the principal set of crevasses is orientated transverse to flow, with some crevasses also forming parallel to flow. The icefall is highly dynamic; crevasses and crevasse traces form throughout its height. Older structures, notably stratification (S0), are displaced by up to 30 cm by these fractures, most often on the down-glacier side.
The remnants of these crevasses appear as crevasse traces at the base of the icefall. Most (∼95%) of the crevasse traces appear as coarse-grained recrystallized blue ice, typical of meltwater freezing within crevasses (Reference Hambrey and MüllerHambrey and Müller, 1978). In addition, some crevasse traces (∼5%) are recognized as white, granular ice infills, appearing almost like firn, which may represent the remnants of snow-filled crevasses.
The distribution of crevasses and crevasse traces is non-uniform on two scales:
-
1. Observations from aerial photography demonstrate areas of more intensely crevassed ice occurring laterally across the icefall, separated by areas of less intense crevassing, on a scale of tens of metres.
-
2. The gully across ogive 1 exposes zones with a higher population of crevasse traces within relatively crevasse-trace-free ice, on a scale of metres.
The inclination of the crevasse traces partly depends on their position in the ogive. The cross-section through the gully in ogive 1 shows crevasse traces at a shallower angle (typically 65°) on the steep slope above the plateau of ogive l. They are then rotated to a near-vertical angle in the plateau of ogive 1, before declining to a lesser angle again on the steep slope of the down-glacier end of ogive 1.
A few longitudinal crevasse traces were found between the base of the icefall and ogive 4. These longitudinal crevasse traces were always infilled with white, fine-grained firn-like ice, and are progressively folded with distance from the icefall.
Transverse foliation (S2)
Bas Glacier d’Arolla is dominated by transverse, or arcuate, foliation (Figs 2, 4 and 7). The transverse foliation originates from a combination of transverse crevasse traces and transverse sedimentary stratification. There is a gradual transition from the earlier structures (S0 and S1) to later structures (S2), between the lower reaches of the icefall and ogive 6 (up to which point there is some inconsistency in foliation dip and orientation (Fig. 7)). Except for the presence of ogives, this transition is typical of other glaciers with icefalls (e.g. Griesgletscher, Switzerland (Reference Hambrey and MilnesHambrey and Milnes, 1977)). At the foot of the icefall, foliation is generally widely spaced (e.g. one folia on average every 0.1–0.2 m). By ogive 16, spacing is reduced to one folia per centimetre in some dark ogive zones (Fig. 6). All foliation measured has a strong east–west orientation, and dips to the south (up-glacier). During its journey down the glacier, the foliation becomes progressively less steeply dipping (Fig. 7).
Folding (F2)
F2 folds initially have an open style at the foot of the icefall, with fold axes aligned with the ogives, and plunging up to 56°. During travel, the folds become tighter chevron folds, and their fold axes plunge less steeply (Fig. 8). Stereographic projections (Fig. 8) also show that fold axes in the dark ogive zones are generally less steeply plunging than those in the light ogive zones. The fold axes are orientated transverse to flow, and have an axial planar relationship with ogive foliation (S1). Fold geometry typically changes down-glacier from open chevron folds to tight, almost isoclinal folds and sheath folds (Fig. 9), with limbs merging into the rest of the transverse foliation. No fold axes were recognized down-glacier of ogive 19.
The progressive nature of folding from (a) open chevron folds at the base of the icefall (taken from ogive 2) to (b) tighter chevron folding (taken from ogive 8), to (c) tight sheath folding (taken from ogive 10), indicated by arrow. Glacier flow is from top to bottom in all three cases.

6. Internal Structure from GPR
The GPR profiles demonstrate four main characteristics (Fig. 10):
GPR profile A (broadside antennae orientation) and B (inline antennae orientation) with enlarged areas of deatil, and interpretation below. Glacier flow is from right to left. Ogive numbers are given in the interpretation below each profile can be found in Figure 1b

1. Semi-continuous reflectors at depth (basal reflectors)
Both profiles have a relatively continuous, undulating basal reflector. The reflector is clearer and more continuous on profile B (Fig. 10). On both profiles, this basal reflector steadily deepens from the snout, to a maximum of ∼1000 ns (84 m) on profile A and ∼950 ns (80 m) on profile B, both below ogive 13. The reflector then rises again, to 900 ns (75 m) on profile A and 800 ns (67 m) on profile B, both below ogive 6 (depths are relative to ice surface).
2. Alternating reflection-rich and reflection-poor areas
Near the surface of the profile, a series of alternating reflection-rich areas and reflection-poor areas gives what appears to be a series of ridges and troughs. However, these features do not have a surface expression, and are related to internal structure only; the profiles were not extended to cover the wave ogives. The “ridges”, or reflection-rich sections, are dominated by near-surface reflections and hyperbolae. The distances between the tops of adjacent “ridges” vary, but they typically occur at ∼30 m intervals. In contrast, the “troughs”, or reflection-poor areas, occur where there is some depth of penetration before any reflector is met. These reflection-free areas reach ∼240 ns (20 m) depth below the glacier surface, below which the surrounding reflection-rich areas converge. Towards the snout of the glacier, the separation between reflection-rich and reflection-poor areas becomes less obvious as the reflection-rich areas overlap. Towards the icefall, there is reflection-free ice above the reflection-rich areas, reaching a maximum of 100 ns (8 m).
3. Up-glacier-dipping reflectors
These features are best observed on profile A. They can also be observed in the up-glacier end of profile B. These reflectors dip up-glacier at 30–50° (or up to 7° less after topographic correction). They begin within the main body of the glacier, and do not continue to the glacier surface. Some can be traced for a long distance from within the top of the “reflection-rich sections” to close to the basal reflective layer. Their dip becomes slightly shallower at depth.
4. Down-glacier-dipping reflectors
Down-glacier-dipping reflectors are best observed on profile A, although they can still be observed on profile B. These reflectors are less continuous, typically extending over 20–40 m, at angles of 30–50°. They appear to cross-cut up-glacier-dipping reflectors.
7. Interpretation of GPR Data
Differences between antennae orientations
The “inline” and “broadside” antennae profiles demonstrate different features. Broadside antennae orientation (Fig. 10, profile A) has enhanced internally dipping features, whereas inline data collection (Fig. 10, profile B) has enhanced the quality of data at depth. In addition, the near-surface “reflection-poor” areas appear deeper and “cleaner” during inline data collection. The differences in data are related to the preferential orientation of structural features within the ice relative to the polarization of the radar signal (Reference NobesNobes, 1999). Reference NobesNobes (1999) found that the basal ice/rock reflection at Franz Josef Glacier, New Zealand, is clearer when antennae are axially orientated with respect to the direction of glacier flow, but obscured by internal reflections when antennae are transversely orientated to flow. The same effect appears to be true for Bas Glacier d’Arolla. Again, as found by Reference NobesNobes (1999), transversely orientated antennae pick out more internal reflectivity than axially orientated antennae. Reference NobesNobes (1999) accounted for increased internal reflectivity with transversely orientated antennae as the product of reflections from crevasses and “crevasse remains extending to great depths”, which are orientated transverse to flow. A comparable structure on Bas Glacier d’Arolla would be the multiple foliation planes, many originating from crevasse traces, which are also perpendicular to glacier flow.
Basal reflectors
The deep semi-continuous reflectors are interpreted as reflection from the base of the glacier, either the ice/bedrock or ice/sediment interface. Care must be taken with this interpretation since some authors (e.g. Reference Arcone, Lawson and DelaneyArcone and others, 1995; Reference Murray, Gooch and StuartMurray and others, 1997) have interpreted basal reflectors as the transition between relatively clean, englacial ice and debris-rich basal ice, which masks the true ice/bedrock interface. Reference Arcone, Lawson and DelaneyArcone and others (1995) defined their basal reflector at Matanuska Glacier, Alaska, U.S.A., as having “numerous hyperbolic diffractions rather than by any continuous reflector”, which is what may be expected from debris-rich ice. By contrast, Reference Nobes, Leary, Hochstein and HenrysNobes and others (1994) interpreted a “clear basal reflection” at Tasman and Mueller Glaciers, New Zealand, as a junction between lodgement till and glacier ice. Both of these studies involved temperate glaciers. Ideally, as demonstrated by Reference Murray, Gooch and StuartMurray and others (1997) on the polythermal surge-type glacier Bakaninbreen, Svalbard, borehole data are needed to determine the true nature of the reflective layer. At Bas Glacier d’Arolla, the reflector is more likely to be the ice/bed interface because it is continuous rather than comprising a number of hyperbolae.
Alternating reflection-rich and reflection-poor areas
The nature and spacing of the contrasting reflection-rich and reflection-poor areas suggests that these features are band ogives. A schematic interpretation of the relationship between the radar data and the band ogives and foliation of the glacier is presented in Figure 11. The reflection-free areas are interpreted as the light ogive bands, whilst the reflection-rich areas are interpreted as coinciding with the dark ogive bands. Although at the time of data collection the precise position of light or dark bands was not known because of snow cover, this inference was tested by locating tracer pebbles, which were left during the winter field season and recovered in the summer. The light bands allow reflection-free penetration, which may be accounted for by the relative lack of foliation within the light bands. In contrast, the foliation-rich dark bands provide ample reflectors because of changes in ice properties across foliation boundaries (Fig. 11).
Schematic representation of three-dimensional structure for a segment of ice from icefall to snout along central flowline, illustrating structural relationships and development of ogives. The inset boxes provide a schematic interpretation of the relationship between the radar data and the ogives and foliation of the glacier.

The irregular widths of the reflection-rich and reflection-poor areas relate to the irregular width of the band ogives (Fig. 3). Their irregular behaviour towards the snout is explained by the fact that, this close to the snout, the band ogives “merge” into one dirt-covered foliation-rich mass.
Up-glacier-dipping reflectors
The up-glacier-dipping structures dip at an angle similar to (or slightly lower than) the measured foliation (Fig. 7), and thus to the ogives as a whole. One possible explanation is that the up-glacier-dipping reflectors represent reflections from ice types of different properties within a band ogive, such as the boundary between different individual foliae (Fig. 11).These boundaries could be caused by faulting along the foliae. The fact that some of the reflectors can be traced to considerable depth, possibly to the base of the glacier, demonstrates that they are significant features within the ice, and, given their angle of dip, possibly even shear zones.
Down-glacier-dipping reflectors
The origin of the down-glacier-dipping reflectors is unclear, there being no surface expression. Possible explanations include:
-
1. An additional structural feature (e.g. back-thrusts or Riedel thrusts associated with shearing)
-
2. Reflection from englacial watercourses (air-filled at the time of survey) as described by Reference Arcone and YankielunArcone and Yankielun (2000)
-
3. Thin layers of englacial sediments, as described by Reference Murray, Gooch and StuartMurray and others (1997).
8. A Structurally Based Model of Band-Ogive Formation
Here we develop a conceptual model of ogive formation for Bas Glacier d’Arolla, based on our assessment of the structural evolution of the glacier. The model explains how the foliation that constitutes band ogives evolves from stratification, folds, crevasse traces and other planar structures. It also provides possible explanations for the presence of the alternating light and dark bands, the presence of debris associated with the dark bands and the origin of the highly foliated dark bands. An attempt is also made to relate these explanations to the formation of annual wave ogives.
Interpretation of the structural evolution of Bas Glacier d’Arolla
The structural evolution of Bas Glacier d’Arolla initially involves the formation of sedimentary stratification (S0) on Glacier du Mount Collon, which is gently folded. This early folding may occur in response to confining pressure as the ice is fed into the icefall, or it may occur during its descent of the icefall, as the ice moves over bedrock obstacles.
Ice flowing down the icefall is thinned because of a change in gradient and associated higher velocities, and is highly crevassed because the ice is undergoing longitudinal extension. Crevasses and crevasse traces (S1) provide planes of weaknesses in the ice, which facilitate the faulting of S0 on its journey down the icefall, resulting in the displacements observed in the gully (in ogive 1, Fig. 1b) at the foot of the icefall.
A reduction in ice velocity at the base of the icefall results in compression, and the progressive folding during phase F2 of S0 and S1 (both transverse and longitudinal crevasses). This takes place from the base of the icefall down-glacier, before eventually transposition results in fold limbs being lost through attenuation within the arcuate foliation (S2). This progression of folding suggests that the zone of compression extends some distance down-glacier of the foot of the icefall. The arcuate foliation (S2) also shows evidence of down-glacier compression with the increase in foliae per unit surface area in conjunction with the general decrease in ogive width. To aid the understanding of this sequence of events, a schematic diagram (Fig. 12) is provided, showing the progressive evolution of structures in plan view, including the evolution of the cumulative strain ellipse.
Schematic diagram showing the progressive evolution of structures in plan view to create the arcuate foliation that constitutes the band ogives at Bas Glacier d’Arolla. The figure represents a parcel of ice moving down the flow centre line. The evolution of the cumulative strain ellipse is also shown.

The up-glacier-dipping reflectors found within the glacier by GPR represent a further structural feature, possibly representing internal transverse foliation, a continuation of the transverse foliation seen at the glacier surface. These planes provide a weakness along which ice can move when under the highly compressive regime at the base of the icefall. A geological similarity would be a series of thrust-faulted blocks stacked upon one another (an imbricate stack), as illustrated in Figure 11. This sort of structural phenomenon would explain how deeper and even basal ice can become exposed at the glacier surface.
The study of the structure of Bas Glacier d’Arolla aids the interpretation of ogive formation, as it has demonstrated that the ice is compressed both at the base of, and down-glacier of, the icefall. The progressive folding of earlier structures explains why the glacier tongue is dominated by arcuate foliation. Also, areas of more intense crevassing may help explain the more intense foliation in the dark bands than in the light bands, and, on a smaller scale, the zones with more intense crevasse traces exposed in the gully at the base of the icefall may help explain why there are zones of “dark” ogive within a predominantly light ogive band (see below).
Origin of alternating light and dark bands
Light and dark colouring of the band ogives is related to differing amounts of dirt cover on the glacier. However, at Bas Glacier d’Arolla, and other glaciers with band ogives, the question arises whether (i) the dirt originates from within the ice, with the dark ogive zones being richer in englacial debris (Reference HaefeliHaefeli, 1951; Reference LeightonLeighton, 1951; Reference PosamentierPosamentier, 1978), or (ii) the dirt is derived from elsewhere and accumulates favourably on some parts of the ogives, i.e. in the troughs of wave ogives (Reference LliboutryLliboutry, 1958; Reference Allen, Kamb, Meier and SharpAllen and others, 1960; Reference King and LewisKing and Lewis, 1961; Reference AthertonAtherton, 1963).
Band-ogive characteristics at Bas Glacier d’Arolla that are relevant to the evaluation of these hypotheses include:
-
(i) After heavy rainfall, the glacier was washed of most surface debris, but the band ogives were still visible when viewed from a distance. This is because the darker ogive bands have more strongly foliated, blue-ice foliation, compared with lighter, foliation-poor bands.
-
(ii) When surface ice is removed, no debris is visible in either light or dark bands (Fig. 4). The presence of debris trapped in surface ice can be explained by differential weathering of ice structures. Dark bands develop a large number of small, dirt-trapping ridges because of variations in albedo and crystal size between the plentiful foliae.
-
(iii) The hypothesis of debris collecting in troughs (cf. Reference King and LewisKing and Lewis, 1961) does not hold for Bas Glacier d’Arolla for various reasons:
-
a. The wave-ogive topography melts to a uniform sloping surface within a short distance of the base of the icefall (beyond ogive 8)
-
b. The light and dark colour differences do not fully develop until some distance from the base of the icefall, once the wave topography has been reduced, which disagrees with the hypothesis of dirt collecting at the foot of the icefall (cf.Reference WashburnWashburn, 1935; Reference King and LewisKing and Lewis, 1961)
-
c. The actual dark bands of the ogives do not strictly coincide with the troughs of the wave ogives, but more with the down-glacier slopes, as observed elsewhere by Reference AthertonAtherton (1963).
-
-
(iv) Although, as explained in (ii), there is no observable debris content in the ice for most of the glacier, isolated cases occur in which coarse debris is clearly associated with the dark bands of the glacier, in particular in the area around the crevasses on the western margin of the glacier. Here, the surface is littered with sediment (described in section 3) emerging from foliated ice. The RA index and position for these samples on the RA/C40 plot contrasts strongly with rock-fall and medial-moraine debris sources from the same glacier and, when compared with other datasets (e.g. Reference Benn and BallantyneBenn and Ballantyne, 1994; Reference Bennett, Hambrey and HuddartBennett and others, 1997), indicates a subglacial source. Also, ice samples extracted from the dark bands in these areas are clearly sediment-rich (Fig. 6). The debris content of the ice, and its thin layering, suggests it is basal ice which has arrived at the glacier surface.
At Bas Glacier d’Arolla, the overall determinant of whether a band is dark or light is the intensity with which it is foliated, leading to (i) an overall blue appearance of “cleaned” ice in dark ogive zones, and (ii) differential weathering which traps the sediment and thus gives the ice in a dark band an overall darker appearance, whether “cleaned” or not. Although debris was found emerging in situ from dark ogive bands, these represent isolated instances of coarse subglacial material reaching the surface at the glacier margin, and only have a local influence on the overall colouring of the band ogives. Elsewhere on the glacier, aeolian sources must be the dominant source of surface debris.
The highly foliated nature of the dark bands
Widely spaced arcuate foliation becomes more closely spaced within a short distance as a result of compression below the icefall. This close spacing coincides with the enhanced colour differentiation between light and dark bands. Below are two possible reasons why the dark bands contain more intense foliation than the lighter bands.
-
(i) One ogive, consisting of a light and a dark band, actually represents a cross-section through the glacier as it comes down the icefall. In this case, the dark band represents ice at depth, which has been brought to the surface during rotation at the base of the icefall (in a manner consistent with Reference HaefeliHaefeli’s (1951) syncline model discussed in the introduction). Ice at depth, whilst thinned by extensional flow and moving relatively rapidly down an icefall, may be capable of forming a “basal foliation”: a number of discrete shear zones at the base of the ice mass, exposed at the surface as a high-intensity suite of foliae. The highly stratified blue bubble-free ice (Fig. 6), extracted at the crevasses on the western margin of the glacier (described in section 4), is evidence for ice of “deep glacier origin” as suggested by Reference PosamentierPosamentier (1978). By contrast, the light part of the ogive represents the upper part of the parcel of ice as it descends, with fewer foliae, resulting simply from transposition of crevasse traces and the original sedimentary layering.
-
(ii) Areas of more intense foliation may form within the icefall. Indeed, observations both from aerial photography and in the longitudinal cross-section observed at the base of the icefall demonstrate zones of higher crevasse-trace intensity adjacent to zones of lesser intensity. These crevasse traces are a major source of foliation down-glacier. Any particular parcel of ice is subject to a number of compressive and extensional phases as it passes down the irregular and complex mass of the icefall. Thus some areas of ice will be more susceptible than others to crevassing. In particular, once an area is crevassed, it is more likely to be the source of later faulting since crevasse traces can be reactivated when they acquire an appropriate orientation (Reference Hambrey and MüllerHambrey and Müller, 1978). One aspect of this hypothesis is that small-scale variations in the number of crevasse traces also explain why there are dark areas within light bands and vice versa.
Mechanisms for band-ogive formation
The process of band-ogive formation that is closest to fitting the observations from Bas Glacier d’Arolla is a variation on the “reverse faulting with associated drag folding” hypothesis (Reference PosamentierPosamentier, 1978, fig. 2), which in turn is a variation of the “shearing hypothesis” first presented by Reference ChamberlinChamberlin (1895). Here, a three-dimensional model, partly based on that of Posamentier, is presented which is consistent with the observations at Bas Glacier d’Arolla (Fig. 11).
Reference PosamentierPosamentier (1978) explained that blue, bubble-free debris-rich or debris-poor ice could indicate deep glacier ice in contrast to light-coloured bubbly ice, which indicates near-surface ice. Posamentier’s “reverse faulting and associated drag folding” model demonstrates how this deeper ice is brought to the glacier surface by reverse faulting as a result of compression at the base of the icefall. However, the “drag folding” hypothesis is not required for Bas Glacier d’Arolla, as all foliation is up-glacier-dipping. Despite this, Posamentier’s model fits other observations concerning the structure of Bas Glacier d’Arolla: compression results in folding of the original sedimentary stratification and crevasse traces at, and down-glacier of, the base of the icefall. Crevasse traces and sedimentary stratification then progressively become more transverse and transform into the arcuate foliation.
One problem with applying Reference PosamentierPosamentier’s (1978) hypothesis is that clearly defined thrust planes would be expected to crop out at the surface of the glacier, whereas at Bas Glacier d’Arolla there are no well-defined boundaries between the light and dark bands. Reference PosamentierPosamentier’s (1978) relatively simple model may be better applied to Bas Glacier d’Arolla using multiple, smaller-scale faulting and shearing (Fig. 11). Instead of having one thrust event associated with each ogive as suggested by Reference PosamentierPosamentier (1978), the presence of numerous, smaller shears within the main shear zone allows duplicated parts of basally derived ice to reach the surface within the mainly white, upper ice band (also previously suggested by Reference LeightonLeighton, 1951). Multiple shearing also explains (i) the presence of numerous up-glacier-dipping reflectors within the GPR section as representing numerous fault planes or shears rather than a few discrete planes, and (ii) why there are zones of “dark ogive” within “light ogive” and vice versa.
The wider application of a structurally based model of ogive formation
Although the model presented in this paper is based solely on observations from Bas Glacier d’Arolla, it satisfactorily explains published observations made at other ogive sites. Specific examples include the isolated concentrations of (often rounded) debris found within the dark ogive bands at both Morsárjökull (Reference Ives and KingIves and King, 1954) and Svinafellsjökull (Reference Ives and KingKing and Ives, 1954) in Iceland, and at East Twin Glacier, Alaska (Reference LeightonLeighton, 1951). These descriptions resemble those of the isolated debris-rich ice cropping out at Bas Glacier d’Arolla, and could also be interpreted as debris-rich basal ice being transported to a higher elevation within a shear zone. The structural glaciology of Bas Glacier d’Arolla is also similar to other glacier tongues dominated by arcuate foliation below an icefall and progressive folding of earlier structures (e.g. Blue Glacier, Washington, U.S.A. (Reference Allen, Kamb, Meier and SharpAllen and others, 1960), Gulkana Glacier, Alaska (Reference RaganRagan, 1969), and Griesgletscher (Reference Hambrey and MilnesHambrey and Milnes, 1977)).
Future work
Although this paper provides a plausible structurally based model of band-ogive formation, further work is required to address the relationship between band and wave ogives. This requires detailed multi-year investigation of the kinematics of glaciers with ogives. Ice velocity, deformation measurements and cumulative strain determinations should also be directed to determining whether the proposed shear hypothesis is valid, in particular if periodic shearing is an annual event related to variations in glacier flow (Reference HaefeliHaefeli, 1951, Reference Haefeli1957; Reference PosamentierPosamentier, 1978). Seasonal variations in velocity might lead to a change in deformation style in which the summer flow leads to seasonal reverse faulting, whereas winter flow does not (Reference PosamentierPosamentier, 1978). This difference may be accentuated by increased meltwater, resulting in reducing friction in the system during the spring and summer (Reference HaefeliHaefeli, 1957). The most obvious time for such a shift in velocity to trigger shearing would be the “spring event”, which has been observed to create large increases in velocity and changes in basal conditions (Reference Iken and BindschadlerIken and Bindschadler, 1986), for example at nearby Haut Glacier d’Arolla (Reference Harbor, Sharp, Copland, Hubbard, Nienow and MairHarbor and others, 1997; Reference Mair, Nienow, Willis and SharpMair and others, 2001). Such an event may also be linked with wave-ogive formation.
Studies by Reference NyeNye (1958, Reference Nye1959) and Reference WaddingtonWaddington (1986) evidently have shown the way wave ogives form. We suggest that the next step in producing a comprehensive model for ogive formation would be to reconcile the different approaches.
9. Conclusions
This investigation of Bas Glacier d’Arolla draws attention to the complexity of deformation within and at the base of an icefall, and offers a mechanism for the genesis of band ogives that may be applicable more widely. Several conclusions can be drawn from this work:
-
(i) GPR can be used to enhance our understanding of the internal structure of glaciers. In this case, the structure of band ogives, the glacier bed and internal dipping reflectors of Bas Glacier d’Arolla has been elucidated.
-
(ii) The main structures at Bas Glacier d’Arolla are sedimentary stratification and crevasse traces which, in turn, are transposed into arcuate, transverse foliation. Folds become tighter down-glacier as a result of longitudinal compression, before becoming an integral part of the foliation.
-
(iii) The colour difference within band ogives can be explained by the intensity of foliation, leading to differential weathering and the presence of small-scale weathered ridges trapping dirt more effectively on the dark, highly foliated areas of the glacier.
-
(iv) Although alternating debris content of ice is not needed to explain the colour difference between light and dark ogive bands, there are isolated examples of debris-rich ice emerging within the dark ogive bands. This strongly foliated ice, containing predominantly sub-angular/sub-rounded clasts, indicates basal transport, and transportation to the glacier surface.
-
(v) A conceptual model developed from the work of Reference PosamentierPosamentier (1978), involving reverse faulting, explains the band ogives at Bas Glacier d’Arolla. This model has been further developed to include multiple shear zones, the transportation of basal debris to the glacier surface in some areas, and higher foliation intensity in the dark ogive bands.
-
(vi) The structurally based model presented in this paper adequately explains previous observations of band ogives at other glaciers.
-
(vii) More work, involving a year-round study of the dynamics and kinematics of an icefall and glacier tongue, is required in order to determine exactly how band ogives are formed annually, and their relationship with wave ogives.
Acknowledgements
B. Goodsell is funded by a University of Wales, Aberystwyth research studentship. Additional fieldwork funding was received from the “Georgina Travers Travel Award”, from The Eagle Ski Club and from the Dudley Stamp Memorial Fund of The Royal Society. Thanks are due to students and staff from Aberystwyth, Glasgow and Cambridge Universities for help with fieldwork, equipment and logistics. We also thank R. Whittington and R. Middleton for advice on radar, C. Bendall for advice on structural geology, and B. Hubbard for general comments. In addition, we acknowledge the detailed and perceptive reviews from referees E. Waddington and P. Knight, and further comments from editors R. Naruse and W. Harrison.


