

The clinical diagnosis of dementia with Lewy bodies (DLB) is based on a set of criteria proposed by the DLB consortium Reference McKeith, Dickson, Lowe, Emre, O'Brien and Feldman1 that establish different levels of certainty (possible DLB and probable DLB). Apart from dementia as a central feature, the criteria specify core features (marked fluctuations in attention and alertness, spontaneous Parkinsonian features, and recurrent vivid visual hallucinations) and suggestive features (antipsychotic sensitivity, rapid eye movement sleep behaviour disorder and low dopamine transporter uptake in basal ganglia). Patients can be diagnosed as having possible or probable DLB based on the number of core and suggestive features. Patients who fulfil possible DLB criteria have a very uncertain diagnosis as they have only one core or one or more suggestive features. In a 1-year follow-up study of patients with possible DLB, 40% of individuals continued to be in the possible DLB diagnostic category. All patients that received a diagnosis of non-DLB at follow-up had negative 123I-ioflupane injection (123I-FP-CIT) scans and 63% of patients with a probable diagnosis of DLB at follow-up had an abnormal scan. Reference O'Brien, McKeith, Walker, Tatsch, Booij and Darcourt2
Several studies have demonstrated that the clinical diagnosis of DLB has fairly high specificity but low sensitivity. Reference Litvan, Bhatia, Burn, Goetz, Lang and McKeith3,Reference Nelson, Jicha, Kryscio, Abner, Schmitt and Cooper4 123I-FP-CIT is used with single photon emission computed tomography (SPECT) imaging for assessment of dopamine transporter and therefore the integrity of the nigrostriatal pathway. Loss of dopamine transporter has been shown at autopsy to be a feature of both DLB and Parkinsonian disorders. Reference Piggott, Marshall, Thomas, Lloyd, Court and Jaros5 Low dopamine transporter uptake in the basal ganglia is a suggestive feature of DLB. Long-term follow-up of a series of patients with dementia who had 123I-FP-CIT SPECT scans and who subsequently had neuropathological examinations showed that the sensitivity of an 123I-FP-CIT SPECT scan for diagnosing DLB was 100%, and the specificity was 92%. Reference Walker and Walker6,Reference Walker, Jaros, Walker, Lee, Costa and Livingston7 In a large European study, using a consensus panel clinical diagnosis, an 123I-FP-CIT SPECT scan had 78% sensitivity and 90% specificity for DLB v. non-DLB dementia. Reference McKeith, O'Brien, Walker, Tatsch, Booij and Darcourt8
Prognosis, the course of the disease and the clinical management of DLB differ in some important aspects from other dementias such as Alzheimer’s disease. The management of Parkinsonian symptoms, sleep disorders and autonomic dysfunction needs specific consideration. Reference Boot, McDade, McGinnis and Boeve9 Patients with DLB are more likely to develop complications when they receive antipychotics Reference Ballard, Grace, McKeith and Holmes10 and they may respond better to cholinesterase inhibitors although no prospective study has demonstrated this definitively. Reference Pakrasi, Mukaetova-Ladinska, McKeith and O'Brien11 There is also some evidence that patients with DLB could benefit from memantine. Reference Matsunaga, Kishi and Iwata12 Patients with DLB have more pronounced neuro-psychiatric symptoms and increased caregiver distress. Reference Walker, McKeith, Rodda, Qassem, Tatsch and Booij13 Overall, DLB evolves more rapidly than Alzheimer’s disease, resulting in earlier long-term nursing care and higher cost of treatment. Reference Bostrom, Jonsson, Minthon and Londos14,Reference Bostrom, Jonsson, Minthon and Londos15 As a result of the different prognostic implications of a diagnosis of probable DLB compared with other diagnoses, an improvement in the confidence of diagnosis has clinical relevance. An accurate and early diagnosis may provide a better explanation of the features, lead to changes in the clinical management of patients, and help families, relatives and carers to make informed decisions and future plans. This should translate into better management of the patient with reduced carer burden and better clinical outcome. In uncertain dementia, diagnostic confidence tends to increase during the follow-up of patients as the clinical features evolve over time. The present study tested the hypothesis that imaging with 123I-FP-CIT SPECT would lead to an earlier change to a more certain diagnosis (probable DLB or non-DLB dementia) compared with patients without imaging during follow-up.
Method
Study design and participants
In this multicentre, randomised, open-label trial we enrolled participants from 21 centres in 6 European countries with experience in the diagnosis of DLB (EudraCT NUMBER: 2010-021474-11). Approximately 70% of the 21 centres were general hospitals whereas the rest were academic centres (60% of the clinicians were neurologists and 40% old age psychiatrists). The study period was 14 January 2011 to 8 October 2012. Patients had to be 55 years of age or older and have a Mini-Mental-State-Examination (MMSE) Reference Folstein, Folstein and Mchugh16 score between 10 and 28. Patients with possible DLB were diagnosed by local clinicians according to the consensus criteria Reference McKeith, Dickson, Lowe, Emre, O'Brien and Feldman1 as having dementia plus one core feature or one or more suggestive features (excluding prior dopamine transporter imaging). All patients had a reliable informant who was willing to participate in the study. Exclusion criteria included having an established clinical diagnosis of probable DLB or non-DLB dementia; Parkinsonian features present for more than 1 year prior to onset of dementia; severe extrapyramidal features (a score greater than 30 on the Unified Parkinson’s Disease Rating Scale-III; UPDRS-III Reference Fahn17 ); known or suspected significant vascular pathology according to brain magnetic resonance imaging (MRI)/computed tomography (CT); the presence of any severe mental or physical illness that could account for dementia; life expectancy of less than 1 year; medication known to influence uptake of 123I-FP-CIT (these included amphetamine, benzatropine, bupropion, cocaine, mazindol, methylphenidate, phentermine and sertraline); or a history or current misuse of illicit drugs or alcohol. Informed consent was obtained from each patient and their caregiver. This study was conducted in full accordance with the Declaration of Helsinki, the Good Clinical Practice: Consolidated Guideline approved by the International Conference on Harmonisation and all applicable national and local laws and regulations.
Randomisation
Randomisation was performed centrally using the labelling system ClinPro/LBL at GE Healthcare in Oslo in December 2010. The randomisation was performed using a block size of 6, imaging group:control group (4:2). Randomisation cards were printed with the treatment group names and these names were covered by black scratch off labels to be used by the local research staff.
Procedures
Patients without an MRI scan available prior to baseline underwent a standard MRI scan during the course of the study unless this was contraindicated. In that case, cerebral CT imaging within 6 months prior to baseline or during the study was also acceptable.
All patients had a baseline visit, at which the following procedures/schedules were performed and the results recorded: collection of demographic data, use of any concomitant medication, medical/surgical history, physical examination with emphasis on neurological examination, UPDRS-III score (if on anti-Parkinsonian medication, there was no requirement to stop treatment), Addenbrooke’s Cognitive Examination-Revised (ACE-R), Reference Mioshi, Dawson, Mitchell, Arnold and Hodges18 Neuropsychiatric Inventory (NPI), Reference Cummings, Mega, Gray, Rosenbergthompson, Carusi and Gornbein19 Clinician Assessment of Fluctuation Scale, Reference Walker, Ayre, Cummings, Wesnes, McKeith and O'Brien20 and Geriatric Depression Scale (GDS). Reference Sheikh and Yesavage21 Onsite clinicians recorded DLB features listed in the Consensus criteria Reference McKeith, Dickson, Lowe, Emre, O'Brien and Feldman1 taking into account the results of the above scales as well as patients’ dementia diagnostic category. Clinicians also rated their confidence of diagnosis using a visual analogue scale (VAS) scored from 0 to 100 mm. Clinicians were instructed, ‘Please indicate how certain you are that your diagnosis is correct (i.e. how certain you are that you can exclude or confirm DLB) by placing a mark on the VAS scale’. The 0 mm end of the scale represented ‘Not confident at all’ whereas the 100 mm end of the scale represented ‘Extremely confident’.
Following baseline assessment, patients were randomly assigned to have a 123I-FP-CIT SPECT scan or no scan (2:1). Both study personnel and patients were aware of participants’ group assignment. If the patient was randomised to the imaging group, the study centre scheduled the imaging visit 2 to 6 weeks after baseline assessment.
SPECT imaging
Each patient in the imaging group was given oral medication for thyroid blockade prior to the administration of 123I-FP-CIT. The patient then received a single intravenous injection of 123I-FP-CIT in a maximum volume of 2.5 ml and a radioactivity range of 111–185 MBq. Monitoring for adverse events began as soon as the injection started. Within 3–6 h of their injection, the patient underwent a SPECT scan to assess the functional integrity of the nigrostriatal dopaminergic neuron terminals in the striatum. Post administrative thyroid blocking was also performed. All patients remained under constant medical supervision during the imaging phase of the study. Any adverse event reported by the patient was recorded.
All centres had sufficient experience with 123I-FP-CIT SPECT imaging. Therefore, there was no need for prestudy striatal phantom studies. Images were acquired using a gamma camera fitted with a low-energy high-resolution or fan beam collimator and calibrated using the 159 keV photopeak and a ±10% energy window. Angular sampling was not less than 120 views in a circular orbit (3° steps over 360° rotation). The radius of rotation was set as small as possible. Matrix size was 128×128, and zoom factor was selected to give a pixel size of 3.5–4.5 mm. A minimum of 500 k counts was collected for optimal images. A headrest was used for all acquisitions.
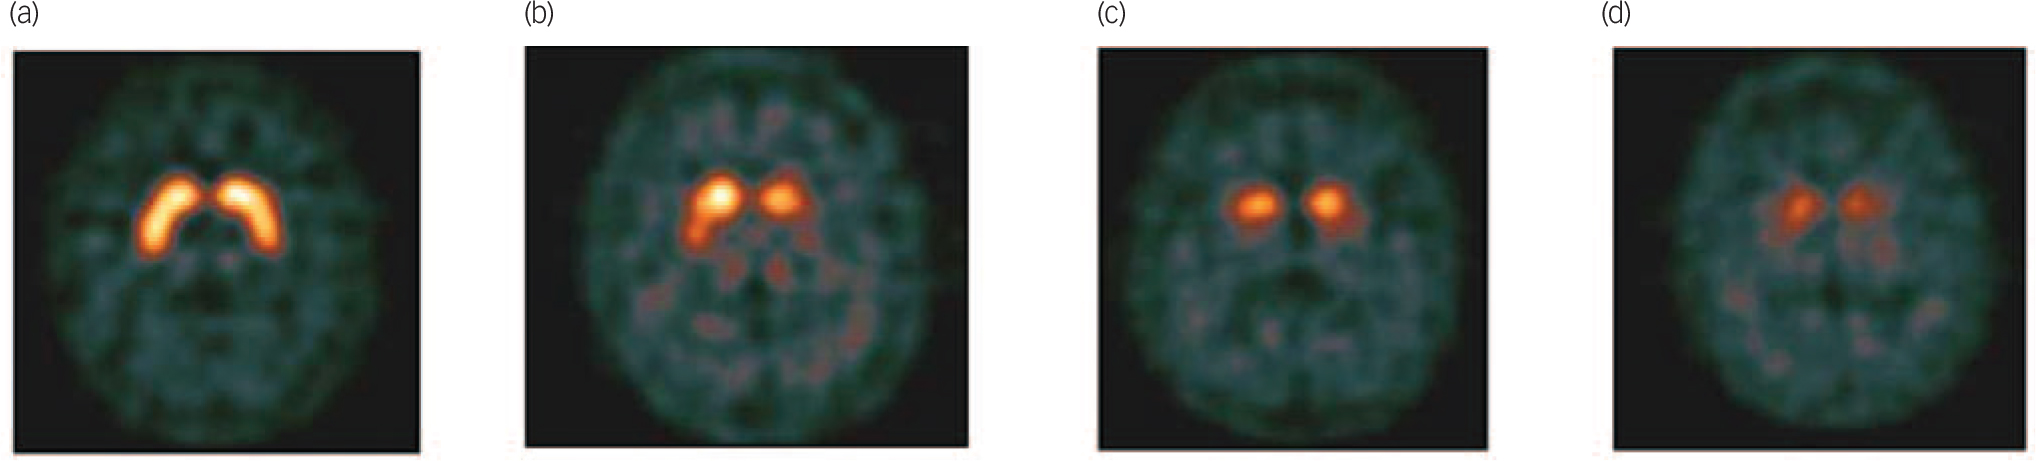
After the imaging procedure, images were visually rated by local nuclear medicine physicians and classified as normal (normal uptake in all regions); abnormal type 1 (asymmetric activity with one putamen showing reduced uptake), type 2 (absent activity in the putamen of both hemispheres), type 3 (absent activity in the putamen of both hemispheres and greatly reduced in one or both caudate nuclei; see Fig. 1 for examples of normal and abnormal images types 1–3), or type 4 (other abnormal pattern). The rating of other abnormal pattern was made when no clear pattern could be determined but the scan was clearly abnormal. An example would be balanced loss with high background signal, maintaining the normal comma shape but the uptake is uniformly reduced as compared with background activity; another example would be intense localised reduction in uptake in one striatum (or part of the striatum) but preserved full uptake in the rest of the striatum indicating a striatal infarct. The readers were masked to all clinical and psychometric evaluations. The images, and the physician’s rating, were provided to the patient’ clinician within 1 week.
All patients were invited to return to the study centre to attend a second visit 8 weeks (±1 week) after baseline. For patients in the imaging group, the physician reviewed the result of the SPECT scan and discussed this with the patient. The following procedures were performed with all returning patients and the results
Example of visual scan rating categories.
(a) Normal, (b) abnormal type 1, (c) abnormal type 2, (d) abnormal type 3.
recorded: physical examination with neurological examination, UPDRS-III score, dementia diagnostic category, DLB features and clinician’s confidence of diagnosis.
Patients were reassessed 24 weeks (±2 weeks) weeks after baseline. The same schedules used at baseline were repeated. At the end of the study, participants in the control group were scheduled for 123I-FP-CIT SPECT imaging if considered clinically appropriate but the results of these scans were not part of the study.
Outcomes
The primary outcome measure was the proportion of patients with a change in clinical diagnosis (to probable DLB or non-DLB) at 8 weeks. Secondary outcome measures were change in clinical diagnosis at 24 weeks and change in clinicians’ confidence of diagnosis at 8 and 24 weeks.
Statistical analysis
The proportion of patients with a change in clinical diagnostic category at 8 and 24 weeks compared with baseline was compared using Fisher’s exact test for both groups. The mean change in clinicians’ confidence of diagnosis between baseline and week 8, baseline and week 24, and weeks 8 and 24 was compared using an analysis of covariance model (ANCOVA) for both groups. The treatment group was the main effect and the baseline confidence of diagnosis was entered as the covariate. The percentage of abnormal 123I-FP-CIT SPECT scans in the imaging group was also reported.
Per-protocol
Both primary and secondary outcomes were analysed per-protocol. The analysis of week 8 outcomes included all control participants who attended both baseline and week 8 visits, and all 123I-FP-CIT participants who attended both baseline and week 8 visits and for whom a 123I-FP-CIT image interpretation was available. The analysis of week 24 outcomes included all participants who attended baseline, week 8 and week 24 visits. All data reported in this paper were analysed per-protocol unless otherwise specified.
Intention-to-treat
Intention-to-treat analyses were performed on the primary outcome and the secondary outcome of diagnostic category at 24 weeks. Analysis of both outcomes included all participants who were randomised regardless of whether they completed subsequent visits. For the intention-to-treat analyses missing values were regarded as having no change in diagnostic category.
Results
In total, 192 patients gave informed consent and 187 were randomised to one of the two groups. Of these, 127 patients were randomised to the imaging group and 60 patients were randomised to the control group. However, 11 patients who were randomised to the imaging group did not undergo imaging and 4 patients in the control group failed to attend their week 8 visit. Overall, 116 patients had a scan (Fig. 2) although only 114
Trial profile.
-
a. Five patients declined to participate after the initial screening visit but before randomisation.
-
b. including one patient who missed the appointment at week 8 in each group. 123I-FP-CIT, 123I-ioflupane injection; SPECT, single photon emission computed tomography.

attended the follow-up visit at 8 weeks. All images were readable and rated as normal or abnormal types 1, 2, 3 or 4.
Demographics
Baseline characteristics are presented in Table 1. The two groups were well-matched for age, geriatric depression scale, fluctuations scale, presence of Parkinsonian features and cognitive testing (Table 1). Of the randomised population at baseline, 30 patients took anti-Parkinson’s treatment, 133 took anti-dementia medication and/or antidepressants, 36 took anxiolytics and 23 took antipsychotics, mainly quetiapine (n = 18). A total of 28% of patients had features of Parkinsonism. The two groups were well-matched for core and suggestive features of DLB (Table 2, all P>0.05).
Primary and secondary outcome measures
Following per-protocol analyses, change in diagnostic category at 8 weeks, as compared with baseline, was 61% (n = 70) in the imaging group and 4% (n = 2) in the control group. The change in diagnostic category at week 24 compared with baseline was 71% (n = 77) in the imaging group and 16% (n = 9) in the control group. The difference between the two groups was statistically significant at both time points (both P<0.0001; Fig. 3). Confidence of diagnosis at baseline was similar in both groups but was significantly greater in the imaging group at 8 and 24 weeks (Fig. 4, both P<0.0001).
The data were also analysed according to intention-to-treat. Change in diagnostic category at 8 weeks, as compared with baseline, was 55% in the imaging group and 3% in the control group. The change in diagnostic category at week 24 compared with baseline was 61% in the imaging group and 15% in the
Baseline characteristicsFootnote a

| Imaging group
(n = 114) |
Control group
(n = 56) |
Total (n = 170) |
|
|---|---|---|---|
| Gender, n (%) | |||
| Men | 64 (56.1) | 29 (51.8) | 93 (54.7) |
| Women | 50 (43.9) | 27 (48.2) | 77 (45.3) |
| Age, years: mean (s.d.) | 75.2 (7.08) | 74.6 (7.63) | 75.0 (7.25) |
| Geriatric Depression Scale (0–15)Footnote b | |||
| Mean (s.d.) | 3.3 (2.91) | 3.8 (2.43) | 3.5 (2.76) |
| Median (IQR) | 3 (1–5) | 3 (2–6) | 3 (2–5) |
| Clinical Assessment of Fluctuation Scale (0–16) | |||
| Mean (s.d.) | 2.9 (3.76) | 1.9 (3.57) | 2.5 (3.72) |
| Median (IQR) | 0 (0–6) | 0 (0–2.5) | 0 (0–6) |
| Fluctuation Scale >0, n (%) | 51 (45) | 16 (29) | 67 (39) |
| Addenbrooke’s Cognitive Examination – Revised (0–100) | |||
| Mean (s.d.) | 63.8 (17.1) | 59.8 (16.6) | 62.5 (17.0) |
| Median (IQR) | 63.5 (52–78) | 56.0 (50–74) | 62.5 (50–77) |
| Mini-Mental State Examination (0–30) | |||
| Mean (s.d.) | 22.2 (4.67) | 21.9 (4.69) | 22.1 (4.66) |
| Median (IQR) | 23 (20–26) | 22 (19–26) | 23 (19–26) |
| Neuropsychiatric Inventory, total (0–144)Footnote c | |||
| Mean (s.d.) | 15.9 (14.66) | 13.3 (14.93) | 15.0 (14.75) |
| Median (IQR) | 13 (5–23) | 10 (4–18) | 12 (4–21) |
| Neuropsychiatric Inventory, caregiver distress (0–60)Footnote c | |||
| Mean (s.d.) | 8.6 (8.17) | 7.1 (6.72) | 8.1 (7.73) |
| Median (IQR) | 6 (2–13) | 7 (2–10) | 6 (2–11) |
| Unified Parkinson’s Disease Rating Scale, Part III overall assessment (0–56) | |||
| Mean (s.d.) | 9.3 (8.47) | 9.2 (7.53) | 9.3 (8.15) |
| Median (IQR) | 6.5 (2–15) | 8.0 (2–15) | 7 (2–15) |
a. For all scales the data in parentheses represent theoretical range values for the test.
b Data available for only 113 participants in the imaging group.
c Data only available for 55 participants in the control group.
control group. The difference between the two groups was statistically significant at both time points (both P<0.0001).
Results for imaging group according to visual rating of scan
Injection was administered according to protocol in 86% of the participants with a mean radioactivity of 174 MBq (range 142–209). Three participants received a contraindicated medication (2 took sertraline, 1 took bupropion) at the time of injection. Physician review of 123I-FP-CIT images resulted in 65 (57%) scans being classed as normal and 49 (43%) as abnormal (abnormal type 1 in 8%, type 2 in 21%, type 3 in 4% and type 4 in 10%).
Clinicians were more likely to change a diagnosis when the scan was abnormal than when the scan was normal (Table 3 and Fig. 5). The majority of patients with an abnormal scan (78%, n = 38) were assigned a diagnosis of probable DLB by the clinicians. None of the patients with a normal scan were classified as probable DLB. Patients with a normal scan were equally distributed between non-DLB and possible DLB diagnostic categories.
Change in VAS scores for confidence of diagnosis showed a similar pattern with a significantly greater increase for patients with abnormal images (Table 4). Changes in diagnostic category for both groups depending on scan result are shown in Table 3. Nine patients with abnormal images had a 24-week diagnosis of either non-DLB (n = 3) or possible DLB (n = 6). More detailed descriptions of these nine participants are presented in Table 5.
Safety
In the patients who underwent imaging, 24 of 116 patients (21%) reported 39 treatment-emergent adverse events. Two treatment-emergent adverse events were thought to be at least possibly
Presence of core and suggestive dementia with Lewy bodies (DLB) features at baselineFootnote a

| DLB feature type | n (%) | |
|---|---|---|
| Imaging group
(n = 114) |
Control group
(n = 56) |
|
| Fluctuating cognition | 36 (32) | 13 (23) |
| Visual hallucinations | 25 (22) | 16 (29) |
| Features of Parkinsonism | 30 (26) | 19 (34)Footnote b |
| Rapid eye movement sleep behaviour
disorders |
23 (20)Footnote b | 6(11)Footnote c |
| Severe antipsychotic sensitivity | 0 | 0 |
a. The results of DLB feature type were classified into two groups, present and other (including not present, unclear).
b. Percentages were calculated excluding the one participant where information was not available.
c. Percentages were calculated excluding the five participants where information was not available.
Per cent change in diagnostic category for the two groups at week 8 and 24.

related to administration of 123I-FP-CIT (these were an anxiety attack and bruising at injection site). Eight patients in the imaging group reported serious adverse events during the study. There were no deaths.
Discussion
This is the largest prospective multicentre study in possible DLB showing that access to dopamine transporter SPECT imaging significantly assisted clinicians to make a clearer diagnosis at 8 and 24 weeks. At baseline mean clinician confidence of diagnosis
Relationship between dementia diagnosis and single photon emission computed tomography (SPECT) image resultsFootnote a

| Diagnostic category at week 24, n | |||||
|---|---|---|---|---|---|
| Diagnostic category at week 8 | n | Non-DLB | Possible DLB | Probable DLB | Missing |
| Control group (n = 56) | |||||
| Non-DLB | 2 | 2 | |||
| Possible DLB | 54 | 4 | 44 | 5 | 1 |
| Imaging group (n = 114) | |||||
| Normal scan | 65 | ||||
| Non-DLB | 30 | 25 | 4 | 1 | |
| Possible DLB | 35 | 11 | 22 | 2 | |
| Abnormal scan | 49 | ||||
| Non-DLB | 2 | 2Footnote b | |||
| Possible DLB | 9 | 1Footnote b | 5Footnote b | 3 | |
| Probable DLB | 38 | 1Footnote b | 35 | 2 | |
DLB, dementia with Lewy bodies.
a. All participants had a diagnosis of possible DLB at baseline.
b. Mismatches between imaging results and diagnostic category are listed in table 5.
Mean values of clinician confidence of diagnosis for the two groups measured on a visual analogue scale (mm).
P-values, point estimates and 95% confidence interval are obtained from ANCOVA model with treatment group as the main effect and baseline value as covariates. Bars represent 95% CI of the mean.

was only 50%, indicating great uncertainty of diagnosis. Imaging also considerably improved the diagnostic confidence of clinicians at 8 and 24 weeks.
Our results highlight that a relatively large proportion of patients with dementia that have only one core feature or just suggestive features of DLB have an abnormal dopamine transporter scan, and therefore increased likelihood of DLB diagnosis. This emphasises the importance of routinely enquiring about core and suggestive features of DLB. In clinical practice, patients with only one feature of DLB are frequently diagnosed as possible Alzheimer’s disease. This could partially explain the low sensitivity of clinical diagnostic criteria for DLB.
In our imaging cohort, only about a quarter of patients had Parkinsonian features and these were mild, with a mean UPDRS-III score of 9. However, 43% of scanned patients had an abnormal 123I-FP-CIT scan. This reaffirms that a 123I-FP-CIT scan can detect dopaminergic deficits before the emergence of clinical Parkinsonism Reference Filippi, Manni, Pierantozzi, Brusa, Danieli and Stanzione22 and that dopaminergic imaging in this group is particularly helpful.
This is the first study to observe that a change in diagnostic category and improvement in clinicians’ confidence of diagnosis are more likely when the result of 123I-FP-CIT SPECT imaging is abnormal. When the scan was abnormal, the majority of clinicians were able to commit to a more certain diagnosis. When the scan was normal, only half of the clinicians made a change in diagnostic category, suggesting that physicians are less likely to
Per cent change in diagnostic category according to scan results at week 8 and 24.

rule out DLB on the basis of a normal scan. This is in contrast to a retrospective, non-randomised study examining diagnostic changes in patients with suspected DLB following 123I-FP-CIT SPECT. Reference Kemp, Clyde and Holmes23 Most patients with abnormal scans had a post-scan diagnosis of DLB, whereas most patients with normal scans had a post-scan diagnosis of non-DLB dementia.
Although 123I-FP-CIT SPECT scans are safe, the additional cost and inconvenience for the patient mean that imaging is
Change in clinician’s confidence of diagnosis by group and scan resultFootnote a

| Baseline to week 8 | Baseline to week 24 | |||
|---|---|---|---|---|
| n | Mean (s.d.) | n | Mean (s.d.) | |
| Control group | 56 | 1.7 (11.64)Footnote b | 55 | 7.2 (18.03)Footnote b |
| Imaging group | 114 | 17.5 (31.69) | 109 | 21.2 (30.40) |
| Abnormal scan | 49 | 28.3 (20.90)Footnote c | 47 | 28.8 (20.48)Footnote c |
| Normal scan | 65 | 9.3 (35.88) | 62 | 15.5 (35.25) |
a. In both models covariate was baseline value of confidence of dementia diagnosis.
b. Control v. imaging: baseline to week 8 – F = 32.27 (P < 0.0001), baseline to week 24 – F = 29.92 (P < 0.0001).
c. Abnormal v. normal: baseline to week 8 – F = 42.39 (P < 0.0001), baseline to week 24 – F = 31.44 (P < 0.0001).
Participants with mismatch between 123I-ioflupane injection (123I-FP-CIT) and diagnosis

| Participant | Age, gender | DLB core and suggestive features at baseline |
Supportive DLB features at baseline |
123I-FP-CIT imaging results | Diagnostic category at week 8 |
Diagnostic category at week 24 |
Change at week 24 v. baseline |
|---|---|---|---|---|---|---|---|
| 004-0004 | 70, male | Fluctuations | Depression | Other abnormal pattern: left posterior
putamen decrease |
Non-DLB | Non-DLB | Change |
| 018-0002 | 70, male | RBD | MTL | Other abnormal pattern: right basal
ganglia normal. Left equivocal? Technical difficulty, but type 1 cannot be discounted. Lateral tilt |
Non-DLB | Non-DLB | Change |
| 022-0001 | 78, female | Fluctuations | None | Other abnormal pattern: near normal
uptake on the left but loss of head of caudate uptake on right with a preserved putamen - ? Infarct |
Possible DLB | Non-DLB | Change |
| 001-0013 | 82, male | Fluctuations | Depression | Abnormal type 1 | Possible DLB | Possible DLB | No change |
| 013-0008 | 73, male | RBD | None | Other abnormal pattern: diffuse
decrease in striatal uptake |
Possible DLB | Possible DLB | No change |
| 018-0009 | 79, male | Parkinsonism | MTL | Other abnormal pattern: very high
back ground activity + artefact of movement |
Probable DLB | Possible DLB | No change |
| 019-0001 | 81, male | Fluctuations | MTL, falls and syncope |
Other abnormal pattern: bilateral small
vessel ischaemic change |
Possible DLB | Possible DLB | No change |
| 019-0011 | 82, male | Parkinsonism | None | Other abnormal pattern: crescent shape
but not uniform uptake with irregular margins likely to be ischemic in origin |
Possible DLB | Possible DLB | No change |
| 019-0012 | 82, male | Parkinsonism | None | Abnormal type 1 | Possible DLB | Possible DLB | No change |
DLB, dementia with Lewy bodies; RBD, rapid eye movement sleep behaviour disorder; MTL, relative preservation of the medial temporal lobe.
indicated only in difficult to diagnose cases. The main advantage of 123I-FP-CIT scans is that they facilitate early diagnosis and therefore guide appropriate management. The relatively infrequent change in diagnosis even at 6 months follow-up in the non-imaging group suggests that the policy of ‘wait and see’ frequently used in neurodegenerative disorders is not particularly useful in possible DLB. As in the study by O’Brien et al, Reference O'Brien, McKeith, Walker, Tatsch, Booij and Darcourt2 we have found a high proportion of patients continued to have a diagnosis of possible DLB in the absence of dopamine transporter imaging.
Importance of scan result
It is interesting that both improvement in confidence of diagnosis and a change to a more certain diagnosis were more likely to take place when the 123I-FP-CIT SPECT scan was abnormal than normal. Three patients continued to have a non-DLB diagnosis despite an abnormal scan. However, all three imaging reports expressed a level of uncertainty about the result, which is likely to have influenced the clinicians. One of the reports indicated technical difficulties that made it difficult to accurately interpret the scan. One suggested alternative pathology (infarct), and in one case the clinical decision was unclear. Another possibility is that despite the abnormal 123I-FP-CIT SPECT scans, the clinicians felt that an alternative diagnosis of dementia was more likely. Morgan et al Reference Morgan, Kemp, Booij, Costa, Padayachee and Lee24 scanned 12 patients with frontotemporal dementia (many of whom had extrapyramidal signs) using 123I-FP-CIT SPECT and found that four had abnormal scans, showing that an abnormal scan does not exclude the diagnosis of frontotemporal dementia.
In the present study, a large proportion of patients with a normal scan retained a diagnosis of possible DLB. A possible explanation for this is that a few false-negative results have been reported in the literature in cases with autopsy diagnosis. Reference Walker and Walker6,Reference Colloby, McParland, O'Brien and Attems25 At present, there is only one study that has followed-up patients with a clinical diagnosis of DLB and a negative 123I-FP-CIT scan. It included only three participants and they all continued to have typical features of DLB Reference Siepel, Rongve, Buter, Beyer, Ballard and Booij26 but no autopsies were available. Longitudinal studies including autopsy are needed to clarify the position of patients with normal striatal dopamine transporter 123I-FP-CIT uptake in DLB.
Strengths and limitations
The strengths of this study include: the randomisation of a very large number of patients with possible DLB (the largest previous cohort described was 44 patients in O’Brien et al Reference O'Brien, McKeith, Walker, Tatsch, Booij and Darcourt2 ); a prospective pan-European design involving a number of countries with a range of clinical centres (academic and non-academic); different specialties (psychiatrists and neurologists); a relatively small number of patients with Parkinsonian features in the imaging group (25%); and the exclusion of patients with vascular pathology through the use of MRI.
The main limitations of this study are the lack of neuro-pathological confirmation of diagnosis, the open-label design and the relatively short 6-month follow-up period. The emergence of new features may take longer than 6 months. Reference O'Brien, McKeith, Walker, Tatsch, Booij and Darcourt2 We noted slight differences in baseline measures for control and imaging groups, however, none of these differences were statistically significant. The study protocol stipulated that the consensus criteria for possible DLB had to be met at enrolment into the study. However, at follow-up we did not stipulate any use of criteria, rather we left clinicians to make diagnoses according to their usual clinical practice. Therefore it was permissible for a patient with rapid eye movement sleep behaviour disorder and an abnormal 123I-FP-CIT scan to receive a diagnosis of probable DLB. This does not strictly follow the consensus criteria as two suggestive features are not sufficient for a diagnosis of probable DLB. In this study we did not record if more certain clinical diagnosis and increased physician’s confidence led to a change in clinical management and this is something that should be studied in the future. We did not use a consensus clinical panel diagnosis, which would provide a more accurate diagnosis. Although this could be seen as a limitation, it is also a strength, as this reflects real-life practice, where diagnosis is made by one onsite clinician.
The main technical limitation was that different centres used different reconstruction methods for the SPECT images, and centres had varying levels of experience with DLB. Scans were read locally by nuclear medicine physicians with variable expertise. It is possible that centralised reading of the images by masked raters would have carried more weight with clinicians. The raters were masked to MRI so they could not take minor vascular pathology into account when reporting the scans. In a small number of difficult to interpret images, it is possible that a quantitative data analysis of striatal uptake adjusted for age would be more informative.
Implications
123I-FP-CIT SPECT imaging significantly contributed to a change in diagnostic category and improved diagnostic confidence in the diagnostic work-up of patients with an uncertain diagnosis of DLB. Changes in diagnostic category were less frequent in the control group despite a 6-month prospective follow-up. 123I-FP-CIT was shown to be safe and well tolerated. This study further underlines the recommendation of the UK National Institute for Health and Care Excellence, 27 which is to use 123I-FP-CIT SPECT scanning to support a diagnosis of DLB in uncertain cases.
Acknowledgements
We would like to thank all of the patients and carers for participating in this study. We would like to thank Tim Whitfield (research assistant at North Essex Partnership University NHS Foundation Trust) for support during the preparation of this manuscript. We would also like to thank all the support staff at the local nuclear medicine departments for their help.
The DaTSCAN DLB Phase 4 Study Group were as follows. Michael Rainer, Thomas Leitha – Vienna, Austria. Gerhard Ransmayr, Michael Gabriel – Linz, Austria. Florence Pasquier, Frank Semah – Lille, France. Giovanni Castelnovo, Laurent Collombier – Nimes, France. Reinhard Ehret, Uwe Stabell – Berlin, Germany. Adrian Danek, Christian La Fougere – Munich, Germany. Gilberto Pizzolato, Franca Dore – Trieste, Italy. Alessandro Padovani, Barbara Paghera – Brescia, Italy. Ubaldo Bonucelli, Roberto Ceravolo, Duccio Volterrani – Pisa, Italy. Albert Lladó, Francisco Lomeña – Barcelona, Spain. Dolores Martinez Lozano, Daniel Flores – Castellon, Spain. Eulogio Gil Neciga, David Garcia Solis – Sevilla, Spain. Guillermo Amer Ferrer, Jaume Daumal – Palma de Mallorca, Spain. Maria Jose Moreno Carretero, Andres Serena – Vigo, Spain. Jenny McCleery, Gill Oliver – Banbury, UK. Naji Tabet, Lynn Jenkins, Sabina Dizdarevik – East Sussex, UK. Timothy Stevens, Christopher Barber, Zuzana Walker – Essex, UK. Alan Thomas, Kim Howe – Newcastle-upon-Tyne, UK. Fraser Inglis – Glasgow, UK. Derek Brown, Joanne Prosser – Glasgow, UK. Jay Chahal, Emilio Moreno – Amersham, UK. Shamsul Alan – Princeton, USA.


eLetters
No eLetters have been published for this article.