

Background
With an increased interest in performance measurement for management and governance purposes in health care systems, questions about the type and use of different measures have come into focus. In primary care, two important objectives are accessibility and continuity. Continuity can be defined as the extent to which services are offered as a coherent succession of events in keeping with the health needs and personal context of patients and accessibility as promptness and ability to visit a primary health care physician (Lamarche et al., Reference Lamarche, Beaulieu, Pineault, Contandriopoulos, Denis and Haggerty2003). These objectives are important due to the special position of primary care in health care systems. Starfield (Reference Starfield2008: 8–9) defines primary care as ‘that level of a health system that provides entry into the system for all needs and problems, provides person-focused (not disease-oriented) care over time, provides care for all but very uncommon or unusual conditions, and coordinates or integrates care provided elsewhere by others’. There are many ways of measuring the objectives that primary care should fulfil and commonly registered process measures are used in research in this area (van Servellen et al., Reference van Servellen, Fongwa and Mockus D’Errico2006).
In Swedish primary care, registered process measures as well as patient reported experience measures (PREMs) are used to assess the quality of care. A subset of measures is also used to incentivize providers through pay-for-performance (P4P) schemes (Anell, Reference Anell2014; Anell and Glenngård, Reference Anell and Glenngård2014). In the areas of accessibility and continuity, both registered process measures and PREMs are used to measure performance and to hold providers to account. A primary purpose of the collection, analysis and dissemination of performance information about providers is to promote transparency throughout the health system, and to enable various actors to assess the services of providers of public services (Smith et al., Reference Smith, Anell, Busse, Crivelli, Healy, Lindahl, Westert and Kene2012). With increased transparency and use of quality measures to facilitate continuous improvement and to sanction or reward providers based on their performance, more knowledge about the pros and cons of using different types of measures when comparing performance across providers is important.
From an accountability perspective, it may be preferable to use process measures rather than outcome measures to incentivize providers, especially in a primary care setting with a limited number of patients generating outcomes for each provider (Anell and Glenngård, Reference Anell and Glenngård2014). Major concerns in the use of outcome measures for holding providers to account are the need for risk-adjustment, attribution and randomness (Mant and Hicks, Reference Mant and Hicks1995; Lilford et al., Reference Lilford, Hohammed, Spiegelhalter and Thomson2004; Davies, Reference Davies2005; Petersen et al., Reference Petersen, Woodard, Urech, Daw and Sookanan2006; Davidson et al., Reference Davidson, Moscovice and Resmus2007; Robinson et al., Reference Robinson, Williams and Yanagihara2009). Ideally, primary care providers should only be held accountable for factors that they are able to control (Terris and Aron, Reference Terris and Aron2009). But accountability towards evidence-based process measures is far from unproblematic. The quality of process measures is influenced by registration practices and registered data are often more easy to manipulate. Linkages with end objectives or outcomes may also be weak or only indirect. Providers may then engage in a ‘box-ticking’ behaviour and reach defined targets without concern for individual patient needs and end objectives (Campbell et al., Reference Campbell, McDonald and Lester2008; Maisey et al., Reference Maisey, Steel, Marsch, Gilliam, Fleetcroft and Howe2008; Ryan et al., Reference Ryan, Burgess, Tompkins and Wallack2009). Hence, process measures may have a greater potential when defining a minimum standard of quality for providers, rather than supporting continuous quality improvements. PREMs have benefits in being more aligned with objectives of patient-centredness and as they are more difficult for providers to manipulate compared with process measures. On the other hand, PREMs are influenced by expectations and many other factors not necessarily reflecting the actual quality of services provided (Glenngård, Reference Glenngård2013). Moreover, results from patient surveys are often uncertain because of a low response rate, in particular from vulnerable groups.
In conclusion, comparisons of providers performance based on PREMs versus registered process measures may not converge. Even if they do converge one measure may be more beneficial than the other, depending on the specific purpose of measuring performance.
The purpose of this study was to analyse (a) the covariation between PREMs and registered process measures of access and continuity when ranking providers in a primary care setting, and (b) whether registered process measures or PREMs provided more or less information about potential linkages between levels of access and continuity and explaining variables.
Methods
Empirical material
In Sweden, with a publicly funded comprehensive health care system, there are 21 county councils responsible for the financing and organization of health care. Expenditures for primary care constitutes about one-fifth of total health care expenditures. There are about 1200 primary care providers whereof 40% are privately owned. County councils control the establishment of providers by regulating services to be provided, quality requirements, payment systems and financial responsibilities. Team-based primary care, with GPs (average of four GPs per provider), nurses, midwives, physiotherapists and psychologists, is the main form of practice.
The empirical material in the analysis consists of data from two Swedish county councils: Region Skåne (RS) and Västra Götalandsregionen (VGR) for the period 2009–2014. There were about 150 primary care practices serving 1.3 million inhabitants in RS and 200 practices serving 1.6 million inhabitants in VGR. Together, the practices in these two regions represented about 30% of all primary care practices in Swedish primary care. The size of practices included in the analysis vary between 1000 and 22 000 with an average size of 8200 (SD=3700) enrolled individuals. One fourth of all practices in the study are located in a larger city and 41% are privately owned.
Since 2009, patient views about quality in primary care, including continuity and accessibility, are measured annually through a national patient survey (NPE). The survey includes 54 questions regarding different aspects of quality and background characteristics of the respondent. The survey is administered by mail to a random sample of patients having visited a provider during the period September to October each year (Institute for Quality Indicators, 2014; SALAR, 2015a; Online Appendix 2).
Regarding process measures, similar data is available for RS and VGR when it comes to accessibility. Since 2009, promptness to visit a primary healthcare physician is measured annually for all providers in Sweden through a national waiting time survey. The definition of the measure is the proportion of patients contacting a primary care practice that got an appointment with a general practitioner within seven days (SALAR, 2015b; Online Appendix 1). The survey is conducted during one week in October each year. Results from the survey for the period 2009–2014 was used in this study.
For continuity, no process measures are available from VGR. In RS, the extent to which services are offered as a coherent succession of events in keeping with the personal context of patients is measured regularly for all providers since 2012. The definition of the measure is the proportion of patients who got an appointment with the same doctor in three consecutive visits. This information is used to evaluate providers and also used as one performance measure within a P4P-scheme. For this study, information from the period 2011 to 2013 was used.
Statistical method
First, descriptive statistics was used to describe the trends in provider performance based on PREMs and registered process measures of accessibility and continuity of care for the period 2009–2014 at county council level. Second, bivariate correlation analysis was used to analyse the correlation between the two measures of accessibility and continuity. Third, the correlation between PREMs and registered process measures and a number of independent factors was considered simultaneously using multiple regression analysis. The analysis was carried out using SPSS 22.0.
All primary care providers in RS and VGR that participated in the NPE survey 2012 and 2013, and where data about characteristics and location of providers was available were included. The selection of explanatory variables included in regression models was based on availability of data together with assumptions regarding factors that might have an impact on provider performance, particularly in a situation with free choice for inhabitants and competition among providers and where providers have a comprehensive financial responsibility for enrolled individuals (Campbell et al., Reference Campbell, Ramsay and Green2001a; Reference Campbell, Ramsay and Green2001b; Le Grand, Reference Le Grand2007; Kontopantelis et al., Reference Kontopantelis, Roland and Reeves2010; Anell, Reference Anell2011; Glenngård, Reference Glenngård2013).
Four regression models were estimated. The approach was to start by including all explanatory variables. Then all non-significant variables were excluded stepwise. Variables in the final model presented are included only when significant at 10%-level (P<0.1). The choice of final model was done with respect to the model with the highest value of explained variance of the dependent variable (adjusted R 2), controlled for multicollinearity between independent variables. Tolerance values below 0.25 and variance inflation factor values >4 were not accepted (Pallant, Reference Pallant2007).
First, a model with PREM of accessibility as dependent variable was estimated. The dependent variable was the proportion of patients satisfied with the accessibility of the provider. High patient satisfaction was defined as stating ‘Excellent’ or ‘Very good’ when answering the question ‘What is your opinion about the accessibility at the practice?’(alternatives: Excellent/Very good/Good/Fair/Bad). The variable could take any value between 0 and 100. Higher value indicates better perceived accessibility.
Second, a model with PREM of continuity as dependent variable was estimated. The dependent variable was the proportion of patients satisfied with the continuity of the provider. High patient satisfaction was defined as stating ‘Yes, almost always’ to the question ‘Do you usually get to see the same doctor/nurse?’(alternatives: Yes, almost always/No, rarely/Only made one visit). The variable could take any value between 0 and 100. Higher value indicates better perceived continuity. The variable was adjusted for those answering ‘Only made one visit’ which were excluded.
Third, a model with a registered process measure of accessibility as dependent variable was estimated. The dependent variable was defined as the proportion of patients who got an appointment with a GP within seven days after having contacted the practice according to the results in the national waiting time survey. This variable was also used as an independent variable in the models with PREMs of accessibility and continuity as dependent variable. The variable could take any value between 0 and 100. Higher value indicates better registered accessibility.
Fourth, a model with a registered process measure of continuity as dependent variable was estimated, including practices from RS only. The dependent variable was defined as the proportion of patients who met with the same doctor for three consecutive visits according to data from RS. This variable was also used as an independent variable in the model with PREM of continuity as dependent variable. The variable could take any value between 0 and 100. Higher value indicates better registered continuity.
Five independent variables were used to measure characteristics of providers:
-
∙ Size of practice. Defined as the number of enrolled individuals at each primary care practice.
-
∙ If the provider is private or public (0/1 where 1=private).
-
∙ Doctor visits as a proportion of all visits among enrolled individuals. Higher number indicates a larger proportion of all visits being with a doctor.
-
∙ The level of overall illness among enrolled individuals measured by average Adjusted Clinical Group (ACG). ACG quantifies morbidity by grouping individuals based on their age, gender and the constellation of diagnoses over a defined time period (Reid et al., Reference Reid, MacWilliam, Roos, Bogdanovic and Black1999). Higher number indicates worse average level of illness.
-
∙ The level of socioeconomic deprivation among enrolled individuals, as measured by care need index (CNI). CNI is a measure of social deprivation related to seven factors, for example education and unemployment (Sundquist et al., Reference Sundquist, Malmström, Johansson and Sundquist2003). (0/1 where 1=belonging to the fifth of providers with highest socio-economic deprivation).
Two independent variables was used to measure the location of practices:
-
∙ Practice located in large city, defined as located in Malmö/Göteborg (0/1 where 1=yes).
-
∙ Practice located in RS or VGR (0/1 where 1=RS)
Two independent variables were concerned with the competition facing providers:
-
∙ The size of market for practice i can take any number. It is defined as the sum of all enrolled individuals in all practices within a certain range (5 km in this study) from practice i, including practice i. Higher number indicates larger market.
-
∙ The Herfindahl–Hirschman Index (HHI) is used as a proxy for the degree of competition facing each practice. It is a measure of the size of firms in relation to the industry and an indicator of the amount of competition among them. It can take any number between 0 and 1. Higher number indicates less competition. In this study it is defined as the sum of the squares of the market shares of all practices within the market, where the market shares are expressed as fractions. Higher number indicates less competition. The share of market for practice i, can take any number between 0 and 1. It is defined as the number of enrolled individuals at practice i in relation to the size of the market for practice i.
Results
Descriptive trends
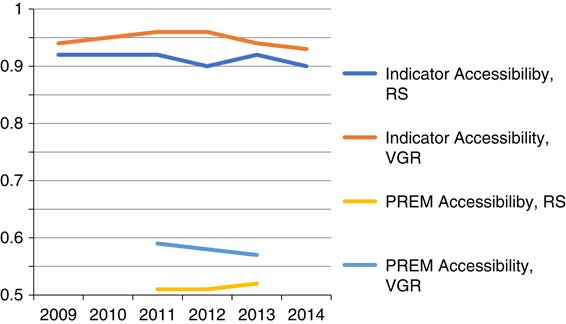
In Figure 1, the trend in provider performance based on the PREM of accessibility and in the registered measure of accessibility are shown. As indicated, there are very small changes in the level of accessibility using both measures during the period studied.
Trend in patient reported experience measures (PREMs) and process measure of accessibility. Source: NPE 2009–2013: Level of accessibility (PREM) was defied as answering ‘Excellent’ or ‘Very good’ to the question ‘What is your opinion about the accessibility at the practice?’ with the answering alternatives Excellent/Very good/Good/Fair/Bad. Waiting time survey 2009–2014: Level of accessibility (process measure=indicator) defined as the proportion of patients contacting a primary care practice that got an appointment with a general practitioner within seven days after contacting the practice. RS=Region Skåne; VGR=Västra Götalandsregionen.
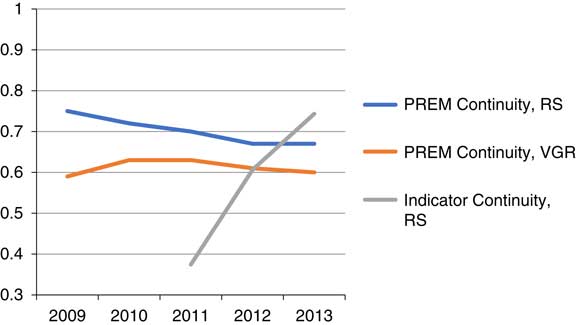
In Figure 2, the trend in provider performance based on the PREM of continuity in RS and VGR and the registered measure of continuity for RS are shown. As indicated, at the overall level the increased proportion of all patients getting to meet with the same doctor for three consecutive visits (registered measure) is not accompanied by better views about continuity according to the national patient survey (PREM) in RS. The same comparison for VGR is not possible as there is no registered measure of continuity in this county council.
Trend in patient reported experience measures (PREM) and process measure of continuity. Source: NPE 2009–2013: Level of continuity (PREM) was defined as answering ‘Yes, almost always’ to the question ‘Do you usually get to see the same doctor/nurse?’, with the answering alternatives Yes, almost always/No, rarely/Only made one visit. Quality register, RS 2011–2013: Level of continuity (process measure=indicator) was defined as the proportion of patients who met with the same doctor for three consecutive visits. RS=Region Skåne; VGR=Västra Götalandsregionen.
Analysis of differences in rankings
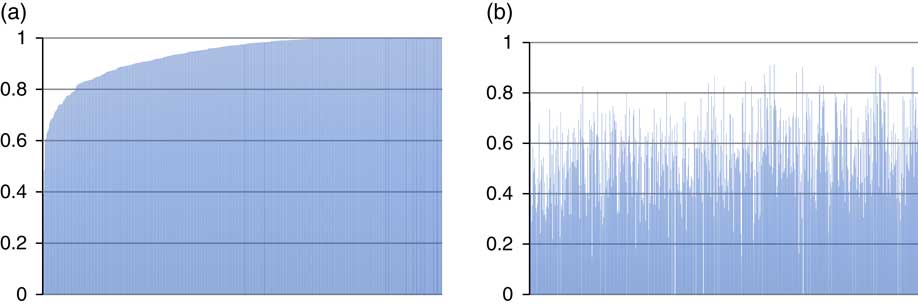
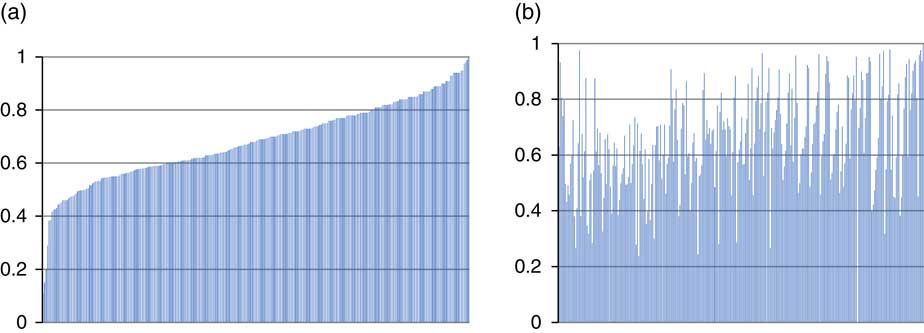
In Figures 3 and 4 the ranking of providers according to their performance with respect to the registered process measures (to the left) and PREMs (to the right) of accessibility and continuity is illustrated. The providers are ranked in order of their performance according to process measures, where the value 1 represents 100% accessibility and continuity with respect to the chosen definitions. Differences in ranking of performance among the providers according to the process measures and PREMs are large. However, there is a positive correlation between the registered process measure and the PREMs for both accessibility and continuity. This implies that providers who perform well with respect to registered process measures also tend to perform well with respect to PREMs.
Registered process measure and patient reported experience measures (PREMs) of accessibility. (a) Process measure (mean=0.94). (b) PREM (mean=0.55). Pearson’s correlation: 0.169; Sig: 0.01; n=622 observations.
Registered process measure and patient reported experience measures (PREMs) of continuity. (a) Process measure (mean=0.66). (b) PREM (mean=0.68). Pearson’s correlation: 0.139; Sig=0.05; n=283 observations.
Regression models
In Table 1, the final model with the PREM of accessibility as dependent variable is shown.
Final regression model with patient reported experience measures of accessibility as dependent variable
HHI=Herfindahl–Hirschman Index.
Patient views about accessibility were positively associated with a high proportion of all visits being with a doctor, private providers and good accessibility according to the process measure. Less market concentration as measured by HHI was associated with views of better accessibility among patients. The opposite relation was found for size of the practice and a high social deprivation among registered individuals.
In Table 2, the final model with the PREM of continuity as the dependent variable is shown. Patient views about continuity (RS) were positively associated with size, private providers, high overall illness, a high proportion of all visits being with a doctor, PREM of accessibility. Moreover, at the provider level a higher proportion of all patients who met with the same doctor for three consecutive visits was positively associated with patients’ views about continuity while this relation was not found at the overall county council level (Figure 2).
Final regression model with patient reported experience measures (PREMs) of continuity as dependent variable
ACG=Adjusted Clinical Group.
In Table 3, the final model with the registered measure of accessibility as dependent variable is shown. The proportion of patients who got an appointment with a general practitioner within seven days after having contacted the practice in RS and VGR was positively associated with a higher proportion of all visits being with a doctor. Less market concentration as measured by HHI was associated with lower accessibility. A larger market size and being located in the two largest cities was associated with lower accessibility. As indicated by the R 2 values, the proportion of variance that could be explained in the models with registered measures of both accessibility and continuity is low.
Final regression model with process measure of accessibility as dependent variable
VGR=Västra Götalandsregionen; RS=Region Skåne; HHI=Herfindahl–Hirschman Index.
In Table 4, the final model with the registered measure of continuity as dependent variable is shown. Analysis for this model is limited to data from RS. The proportion of patients who met with the same doctor for three consecutive visits was positively associated with higher proportion of patients who got an appointment with a general practitioner within seven days, with private providers and with location in the largest city in the sample. The opposite relation was found for size of the practice.
Final regression model with process measure of continuity as dependent variable
Discussion
The results in this study suggest that ranking of primary care providers in terms of access and continuity is sensitive for the type of measure used. There is a covariation between registered process measures and PREMs at the group level. Providers who are highly ranked with respect to registered process measures tend to also rank high with respect to PREMs. These results support previous studies in Swedish primary care that found that patient views about quality were positively correlated with variables reflecting registered clinical quality (Glenngård and Anell, Reference Glenngård and Anell2017). Also a study from the United States, based on a survey of 4605 hospitals, concludes that patients perceptions about the quality of care was correlated with clinical quality as measured by lower complication rates (Stein et al., Reference Stein, Day, Karia, Hutzler and Bosco2015). The correlation between the two measures is rather weak in our study, however. This means that there will be large differences in ranking of individual providers, depending on whether PREMs or process measures are used.
The proportion of variance that could be explained was notably higher in the regression models with PREMs as the dependent variables. More explanatory variables were also significantly associated with PREMs as the dependent variables compared with models with registered process measures as the dependent variables. The models with PREMs as the dependent variables confirm that patient views about accessibility and continuity vary with respect to both controllable and uncontrollable factors for providers. The results from the regression analysis are in line with those in a previous study based on data from the national patient survey and data about providers in the same county councils as in the current study (Glenngård, Reference Glenngård2013). Similar to the previous study in the Swedish setting and studies in other contexts (Campbell et al., Reference Campbell, Ramsay and Green2001a; Reference Campbell, Ramsay and Green2001b; Kontopantelis et al., Reference Kontopantelis, Roland and Reeves2010), smaller practices and practices where a high proportion of all visits were with a doctor, a low level of social deprivation (for accessibility) and a high overall illness (for continuity) on average were individual factors associated with positive opinion about quality among patients. Patients also tend to be more satisfied with both accessibility and continuity with private providers according to the results in this study. This result is similar to the previous Swedish study for continuity but not for accessibility. The results regarding market concentration and competition are mixed. Less competition was associated with a lower proportion of patients who got an appointment with a doctor within seven days but with better views about accessibility. There was no systematic variation in any of the measures of continuity with respect to competition among providers. These results are similar to findings in a recent study of Swedish primary care, where no systematic variation in patient views about quality of services depending on the degree of competition across providers was found (Glenngård and Anell, Reference Glenngård and Anell2017). However, results from a previous study of primary care in England showed that competition was associated with a higher level of quality, both measured by an indicator of clinical quality and PREMs (Pike, Reference Pike2010).
One advantage with process measures is that they are more readily available on a continuous basis, whereas PREMs often refers to previous conditions as they are based on infrequently administered patient surveys. Registered measures are also less sensitive to the low response rate often found for PREMs. From this perspective, registered process measures have benefits from an accountability perspective. Registered measures also come with disadvantages, however. PREMs are more aligned with objectives of patient-centredness and more difficult to manipulate. As shown by our regression models, PREMs could also be more useful when analysing factors that contribute to variation in accessibility and continuity across providers. From this perspective, PREMs are potentially a better option if the purpose of comparison of performance across providers is to learn and contribute to continuous quality improvements.
Our study is limited by the registered process measures actually in use to measure accessibility and continuity in the two studies country councils in Swedish primary care and available information about practices and their location. Although we included variables reflecting both characteristics of providers (including patient mix), location and degree of competition only a small proportion of the total variance in the registered measures could be explained by the regression models. With access to information about additional factors describing the characteristics of practices a larger proportion of the total variance might have been explained in our model. Thus, we cannot rule out that registered measures can contribute to learning and continuous quality improvements in primary care. Moreover, alternative ways to measure both accessibility and continuity do exist (van Servellen et al., Reference van Servellen, Fongwa and Mockus D’Errico2006). With other types of measures, there will most likely be differences when ranking providers and the potential to learn and support continuous quality improvement initiatives will most likely change. Hence, our findings suggest that it is important to explore the pros and cons if measures are used for different purposes before they are put into practice.
Conclusions
In conclusion, although ranking of providers is sensitive to the measure used, the results suggest that providers performing well with respect to one measure also tended to perform well with respect to the other. As process measures are easier and quicker to collect they may be looked upon as the preferred option. PREMs was better than process measures when exploring factors that contributed to variation in performance across providers in this study. However, this finding is conditioned by available information describing the characteristics of practices. If the purpose of comparison is continuous learning and development of services, a combination of PREMs and registered measures may be the preferred option. Above all, our findings points towards the importance of a pre-analysis of the measures in use; to explore the pros and cons if measures are used for different purposes before they are put into practice.
Acknowledgement
The authors are grateful for the generous support of data from Skåne (Håkan Ewéo), Västra Götalandsregionen (Stefan Bengtsson) and the Institute for quality indicators (Johan Frisack), which made the study possible.
Supplementary material
To view supplementary material for this article, please visit https://doi.org/10.1017/S1463423617000457


