





Introduction
Major depressive disorder (MDD) is a prevalent mental health condition affecting approximately 332 million people globally (https://www.who.int/news-room/fact-sheets/detail/depression) and is associated with enormous economic costs (Smith, Reference Smith2011). Rumination emerges as a significant risk factor and a core mechanism that maintains and exacerbates depressive symptoms (Luo et al., Reference Luo, Wong, Zhang, Wu, Shao, Chan and Lee2025; Nolen-Hoeksema, Reference Nolen-Hoeksema2000; Nolen-Hoeksema, Wisco, & Lyubomirsky, Reference Nolen-Hoeksema, Wisco and Lyubomirsky2008). Rumination encompasses distinct subcomponents: brooding, a passive and unproductive focus on negative emotions and their causes, and reflective pondering, an analytical self-reflection aimed at problem-solving or self-understanding (Treynor, Gonzalez, & Nolen-Hoeksema, Reference Treynor, Gonzalez and Nolen-Hoeksema2003). These components create a self-reinforcing cycle that not only predicts the onset and recurrence of major depressive episodes but also impedes recovery by reinforcing negative self-perception and impairing problem-solving abilities (Nolen-Hoeksema, Reference Nolen-Hoeksema2000).
The discovery of the glymphatic system (Iliff et al., Reference Iliff, Wang, Liao, Plogg, Peng, Gundersen and Nedergaard2012; Iliff et al., Reference Iliff, Lee, Yu, Feng, Logan, Nedergaard and Benveniste2013) has provided novel insights into brain homeostasis. These brain-wide perivascular pathways, driven by aquaporin-4 (AQP4) water channels on astrocytic end-feet, facilitate the clearance of metabolic waste (e.g. amyloid-β) and the distribution of nutrients, primarily during sleep (Boespflug & Iliff, Reference Boespflug and Iliff2018; Hablitz et al., Reference Hablitz, Plá, Giannetto, Vinitsky, Stæger, Metcalfe and Nedergaard2020; Jessen, Munk, Lundgaard, & Nedergaard, Reference Jessen, Munk, Lundgaard and Nedergaard2015). Impaired glymphatic function disrupts this metabolic clearance, potentially contributing to neuroinflammation, synaptic dysfunction, and cognitive-emotional dysregulation observed in depression (Rasmussen, Mestre, & Nedergaard, Reference Rasmussen, Mestre and Nedergaard2018; Zou, Deng, Zhang, & Huang, Reference Zou, Deng, Zhang and Huang2024). For instance, chronic perceived stress, a key risk factor for MDD in humans (Liu et al., Reference Liu, Gao, Zhang, Wong, Wu, Chan and Lee2024), has been shown in animal models to compromise glymphatic clearance, leading to amyloid-β accumulation and cognitive deficits, and the effects are reversible by antidepressants like fluoxetine (Xia et al., Reference Xia, Yang, Sun, Qi and Li2017). Recent advances in non-invasive measures of glymphatic functioning, such as Diffusion Tensor Image Analysis along the Perivascular Space (DTI-ALPS) (Taoka et al., Reference Taoka, Masutani, Kawai, Nakane, Matsuoka, Yasuno and Naganawa2017), have further implicated the glymphatic system in human cognitive function (e.g. memory) (Liang et al., Reference Liang, Chang, Huang, Peng, Zhou and Liu2023; Ma et al., Reference Ma, Chen, Liu, Gao, Chen, Toh and Lee2025) and sleep disorders (Lee, Lee, Shin, & Park, Reference Lee, Lee, Shin and Park2022; Si et al., Reference Si, Guo, Wang, Fang, Gu, Cao and Tian2022). However, its role in affective pathology, particularly in ruminative thought patterns central to MDD, remains poorly understood. Given that rumination correlates with disrupted neural dynamics in self-referential processing networks (e.g. default-mode network) and is exacerbated by sleep disturbances (Hamilton, Farmer, Fogelman, & Gotlib, Reference Hamilton, Farmer, Fogelman and Gotlib2015; Zhang et al., Reference Zhang, Kranz, Zou, Deng, Huang, Lin and Lee2020), a critical gap persists in elucidating how glymphatic dysfunction interacts with these neural mechanisms to sustain depressive symptoms. This raises an urgent need to investigate the glymphatic–brain connectivity interplay in rumination and MDD.
The potential interplay between rumination and the glymphatic system’s waste clearance function highlights a further question: how do disruptions in the human brain network underpin this relationship? Previous studies have characterized a broad range of functional connectivity (FC) involved in rumination and depression via functional magnetic resonance imaging (fMRI) studies, such as the hyperconnectivity in the default mode network (DMN) that sustains maladaptive self-referential processing and reduced connectivity in the cognitive control network, impairing emotion regulation (Hamilton et al., Reference Hamilton, Furman, Chang, Thomason, Dennis and Gotlib2011; van Kleef et al., Reference van Kleef, Marsman, van Valen, Bockting, Aleman and van Tol2022). These findings primarily rely on static functional connectivity, which averages neural interactions over time and may overlook critical temporal dynamics that govern depressive pathology. Emerging evidence suggests that dynamic functional connectivity (dFC), which captures time-varying fluctuations in network interactions, offers deeper insights into the neural basis of rumination and depression (Demirtaş et al., Reference Demirtaş, Tornador, Falcón, López-Solà, Hernández-Ribas, Pujol and Soriano-Mas2016; Kaiser et al., Reference Kaiser, Whitfield-Gabrieli, Dillon, Goer, Beltzer, Minkel and Pizzagalli2016; Zhang et al., Reference Zhang, Tam, Wong, Wu, Tao, Chen and Lee2022). For example, individuals with MDD exhibit reduced variability of FC between the DMN and dorsal attention network (DAN), impairing adaptive switching between introspective and goal-directed states (Demirtaş et al., Reference Demirtaş, Tornador, Falcón, López-Solà, Hernández-Ribas, Pujol and Soriano-Mas2016). These dynamic disruptions may reflect a failure to disengage from self-focused negative thoughts, perpetuating the cycle of rumination. Combining both static and dynamic functional network findings can offer a more comprehensive perspective of neural abnormality, which can better clarify the mechanism underlying the intricate interplay between the glymphatic system and rumination in depression.
While aberrant brain network dynamics and glymphatic dysfunction are increasingly implicated in rumination associated with MDD, the neurobiological underpinnings of these disruptions remain insufficiently characterized. Emerging evidence suggests that norepinephrine (NE) modulates glymphatic efficiency by altering astrocytic activity and extracellular space dynamics, potentially linking noradrenergic dysfunction to metabolic waste accumulation in depression (Hauglund et al., Reference Hauglund, Andersen, Tokarska, Radovanovic, Kjaerby, Sørensen, Bojarowska, Untiet, Ballestero and Kolmos2025). Preclinical models further demonstrate that antidepressants like fluoxetine restore glymphatic clearance compromised by chronic stress, highlighting a bidirectional relationship between neurotransmitter signaling and metabolic homeostasis (Xia et al., Reference Xia, Yang, Sun, Qi and Li2017; Yan, Qiu, Yu, & Yang, Reference Yan, Qiu, Yu and Yang2021). Serotonin (5-HT) deficiency is linked to a heightened negative bias and hyperconnectivity in the DMN (Armand et al., Reference Armand, Ozenne, Svart, Frokjaer, Knudsen, Fisher and Stenbæk2022; de la Cruz et al., Reference de la Cruz, Wagner, Schumann, Suttkus, Güllmar, Reichenbach and Bär2021; Pérez-Edgar et al., Reference Pérez-Edgar, Bar-Haim, McDermott, Gorodetsky, Hodgkinson, Goldman and Fox2010), and dopamine (DA) dysfunction correlates with anhedonia and impaired reward processing (Wise, Reference Wise2008). The insight from these findings is that neurobiological imbalances may link to the abnormal brain network and brain homeostasis in rumination associated with MDD.
In this study, we investigated the interplay among the glymphatic system, rumination, and depression, and the underpinning neurobiological basis of this interplay. We collected MRI and behavioral data (e.g. Ruminative Response Scale) from individuals diagnosed with MDD and the matched healthy controls (HC). First, we utilized DTI-ALPS as a proxy for glymphatic function, examining how glymphatic efficiency relates to depressive severity and rumination scores. Second, we applied the brainnetomic analysis and a newly developed edge-centric approach (Esfahlani et al., Reference Esfahlani, Byrge, Tanner, Sporns, Kennedy and Betzel2022) to characterize dFC patterns, exploring their relationship with glymphatic function and rumination, respectively. Third, we investigated how human brain networks underlie the interplay between glymphatic dysfunction and ruminative thought patterns in MDD. Finally, we associated the related FC and dFC patterns with various neurotransmitter distribution maps to explore neurobiological underpinnings of glymphatic–rumination relationships.
Methods and materials
Participants
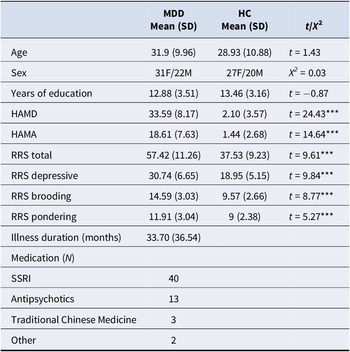
The study initially included data of 100 right-handed adult participants from our previous work (Zhang et al., Reference Zhang, Kranz, Zou, Deng, Huang, Lin and Lee2020): 53 patients diagnosed with major depressive disorder (MDD) and 47 HCs matched for age and sex. MDD diagnoses were confirmed by psychiatrists using DSM-5 criteria (Uher, Payne, Pavlova, & Perlis, Reference Uher, Payne, Pavlova and Perlis2014). All patients scored ≥17 on the HAMD-21 (Hamilton Depression Rating Scale) (Cusin, Yang, Yeung, & Fava, Reference Cusin, Yang, Yeung, Fava, Baer and Blais2009). Exclusion criteria included having other psychiatric disorders (except MDD), history of organic brain disorders, neurological conditions, intellectual disability, cardiovascular diseases, substance or alcohol abuse, pregnancy, or other physical illnesses. MDD patients who had undergone electroconvulsive therapy within 6 months prior to the study were also excluded. Eligible patients were diagnosed, screened by a psychiatrist, and scanned within 1 week of inclusion. Most patients (36 MDD patients) had chronic MDD lasting over 12 months, and all were on antidepressant medication for at least 7 days before their participation (see Table 1). HCs were recruited via local advertisements and screened using the Structured Clinical Interview for DSM-5 Nonpatient Edition to exclude current or past history of psychiatric disorders. Additional exclusion criteria for HCs included participants with any history of psychiatric disorders in first-degree relatives or significant current or past medical or neurological conditions. The study was approved by the Institutional Review Board of Guangzhou Brain Hospital and adhered to the Declaration of Helsinki. All participants showed no brain abnormalities on conventional MRI, as assessed by an experienced radiologist. Each participant provided written informed consent before inclusion.
Demographic and clinical characteristics of MDD and HC

Table 1. Long description
Beginning at the top, the table lists variables in the first column: Age, Sex, Years of education, H A M D, H A M A, R R S total, R R S depressive, R R S brooding, R R S pondering, Illness duration, Medication N, S S R I, Antipsychotics, Traditional Chinese Medicine, Other. For each variable, the second column shows M D D group values, the third column shows H C group values, and the fourth column presents statistical comparisons. Age is 31.9 (9.96) for M D D and 28.93 (10.88) for H C, t equals 1.43. Sex distribution is 31 female and 22 male for M D D, 27 female and 20 male for H C, chi-squared equals 0.03. Years of education are 12.88 (3.51) for M D D and 13.46 (3.16) for H C, t equals minus 0.87. H A M D scores are 33.59 (8.17) for M D D and 2.10 (3.57) for H C, t equals 24.43 triple asterisk. H A M A scores are 18.61 (7.63) for M D D and 1.44 (2.68) for H C, t equals 14.64 triple asterisk. R R S total is 57.42 (11.26) for M D D and 37.53 (9.23) for H C, t equals 9.61 triple asterisk. R R S depressive is 30.74 (6.65) for M D D and 18.95 (5.15) for H C, t equals 9.84 triple asterisk. R R S brooding is 14.59 (3.03) for M D D and 9.57 (2.66) for H C, t equals 8.77 triple asterisk. R R S pondering is 11.91 (3.04) for M D D and 9 (2.38) for H C, t equals 5.27 triple asterisk. Illness duration for M D D is 33.70 (36.54) months, H C is blank. Medication N is blank for both groups. S S R I count is 40 for M D D, blank for H C. Antipsychotics count is 13 for M D D, blank for H C. Traditional Chinese Medicine count is 3 for M D D, blank for H C. Other medication count is 2 for M D D, blank for H C. Triple asterisk denotes p less than 0.001, otherwise p greater than 0.05.
Note: MDD, major depressive disorder; HC, healthy controls; SD, standard deviation; HAMD/HAMA, Hamilton Depression Rating Scale/Hamilton anxiety scale; RRS, ruminative response scale; SSRI, selective serotonin reuptake inhibitor. *** indicates p < 0.001, otherwise p > 0.05.
Behavioral assessment
All participants have undergone two assessments. The overall severity of depressive symptoms was evaluated with the 21-item version of the Hamilton Depression Rating Scale (HAMD) on the day of the MRI scanning. Higher HAMD scores indicate more severe depressive symptoms. In addition to depressive symptoms, we collected data on anxiety to explore broader emotional dysregulation in depression. The overall severity of anxiety symptoms was evaluated with the 14-item version of the Hamilton Anxiety Rating Scale (HAMA) on the day of the MRI scanning. Higher HAMA scores indicate more severe anxiety symptoms. The level of rumination was assessed using the Chinese version of Ruminative Response Scale (RRS) (Han & Yang, Reference Han and Yang2009; Treynor, Gonzalez, & Nolen-Hoeksema, Reference Treynor, Gonzalez and Nolen-Hoeksema2003). The RRS is a 22-item self-report measure that assesses the frequency of ruminative thinking, including three components, which are depressive (i.e. items that relate to depressive symptoms), brooding, and reflective pondering components. Higher RRS scores indicate higher levels of rumination.
Image acquisition
All neuroimaging data were obtained using a 3 Tesla MRI scanner (Achieva X-series, Philips Medical Systems, Best, Netherlands) equipped with an eight-channel SENSE head coil at the Radiology Department of Guangzhou Brain Hospital. Resting-state blood oxygen level-dependent (BOLD) weighted fMRI images were acquired with a gradient-echo echo-planar imaging (GRE-EPI) sequence, using the following settings: repetition time (TR) = 2000 ms, echo time (TE) = 30 ms, flip angle = 90°, matrix = 64 × 64, field of view = 220 × 220 mm, slice thickness = 4 mm with a 0.6 mm gap between slices, and 33 interleaved axial slices. The resting-state fMRI (R-fMRI) scan collected 240 volumes over approximately 8 min. During scanning, participants were asked to close their eyes, stay still, avoid specific thoughts, and stay awake. T1-weighted images were also acquired using an interleaved sequence: 188 sagittal slices, TR/TE/flip angle = 8.2 ms/3.7 ms/7°, matrix = 256 × 256 mm2, FOV = 256 × 256 × 188 mm3, voxel size = 1 × 1 × 1 mm3. Diffusion MRI images were collected with these parameters: 32 diffusion weighted (b = 1000 sec/mm2) and 1 non-diffusion weighted scan, TR = 10100 ms, TE = 90 ms, FOV = 256 × 256 mm2, voxel size = 2 × 2 × 2 mm3.
Image preprocessing
The R-fMRI images were preprocessed using Statistical Parametric Mapping 12 (https://www.fil.ion.ucl.ac.uk/spm/) and Data Processing Assistant for Resting-State fMRI (Yan, Wang, Zuo, & Zang, Reference Yan, Wang, Zuo and Zang2016) toolboxes. The initial 15 volumes of resting-state fMRI (R-fMRI) data were excluded. The remaining images underwent slice-timing correction, head motion correction, and spatial normalization to the Montreal Neurological Institute (MNI) space, using normalization parameters derived from unified segmentation of structural T1 images. Following normalization, linear trends were removed, and nuisance variables, including Friston 24 head motion parameters, white matter (WM), and cerebrospinal fluid (CSF) signals, were regressed out from the R-fMRI data. Finally, a band-pass filter (0.01–0.1 Hz) was applied to retain low-frequency information. The dMRI images were preprocessed using the standard pipeline of the PANDA toolbox (Cui et al., Reference Cui, Zhong, Xu, He and Gong2013). This pipeline involved brain mask estimation, skull-stripping, correction for eddy currents and head motion, and calculation of the diffusion tensor and fractional anisotropy (FA). Additionally, T1-weighted images were aligned to the anterior commissure-posterior commissure (AC-PC) line and segmented to generate a white matter (WM) binary mask (using a WM probability threshold >0) in the native T1 space. After preprocessing, four participants with excessive head motion, whose displacement >3 mm in at least one of the planes or rotation >3° in at least one of the directions, were further excluded in subsequent analyses. Hence, a total of 51 MDD patients (age = 31.96 ± 9.75 years, 30 females) and 45 HCs (age = 29 ± 11.12 years, 26 females) were included.
DTI-ALPS index
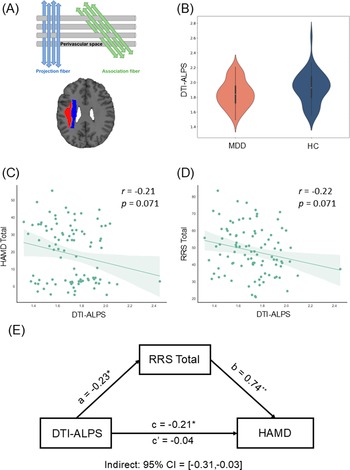
The DTI-ALPS index, introduced by Taoka et al. (Reference Taoka, Masutani, Kawai, Nakane, Matsuoka, Yasuno and Naganawa2017), quantifies glymphatic system function using diffusion MRI data by assessing water molecule movement along the perivascular space at the level of the lateral ventricle bodies. The ROIs were set as the left superior and posterior corona radiata (projection fibers), and the left superior longitudinal fasciculus (association fibers), both from the ICBM-DTI-81 template (Figure 1A). For details of the DTI-ALPS computation, please see Supplementary Methods. Mean tensor values of these ROIs were extracted, and the DTI-ALPS index was then computed as follows (Taoka et al., Reference Taoka, Masutani, Kawai, Nakane, Matsuoka, Yasuno and Naganawa2017):

Relationship among glymphatic functioning, rumination, and depression. (a) Perivascular space and regions of interest of DTI-ALPS. (b) Group difference of DTI-ALPS between MDD patients and HC. (c) Correlation between DTI-ALPS and HAMD total scores. (d) Correlation between DTI-ALPS and RRS total scores. (e) Mediation of RRS on the association between DTI-ALPS and HAMD.

Figure 1. Long description
Panel A at the top-left displays a schematic of perivascular space with projection fibers in blue and association fibers in green, plus a brain slice highlighting regions of interest in red and blue. Panel B to the right shows a violin plot comparing D T I dash A L P S values between M D D and H C groups, with M D D lower than H C. Panel C below A presents a scatterplot of D T I dash A L P S versus H A M D total, with a negative correlation (r equals minus 0.21, p equals 0.071). Panel D to the right of C shows D T I dash A L P S versus R R S total, also with a negative correlation (r equals minus 0.22, p equals 0.071). Panel E at the bottom illustrates a mediation diagram: D T I dash A L P S negatively affects R R S total (a equals minus 0.23 star), R R S total positively affects H A M D (b equals 0.74 double star), D T I dash A L P S directly affects H A M D (c equals minus 0.21 star, c prime equals minus 0.04), with indirect effect 95 percent C I equals open bracket minus 0.31, minus 0.03 close bracket.
where Dxproj and Dyproj are the x-axis and y-axis mean diffusivity of projection fibers, Dxassoc and Dzassoc are the x-axis and z-axis mean diffusivity of association fibers.
Static functional network construction
The static functional connectivity network (sFCN) of the human brain was generated using the preprocessed R-fMRI data (Figure 1B). Network nodes were obtained by dividing the brain’s gray matter into 246 regions according to the Brainnetome atlas (Fan et al., Reference Fan, Li, Zhuo, Zhang, Wang, Chen and Jiang2016). To construct functional connectivity (i.e. sFCN edges), regional BOLD signals were extracted by averaging the signals across all voxels within each region. Pearson’s correlation coefficients were calculated for all pairs of regional signals and transformed using Fisher’s Z transformation to enhance normality. These transformed coefficients served as weights for functional connectivity. Due to ongoing debates about the biological significance of negative connectivity (Fox, Zhang, Snyder, & Raichle, Reference Fox, Zhang, Snyder and Raichle2009; Murphy et al., Reference Murphy, Birn, Handwerker, Jones and Bandettini2009), negative correlations were set to zero, and analyses focused solely on positive connectivity. Ultimately, a 246 × 246 whole-brain functional connectivity matrix was created for each participant.
For modular analysis, nodes in the Brainnetome atlas were grouped into seven functional modules based on the greatest voxel overlap with specific modules, as defined by Yeo et al. (Reference Yeo, Krienen, Sepulcre, Sabuncu, Lashkari, Hollinshead and Buckner2011). These modules comprised the visual network (VN), somatomotor network (SMN), dorsal attention network (DAN), ventral attention network (VAN), limbic system (Limbic), control network (CN), and default mode network (DMN). Subcortical regions, which are not included in Yeo’s original parcellation, were combined into a single subcortical module (Sub).
Dynamic functional network construction and state analysis
The dynamic functional connectivity network (dFCN) was constructed using the novel edge-centric method (Esfahlani et al., Reference Esfahlani, Byrge, Tanner, Sporns, Kennedy and Betzel2022; Faskowitz, Betzel, & Sporns, Reference Faskowitz, Betzel and Sporns2022). Compared to the commonly used sliding window methods to estimate time-varying FC (Allen et al., Reference Allen, Damaraju, Plis, Erhardt, Eichele and Calhoun2014; Shakil, Lee, & Keilholz, Reference Shakil, Lee and Keilholz2016), the edge-centric method enables granular, frame-by-frame examination of interregional co-fluctuations. To estimate edge-centric dynamic FC, we first normalized the regional BOLD time series by z-scoring, such that
$ {z}_i=\frac{x_i-{\mu}_i}{\sigma_i} $
 , where μi and σi are the time-averaged mean and standard deviation of the time series xi in region i, respectively. Then, the moment-to-moment co-fluctuation magnitude of region i and j at timepoint t was calculated as rij(t) = zi(t)∙ zj(t). In that case, if the activity of both region i and j fluctuates simultaneously/oppositely, we will get a high positive/negative magnitude at a specific timepoint. Otherwise, we will get a low moment-by-moment magnitude. Repeating this procedure for all pairs of regions resulted in a 246 × 246 × 225 edge-centric co-fluctuation matrix for each participant, whose elements reflect the instantaneous co-fluctuations between regions. With the constructed dFCN, we further identified the recurrent dFCN states across the whole time series and computed several transition metrics to characterize state transition patterns, which are the number of transitions (NT), the fractional time on each state (FT), the mean dwell time on each state (MDT), and the transition probability (TP). For details of state analysis, please see Supplementary Methods.
Functional annotation of FCN or dFCN states
To further explore the functional relevance of the FC or dFC patterns, we use the Brain Annotation Toolbox (BAT) (Liu et al., Reference Liu, Rolls, Liu, Zhang, Yang, Du and Wang2019), a Neurosynth-based (https://neurosynth.org/) toolbox designed for functional and genetic annotation of neuroimaging findings. First, nodal degree centrality was calculated by summing up the edge weights of the corresponding FCN matrix or the representative matrix of dFCN states. Then, we quantified the similarity between the nodal degree centrality pattern of each FCN or dFCN state and activation patterns derived from 217 cognitive tasks. Functional annotations for FCN and dFCN states were determined by identifying the most significantly matched terms, with statistical significance assessed through a nonparametric permutation test (5000 permutations) and corrected for multiple comparisons using the false discovery rate (FDR) method.
Association between neurotransmitter and FCN or dFCN states
Neurobiological mechanisms underlying FC or dFC patterns were investigated by associating corresponding nodal degree centrality patterns with the 28 neurotransmitter-specific maps (Wang et al., Reference Wang, Chen, Li, Wu, Sun, Zhang and Wang2025) using the JuSpace toolbox (Dukart et al., Reference Dukart, Holiga, Rullmann, Lanzenberger, Hawkins, Mehta, Hesse, Barthel, Sabri, Jech and Eickhoff2021) (https://github.com/juryxy/JuSpace). This toolbox provides receptor/transporter distribution maps derived from previously published PET/SPECT studies in healthy participants using target-specific radioligands (e.g. serotonergic SERT: DASB) (for detailed information on included neurotransmitter maps, see Supplementary Methods). For each target, individual-level parametric images were averaged across healthy participants to generate a group map and linearly rescaled to 0 to 100. To test the spatial similarity between FC or dFC patterns and these neurotransmitter maps, Pearson’s correlation coefficients were calculated between the nodal degree centrality maps and each neurotransmitter map, followed by Fisher’s r-to-z transformation for normalization. Statistical significance of the correlations was assessed through a permutation test (5000 permutations), incorporating spatial autocorrelation adjustments. Multiple comparisons were corrected using FDR correction (q < 0.05).
Statistical analysis
Statistical analyses were performed using the MATLAB R2022a and SPSS v.28. For partial correlation analyses, the effects of age and sex were controlled, and multiple comparisons were corrected using the false discovery rate (FDR). For mediation analyses, we used the PROCESS macro implemented in SPSS (pre-set Model No.4). For moderated mediation analyses, we used the PROCESS macro implemented in SPSS (pre-set Model No. 58). A bootstrapping procedure with 5,000 iterations was implemented to evaluate the statistical significance of the mediation models (Hayes, Reference Hayes2017). For network-based statistics (i.e. functional connectivity), we used Network-Based Statistics (NBS) analysis (Zalesky, Fornito, & Bullmore, Reference Zalesky, Fornito and Bullmore2010). A significant threshold of individual-connection level was defined as p < 0.01 with an extent-based correction for multiple comparisons, 5000 permutations, and an overall corrected α < 0.05. All statistical analyses were controlled for covariates of age and sex. For details of statistical analysis, please see Supplementary Methods.
Results
Demographic and behavioral data
Table 1 presents demographic data. No significant differences were found between MDD patients and HC in demographic data such as sex, age, or years of education (ps > 0.05). As anticipated, MDD patients showed significantly higher HAMD/HAMA and RRS scores compared to HCs (ps < 0.05).
Relationship among glymphatic functioning, rumination, and depression
We found a marginally significant difference in glymphatic functioning, as indicated by the DTI-ALPS, between MDD patients and HC (t = −1.95, p = 0.055) (Figure 1B). Furthermore, partial correlation analysis revealed that the DTI-ALPS was negatively correlated with HAMD (r = −0.21, p = 0.071, FDR corrected), HAMA (r = −0.19, p = 0.076, FDR corrected), and RRS total score (r = −0.22, p = 0.071, FDR corrected) (Figure 1c,d), which suggested that lower glymphatic functioning is associated with more severe depressive/anxiety symptoms and ruminative tendency. Regarding the subcomponents of RRS, the DTI-ALPS was negatively correlated with the depressive component (r = −0.21, p = 0.071, FDR corrected) and the pondering component (r = −0.27, p = 0.046, FDR corrected) of RRS.
To further examine whether ruminative tendency can mediate the association between glymphatic functioning and severity of depressive symptoms, we conducted mediation analyses with RRS scores as the mediator, DTI-ALPS as the independent variable, and HAMD or HAMA as the dependent variable. Mediation analysis revealed that total scores of RRS negatively mediated the association between DTI-ALPS and HAMD (Total effect: β = −0.21, SE = 0.10, p = 0.046, bootstrapped 95% confidence interval [CI] = −0.42 to −0.004; Indirect effect: β = −0.17, SE = 0.073, bootstrapped 95% CI = −0.32 to −0.03; Direct effect: β = −0.04, SE = 0.073, p = 0.549, bootstrapped 95% CI = −0.19 to 0.10) (Figure 1e), where lower glymphatic functioning is associated with higher ruminative tendency and further results in more severe depressive symptoms. Regarding the subcomponents of RRS, significant mediating effects were also found in the depressive component (indirect effect: β = −0.16, SE = 0.076, bootstrapped 95% CI = −0.31 to −0.01; direct effect: β = −0.05, SE = 0.071, p = 0.452, bootstrapped 95% CI = −0.20 to 0.09) and pondering component (indirect effect: β = −0.14, SE = 0.058, bootstrapped 95% CI = −0.27 to −0.04; direct effect: β = −0.07, SE = 0.096, p = 0.453, bootstrapped 95% CI = −0.26 to 0.12) of RRS. Similar pattern was observed on the HAMA (total effect: β = −0.20, SE = 0.10, p = 0.063, bootstrapped 95% CI = −0.40 to 0.01), where RRS total scores (indirect effect: β = −0.15, SE = 0.063, bootstrapped 95% CI = −0.27 to −0.02; direct effect: β = −0.05, SE = 0.081, p = 0.557, bootstrapped 95% CI = −0.21 to 0.11), depressive component (indirect effect: β = −0.14, SE = 0.065, bootstrapped 95% CI = −0.27 to −0.01; direct effect: β = −0.06, SE = 0.081, p = 0.471, bootstrapped 95% CI = −0.22 to 0.10), and pondering component (indirect effect: β = −0.14, SE = 0.052, bootstrapped 95% CI = −0.255 to −0.05; direct effect: β = −0.06, SE = 0.096, p = 0.529, bootstrapped 95% CI = −0.25 to 0.13), negatively mediated the association between DTI-ALPS and HAMA.
Functional connectivity patterns underpinning glymphatic functioning, rumination, and depression
Static functional connectivity underpinning the glymphatic–rumination relationship
Based on the above findings, we would like to further explore how the glymphatic system contributes to rumination through the underlying human brain networks. First, we examined the association between static functional brain network (i.e. sFCN) and glymphatic functioning or rumination. In terms of rumination, NBS analysis revealed a broad range of static functional connectivity (FC) that negatively correlated with the total score (p corrected = 0.048) and depressive subcomponent (p corrected = 0.026) of RRS. The brain areas with predominant contribution in the ruminative network include putamen, superior temporal gyrus, posterior superior temporal sulcus, precuneus gyrus, precentral gyrus, and insular gyrus, which are mainly located in the default mode network (DMN), subcortical network (Sub), and somatomotor network (SMN). For the glymphatic functioning, NBS analysis revealed static FC that positively correlated with the DTI-ALPS (p corrected = 0.043), which primarily involved brain areas in the amygdala, basal ganglia, inferior parietal lobule, parahippocampus, posterior cingulate gyrus, and inferior temporal gyrus. These glymphatic-related areas are mainly located in the dorsal attention network (DAN), DMN, and subcortical network. In addition to FC, we also conducted an exploratory analysis to calculate the coupling between structural and functional network (SC–FC coupling) and explored its correlation with the DTI-ALPS and behavioral measurements (see Supplementary Methods). However, no significant correlation was observed in the SC–FC coupling.
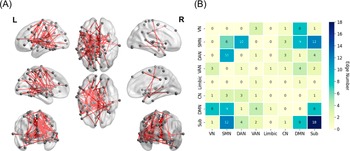
Then, to explore the static functional connectivity that underlies the association between glymphatic functioning and rumination, we calculated the overlapping FC pattern between them. Eighty-nine static FCs were found in both patterns. Specifically, these FC-connected brain areas of the putamen, posterior cingulate gyrus, amygdala, insular gyrus, and inferior temporal gyrus, which mainly involved inter- and intra-module FC among DMN, SMN, and subcortical network (Figure 2). Functional annotation analysis revealed 27 items that correlated with the overlapping FC pattern (permutation p < 0.05). The top 3 correlated items are ‘repetition suppression’ (permutation p = 0.004), ‘matching task’ (permutation p = 0.008), and ‘visual stimuli’ (permutation p = 0.008). But no item survived after the FDR correction.
Overlapping static functional connectivity pattern between glymphatic functioning and rumination. (a) Brain map of overlapping functional connectivity pattern. (b) Network distribution of the overlapping functional connectivity. VN, visual network; SMN, somatomotor network; DAN, dorsal attention network; VAN, ventral attention network; Limbic, limbic network; CN, control network; DMN, default mode network; Sub, subcortical network.

Figure 2. Long description
Panel A on the left displays six semi-transparent brain renderings from multiple angles, each with gray nodes and red lines representing overlapping static functional connectivity edges. The lines connect various regions across the cortex, with dense interconnections visible in both hemispheres. Panel B on the right is a square matrix chart with rows and columns labeled V N, S M N, D A N, V A N, limbic, C N, D M N, and Sub, representing different brain networks. Each cell contains a number indicating the count of overlapping edges between network pairs, ranging from 0 to 18. The color of each cell transitions from pale yellow for low counts to dark blue for high counts, as shown by the vertical color bar on the far right labeled ‘Edge number.’ The highest value, 18, appears at the intersection of Sub with itself, while other notable values include 12 for S M N to Sub and 10 for S M N to D A N and D A N to S M N. The matrix is symmetric, and the diagonal cells generally have higher values, indicating more within-network overlap.
Edge-centric dynamic functional connectivity states
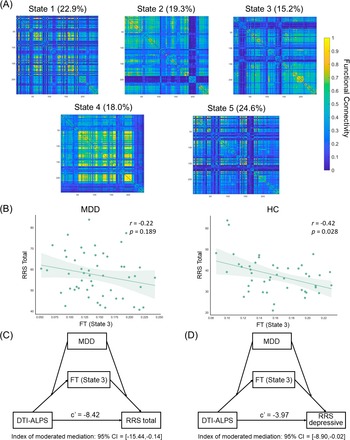
After state classification, five distinct dFC states were identified (see Figure 3a). The distribution of participants and time frames for each dFC state was as follows: State 1 emerged in all 96 participants (100%) and 4941 time frames (22.9%; MDD: 12.4%, HC: 10.5%); State 2 emerged in all 96 participants (100%) and 4169 time frames (19.3%; MDD: 10.9%, HC: 8.4%); State 3 emerged in all 96 participants (100%) and 3274 time frames (15.2%; MDD: 7.7%, HC: 7.5%); State 4 involved all 96 participants (100%) and 3895 time frames (18.0%; MDD: 8.8%, HC: 9.3%); and State 5 involved all 96 participants (100%) and 5321 time frames (24.6%; MDD: 13.4%, HC: 11.2%). According to the representative matrix of each state, State 1 exhibits stronger positive FC involving DAN and VAN, and weaker positive FC involving DMN and the Limbic network. State 2 exhibits stronger positive FC involving CN, DMN, and Subcortical network, and weaker positive FC involving VN and SMN. State 3 exhibits stronger positive FC involving SMN and Subcortical network, and weaker positive FC involving DAN, DMN, and CN. State 4 exhibits stronger positive FC involving SMN, VN, and DAN, and weaker positive FC involving DMN and the Subcortical network. State 5 exhibits stronger positive FC involving DMN, and weaker positive FC involving SMN, DAN, and VAN.
Edge-centric dynamic functional connectivity underlying the association between glymphatic functioning and rumination. (a) Representative connectivity matrices of each edge-centric FC state. The ratio indicates the portion of timepoints in each state. (b) Correlations between the fractional time of State 3 (FT [State 3]) and RRS total scores in MDD and HC. (c) Group effect of MDD moderated the mediating effect of FT (State 3) on the association between DTI-ALPS and RRS total scores. (d) Group effect of MDD moderated the mediating effect of FT (State 3) on the association between DTI-ALPS and RRS depressive subcomponent scores.

Figure 3. Long description
Starting at the top, five square connectivity matrices labeled State 1 through State 5 display functional connectivity values from 0 to 1, color-coded from blue to yellow. Each state shows a percentage: State 1 22.9 percent, State 2 19.3 percent, State 3 15.2 percent, State 4 18.0 percent, State 5 24.6 percent. Below, two scatter plots compare R R S Total versus F T State 3 for M D D and H C groups. The M D D plot shows r equals minus 0.22, p equals 0.189; the H C plot shows r equals minus 0.42, p equals 0.028. At the bottom, two mediation diagrams: the first links M D D, F T State 3, D T I dash A L P S, and R R S total, with c prime equals minus 8.42 and a 95 percent confidence interval from minus 15.44 to minus 0.14. The second diagram links M D D, F T State 3, D T I dash A L P S, and R R S depressive, with c prime equals minus 3.97 and a 95 percent confidence interval from minus 8.90 to minus 0.02.
Occurrence of dynamic functional connectivity states underpinning the glymphatic–rumination relationship
With the identified states, we explored the relationship between dFCN metrics (e.g. NT and FT) and glymphatic functioning or ruminative tendency. Significant negative correlations were observed between the fractional time of State 3 [FT (State 3)] and total scores of RRS (r = −0.32, p = 0.022, FDR corrected), depressive component of RRS (r = −0.31, p = 0.022, FDR corrected), and brooding component of RRS (r = −0.30, p = 0.025, FDR corrected). Notably, this relationship was different for MDD and HC, where only HC showed significant correlations between FT (State 3) and RRS (Total: r = −0.42, p = 0.028; Depressive: r = −0.39, p = 0.028; Brooding: r = −0.39, p = 0.028; all FDR corrected) (Figure 3b). No significant correlations were found between dFCN metrics (e.g. NT and FT) and glymphatic functioning in the whole sample. Regarding the correlation in each group, only HC showed a marginally significant correlation between FT (State 3) and DTI-ALPS (r = −0.27, p = 0.076), which is similar to the pattern in RRS.
Further, we wanted to explore whether the FT of State 3 can mediate the association between glymphatic functioning and rumination. We first conducted a mediation analysis with FT (State 3) as mediator, DTI-ALPS as independent variable and RRS scores as dependent variable. No significant results were found for either RRS total scores or RRS subcomponent scores. Considering the group difference in the above correlation findings, we conducted a moderated mediation analysis by adding group effect (i.e. the MDD and HC groups) as a moderator (Figure 3). We observed a significant moderating effect of the group variable on the mediation model of DTI-ALPS on RRS scores (total scores and depressive subcomponent scores) through FT (State 3) (RRS total: index of moderated mediation β = −0.09, SE = 0.059, bootstrapped 95% CI = −0.24 to −0.004; RRS depressive: index of moderated mediation β = −0.08, SE = 0.061, bootstrapped 95% CI = −0.24 to −0.001) (Figure 3c,d). Specifically, the FT (State 3) only significantly mediated the association between DTI-ALPS and RRS total scores (Indirect effect: β = 0.08, SE = 0.053, bootstrapped 95% CI = 0.006 to 0.21; Direct effect: β = −0.12, SE = 0.077, p = 0.107, bootstrapped 95% CI = −0.28 to 0.03) and RRS depressive component (Indirect effect: β = 0.07, SE = 0.055, bootstrapped 95% CI = 0.002 to 0.21; Direct effect: β = −0.19, SE = 0.076, p = 0.185, bootstrapped 95% CI = −0.25 to 0.05) in HC. No significant mediating effect was found in MDD or in other subcomponents of RRS.
Associations of functional network alterations with neurotransmitters
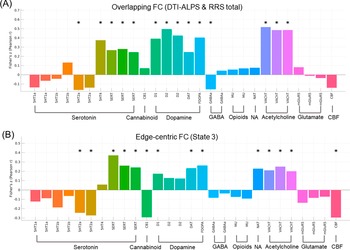
In the above findings, we revealed an overlapping static FC pattern and the fractional time of State 3 [FT (State 3)] that underlie the association between glymphatic functioning and rumination. To further explore the neurobiological mechanism of these observed patterns, we extracted nodal degree centrality from the overlapping static FC pattern and mean FC of State 3 and calculated their similarity with neurotransmitter maps. The overlapping static FC pattern exhibited significant spatial correspondence with various neurotransmitters (Figure 4a) (permutation ps < 0.05, FDR corrected), including several maps of serotonin (5HT2a_ALT, 5HT4, SERT_DASB, SERT_MADAM, and SERT_dasb), all the included dopamine, GABA (GABAa_FLUMAZENIL), and all the included acetylcholine. For the dFC of State 3, a broad range of neurotransmitter maps showed significant spatial correspondence with the FC pattern (Figure 4b) (permutation ps < 0.05, FDR corrected), which includes maps of the serotonin (5HT2a_ALT, 5HT2a_cimbi, SERT_DASB, SERT_MADAM, and SERT_dasb), cannabinoid, dopamine (D1_SCH23390, DAT_DATSPECT, and FDOPA_f18), and all the included noradrenaline, acetylcholine, and cerebral blood flow.
Spatial similarity between functional connectivity patterns and neurotransmitters. (a) Spatial similarity results of overlapping FC between DTI-ALPS and RRS total scores. (b) Spatial similarity results of representative edge-centric FC matrix of State 3. * p < 0.05, FDR corrected.

Figure 4. Long description
Panel A at the top shows overlapping functional connectivity between D T I dash A L P S and R R S total scores. The x axis lists receptor types grouped by neurotransmitter: serotonin (5 H T 1 a, 5 H T 1 b, 5 H T 2 a, 5 H T 2 c, S E R T), cannabinoid (C B 1), dopamine (D 1, D 2, D A T, F D O P A), G A B A (G A B A, G A B A a), opioids (M U), noradrenaline (N A T), acetylcholine (V A C H T), glutamate (m G l u R 5), and cerebral blood flow (C B F). The y axis is Fisher’s z (Pearson r), ranging from negative to positive values. Significant spatial similarity is marked with asterisk symbols above specific bars, notably for S E R T, D 1, D 2, D A T, F D O P A, N A T, V A C H T, and acetylcholine. Panel B below displays edge-centric functional connectivity for State 3, using the same x and y axes. Negative values are seen for serotonin and glutamate, while positive values dominate dopamine and acetylcholine groups. Significant results are again marked with asterisks, with the strongest positive spatial similarity for S E R T, D 1, D 2, D A T, F D O P A, N A T, V A C H T, and C B F. Each neurotransmitter group is visually separated by brackets under the x axis.
Discussion
This study investigated the neurobiological mechanisms underpinning the relationship among the glymphatic system, rumination, and MDD. Using the DTI-ALPS approach, we observed that glymphatic functioning was poorer in MDD patients. It was also negatively associated with the ruminative tendency, and the ruminative tendency negatively mediated the association between glymphatic functioning and severity of depressive symptoms. With analysis of brain connectivity, we found a broad range of overlapping functional connectivity patterns between glymphatic functioning and ruminative tendency. Furthermore, through edge-centric dynamic FC analysis, we found the fractional time of State 3 negatively associated with ruminative tendency. This time-varying FC feature further mediated the association between glymphatic functioning and ruminative tendency, which was only found in HC. Finally, the pattern of overlapping glymphatic–rumination FC and State 3 dFC spatially correlated with various neurotransmitter maps.
The glymphatic functioning of patients with MDD was significantly worse than that of the HCs. This finding suggests a potential impairment in glymphatic clearance in MDD patients, aligning with emerging evidence linking glymphatic dysfunction to psychiatric disorders (Hua et al., Reference Hua, Zeng, Zhang, Zhao and Yuan2025; Zhu, Yang, & Hashimoto, Reference Zhu, Yang and Hashimoto2025). Previous studies have demonstrated that the glymphatic system, responsible for clearing metabolic waste from the brain, may be disrupted in various neurological and psychiatric conditions (Boespflug & Iliff, Reference Boespflug and Iliff2018; Nedergaard & Goldman, Reference Nedergaard and Goldman2020). Our results extend these findings by providing preliminary evidence of reduced glymphatic function in MDD, which may contribute to the pathophysiology of the disorder. Furthermore, our partial correlation analyses revealed significant negative correlations between DTI-ALPS and clinical measures, including the HAMD and the RRS. These findings indicate that poorer glymphatic functioning is associated with more severe depressive symptoms and a greater tendency for rumination, potentially through neuroinflammatory pathways and disrupted neural homeostasis (Rasmussen, Mestre, & Nedergaard, Reference Rasmussen, Mestre and Nedergaard2018). The negative correlations between glymphatic functioning and rumination suggest that glymphatic dysfunction may be particularly linked to maladaptive cognitive processes, such as excessive self-referential thinking and brooding, which are hallmark features of MDD (Nolen-Hoeksema, Wisco, & Lyubomirsky, Reference Nolen-Hoeksema, Wisco and Lyubomirsky2008). In addition to depressive symptoms, we observed a consistent pattern in the relationship between DTI-ALPS and HAMA. These results extend the relevance of glymphatic dysfunction beyond depressive severity to broader emotional dysregulation in MDD. Considering that rumination is a shared cognitive vulnerability across the emotional spectrum (Cavicchioli & Maffei, Reference Cavicchioli and Maffei2022; Luca, Reference Luca2019), and in light of our mediation findings, these results point to a glymphatic–rumination pathway as a potential transdiagnostic target for mood disorders. Notably, the relationship between glymphatic dysfunction and depression may be bidirectional. For instance, reduced glymphatic functioning could impair brain health, exacerbating depressive symptoms, while depression-related sleep disturbances, known to disrupt glymphatic clearance (Ma et al., Reference Ma, Chen, Liu, Gao, Chen, Toh and Lee2025; Tao et al., Reference Tao, Zhou, Li, Ding, Wu, Wu and Shi2025), may further worsen glymphatic function, creating a vicious cycle. This speculation requires further validation with larger and longitudinal studies incorporating multimodal recordings (e.g. MRI and Polysomnography) to elucidate this bidirectional relationship.
Findings of static FC reveal a potential interplay between glymphatic functioning and rumination through shared FC patterns within the human brain networks. The observed negative correlation between rumination and static FC in the default mode network (DMN) and subcortical network (Sub) echoes prior work linking DMN hyperconnectivity to self-referential thought processes and depressive symptomatology (Tozzi et al., Reference Tozzi, Zhang, Chesnut, Holt-Gosselin, Ramirez and Williams2021; Zhou et al., Reference Zhou, Chen, Shen, Li, Chen, Zhu and Yan2020), and the work linking subcortical regions (e.g. amygdala and parahippocampus) to dysregulated emotion processing and retrieval of autobiographical memory (Cooney et al., Reference Cooney, Joormann, Eugène, Dennis and Gotlib2010; Fowler, Miernicki, Rudolph, & Telzer, Reference Fowler, Miernicki, Rudolph and Telzer2017). Notably, the overlap between rumination-related static FC and glymphatic-associated pathways, particularly involving the putamen, posterior cingulate gyrus, amygdala, and insula, suggests a mechanistic bridge between impaired cerebrospinal fluid (CSF) dynamics and maladaptive cognitive patterns. These regions, which are critical nodes in both DMN and subcortical networks, may represent vulnerable interfaces where inefficient glymphatic clearance of metabolites like β-amyloid or tau could disrupt neural communication, potentially exacerbating ruminative cognition (Gao, Liu, & Zhu, Reference Gao, Liu and Zhu2023; Shirolapov et al., Reference Shirolapov, Zakharov, Smirnova, Lyamin and Gayduk2024). Therefore, glymphatic dysfunction might compromise network stability in the human brain, indirectly fostering rumination. Additionally, functional annotation of overlapping FC with ‘repetition suppression’ and ‘matching tasks’ hints at impaired cognitive flexibility in ruminative states (Davis & Nolen-Hoeksema, Reference Davis and Nolen-Hoeksema2000), potentially modulated by glymphatic-related metabolite clearance. While these functional annotation results did not survive FDR correction, they align with previous evidence showing that high ruminative tendency is affected by abnormal cognitive flexibility and neural plasticity (Altan-Atalay, Kaya-Kızılöz, İlkmen, & Kozol, Reference Altan-Atalay, Kaya-Kızılöz, İlkmen and Kozol2022; Genet, Malooly, & Siemer, Reference Genet, Malooly and Siemer2013). Glymphatic dysregulation may exacerbate this in MDD patients. Future work integrating rumination-induction tasks and direct glymphatic imaging (e.g. MRI-based CSF flow metrics) could clarify their causal relationships. In our recent study, we found that glymphatic function is associated with SC–FC coupling in older adults, and this association is moderated by sleep quality (Ma et al., Reference Ma, Chen, Liu, Gao, Chen, Toh and Lee2025). The low correlation between SC–FC coupling and DTI-ALPS observed here may reflect differences in samples (MDD patients versus older adults) and the absence of sleep-quality measurements. To more comprehensively explore the relationship between SC–FC coupling and glymphatic functioning, future work should incorporate diverse and larger samples and investigate their relationship while controlling for relevant factors (e.g. sleep).
Although increasing research has highlighted the impact of the glymphatic system on human brain function, few studies have systematically examined their relationships from a time-varying perspective. We applied the novel edge-centric method (Esfahlani et al., Reference Esfahlani, Byrge, Tanner, Sporns, Kennedy and Betzel2022; Faskowitz, Betzel, & Sporns, Reference Faskowitz, Betzel and Sporns2022), which can capture the dynamic fluctuation of FC frame by frame, to explore how glymphatic functioning affects brain functional dynamics and how this relationship contributes to rumination. Brain state analysis can identify recurrent, transient patterns of functional connectivity (i.e. states). Prior work suggested that the fluctuations of neural signals are a multistable process, with region-to-region correlation (i.e. FC) patterns passing through multiple discrete states (Allen et al., Reference Allen, Damaraju, Plis, Erhardt, Eichele and Calhoun2014; Hutchison et al., Reference Hutchison, Womelsdorf, Gati, Everling and Menon2013). The observations of FC states aligned with the period of ‘hypersynchronization’ in macaques (Hutchison et al., Reference Hutchison, Womelsdorf, Allen, Bandettini, Calhoun, Corbetta and Chang2013) and the distinct FC states were related to the difference in EEG power spectra (Allen et al., Reference Allen, Damaraju, Eichele, Wu and Calhoun2018), indicating that FC states and EEG microstates may capture very similar physiological phenomena. In the current study, the negative correlations between fractional time in State 3 [FT (State 3)] and rumination scores, specifically in HC, suggest that reduced occurrence of this dynamic state may serve as a biomarker for ruminative tendencies. State 3 exhibits stronger FC involving the subcortical network and weaker FC involving CN and DMN. This observation concurs with previous findings demonstrating that stability of FC in these networks is related to rumination and depression (Kaiser et al., Reference Kaiser, Whitfield-Gabrieli, Dillon, Goer, Beltzer, Minkel and Pizzagalli2016; Kim et al., Reference Kim, Andrews-Hanna, Eisenbarth, Lux, Kim, Lee and Woo2023). The moderated mediation analysis further revealed that FT (State 3) selectively mediates the association between glymphatic functioning and rumination in HC. This finding supports the hypothesis that efficient glymphatic clearance of metabolic waste (e.g. β-amyloid, tau) maintains dynamic network stability (Barlattani et al., Reference Barlattani, Grandinetti, Cintio, Montemagno, Testa, D’Amelio and Pacitti2024; Rasmussen, Mestre, & Nedergaard, Reference Rasmussen, Mestre and Nedergaard2018), thereby preventing the maladaptive ruminative cognition. Notably, the direct effect and indirect effect here are opposite, indicating the existence of a suppression effect. State 3 may act as a protective pattern that can relieve the adverse effect of glymphatic dysregulation on the ruminative tendency. Accordingly, the absence of a mediating effect in MDD may suggest the disrupted protective role of State 3 and underscores the need to explore additional pathways, such as neuroinflammation or structural disconnection (Gu et al., Reference Gu, Li, Jiang, Huang and Wang2022; Ma et al., Reference Ma, Chen, Liu, Gao, Chen, Toh and Lee2025; Mogensen, Delle, & Nedergaard, Reference Mogensen, Delle and Nedergaard2021), that may be driven by the glymphatic influences in MDD. While HC individuals may rely on glymphatic-mediated homeostasis to sustain adaptive transitions between brain states, MDD patients exhibit rigid network configurations that resist such regulatory mechanisms. Overall, these results extend previous work by integrating a time-varying perspective into the glymphatic–brain framework, offering novel insights into how temporal network instability bridges glymphatic dysfunction and ruminative syndrome in MDD. Future studies combining real-time cerebrospinal fluid (CSF) flow imaging and dynamic connectivity could clarify causal interactions, while longitudinal designs may reveal whether glymphatic-targeted interventions (e.g. physical exercise) restore brain network stability and reduce rumination tendency. Converging human and animal evidence indicates that sleep optimization, particularly enhancing slow-wave sleep, reducing sleep fragmentation, and aligning circadian timing, facilitates perivascular exchange and glymphatic flux (Fultz et al., Reference Fultz, Bonmassar, Setsompop, Stickgold, Rosen, Polimeni and Lewis2019; Holth et al., Reference Holth, Fritschi, Wang, Pedersen, Cirrito, Mahan and Holtzman2019). Moreover, moderate-intensity exercise improves arterial pulsatility and endothelial function, thereby augmenting the vascular drivers of glymphatic flow (Olegário, Nóbrega, & Camargos, Reference Olegário, Nóbrega and Camargos2024; Yoo et al., Reference Yoo, Kim, Moon, Park, Cheon, Shin and Choi2025). These strategies could be operationalized through behavioral sleep interventions (e.g. cognitive behavioral therapy for insomnia [CBT-i]; Trauer et al., Reference Trauer, Qian, Doyle, Rajaratnam and Cunnington2015) and structured exercise prescriptions (Bull et al., Reference Bull, Al-Ansari, Biddle, Borodulin, Buman, Cardon and Willumsen2020) to disrupt the vicious cycle of rumination, though such therapies may require tailored applications in clinical populations like MDD.
The two key biomarkers revealed in the current study, the overlapping FC pattern between glymphatic functioning, and rumination and FT (State 3), share a broad range of neurobiological substrates. Both patterns show spatial correspondence to the serotonin, dopamine, and acetylcholine systems. These neurotransmitters are widely implicated in the neural mechanisms underpinning depression and rumination. For instance, diminished activity of serotonin pathways, which are associated with punishment prediction error and appraisal of emotional information, has been linked to the pathophysiology of depression (Cowen & Browning, Reference Cowen and Browning2015; Jauhar, Cowen, & Browning, Reference Jauhar, Cowen and Browning2023). Dysregulation of the dopamine system was related to abnormal reward-related processing and anhedonia symptoms in depression (Belujon & Grace, Reference Belujon and Grace2017; Dunlop & Nemeroff, Reference Dunlop and Nemeroff2007), while antidepressant treatment, such as agomelatine and ketamine, can relieve the depressive symptoms by restoring the dopaminergic neuron population activity (Belujon & Grace, Reference Belujon and Grace2014). Our findings add further evidence of the glymphatic effect to this neurobiological framework. The relationship between the glymphatic system and neurotransmitters is primarily indirect, mediated through its role in clearing metabolic waste, maintaining brain homeostasis, and regulating CSF bulk flow (Hablitz & Nedergaard, Reference Hablitz and Nedergaard2021). Abnormal accumulation of neurotoxic proteins (e.g. amyloid β and tau) can potentially trigger neuroinflammatory responses and lead to imbalances in neurotransmitter levels and potential neurotoxicity (Cai et al., Reference Cai, Zhang, Leng, Ma, Jiang, Wen and Hu2024). For example, chronic inflammation, if left unchecked, can activate enzymes like indoleamine 2,3-dioxygenase (IDO), diverting tryptophan metabolism toward neurotoxic quinolinic acid instead of serotonin synthesis (Bansal et al., Reference Bansal, Singh, Parhar, Kuhad and Soga2019; Hestad, Alexander, Rootwelt, & Aaseth, Reference Hestad, Alexander, Rootwelt and Aaseth2022). Together, these findings suggest that glymphatic inefficiency in MDD can hamper both static and time-varying aspects of FC as well as the neurochemical substrate in the human brain, which may jointly contribute to persistent ruminative cognition. Future studies could target these systems – for example, via pharmacological modulation of SERT or noradrenergic tone – to investigate causal relationships between FC dynamics, glymphatic function, and rumination.
The neurobiological underpinnings of the glymphatic–rumination relationship further illuminate the multifaceted pathology of depression. Reduced glymphatic efficiency correlated with aberrant static FC and reduced occurrence of State 3 dFCN involving the DMN and subcortical regions (e.g. amygdala, putamen), circuits critical for self-referential processing, emotional regulation, and cognitive control (Sheline et al., Reference Sheline, Barch, Price, Rundle, Vaishnavi, Snyder and Raichle2009; Xie et al., Reference Xie, Bratec, Schmid, Meng, Doll, Wohlschläger and Pekrun2016). These FC patterns spatially align with the distribution of serotonin, dopamine, and acetylcholine, suggesting that glymphatic impairment may exacerbate neurotransmitter imbalances known to drive depressive phenotypes, such as heightened negative bias (serotonergic dysfunction) and anhedonia (dopaminergic deficits) (Belujon & Grace, Reference Belujon and Grace2017; Cowen & Browning, Reference Cowen and Browning2015). This triad of glymphatic inefficiency, neurobiological dysregulation, and abnormal brain dynamics may synergistically sustain rumination by impairing the clearance of metabolic waste (e.g. amyloid-β, inflammatory cytokines), promoting neuroinflammation, and reducing synaptic plasticity (Gu et al., Reference Gu, Li, Jiang, Huang and Wang2022). Such mechanisms could trap individuals in a self-reinforcing loop of pathological introspection and emotional dysregulation, ultimately amplifying depressive severity. These insights position the glymphatic system as a novel therapeutic target, where interventions to enhance glymphatic flow (e.g. sleep optimization and physical exercise) (Olegário, Nóbrega, & Camargos, Reference Olegário, Nóbrega and Camargos2024; van Hattem et al., Reference van Hattem, Verkaar, Krugliakova, Adelhöfer, Zeising, Drinkenburg and Rosenblum2025) might concurrently restore neurotransmitter balance and brain network, thereby disrupting maladaptive ruminative processes in depression.
There are several limitations that should be taken into consideration. First, the current study is a cross-sectional study that examined the relationship among the glymphatic system, the brain functional network, and rumination in MDD. The findings do not offer causal insight into how the glymphatic system contributed to rumination. Future studies with a longitudinal design and a rumination-induction experimental paradigm will provide direct confirmatory evidence of the glymphatic functioning–rumination relationship. Second, the DTI-ALPS method is a deductive measure of glymphatic functioning. Although its validity has been proved in several studies, controversies regarding the mixing factors that contribute to the measured diffusivity while calculating the DTI-ALPS index still exist (Haller, Moy, & Anzai, Reference Haller, Moy and Anzai2024; Taoka et al., Reference Taoka, Ito, Nakamichi, Nakane, Kawai and Naganawa2024). The current findings may require further validation in future studies incorporating direct imaging of glymphatic functioning to provide more direct and comprehensive evidence.
Conclusion
Findings of our study provide significant insight into the relationship between glymphatic dysfunction, as indexed by DTI-ALPS, rumination, and MDD, highlighting the potential role of glymphatic functioning in the pathophysiology of depression. Interventions for promoting glymphatic functioning, through sleep optimization and exercise, should help manage rumination and halt the onset and perpetuation of depression.
Supplementary material
The supplementary material for this article can be found at http://doi.org/10.1017/S0033291726104292.
Acknowledgement
None.
Author contribution
J.M.: Investigation, methodology, formal analysis, writing – original draft, visualization. R.Z.: Methodology, data acquisition, review and editing. K.L.: Data acquisition, review and editing. T.M.C.L.: Conceptualization, supervision, project administration, funding acquisition, review and editing.
Funding statement
This project was supported by The University of Hong Kong May Endowed Professorship in Neuropsychology, the Hong Kong Research Grant Council General Research Fund (#17600522), and Guangdong-Hong Kong Joint Laboratory for Psychiatric Disorders (2023B1212120004).
Competing interests
All authors report no conflicts of interest.
Declaration of generative AI and AI-assisted technologies in the writing process
During the preparation of this work, the authors used the ChatGPT-4o in order to polish the manuscript and improve its readability. After using this tool/service, the authors reviewed and edited the content as needed and take full responsibility for the content of the published article.


 Open access

