

There are some chronological questions to address to understand what happened after the collapse of Teotihuacan: (1) Was there an immediate reoccupation of the valley? (2) When did the other occupations start? (3) Did the post-Teotihuacan groups coincide in time? (4) Was the Teotihuacan Valley continuously occupied? Moreover, improving the precision of the dates associated with the different ceramic styles would help refine the relative chronology and relate in time to the different areas within the valley or elsewhere.
Even though Teotihuacan is one of the most studied Mesoamerican sites, building robust chronologies based only on radiocarbon dating is a challenge due to different factors. The first group of difficulties are associated with the samples and contexts, mainly derived from the reoccupation of the structures and reuse of materials by the post-Teotihuacan groups, but also by looting either during Epiclassic, Postclassic, colonial, or modern times. The direct result of these practices is that some samples are dating an event not related to the context where they were found, what is known as inbuilt age. Other issues that complicate further the chronology construction for this period are related to the radiocarbon calibration curve, which has plateaus or pronounced wiggles that may result in considerably long or more than one calibrated periods, thus making it difficult to differentiate ages from samples of different temporalities as suggested by the archaeological information. Specifically, there are two plateaus with a duration of more than 100 calibrated years, the first one between 700 and 880 cal AD and the second one between 1000 and 1200 cal AD; both would result in calibrated ages spanning more than a century. Another difficult part of the curve is between 1260 and 1400 cal AD, with a pronounced wiggle centered at 1380 cal AD, which would result in calibrated dates with two separate intervals. All these issues hamper the possibility of building a high-resolution chronology with clearly differentiated phases, occupations, or events, if only radiocarbon ages are individually calibrated.
The initial objectives of the project “The Study of Tunnels and Caves in Teotihuacan,” led by Linda R. Manzanilla, were to understand the origin, economic importance, and ritual use of the tunnels in the Teotihuacan Valley but were further broadened to understand the way of life of the Coyotlatelco, Mazapa, and Aztec groups that occupied the abandoned city during the Epiclassic and Postclassic times (Manzanilla Reference Manzanilla and Linda2023). The geophysical explorations in the tunnels allowed us to identify that these cavities were not of natural origin and corresponded to quarry tunnels formed after the extraction of porous volcanic scoria by the teotihuacanos as construction materials for building the main structures in the city during the first centuries AD (Chávez et al. Reference Chávez, Encarnación Cámara, Tejero, Barba, Ortiz, Manzanilla and Linda2023). The extensive excavations inside the tunnels located to the east of the Pyramid of the Sun revealed that these cavities were intensively used after the collapse of the city, from the Epiclassic up to modern times, either for living and storage, fertility rituals, or as burial sites (Manzanilla et al. Reference Manzanilla, López and Freter1996).
Methodology
Chronological Data
The extensive excavations at the tunnels Cueva del Pirul (C. Pirul) and Cueva de las Varillas (C. Varillas) identified several activity areas and burials associated with Coyotlatelco and Mazapa groups, some with Teotihuacan pottery and materials, probably of Classic origin but looted during the subsequent occupations (Manzanilla et al. Reference Manzanilla, López and Freter1996). Domestic activity areas of modern, colonial, Aztec, Mazapa, and Coyotlatelco temporalities were identified.
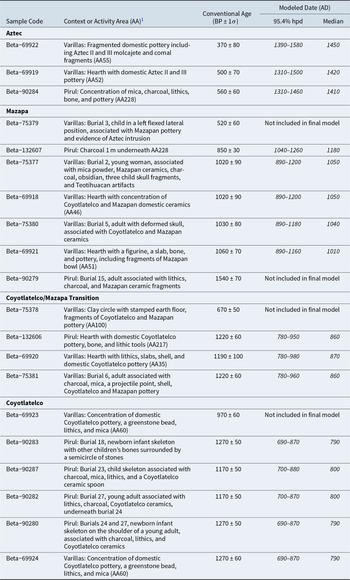
Despite the fact that four tunnels were excavated and samples from all of them were radiocarbon dated, in this work only ages from samples coming from C. Pirul and C. Varillas were considered because there are not enough radiocarbon ages for the other two tunnels. There are 24 radiocarbon ages in total; however, only 20 from well-defined domestic activity areas (AA) or burials were considered in the model (Table 1), all corresponding to charcoal samples.$
Radiocarbon Ages for Cueva de las Varillas and Cueva del Pirul.

Table 1 Long description
The table lists radiocarbon samples from Cueva de las Varillas and Cueva del Pirul, giving sample codes, excavation contexts or activity areas, conventional radiocarbon ages in years before present with uncertainty, and modeled calendar dates in AD with a 95.4 percent highest probability range and a median. Aztec-context samples are the most recent, with modeled ranges from about AD 1310 to 1580 and medians around AD 1410 to 1450, including hearths and domestic pottery deposits at Varillas and a mixed concentration at Pirul. Mazapa-context entries span earlier modeled dates where included, from about AD 890 to 1260, with medians near AD 1010 to 1180; several Varillas burials and one Pirul burial are listed, and some are not included in the final model. The Coyotlatelco and Coyotlatelco to Mazapa transition samples are generally older, with modeled ranges from about AD 690 to 980 and medians around AD 790 to 870, including multiple Pirul burials and hearth contexts at both sites. Several rows note “Not included in final model,” so those conventional ages should not be treated as directly comparable to the modeled AD ranges. Overall, the modeled chronology suggests earlier Coyotlatelco activity, followed by transition and Mazapa phases, and then later Aztec activity at both caves.
1 For a full description of the Activity Areas (AA) the reader is referred to Manzanilla et alia (Reference Manzanilla, López and Freter1996) and Manzanilla (Reference Manzanilla and Linda2023).
Bayesian Model
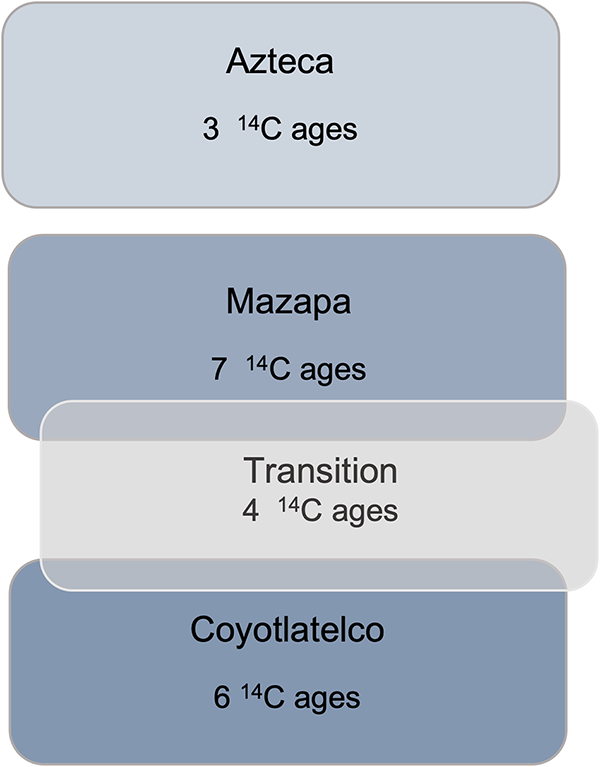
The model integrated both tunnels as one site because, as a result of their proximity and the archaeological evidence, it can be assumed that the occupations were contemporaneous. Samples were grouped according to the context characteristics and ceramic style. There are four sequential groups or phases with unknown beginnings and endings (Figure 1). The earliest group corresponds to Coyotaltelco with six samples, followed by a transitional phase between Coyotlatelco and Mazapa integrated by four samples. The third phase corresponds to the Mazapa occupation with seven samples. The last group is an independent phase integrated by three samples coming from activity areas with Aztec II ceramics.
Representation of the Bayesian model.

Figure 1 Long description
The diagram displays four sequential phases with associated radiocarbon ages. The phases are: Azteca with 3 14C ages, Mazapa with 7 14C ages, Transition with 4 14C ages and Coyotlatelco with 6 14C ages. Each phase is represented in a separate section, indicating a chronological sequence.
The model was calibrated using the online version of OxCal 4.4 (Bronk Ramsey Reference Bronk Ramsey2009a) using the charcoal outlier model (Bronk Ramsey Reference Christopher2009b) and the IntCal20 calibration curve (Reimer et al. Reference Reimer, Austin, Bard, Bayliss, Blackwell, Ramsey and Butzin2020). Results were evaluated in terms of the Agreement Index (A) calculated by OxCal. The calibrated dates are reported as 95.4% highest probability density with the corresponding median.
Results
Detecting Outliers
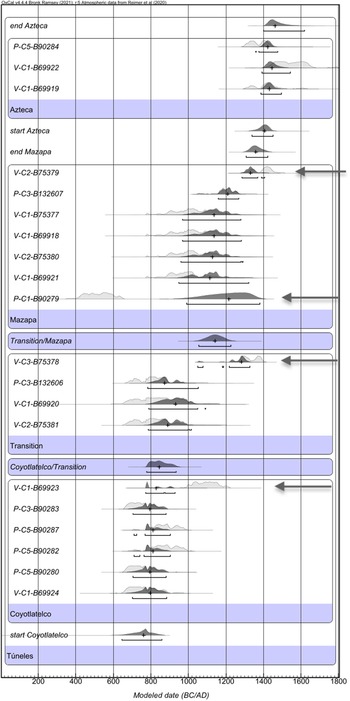
After the first run of the model (Supplementary Material 1), four samples resulted with a probability higher than 20% of being outliers, with low agreement indices. It can be seen in Figure 2 how the light gray probabilities marked by arrows are significantly out of range as compared to the dark gray areas corresponding to probabilities of the calibrated dates in accordance with the model. This means that these samples may come from altered contexts and thus may be discarded.
Results of the model including the outliers (indicated by arrows). Light gray areas indicate probability of dates calibrated without the model, and dark gray areas indicate the calibrated intervals using the Bayesian model.

Figure 2 Long description
The plot displays probability density distributions of calibrated dates for various samples, grouped by archaeological phases. The x-axis is labeled 'Modeled date (BCE/CE)' ranging from 0 to 1800. The y-axis lists samples by phase, including Azteca, Mazapa and Coyotlatelco/Transition. Each row represents a sample's calibrated date distribution, with light gray areas indicating probabilities without the model and dark gray areas showing calibrated intervals using the Bayesian model. Arrows mark outliers, which are significantly out of range compared to the calibrated intervals. Notable peaks occur in the Azteca phase around 1400 CE, while the Mazapa phase shows broader distributions. The Coyotlatelco/Transition phase contains several outliers, indicating potential discrepancies in context. The plot highlights differences in date clustering across phases, with Azteca samples clustering later than Mazapa samples.
The first outlier is in the Coyotlatelco group; it corresponds to sample Beta-69923, a charcoal sample from a concentration of domestic Coyotlatelco pottery (AA 60) in C. Varillas. Interestingly, sample Beta-69924 comes from the same context and the calibrated age does agree with the model, allowing us to date the AA 60 to the Coyotlatelco temporality. The second outlier is in the Transition group and comes from a clay circle with stamped earth floor and fragments of Coyotlatelco and Mazapan ceramics (Beta-75378, AA 100) in C. Varillas; the age is significantly later than expected, suggesting this context was altered after the Mazapa occupation. Sample Beta-75379 comes from burial 3 in C. Varillas, corresponding to a child with Mazapan materials but with evidence of Aztec intrusion; despite the fact that the probability of being an outlier is not as high as for the others, it was excluded because there is archaeological evidence of perturbation. Sample Beta-90279 from C. Pirul from burial 15 correpsonds to a Mazapa context by the materials but with an age significantly earlier than expected, apparently as a result of introduction of early materials at the moment of deposition in the pit.
Excluding Outliers
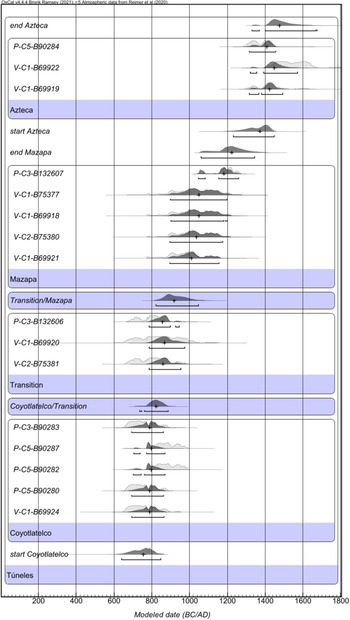
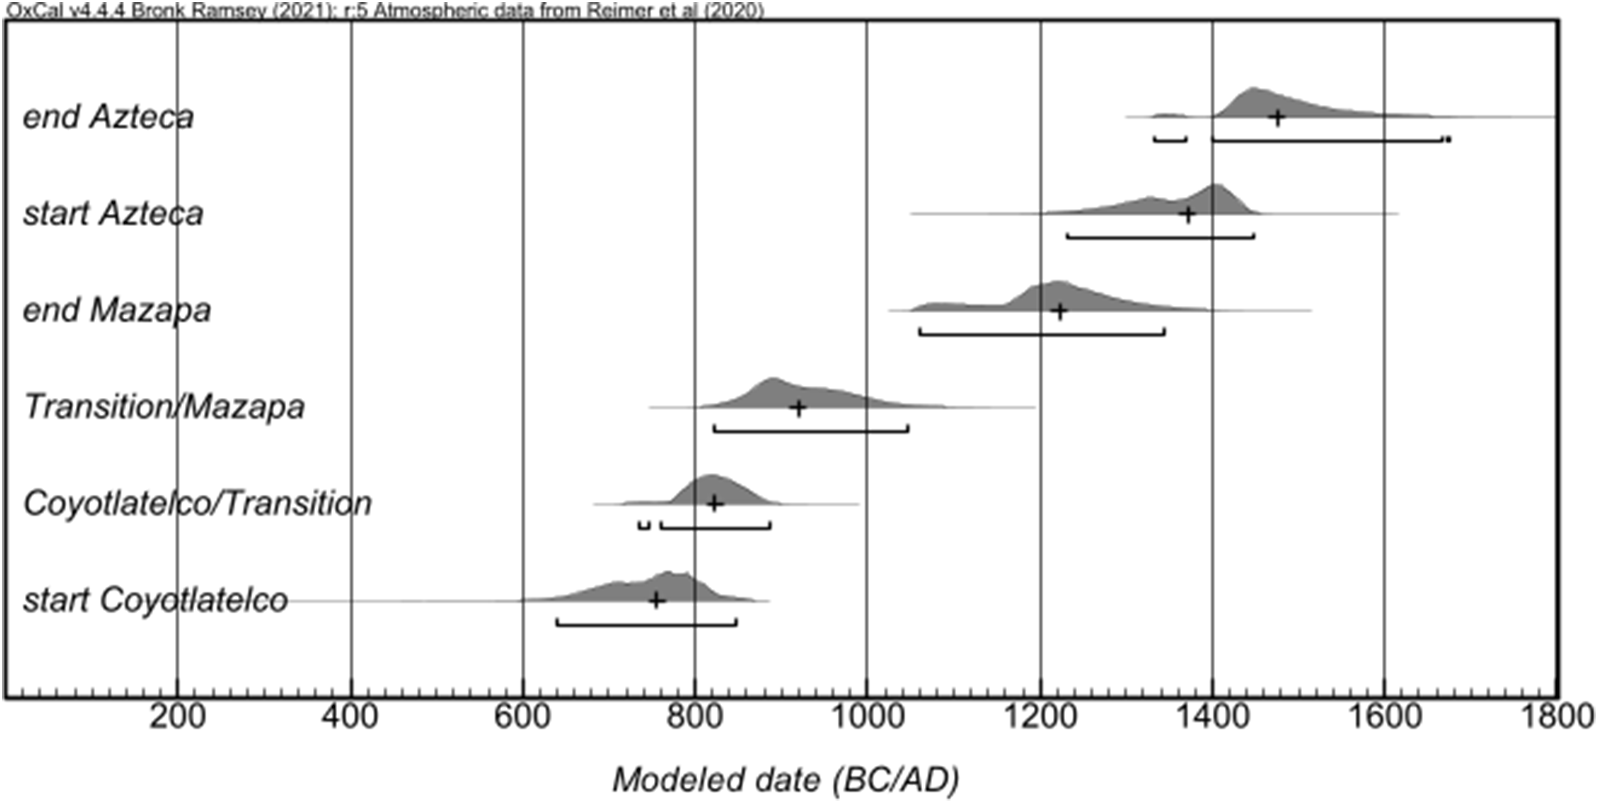
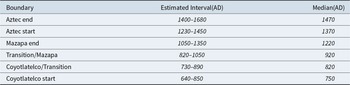
The model excluding the four outliers (Supplementary Material 2) resulted with an agreement index of 105%. The calibrated intervals for all samples are shown in Figure 3. The calibrated ages with the model are up to 62% shorter than the intervals obtained if calibrating without the model. An important aspect of the model is the possibility to distinguish the different occupations and estimate the timing of the beginning and ending for each group (Table 2, Figure 4).
Results of the model excluding outliers. Light gray areas indicate probability of dates calibrated without the model, and dark gray areas indicate the calibrated intervals using the Bayesian model.

Figure 3 Long description
Results of the model excluding outliers. A single stacked probability distribution plot with multiple horizontal rows grouped by labeled phases. The horizontal axis is labeled Modeled date (BC/AD). Tick labels shown are 200, 400, 600, 800, 1000, 1200, 1400, 1600, 1800. No vertical axis label is shown. Group labels and row labels shown, from top to bottom: Azteca and Azteca: P-C5-B90284; V-C1-B89922; V-C1-B89919. Azteca: start Azteca. start Azteca and Mazapa: P-C3-B132607; V-C1-B75377; V-C1-B89918; V-C2-B75380; V-C1-B89921. Mazapa. Transition/Mazapa: P-C3-B132606; V-C1-B89920; V-C2-B75381. Transition. Coyotlatelco/Transition: P-C3-B90283; P-C5-B90287; P-C5-B90282; P-C5-B90280; V-C1-B89924. Coyotlatelco: start Coyotlatelco. Túneles. Each row contains a horizontal distribution shape with a darker central band and a lighter surrounding band, plus thin horizontal line segments extending beyond the filled shape. The distributions for the Azteca and Azteca sample rows are centered around the 1200 to 1400 range on the modeled date axis. The start Azteca row shows a distribution centered around the 1200 to 1400 range. The start Azteca and Mazapa sample rows show distributions spanning roughly from the 800 to 1400 range, with several rows centered near 1000 to 1200. The Transition/Mazapa rows show distributions centered near 900 to 1100. The Transition row shows a distribution centered near 900 to 1000. The Coyotlatelco/Transition sample rows show distributions centered near 800 to 1000, with several rows clustered around 850 to 950. The start Coyotlatelco row shows a distribution centered near 700 to 900. The Túneles row label appears below the last group band, with no plotted distribution visible in that row.
Probability distributions for group boundaries. The median for each interval is marked by (+).

Figure 4 Long description
End Azteca start Azteca end Mazapa TransitionMazapa Coyotlateco/Transition start Coyotlateco The horizontal axis is labeled Modelled date (BC/AD), ranging from 200 to 1800 with labeled ticks at 200, 400, 600, 800, 1000, 1200, 1400, 1600 and 1800. Six horizontal rows are shown, each with a filled distribution shape and a thin horizontal interval line. end Azteca: A distribution centered near 1500, with the interval line spanning roughly from the mid 1300s to the mid 1600s. A median marker is shown near 1500. start Azteca: A distribution centered near 1400, with the interval line spanning roughly from the low 1300s to the mid 1500s. A median marker is shown near 1400. end Mazapa: A distribution centered near 1200, with the interval line spanning roughly from about 1050 to about 1350. A median marker is shown near 1200. TransitionMazapa: A distribution centered near 900, with the interval line spanning roughly from about 800 to about 1050. A median marker is shown near 900. Coyotlateco/Transition: A distribution centered near 800, with the interval line spanning roughly from about 700 to about 950. A median marker is shown near 800. start Coyotlateco: A distribution centered near 750, with the interval line spanning roughly from about 650 to about 850. A median marker is shown near 750.
Modeled Dates for the Boundaries of the Phases.

Table 2 Long description
The table lists modeled calendar dates in AD for phase boundaries, giving an estimated interval and a median date for each boundary. The earliest boundary is Coyotlatelco start, estimated 640 to 850 AD with a median of 750 AD. Next are Coyotlatelco to Transition at 730 to 890 AD (median 820) and Transition to Mazapa at 820 to 1050 AD (median 920). Mazapa end is estimated 1050 to 1350 AD with a median of 1220 AD, followed by Aztec start at 1230 to 1450 AD (median 1370). The latest boundary is Aztec end, estimated 1400 to 1680 AD with a median of 1470 AD. Overall, the medians move steadily later in time from early medieval to postclassic periods, and several intervals overlap, so boundaries should be interpreted as ranges rather than exact years.
For the Coyotlatelco occupation the beginning is estimated between 640 and 850 cal AD, with a median of 750 cal AD. For the transition Coyotlatelco/Mazapa the beginning is estimated at 730–890 cal AD (median 820 cal AD); this transition has a duration of about 100 years, ending at 820–1050 cal AD (median 920 cal AD). At this point, the model estimates the beginning of the Mazapa occupation, with an estimated duration of about 300 years, dating the end to 1050–1350 cal AD (median 1220 cal AD). Finally, for the Aztec period the beginning is estimated at 1230–1450 cal AD (median 1370 cal AD) and the ending between 1400 and 1680 cal AD (median 1470 cal AD).
Evaluating the Chronology
The results obtained for the modeled chronology estimates that the Coyotlatelco occupation starts about 200 years after the Big Fire, dated to 550–625 cal AD and considered the marker for the collapse of Teotihuacan (Beramendi-Orosco et al. Reference Beramendi-Orosco, González-Hernández, Soler-Arechalde and Linda2012; Reference Beramendi-Orosco, González-Hernández, Soler-Arechalde and Manzanilla2021). This seems to be a consequence of the lack of samples from Metepec contexts in the excavated tunnels. We cannot, however, rule out an occupation in the valley between the collapse and the start of Coyotlatelco activities inside the tunnels. Another interesting result of the modeled chronology is a 160-year hiatus between Mazapa and Aztec, which is in good agreement with the fact that the ceramics found in the AA inside the tunnels correspond to Aztec II and III styles (Manzanilla et al. Reference Manzanilla, López and Freter1996).
When comparing these results to previous chronologies for the Epiclassic and Postclassic in Central Mexico, the results of our chronology differ for some of the parameters. First, the model estimates the start of Coyotlatelco slightly later than previous chronologies, dating it to AD 550 and 650 (Buckley et al. Reference Buckley, Clayton, Gómez Chávez, Cabrera Castro, Eccles, Culleton and Kennett2023; Cowgill Reference Cowgill2015). For the end of the Coyotlatelco phase, both chronologies date it to AD 850, which is in good agreement with the 820 cal AD estimated with our model for the end of Coyotlatelco; however, if we consider that there was a transition between Coyotlatelco and Mazapa, our results suggest that the Coyotlatelco occupation lasted up to around 900 cal AD. However, the end modeled for the Mazapa phase is about 200 years later than previously proposed by Cowgill; we attribute this difference to the lack of Aztec I ceramics in the tunnels, so the Mazapa phase does not have a parameter to limit its end before the Aztec phase begins. Finally, for the Aztec phase, represented by samples from AA with Aztec II and III ceramics, the model estimates a slightly earlier ending than the end of Aztec III ceramics proposed by other chronologies (Overholtzer Reference Overholtzer2014).$
The Tunnels in the Teotihuacan Chronology
This research is part of a larger project to generate a robust high-resolution chronology for the Teotihuacan Valley, covering from Formative times through late Postclassic occupations. When integrating this chronology with the other chronologies we have generated in collaboration with Manzanilla (Beramendi-Orosco et al. Reference Beramendi-Orosco, González-Hernández, Urrutia-Fucugauchi, Manzanilla, Soler-Arechalde, Goguitchaishvili and Jarboe2009, Reference Beramendi-Orosco, González-Hernández, Soler-Arechalde and Linda2012, Reference Beramendi-Orosco, González-Hernández, Soler-Arechalde and Manzanilla2021), we can identify a hiatus of nearly 200 years between the Big Fire, dated to 550–625 cal AD, and the beginning of the Epiclassic occupations in the tunnels; however, this does not mean that there were no occupations in the area. An earlier Coyotaltelco occupation at La Ventilla was reported by Buckley et alia (Reference Buckley, Clayton, Gómez Chávez, Cabrera Castro, Eccles, Culleton and Kennett2023), suggesting a staggered reoccupation of Teotihuacan after the abandonment and highlighting the importance of incorporating chronometric data from other sites within the valley to refine the chronology for this period.
Conclusions
By combining a group of radiocarbon ages and archaeological information through a Bayesian model, it was possible to generate a chronology with higher resolution than when calibrating the radiocarbon ages individually. Furthermore, it is possible to distinguish the different post-Teotihuacan occupations inside the Cueva de las Varillas and Cueva del Pirul tunnels. We believe this new chronology helps to adjust other Epiclassic and Postclassic chronologies for Central Mexico.
The results obtained for Coyotlatelco and Aztec III periods are in agreement with other chronologies. However, the estimated end for the Mazapa period differs from other chronologies, presumably because the Aztec occupation in the tunnels corresponds to Aztec II and III period, and the model does not have another parameter to limit the ending of the Mazapa occupation. To our knowledge, this is the first Bayesian chronology for Teotihuacan that includes radiocarbon ages for samples associated to Mazapa and Aztec ceramics, highlighting the importance of continuing to work on the integration of chronometric data from other sites within the valley to generate a more robust and precise chronology to improve the understanding of the population dynamics, from the Formative to the Postclassic periods, and the processes of expansion and collapse of the Teotihuacan state.
Acknowledgments
We thank Dr. Linda R. Manzanilla for the opportunity to collaborate in the project and for all the fruitful conversations that resulted in this publication. Comments from two anonymous reviewers that helped to improve this manuscript are gratefully acknowledged.
Funding Statement
The project “Estudio de túneles y cuevas de Teotihuacan” was funded by the Instituto de Investigaciones Antropológicas–UNAM, the National Council for Science and Technology Mexico through grants P218CC00892832 (1989) and H9106-0060 (1991–1994); the Foundation for the Advancement of Mesoamerican Studies Inc. (famsi 95007 [1995]) and the Mesoamerican Research Foundation (1997).
Data Availability Statement
All data used are presented in the text.
Competing Interests
The authors declare none.
Supplementary Material
The supplementary material for this article can be found at https://doi.org/10.1017/laq.2025.10145.
Supplementary Material 1. Initial Bayesian Model (code).
Supplementary Material 2. Final Bayesian Model (code).


 Open access

