

1. Introduction
Drawing Sound in Space was devised for the six-piece Decibel new music ensemble, formed in Australia in 2009, whose concerts feature electronic and acoustic instruments (Decibel, n.d.). The ensemble has considerable experience with graphic and digital notations, commissioned and composed within the ensemble, including the development of their own music reading software, the Decibel ScorePlayer (Decibel, n.d.). Seven Australian composers were briefed to create new works using digital scores visible to audiences, avoiding standard projection formats on screens behind performers. Curated by the author as artistic director, the programme was designed with producer Tristen Parr and media artist Sohan Ariel Hayes. It was premiered in December 2023 at Rechabite Hall, Perth, Western Australia, to an audience of around 100 people.
The projection of dynamic notations is gaining popularity in concert settings, providing novelty for both performers and audiences (Armitage and Magnusson Reference Armitage and Magnusson2023). This offers audiences enriched aesthetic opportunities to understand processes and structures underlying musical works, as well as witness structural possibilities typically closed within performers’ navigation and decisions (Kim-Boyle Reference Kim-Boyle2018). Sharing music notation with audiences opens new opportunities for composers to redefine their concept of a score beyond instructions for musicians. Little research exists on screening music notation outside live coding and animated digital notation (Brown Reference Brown2005; Vickery Reference Vickery2010, Reference Vickery2012; Hope and Vickery Reference Hope and Vickery2011; Kim Boyle Reference Kim-Boyle2018). Cited exemplars involve fixed, standard ratio projections on screens behind performers, where performers read from projections with their backs to audiences, or from tablets mirroring screen versions. Recent score formats, such as animated notation, engage dynamic characteristics of screen media (Hope Reference Hope2017), breaking away from fixed ratios or two-dimensional presentations, providing opportunities to connect more meaningfully with audiences. The lack of composers engaging with this possibility is surprising, given that graphic notation already resists the standardisation imposed by paper pages, computer screens or projection ratios. Digital scores provide a ‘hardware–software combination that can support and enhance the connectivity of people, sound, space and score’ (Vear Reference Vear2019) and provide opportunities to design spaces where score reading is featured, currently rare in chamber music performance apart from decorative video or set uses.
The programme featured one extant and six newly commissioned works, listed in performance order:
-
1. as though my ears are your ears by Kezia Yap
-
2. Shadow Aria by Jaslyn Robertson (composed in Reference Robertson2022)
-
3. Bardju by Brenda Gifford
-
4. sum (some) of the parts by Donna Hewitt
-
5. Bad Snake Laugh by David Brown (aka Candlesnuffer) (a reworking of a 2005 piece)
-
6. The Forecast by Kate Milligan
-
7. after atmospheres by Lindsay Vickery/ György Ligeti.
Composers entered discussions with the author around presentation approaches and worked with Parr and Hayes throughout commission, rehearsal and performance timelines.
2. Historical background
The evolution from traditional Western notation to graphic and digital forms represents a fundamental shift in how musical ideas are communicated and interpreted. Traditional notation, with its precise symbolic representation of pitch, rhythm and dynamics, emerged from specific cultural and technological contexts prioritising reproducibility and standardisation (Cage Reference Cage1961). However, as composers explored extended techniques, electronic sounds and indeterminate processes in the mid-twentieth century, conventional notation’s limitations became increasingly apparent.
John Cage’s graphic scores of the 1950s and 1960s, such as Concert for Piano and Orchestra (1957–58), challenged notational orthodoxy by introducing visual elements requiring interpretation rather than direct translation (Pritchett Reference Pritchett1993). Similarly, Cornelius Cardew’s Treatise (1963–67) pushed graphic notation to a logical extreme, creating a 193-page visual score abandoning traditional musical symbols for abstract graphic elements (Cardew Reference Cardew1971). These works established what Hermann Sabbe termed the ‘aesthetic of ambiguity’, where scores become catalysts for creative interpretation rather than prescriptive instructions (Sabbe Reference Sabbe1975).
The transition to expanded digital notations represents both continuation and radical departure from graphic traditions. While maintaining interpretive flexibility characteristic of graphic scores, expanded digital notation introduces temporal and interactive dimensions impossible in static printed forms. Vear argues that digital notation functions as ‘a technically mediated communication interface between the creativity of a composer, the creativity of a performer and the creative mind of the listener’ (Vear Reference Vear2019), expanding the traditional composer-performer dyad to include audience and space as active participants in musical processes.
3. Methods
The role of space, context, environment and site in the arts shapes creation and reception of artistic works (Elina Reference Elina2023). The venue featured a raised stage in the classic proscenium arch, with flexible floor seating and flat-floored, wire-mesh balconies on three viewing sides. The raised stage floor space was halved, and ground floor audience was arranged in a U shape with the raised stage at one end, with stools providing balcony seating. The presentation approach designed musicians and props in different ‘zones’ around the central, flat floor area. Seven projectors were deployed – two on the raised stage, five around the balcony. Monitor speakers were placed around the performance area, pointing upwards from low stands, and accompanying audio parts were sub-mixed for different performance zones. The layout can be seen in Figure 1.
Diagram of bird’s eye view of the performance space. Crosses signal performer positions; lines represent projection surfaces – coloured to link with the various works. Yellow: projection surface sand performer positions for ‘Bardju’. Green: projection surfaces and performers’ positions for ‘sum (some) of the parts’ Red: elevated screen and de-prepared guitar positions, for Brown’s ‘Bad Snake Laugh’. Orange: approximate path of performers up to the stage, tracking walls and upper surfaces in Yap’s ‘as though my ears are your ears.’ Blue: the pool for ‘The Forecast’. Brown: vertical, semi permeable, black projection surface for ‘after atmospheres’. Speakers are indicated in black outlines. Not to scale.

Composers submitted video and still image files as score material, with variable attention to presentation design. Yap and Hewitt submitted multichannel videos with separate audio tracks without projection instructions, whereas Robertson and Vickery provided animated scores in the Decibel ScorePlayer. Milligan provided single-channel video with clear instructions for projection in a pool of water surrounded by speakers and performers, whilst Gifford and Brown presented illustrations only. Final presentation design decisions were made by the artistic director with input from musicians, producer and projectionist, prioritising a variation of ways to share scores with audiences. The design evolved using a practice-led methodology, where knowledge gained through performing informed presentation design.
4. Multimodal perception in audiovisual performance
Visual integration in musical performance draws upon established research in multimodal perception and cross-modal plasticity. Cognitive science studies demonstrate that visual information significantly affects auditory perception, with the McGurk effect providing clear examples of how visual cues alter what we hear (McGurk and MacDonald Reference McGurk and MacDonald1976). In musical contexts, this suggests visual presentations of notation can fundamentally alter audience perception and understanding of musical works. Sureshkumar Sekar’s concept of ‘accelerating audiovisual culture’ (Sekar Reference Sekar2022) explains how contemporary audiences increasingly expect visual engagement in musical performance, shaped by decades of multimedia art, live coding performances, ubiquitous music videos and streaming platforms combining audio and visual elements. The challenge for Drawing Sound in Space composers was moving beyond decorative or illustrative visuals, and towards a constitutive audiovisuality, where visual elements become integral to musical process, structure and meaning.
5. Notation as social practice
Recent scholarship emphasises social dimensions of musical notation, moving beyond technical representation questions to examine how notational practices reflect and shape social relationships within musical communities. Kay Kaufman Shelemay’s work on notational communities highlights how different groups develop distinct notational practices serving specific social and aesthetic functions (Shelemay Reference Shelemay2011). This perspective is particularly relevant for understanding how digital notation practices can challenge traditional hierarchies between composers, performers and audiences and to distributed agency concepts in Actor-Network theory (Latour Reference Latour2005), which provides a lens for understanding how music notation systems operate. Rather than viewing notation as neutral communication tool, we can understand it as an actant participating in shaping musical outcomes. In Drawing Sound in Space, elements such as water, walls, curtains, found materials, lights and architectural features become active musical process participants, exercising what Jane Bennett terms ‘thing-power’ (Bennett Reference Bennett2010).
6. Audience engagement and musical understanding
Traditional musical communication models typically position audiences as passive recipients of musical information transmitted from composers through performers. However, research in music cognition and phenomenology suggests musical meaning emerges through active processes of perception, interpretation and embodied engagement (Leman Reference Leman2008). Embodied cognition concepts suggest our music understanding is fundamentally shaped by physical and sensory engagement with musical materials. The participatory turn in contemporary art practice has created new frameworks for understanding how audiences can be active participants in artistic processes, resulting in new forms of social engagement. Yet uncritical assumptions about participation’s democratising potential can be overstated or even dangerous (Bishop Reference Bishop2012). Sharing music notation can create meaningful forms of audience participation and engagement that go beyond novelty or entertainment to foster deeper understanding of musical processes, enriching concert experiences.
7. Spatial dimensions of musical performance
The concept of space in musical performance operates on multiple levels: physical performance venue space, acoustic space created by sound diffusion, space between performances and audiences and conceptual space of musical relationships and structures. Henri Lefebvre’s triadic model of space – perceived space (spatial practices), conceived space (representations of space) and lived space (representational spaces) – provides useful frameworks for understanding how Drawing Sound in Space operates across different spatial dimensions (Lefebvre Reference Lefebvre1991). In traditional concert settings, spatial arrangements typically reflect hierarchical relationships between performers and audiences, with clear delineations between performance and reception spaces. The proscenium arch theatre, with elevated stage and fixed seating, reinforces these traditional divisions. However, contemporary practices in installation art, immersive theatre and site-specific performance demonstrate that alternative spatial arrangements can fundamentally alter aesthetic dynamics of artistic encounters.
8. A framework of spatial digital notation
Drawing upon these theoretical perspectives, a framework for understanding spatial digital notation practices can assist in evaluating musical communication and audience engagement. Each program work will be discussed via four key dimensions: Semiotic Expansion, examining how digital notation expands semiotic resources available for musical communication, incorporating visual, spatial and temporal elements uncapturable in traditional notation. This expansion allows more complex and nuanced musical expression while creating new interpretive challenges. Temporal Engagement, where digital notation introduces temporal dimensions unfolding in real-time, creating dynamic relationships between notation, performance and perception evolving throughout musical experiences. Distributed Agency, where digital notation systems distribute agency across multiple actants – composers, performers, audiences, technological systems and environmental elements, creating emergent musical outcomes unpredictable or uncontrollable by any single participant, reinforcing notation as social practice. Spatial Reconfiguration, where notation is projected into three-dimensional space challenges traditional spatial arrangements of musical performance, creating new possibilities for performer-audience interaction and challenging hierarchical relationships between different musical process participants. These are investigated below.
9. Surface as sign and sound: Yap, Hewitt and Milligan
The impact of surface on projected notations was a feature across the programme. Yap’s as though my ears are your ears explores the composer’s curiosity around her work being presented in places she had never visited, representing desire for ‘long distance familiarisation’ of venues, framing work as processes of ‘thinking through the lens of the room itself simultaneously constituting and realising a score, where the performers get to know the space through touch and sound’ (Yap in Hope Reference Hope2023). Yap’s score was delivered as short video collections featuring blurry dots moving around black backgrounds. Audio tracks were delivered separately, including the composer’s voice describing experiences of touching building surfaces, supported by ambient electronic sounds and wordless singing. In conjunction with the composer, it was decided that video and associated audio part intents were to be replicated rather than reproduced in live presentations, with score materials informing performance processes, scores and related audio created in real-time, challenging semiotic positioning of scores and redistributing inherent agency.
This was undertaken by having two performers enter the building from doors on either side, with one operating close-up torch lights tracing the rough surfaces of 1930s Rechabite walls and balcony support structures, creating a real-time generated score. They were followed by another performer wearing gloves fitted with wireless pickup microphones (Figure 2a). These traced the torch light path on the building, replicating Yap’s video pace and directionality, where beam height signalled pitch and size signalled volume. Audio was spatialised across six speakers following performer directions as they moved along venue sides – three speakers each side – with timbral treatment by electronics performer Stuart James. This was a duet with four performers: two score makers and two score readers, creating score and sound almost instantaneously. Performers wove around audiences, concluding by tracking the theatre curtains pulled across the stage (Figure 2b). Here, the sonic landscapes changed from raw, scraping sounds produced by the gloves to a smooth vocalising by all four performers, replicating the style of Yap’s original vocalisations. In this way, walls, floors, crevices, balconies, corners, fixings and curtains were performed throughout the short, introductory piece.
(a) Screenshots showing the two performers in Yap’s work as though my ears are your ears, tracking the balcony structure, one holding a light, the other operating the microphonic glove. (b) shows the shining of the torches on the curtain at the conclusion of the piece.

The work dramatically expands musical communication beyond that offered by traditional notation by incorporating the building’s physical surfaces as semiotic resources. The instantaneous ‘light scores’ created multi-modal sign systems where light, visual movement, tactile exploration and sonic production are unified in unique temporal engagement. Raw to smooth sound transformations demonstrate how the same spatial notation can generate different semiotic meanings depending on surface and distance. Height-to-pitch and beam-size-to-volume mappings establish expanded vocabularies for musical expression and redistribute composer agency to venue structure, score and sound makers weaving through buildings. Audiences become spatially integrated into the performance as performers move around them, dissolving conventional stage-audience boundaries. Dual-entry points create decentralised performance spaces where multiple focal points emerge simultaneously and the building’s structural characteristics become co-creators rather than merely venues, with physical details serving as performative elements.
as though my ears are your ears creates complex temporal layering where composer concepts of tactile exploration exist in dynamic relationships with live realisations. Real-time score creation through torch movement means notation, performance and perception unfold simultaneously rather than sequentially. The choice to replicate rather than reproduce score information created new staging opportunities that allow temporal variation while maintaining structural coherence. The work exemplifies distributed agency through complex networks of human and non-human actants. Technological systems (pickups, speakers, electronic processing) participate in meaning-making processes, with James’s timbral treatment adding distributed interpretation layers. The audience’s perceptual uncertainty becomes part of the work’s emergent meaning, demonstrating how musical outcomes emerge from multiple agent interactions rather than being predetermined by a single composer. Musical communication is enhanced by creating multiple, simultaneous meaning-making channels while fostering deeper audience engagement through spatial and temporal integration into performance processes.
Hewitt provided the score for sum (some) of the parts as four black and white videos showing closeup expressions on the composer’s face, divided into quarters, featuring each eye, nose and mouth, with instructions on reading videos as music scores. A fixed electronic track plays in the work’s second half, radically altering the sound colours after a beginning featuring viola, cello, bass flute and clarinet, played through four speakers surrounding performers at the stage end. Sum (some) of the parts compares facial expressions to conductor roles in music performance, seeing them as creating ‘a silent universal language that conveys a wealth of information and emotion. They hold a profound significance within the realm of music, theatre and visual media as a powerful tool for artists and semiotic for audiences’ (Hewitt in Hope Reference Hope2023).
To render these videos in space, four different surfaces were selected – two circular bass drum skins of different sizes and two large pieces of roughly edged cardboard, situated on the raised stage area. Different surfaces contributed different shades to projections – darker beige from cardboard, brighter white from drum skins – influencing performer interpretations. Visual artist Kate McMillan’s installation work often uses techniques of projecting onto sculptures or screens prepared with cardboard layers to ‘colour’ projection perceptions (McMillan Reference McMillan2023). Further, two performers held the drum skins, involuntarily providing small amounts of shimmering movement to projections (Figure 3). This and Yap’s work engaged the venue’s proscenium arch by providing scores, not performers of works.
The stage set up for Donna Hewitt’s sum (some) of the parts, showing the performers who were not playing holding the drum skin projection surfaces, and the position of the four players.

Transforming facial expressions into musical notation created novel notational resources that operate as both performance and conducting tools, creating complex semiotic systems where traditional musical symbols are replaced by embodied human expressions, providing multi-layered scores where performers must decode emotional and gestural information into musical responses with interpretive flexibility. The work fundamentally reconfigures traditional spatial arrangements through projection design. Mapping projections onto diverse screen dimensions and surfaces departs from fixed projections typical of most digital notation presentations, creating intimate, embodied spatial relationships highlighted by performers physically holding projection surfaces for their colleagues. Scores become shared elements where different surface textures actively participate in musical processes, and dynamic temporal relationships through real-time unfolding of facial expressions evolve. Real-time interpretation of facial expressions unfolding continuously throughout works highlights temporal relationships between composed and live elements, creating meaningful real-time relationships between video, electronics, projection and live performance. Performers sometimes found these hard to ‘translate’ into musical material via the instructions provided, but over multiple rehearsals, agreed interpretations and structural elements were established.
Sum (some) of the parts demonstrates distributed agency across multiple actants: composer, performers, projection surfaces, electronics and screen holders. Drum skins and cardboard projection surfaces actively shape visual information and consequently musical responses, whereas fixed audio tracks serve as both compositional elements and performance guides. Non-playing ensemble members become active participants by holding projection surfaces – whose movement affects musician responses – engaging multiple human and non-human actants productively. Emergent musical outcomes cannot be predicted or controlled by any single element. Surface textures, subtle movements of ‘surface performers’, and real-time interpretations by musicians all contribute to musical results beyond the composer’s initial conceptions.
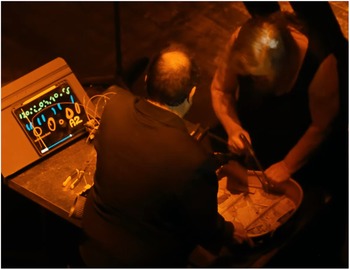
Similar reliance on surface was key to Kate Milligan’s The Forecast design and interpretation. Animated, circular projections provided by the composer mixing words and conventional music notation elements, projected into a shallow, circular pool of water, disrupting traditional performer-audience hierarchies. The work is accompanied by quadraphonic audio of whispering, distributed in speakers situated between performers around the shallow, black lined pool from where the performers read the score (Figure 4), expanding communicative resources by using water as dynamic notational media, where ripples from coin tosses create real-time score alterations.
Some of the performers around Kate Milligan’s score for The Forecast during rehearsal, showing the projection in the water.

Texts are sourced from weather reports in old West Australian newspaper editions published one hundred years before premiere dates, and performers can choose to switch from performing to whispering projected texts occasionally. Images are occasionally altered by performers throwing coins into the pool, like a wishing well, with ripples providing distortion to the scores’ imagery and text. Milligan also worked with percussionist Louise Devenish to construct a coin instrument, adding delicate sonic reinforcement to the actions. Milligan conceives water as a co-creator of live, interactive elements.
‘Combined with the visual metaphor of a wishing well, these archival texts encourage us to think about humanity’s historical entanglement with natural systems, and the methods we use – magical or scientific – to reconcile with these greater forces. At the core of The Forecast is the balance of human (text) and non-human (generative, watery) notation. Performers respond to both with semi-structured improvisation… a performance-installation wherein water is a co-creator’ (Milligan in Hope Reference Hope2023).
Circular projection features in works by Icelandic composer Bergrún Snæbjörnsdóttir, whose Esoteric Mass (2014) for sixteen wind instruments features circular, animated graphic scores projected onto performance space floors around which performers stand. Unlike Snæbjörnsdóttir, Milligan’s work features live, interactive elements when coins are tossed into water by performers.
The work creates multiple temporal layers – historical (100-year-old weather predictions), real-time (coin tosses and ripple responses) and durational flexibility through organic, water-based score transformations. Most significantly, the work distributes creative control across human performers, composers, technology, historical texts and, notably, water itself as a co-creator. The Forecast demonstrates how digital notation can address contemporary environmental and cultural concerns while maintaining rigorous attention to musical innovation.
10. Sounds in symbols: Brown and Gifford
Both David Brown and Brenda Gifford produced fixed hand drawings as scores. Gifford’s Bardju (“footprints” in Australian Indigenous Dhurga language) was delivered as a colour image created on a computer, with some instructions around key. The image had been used as inspiration for other works by Gifford, delivered in traditional notation – quartet versions of the same name performed by Ensemble Offspring (Gifford Reference Gifford2017/21), a cycle for voice and chamber ensemble entitled Music for the Dreaming (Gifford Reference Gifford2017), and solos for percussion and orchestra arranged by Jessica Wells (Reference Gifford2023).
This time, Gifford engaged the original diagram as the only score material. Gifford had written about putting inspirational images in motion using the Decibel ScorePlayer before this opportunity (Gifford Reference Gifford2023). As a result, two score modes were created – projection and Decibel ScorePlayer file – the latter allowing the work to be performed by ensembles without the projection mapping engaged in this concert. After discussions with Gifford, new projection images were devised from the original drawing as inspiration, and a new audio track was created to accompany the bass flute, bass clarinet and cello. Decibel member Stuart James created field recordings in bushland near his home in Swan Hill, Western Australia. These included sounds of birds, trees moving in wind, cracking twigs and insects spatialised across six speakers. The field recordings served similar roles to audio in The Forecast and sum (some) of the parts, providing stimulus, structure and connection for performers in otherwise very open scores. Combinations of visual scores with field recordings create complex semiotic environments where natural sounds interact with abstract visual symbols.
Gifford’s image (Figure 5a) was adapted for projection by Hayes (Figure 5b) and became a ‘mobile snake’ travelling as a loop across the metal meshwork balconies upstairs and opaque black screens above velvet curtains highlighted in Yap’s work. The design and movement references giant ancestral water snakes in the local Noongar culture, the Waakal (Bracknell et al Reference Bracknell, Horwitz, Ryan and Marshall2022: 411). Projection screens were made from black shade cloth, a permeable material that is invisible when not projected upon, and see-through when it is.
(a) The original score image provided by Gifford for Bardju, (b) an excerpt of the projection image devised by Hayes, animated in a snake-like way during the performance, that also acted as a score.

The sinewy snake projections were read by performers, following general instructions provided by Gifford. Each performer was assigned a balcony balustrade as a reading point, or ‘playhead’, a term used for the performance point in the Decibel ScorePlayer (Hope and Vickery Reference Hope and Vickery2015). The projection encompassed the audience, and score segments could be seen by all, but the whole score was never seen by anyone, not even performers, creating a democratisation of musical reading. This challenges traditional notions of unified musical leadership and shared temporal experience, and presentations reconfigure spatial relationships of traditional chamber music performance where architecture becomes active, directional components of musical works. Gifford describes the score as
‘the tracks/pathway, footprints and journey on country. The piece Bardju was about each of us taking care of country and treading lightly on her’. (Gifford, in Hope Reference Hope2023).
This version was a natural step after the traditionally notated versions – looping back to image as the container of meaning. As an Indigenous Yuin woman, Gifford’s drawings reference Indigenous symbolism and drawing practices, accompanied by specific instructions around pitch, speed and dynamics associated with different landmarks and activities in the image, described as
‘a journey from a woman’s camp to the community camp, and the experiences along the road, such as the water hole they visit, animals and landmarks they see along the way. A journey that encompasses the old and the new’ (Gifford in Hope Reference Hope2023).
This presentation provides a radical expansion of semiotic resources beyond conventional Western notation in visual, cultural and temporal senses. Like Milligan’s work, natural elements are part of the musical expression. In performance, the projector beam lights performers, linking them closer to colour schemas of the drawing, but also linking to Robertson’s light scores appearing beforehand (see below). Projector lights thus become performative elements themselves, creating visual connections between scores and musicians impossible in traditional notation systems (Figure 6). The reference to the Waakal in the projection design links local Indigenous concepts of place and journey with the composer’s Yuin country, incorporating traditional cultural knowledge systems predating Western notational practices (Yungaporta Reference Yungaporta2021). The presentation transcends traditional notation boundaries while maintaining deep cultural significance, functioning as a form of cultural cartography – encoding not just musical information but spiritual, geographical and social knowledge about place and journey, showing how the same cultural content can be expressed through different notational systems while maintaining essential meaning.
The light from the projectors for Gifford’s composition Bardju providing a link between the performers and the score; the animated notation is seen above the performers.

Bardju operates across multiple temporal scales – immediate performance timelines, cyclical time of animated loops and deep cultural time represented by journey narratives, creating temporal polyphony where different time scales interact. Animation transforms static visual elements into temporal processes, where scores themselves become temporal performers alongside musicians. The field recording provides temporal anchors that guide but don’t determine musical flow, creating temporal coordination that maintains both structure and flexibility, granting agency to Australian landscapes themselves, where birds, wind and insects become active participants in musical processes rather than background elements. This highlights the link between Yuin and Noongar Country, distributing agency beyond human performers to ancestral knowledge systems and Country itself. Hayes’ creative agency facilitates Gifford’s original drawings, demonstrating how digital notation systems can enable collaborative authorship extending beyond original composers.
The presentation of Bardju represents how spatial digital notation can support culturally specific musical practices while challenging conventional performance hierarchies. It points to digital notation’s potential in its capacity to make space for different ways of knowing, being and relating to place, suggesting new possibilities for how digital notation might serve as tools for cultural preservation, transmission and transformation in contemporary musical practice.
Another adapted work was Bad Snake Laugh, by David Brown, where hand-drawn scores were reformatted for reading in Decibel ScorePlayer. Beginning as an improvised recording by Candlesnuffer (Brown’s solo performer name) designed to provide ‘ensemble accompaniments’ for Brown’s prepared guitar performances, the work featured on the CD release Aposomeophone (Reference Brown2005) before its realisation as a ‘pictorial score’ (Brown in Hope Reference Brown2023). The original drawing was intended to represent the recorded track using various coloured ballpoint pens. The illustration was intended as catalysts for creative interpretation, rather than a prescriptive instruction set. Yet Brown’s coloured shapes and lines function as expanded semiotic resources using visual elements uncapturable in traditional notation, which nonetheless communicate essential musical information. Suggestions for instruments are named and indicated in different colours (Figure 7a). After scanning the document at high resolution, the illustration was treated in a graphics programme to clarify and contrast shapes for performer reading, which often occurs at a distance from the tablet where the score was being read from, with some colour changes to reflect wider range of available instruments – guitar, piano, harp, percussion, cello and viola. The score was then set on a black background to enable the image to ‘float’ in a projection (Figure 7b). Score transformations through digital processing – scanning then adjusting for clarity and contrast – demonstrate how digital notation can expand semiotic resources available for musical communication, incorporating visual, spatial and temporal elements.
(a) A copy of an excerpt of the original pictorial score for Brown’s Bad Snake Laugh. (b) showing how the same segment of the original was shown in the adapted score.

Just as Brown’s drawings had been arrived at after repeated listening, Decibel members’ rehearsal was assisted by repeated listening of the original Candlesnuffer track alongside the digital scrolling score, providing ‘timbral guides’ for instruments so they may replicate the sonic characteristics of the recording. This process was aided by embedding the audio in the Decibel ScorePlayer, where it synchronises precisely with the scores as it scrolls, facilitating learning. This process of developing familiarity with the score through repeated listening of the source audio demonstrates how digital notation can create temporal bridges between different work versions, allowing performers to internalise complex musical relationships difficult to communicate through static notation alone. Synchronisation between original recordings and new scores creates temporal engagement where notation becomes dynamic interface between past and present performances, where performance relationships to the original Candlesnuffer recording reveal how distributed agency operates across temporal boundaries. These influence networks demonstrate that hardware-software combinations support and enhance connectivity of people, sound, space and score. Score presentations challenge traditional composer-performer dyads by creating multiple points of entry for audience engagement before (drawings and recordings), during (performances and visuals) and after (Decibel ScorePlayer file) performances.
The percussion and string assignment was as per the original indication. An acoustic guitar was added, which was deconstructed (or ‘de-prepared’) through the performance using hardware tools. These performance techniques, as well as being a reference to ‘prepared guitar’, were inspired by a review of the original album describing it as ‘vicious shards of guitar and skull-shattering percussion’ (Warburton Reference Warburton2005), a description realised in the gradual and violent destruction of an acoustic guitar into wooden shards. This way, the guitar body also becomes part of the score as a map for finding sounds, a form of tactile score (Van Eck Reference van Eck, Tomas, Gorback, Tellioglue and Kltenbrunner2022). Two performers ‘playing’ the guitar can be seen reading scores scrolling in Decibel ScorePlayer to one side of instruments (Figure 8). This gradual deconstruction creates an irreversible temporal trajectory, as well as a performance dramaturgy fundamentally tied to instrument-score material properties. Its dual role as instrument and score demonstrates Bennett’s concept of ‘thing-power’ in action, where the guitar exercises agency in musical processes through material properties and transformation capacity. Tools become extensions of both performer and score, where the guitar is simultaneously a surface for inscription and an evolving source of sound via it’s gradual deconstruction. The notation operates simultaneously across different spatial and temporal domains in works, with each element contributing to overall musical outcomes in ways unpredictable or uncontrollable by any single participant. The transformation of the guitar from instrument to score to sonic material creates musical outcomes from interactions between human agency and material properties. The irreversible nature of these transformations creates temporal engagement unfolding in real-time, creating dynamic relationships between notation, performance and perception.
The score for Dave Brown’s Bad Snake Laugh being followed by the ‘guitarists’.

The original Candlesnuffer recording features Japanese vocalisations sampled from Japanese film director, Akira Kurosawa’s Samurai films, spelt out on the score, and performed live by the guitar performers. References to film formed a rationale for projection design, which was more abstract than other works, and the only projection not read as a score during performance. The new score was distorted using static effects, to appear as a scratchy old film or analogue television in between stations. Spatial relationships emerged from these unfollowable, decorative score projections and audiences had opportunities to engage with notational material explicitly not functional for performers. The projection incorporated cinematic and cultural references impossible to notate conventionally, demonstrating how digital notation can distribute agency across multiple systems simultaneously, creating new possibilities for performer-audience interaction.
David Brown’s Bad Snake Laugh demonstrates distributed agency through complex networks of human and non-human actants. Original Candlesnuffer recordings, hand-drawn scores, visual digital processing, acoustic guitars and hardware tools, acoustic instruments and projection systems all participate in emergent musical outcomes unpredictable or uncontrollable by any single participant. Spatial reconfiguration of scores was achieved through deployment of multiple, simultaneous scoring systems across traditional Decibel ScorePlayer displays, acoustic guitars and projections, transcending traditional boundaries between composer, performer and audience. This work presentation demonstrates how well digital notation can function as technically mediated communication interface. Bad Snake Laugh preparation and performance demonstrate transformative potential of spatial digital notation to create new forms of musical communication operating across multiple dimensions of human and non-human agency.
11. Cascading scores: Robertson and Vickery
Jaslyn Robertson’s Shadow Aria employs the Decibel ScorePlayer to create a cascading score system where the lighting operator reads a vertically scrolling digital score (Figure 9a) to control six spotlights, thereby creating a secondary score for musicians through light, who are influenced by a third score, a fixed audio track, which is heard differently by each performer as it is distributed around the six speakers in the space. The spatialisation affects each performer’s musical response, something Robertson had discovered and welcomed in previous performances of the work (Robertson et al Reference Robertson, Moroz, Hope, Vear, Sanadzadeh, Svoboda and Sobek2024). Musicians improvise in darkness but must freeze when illuminated, responding to both the spatialised audio track and unpredictable lighting interruptions (Figure 9b). This expands musical notation’s semiotic resources by establishing light as a primary notational element across three layered systems: digital scroll notation, light-based notation, and spatial audio information.
(a) showing an excerpt screenshot of the scrolling score for Robertson’s Shadow Aria lighting operator. (b) shows a performer with the spotlight on them, frozen in place, during rehearsal, while other musicians in the ensemble play in the dark.

The work is a provocation around historical erasure, informed by an interview undertaken by Robertson with Australian composer Helen Gifford, which led her to focus on censorship by using lighting (on and off) and performance (frozen, silent), and emphasis is forced onto the silent performer in the light, and the active performer in the dark. Instead of illuminating performers to make them visible to audiences, light becomes a silencing mechanism. This creates an oppositional spatial redistribution where visibility equals musical death, and musical life exists only in darkness. As Robertson remarks
I have wondered how many pieces have been lost, or never written, due to the lack of opportunities given to marginalised people. In this piece, we hear the accompaniment to a silent soloist (Robertson in Hope Reference Hope2023).
Shadow Aria transforms silence and darkness into compositional elements, creating a negative notation where environmental changes, rather than symbols, instruct cessation. The temporal unpredictability – musicians never knowing when light will strike – creates embodied precarity that mirrors historical patterns of marginalising voices in music. It exemplifies distributed agency through its network of human and technological actors, interacting in space, which embodies the score. The lighting operator’s agency directly impacts musical performance, while spatialised audio influences individual responses. The work challenges traditional hierarchies by positioning the score itself as censorship mechanism, determining who can read, interpret and respond to notational instructions.
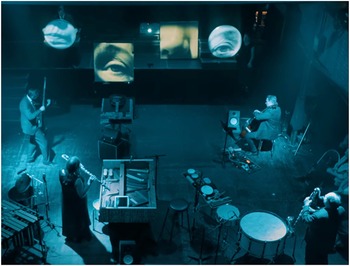
Lindsay Vickery’s after atmospheres, created for Hungarian composer Gyorgy Ligeti’s centenary year, transforms the composer’s Atmospheres (1961) for six Decibel performers and electronics (Vickery, Reference Vickery2023). Musicians read scores in the Decibel ScorePlayer while a projection cascades vertically from venue ceiling to pool edge, showing a flowing spectrogram of a recording of Ligeti’s Atmospheres abstracted and hand-coloured in real-time by Hayes (Figure 10a). This creates temporal structure mirroring Ligeti’s ‘frozen time’ concept while establishing vertical spatial narrative that transforms traditional stage-audience relationships (Ligeti Reference Ligeti and Toop1999). The permeable black screen allows performers to be visible through the projection, dissolving separations between notation, performance and visual representation (Figure 10b). The electronics feature synthesised missing frequencies of the Ligeti composition not performed by the instruments, as it was originally composed for an orchestra of over ninety independent parts. It also includes live processing of the ensemble diffused through six speakers. This creates an immersive acoustic environment where the microtonal soundscape characteristic of the original work, combined with the vertical projection, places the audience within rather than outside the musical texture.
(a) The hand-coloured image of the spectrogram in Vickery/Ligeti’s after atmospheres. (b) The stretched projection with the performers around it (note the piano harp performers visible behind the screen in this photo taken from the balcony).

The presentation of this work operates across multiple semiotic systems simultaneously. As traditional notation for the six performers, spectral analysis, colour coding, spatial positioning of the performers around the projection and electronic synthesis. This expansion allows the work to capture nuances of Ligeti’s original that would be impossible with traditional notation alone, particularly the microtonal relationships and dense polyphonic textures in the reduction of parts. The multiple temporal streams – live performance, electronic processing, projection movement and the real-time colour and dimension changes create emergent musical outcomes via multiple actants. As in Brown and Gifford, the Decibel ScorePlayer is an actant participating in the musical process, rather than serving as a passive tool. Similarly, Milligan’s pool, which reflects the projection, and the roof where the projection ‘disappears’ become active participants in the work, again exercising Bennett’s ‘thing-power’.
Both works operate across multiple semiotic systems simultaneously, demonstrating how spatial digital notation addresses notational communities by fostering collaborative creation spanning composition, performance, visual art and technology
12. Conclusion
Drawing Sound in Space offered a compelling demonstration of how spatial digital notation can transform the concert experience for both performers and audiences. By creating new modes of semiotic expansion, spatial reconfiguration, temporal engagement and distributed agency, the programme reimagined the score as a dynamic, spatial, multimodal interface – one that is as much about perception, interaction and environment as it is about musical instruction.
The diversity of surface materials – water, velvet, cardboard, drum skins, black shade cloth, architectural surfaces and even the performers themselves – became integral to the projection and interpretation of each score. These surfaces were not merely passive backdrops but active agents in shaping the sonic and visual experience navigated in space. The range of score types – literal, symbolic, gestural, environmental and performative – challenged conventional boundaries of notation and performance, inviting audiences into a more immersive and interpretive role.
Electronic elements spatially extended the acoustic ensemble and deepened the expressive potential of each work. The spatial arrangement of projection surfaces and sound sources created a fluid, multidirectional performance environment, where attention shifted organically between zones of activity. This spatial choreography mirrored the conceptual shifts in the scores themselves, reinforcing the idea that notation is not fixed but contingent and responsive to space, time and context, creating a new form of constitutive audiovisuality.
Importantly, the programme encouraged composers to think beyond the screen and beyond the performer, to consider notation as a medium of communication with the audience. Works like Milligan’s The Forecast, Gifford’s Bardju, Robertson’s Shadow Aria and Vickery’s after atmostpheres exemplified how digital notation can embody cultural, political, historical and environmental narratives, while others like Brown’s Bad Snake Laugh and Yap’s as though my ears are your ears explored the physical, tactile and architectural dimensions of sound and score.
Ultimately, Drawing Sound in Space expanded the possibilities of what a score can be and do. It demonstrated that digital notation is not merely a technological update to traditional systems, but a significant conceptual shift away from them – one that invites new relationships between composer, performer, audience and environment. As composers and ensembles continue to explore these possibilities, spatial digital notation may well become a vital tool for reimagining the future of music performance and its role in contemporary culture.
Acknowledgements
The works in this programme were commissioned with funds from the Digital Score project (DigiScore), funded by the European Research Council under the European Union’s Horizon 2020 research and innovation programme (Grant agreement No. ERC-2020-COG – 101002086). I would like to thank Professor Craig Vear and Dr Solomiya Munoz for their support of this project. I would also like to thank my fellow Decibel members for their ongoing support of the Decibel project: Tristen Parr (cello, producer), Lindsay Vickery (reeds), Stuart James (electronics), Aaron Wyatt (viola) and Louise Devenish (percussion). Kate Milligan’s pool was built by Mark Haslam with Tristen Parr. The photographs featured in this article are stills from a video of the performance and rehearsals created by Edify Media. The project was also supported by Monash and Edith Cowan University, Australia. Karl Ockelford provided editorial assistance on this paper.


 Open access