

1. INTRODUCTION
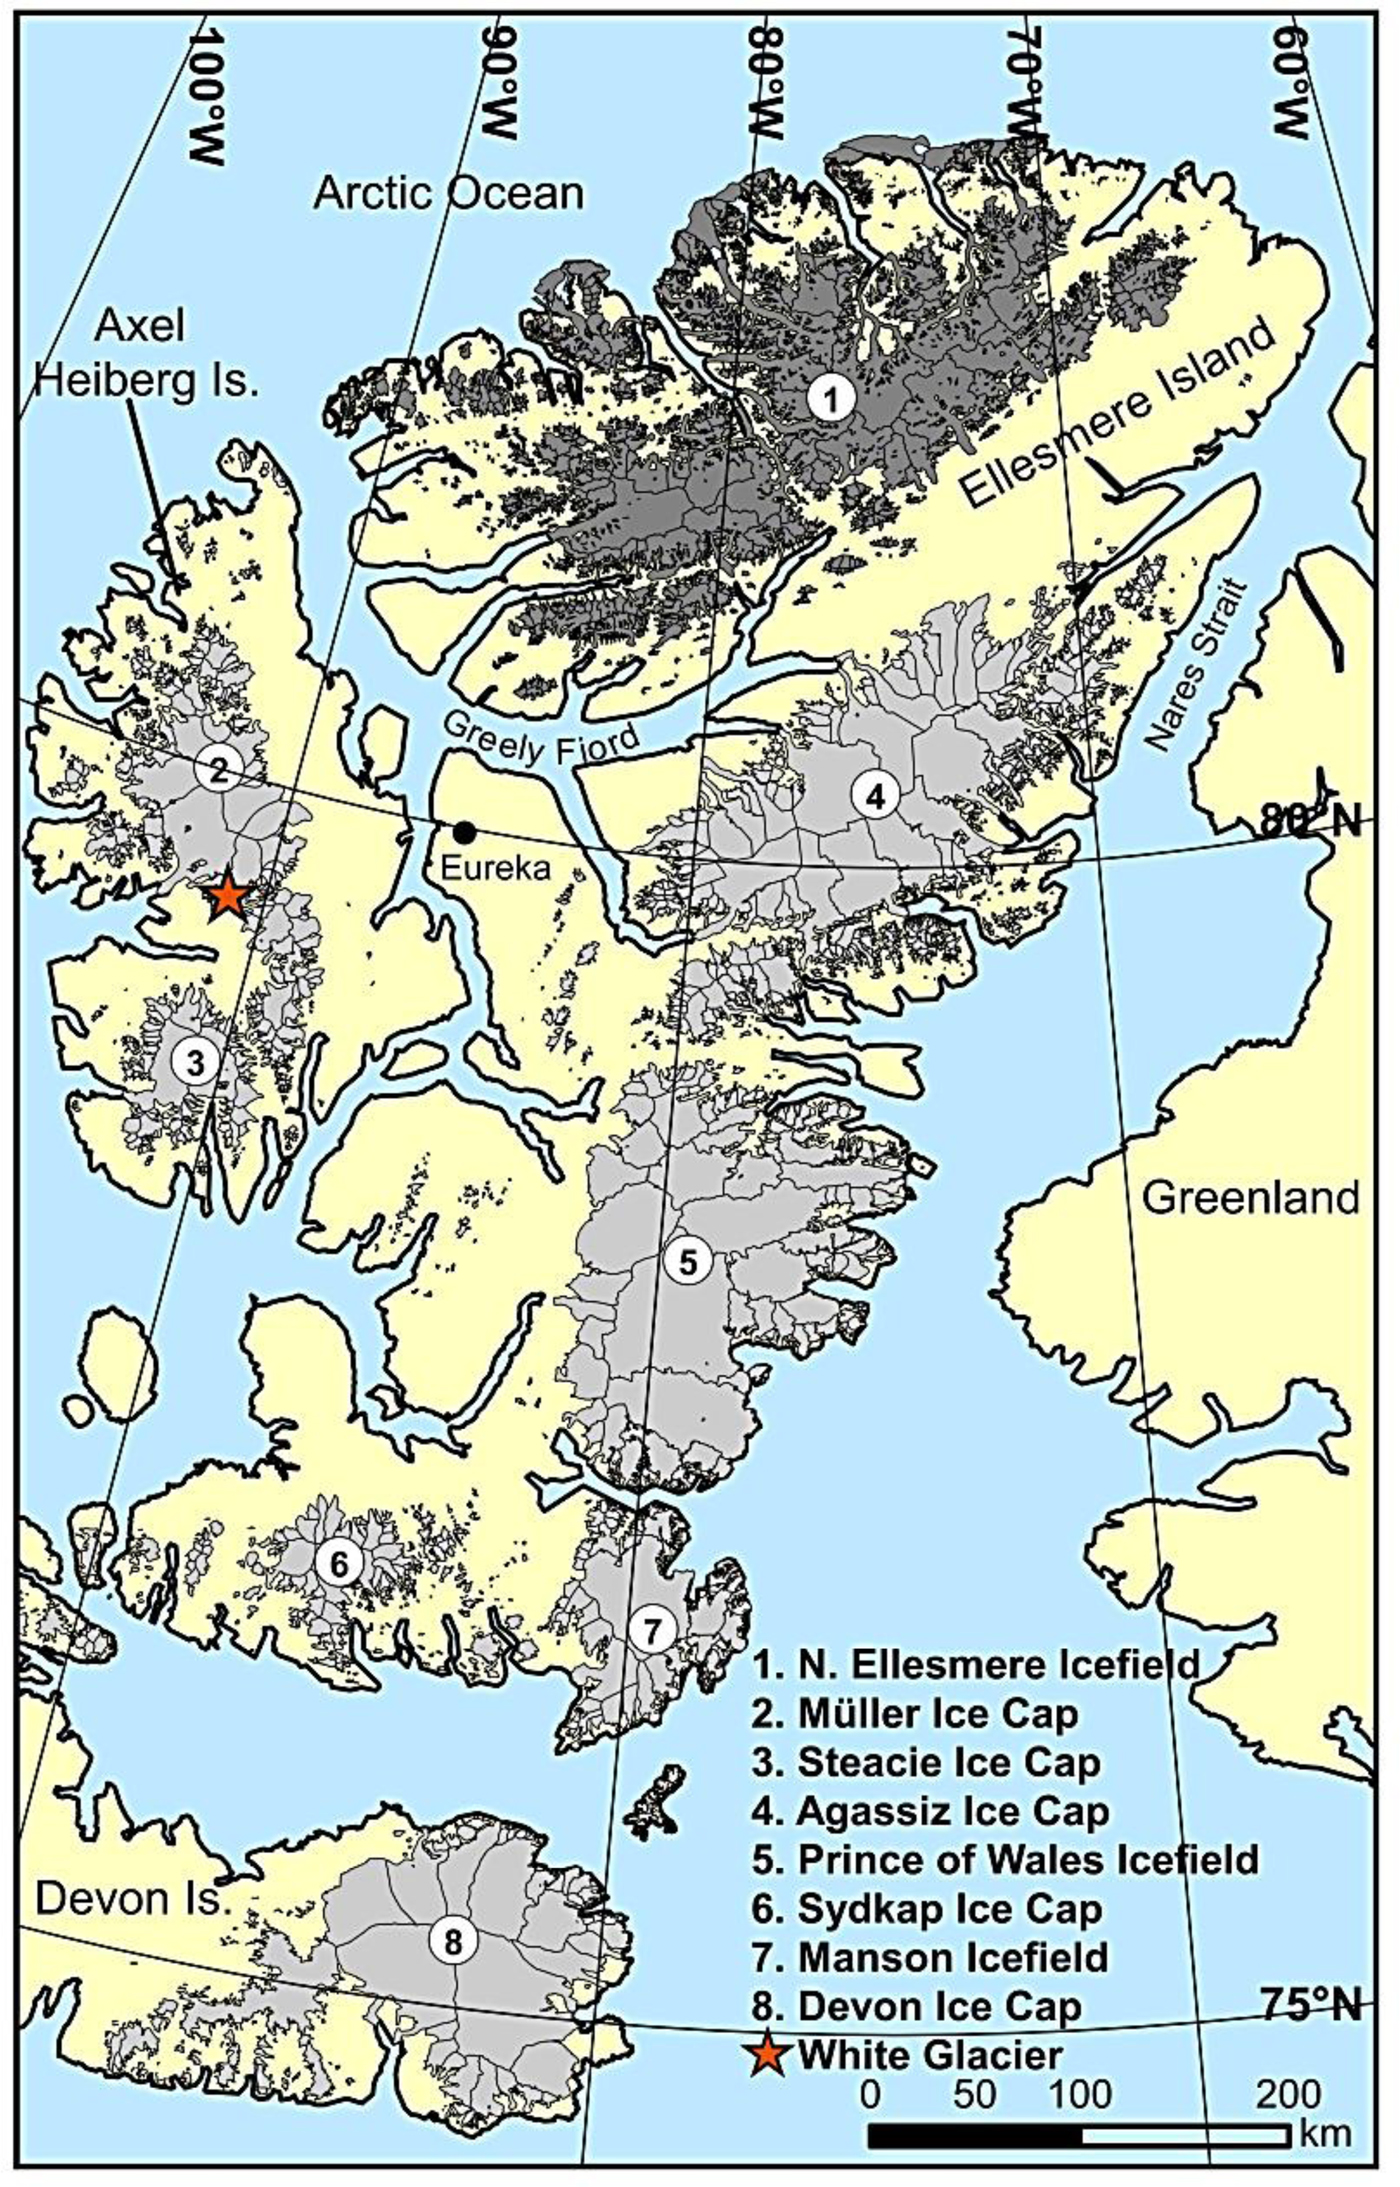
The Canadian Arctic Archipelago (CAA) contains ~150 000 km2 of glacier ice, making this region the most glaciated in the world outside of Greenland and Antarctica (Pfeffer and others, Reference Pfeffer2014). Based on satellite gravimetry measurements, this region has become the single largest contributor to eustatic sea-level rise outside of the major ice sheets since 2003 (Harig and Simons, Reference Harig and Simons2016), during a period of rapid warming of glacier surface temperatures (Mortimer and others, Reference Mortimer, Sharp and Wouters2016). The ice in this area can be separated into two groups, the southern area that spans Baffin (~36 839 km2) and Bylot (~4859 km2) islands, and the northern area (107 488 km2) that spans the Queen Elizabeth Islands, of which 27 556 km2 (all ~1960 areas) is located on Northern Ellesmere Island (Fig. 1; Andrews, Reference Andrews, Williams and Ferrigno2002; Sharp and others, Reference Sharp, Kargel, Bishop, Kaab, Raup and Leonard2014).
Queen Elizabeth Islands, Canada. The study region is shown by the dark grey area on Northern Ellesmere Island. Ice outlines (in light grey) from 1999 for Axel Heiberg, Devon, and Southern Ellesmere Island were acquired from GLIMS (http://www.glims.org/maps/glims).
The first detailed measurements of glacier thickness and volume change across Northern Ellesmere Island were conducted by Abdalati and others (Reference Abdalati2004), who used repeat airborne altimetry measurements over the period 1995–2000 to calculate changes of −3.52 km3 a−1 (the highest rate of ice volume loss compared with all other ice caps in the CAA). Sharp and others (Reference Sharp, Kargel, Bishop, Kaab, Raup and Leonard2014) performed measurements of the area change of glaciers (excluding ice shelves) on Northern Ellesmere Island up to the year 2000, by using ice extents from 1956 to 1961 derived from aerial photography and 2000 extents delineated using an unsupervised classification of Landsat 7 ETM+ and ASTER imagery. Their study revealed that Northern Ellesmere experienced a reduction in glaciated area of 927 km2 (3.4% of initial area) over this period, the greatest area loss of all regions measured across the CAA. The largest mean percentage area changes for Northern Ellesmere occurred from glaciers <1 km2 in area, which lost an average of 29.2% of their initial ice area. Since 2000, a few studies have been conducted on Northern Ellesmere Island to assess changes in ice shelf area (e.g., Copland and others, Reference Copland, Mueller and Weir2007; Mueller and others, Reference Mueller, Copland and Jeffries2017a, Reference Mueller, Copland, Jeffries, Copland and Muellerb) and the changes of individual ice caps (Braun and others, Reference Braun, Hardy and Bradley2004; Serreze and others, Reference Serreze, Raup, Braun, Hardy and Bradley2017), but no detailed regional assessment of glacier changes has been conducted.
Here we present a comprehensive inventory of the number and extent of all glaciers on Northern Ellesmere Island, using satellite data acquired between 1999 and 2016. This is the first study to present recent area change measurements for this region and to analyze the spatial variability in glacier change in relation to terrain controls. Our data will be made available in the Global Land Ice Measurements from Space (GLIMS) database (http://www.glims.org).
1.1. Study area
Ellesmere Island is the largest island in the Queen Elizabeth Islands, with an area of 196 236 km2 and a length of 830 km (Fig. 1). The island is the most mountainous in the CAA and can be separated into different ice regions from north to south that includes Northern Ellesmere Icefield, Agassiz Ice Cap, Prince of Wales Icefield, Manson Icefield and Sydkap Icefield (Fig. 1). The study area of Northern Ellesmere is separated from the rest of Ellesmere Island by the Hazen Plateau and Greely Fiord and has a maximum elevation of 2616 m at Barbeau Peak (Fig. 2). Lake Hazen is a large inland lake, with a surface area of 537.5 km2, which stretches in a southwest-northeast direction in the southeast part of Northern Ellesmere (Fig. 2). The Northern Ellesmere Icefield spans the majority of the island, while ice shelves and marine-terminating glaciers flow off the northern coastline. Smaller ice caps, such as Grant and Ad Astra, surround the main ice caps, but the majority are unnamed.
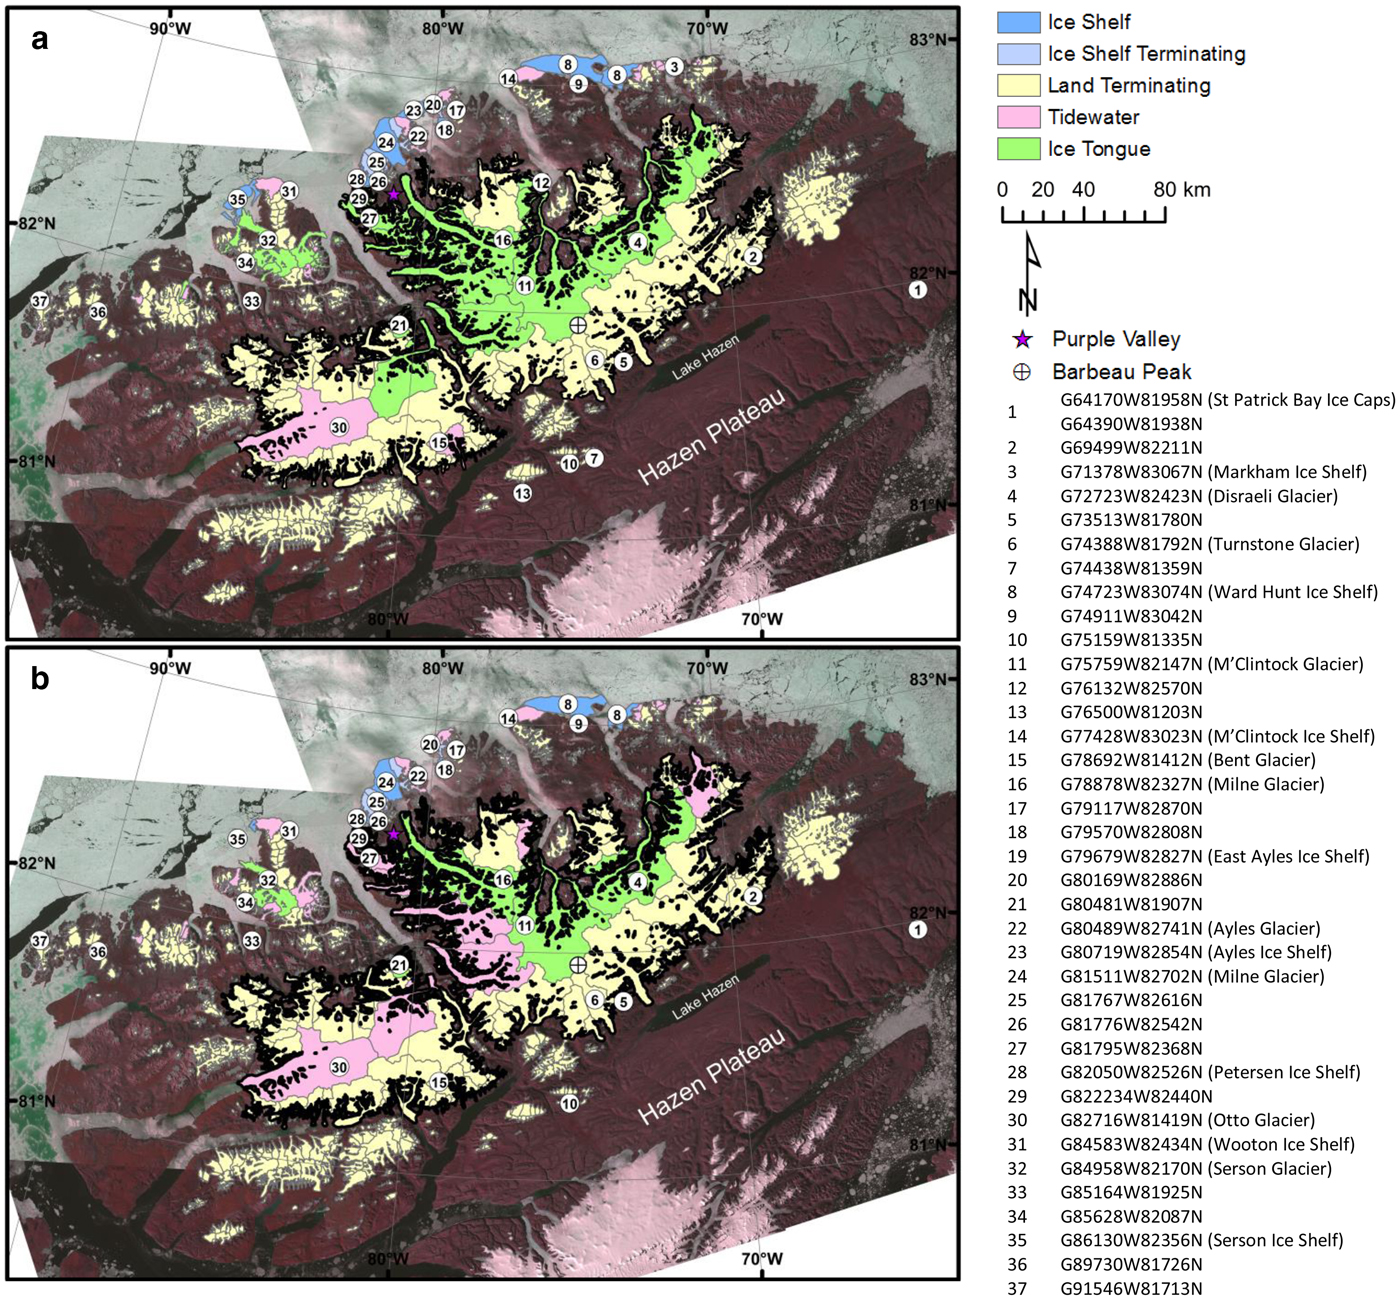
Landsat OLI/TIRS mosaic (Table 1) of Northern Ellesmere Island showing the outlines classified by terminating environment in (a) 1999–2008; (b) 2015/16. Labels show the locations of the basins referred to throughout the study. Note: Northern Ellesmere Icefield is outlined with a thick black line.
The climate regime of Northern Ellesmere varies between the coastal regions, interior lowlands and highlands. The coastal waters contain a mix of first- and multi-year ice. In summer, fall and early winter (during the sea-ice consolidation period), the varying coverage of sea ice and open water leads to high frequencies of fog and low cloud over the channels and along the coastlines (Maxwell, Reference Maxwell1981). The interior lowlands are surrounded by mountains which cause a rain shadow that results in low mean precipitation, while exposed slopes at higher elevations receive >200 mm of precipitation per year (Maxwell, Reference Maxwell1981). At Eureka weather station, ~100 km to the southwest of the Northern Ellesmere Icefield, mean monthly precipitable water ranged from 1.8 mm in late winter to 12 mm in July between 1961 and 2007, with a 10% increase in mean annual precipitable water over this period (Fig. 1; Lesins and others, Reference Lesins, Duck and Drummond2010). The increase in precipitable water has been dominated by increases during the spring, summer and fall, with the greatest increase occurring during summer at a rate of 0.3 mm decade−1 since 1961. Over the 54-year period, the station recorded a mean air temperature of −19.1°C.
2. DATA AND METHODS
Area changes for each glacier were determined from optical satellite imagery within the periods ~1999 (period 1) and ~2015 (period 2) (Table 1). These periods were selected to provide the broadest temporal range with the highest resolution imagery, primarily from Landsat 7 (ETM+) and Landsat 8 (OLI). The north coast of Ellesmere Island was beyond the orbit of Landsat 7 in 1999, so ASTER imagery from 2002 and 2003 was used instead, covering 5.2% of the total glaciated area. Glacier coverage for Ward Hunt Ice Shelf and for glaciers along the far north-east coast of Northern Ellesmere (comprising ~4.5% of the total glaciated area) was not available for 1999–2003, so Formosat-2 imagery from 2008 and ASTER imagery from 2009 was used in its place for period 1. Due to the lack of satellite coverage over the Markham Ice Shelf for period 1 (Fig. 2), the extent (from 2003) was obtained from Mueller and others (Reference Mueller, Copland and Jeffries2017a). In the second period, Landsat 8 imagery from 2015 and 2016 provided complete coverage of the study area.
Satellite scenes used to delineate glacier extents in this study. Landsat and ASTER images were obtained from the US Geological Survey Earth Explorer (https://earthexplorer.usgs.gov/). Formosat-2 image obtained from Planet Action (http://www.planet-action.org/#). Images used in the 2015/16 mosaic (Fig. 2; the master image against which all other imagery was georeferenced) are shown in bold
2.1. Basin boundaries
The ice cover across Northern Ellesmere Island was divided into individual drainage basins using a combination of elevation data and optical satellite imagery. Basins were delineated using a pre-release version of the ArcticDEM, a DEM with 8 m resolution constructed by the Polar Geospatial Center (University of Minnesota) from in-track, high-resolution (~0.5 m) Digital Globe imagery from 2012–15. A polygon shapefile was delineated for each drainage basin by using the Basin tool in ESRI ArcGIS 10.3.1. To create the basins, sinks were filled and an eight-direction (D8) flow model was used, which determines the flow direction of each raster cell based on the steepest path of the eight surrounding cells (Jenson and Domingue, Reference Jenson and Domingue1988). The automated basin outlines were verified visually against the 2015/16 Landsat 8 mosaic using visible features such as flow lines, and adjusted as necessary.
2.2. Glacier outlines
An outline of the ice extent was delineated for each glacier and nunatak from orthorectified ASTER (15 m resolution) and Landsat imagery (30 m resolution enhanced with the 15 m panchromatic band) and georeferenced Formosat-2 imagery (8 m resolution) (Table 1). Images with little to no cloud cover acquired during late summer were preferentially selected due to their minimal snow cover. Pan-sharpened Landsat 8 images acquired in 2015/16 were mosaicked and used as the master image against which all other satellite images were aligned (Fig. 2; bolded scenes in Table 1). Eight ASTER images and one Formosat-2 image were georeferenced to the Landsat mosaic using 13–20 ground control points (GCPs), depending on the amount of flat and stable bedrock available in the scene. Georectification was completed using a zero-order polynomial shift in ESRI ArcGIS 10.3.1, which resulted in root mean square errors (RMSE) ranging from 15.02 to 21.80 m (Table 1). One Formosat-2 image was transformed using a first-order polynomial transformation and had an RMSE of 21.81 m. All other imagery was well-aligned and did not require modification.
During the digitization process, pan-sharpened Landsat scenes were displayed in both true colour and false colour; the false colour composites were represented with bands 4, 3 and 1 (for both Landsat 7 and Landsat 8) in the red, green and blue (RGB) channels, respectively. ASTER scenes were represented with bands 3, 2 and 1 in the RGB channels. To avoid misclassification, only glaciers >0.1 km2 in area (in 1999) were digitized in this study, although glaciers that shrank to areas <0.1 km2 during the second period of study were included for continuity of the dataset.
Once the ice extents and ice divides had been defined, nunataks were subtracted from these outlines so that each polygon represented only the area of ice and not internal rock. The image acquisition dates were used to convert measured area (in km2) of the two time periods into standardized rates of percentage change per decade. Each glacier was assigned a unique ID following the format outlined by GLIMS, which incorporates centroid coordinates of each glacier (Raup and Khalsa, Reference Raup and Khalsa2010). The official name was included for glaciers with a name assigned in the Canadian Geographical Names Data Base of Natural Resources Canada (http://www4.rncan.gc.ca/search-place-names/search).
2.3. Terrain parameters
In total, 11 terrain variables were derived for the glaciers (in ~2015) measured in this study to examine the influence of physiography on area losses. The coordinates of the centroid of each glacier were extracted. The minimum, maximum and mean elevation, mean slope, flow length and mean aspect for each glacier were extracted from the ArcticDEM using the Spatial Analyst extension in ArcGIS 10.3.1. The east-west and north-south scalar aspects were derived from the sine and cosine of the mean of these scalar aspects (Copland, Reference Copland, Lane, Richards and Chandler1998). The main terminus for each glacier was visually assessed and classified into one of five types:
(a) Land-terminating glaciers refers to all outlet glaciers and ice caps that terminate on land, and in this study includes glaciers with proglacial lakes or glaciers that calve into the proglacial lakes of neighbouring glaciers.
(b) Tidewater glaciers are marine-terminating ice masses that are grounded on the sea floor (Dowdeswell and Jeffries, Reference Dowdeswell, Jeffries, Copland and Mueller2017). These glaciers were distinguished by their lack of extension away from the coastline and lack of tidal cracks. This category also includes glaciers flowing into ice shelves but without visual evidence of becoming incorporated into the ice shelf. Also included are coastal ice caps that flow into the sea. Note that if any land is apparent between the terminus and the coastline, the glacier is classified as land-terminating.
(c) Ice tongues are the floating extensions of single valley glaciers over the ocean (Mueller and others, Reference Mueller, Copland and Jeffries2017a, Reference Mueller, Copland, Jeffries, Copland and Muellerb). In this study, ice tongues are classified as floating termini that extend into a bay or fiord and include ice fragments clustered together and frozen in place by sea ice around the terminus.
(d) Ice shelves comprise extensive, permanent floating landfast ice features that are >20 m thick (Dowdeswell and Jeffries, Reference Dowdeswell, Jeffries, Copland and Mueller2017). In this study, ice shelves were identifiable by their characteristic undulating surface topography and their infilling of bays and fiords along the northern coastline.
(e) Ice shelf-terminating refers to glaciers that flow into ice shelves. Although these glaciers contribute directly to the ice shelves, they are separated from the ice shelf as per the GLIMS procedure (Raup and Khalsa, Reference Raup and Khalsa2010).
2.4. Changes in accumulation area ratio (AAR)
To provide an estimate of the changes in AAR of the ice cover of Northern Ellesmere Island, the hypsometry of this region was compared with estimates of the changes in equilibrium line altitude (ELA) over the study period. The ELA across Northern Ellesmere Island at the start of period 1 was determined from digitizing the map of Wolken and others (Reference Wolken, England and Dyke2008), which in turn was recreated from Miller and others (Reference Miller, Bradley and Andrews1975). Wolken and others (Reference Wolken, England and Dyke2008) describe this map as representing the ELA in 1960, but we assume that this ELA is broadly representative of conditions at the start of period 1. This is based on mass-balance measurements on other Queen Elizabeth Islands ice caps which show generally weak trends over this period (Koerner, Reference Koerner2005; Thomson and others, Reference Thomson, Zemp, Copland, Cogley and Ecclestone2017), and the observation that average glacier mass balance was five times more negative between 2005 and 2009 than 1963–2004 (Sharp and others, Reference Sharp, Kargel, Bishop, Kaab, Raup and Leonard2014). Since 1999, we estimate that the ELA on Northern Ellesmere has risen by ~100–300 m, based on measurements at White Glacier (Fig. 1) (mean ELA 1960–1998 = 1022 m; mean ELA 1999–2014 = 1205 m; Thomson and others, Reference Thomson, Zemp, Copland, Cogley and Ecclestone2017) and measurements on northern Agassiz Ice Cap that indicate the 2014/15 ELA was 300 m above the 1977–2015 mean (Burgess, Reference Burgess2017).
2.5. Error analysis
To calculate error associated with the alignment and resolution of the satellite imagery, we used the method defined by Hall and others (Reference Hall, Baa, Schöner, Bindschadler and Chien2003). The uncertainty in the change of the ice extent in the linear dimension (d) between two satellite images was calculated from (after Williams and others, Reference Williams, Hall, Sigurđsson and Chien1997):
 $$d = \sqrt {r_1^2 + \; r_2^2} + {\rm RMSE},$$
where r 1 is the cell size of the first image, r 2 is the cell size of the second image and RMSE is the error calculated during the georectification process (Table 1). The finest resolution (15 m) and the highest RMSE value (21.81 m) were used in this calculation. The linear uncertainty was converted to area uncertainty using (after Hall and others, Reference Hall, Baa, Schöner, Bindschadler and Chien2003):
 $$a = A\left( {\displaystyle{{2d} \over x}} \right),$$
where A = x 2 and x = linear side dimension (15 m). This calculation produced an error of ±0.0013 km2.
To calculate human error that may occur during the digitization process, the same operator digitized three different glaciers from the dataset for Northern Ellesmere, of differing sizes, environments, and locations, at a consistent scale of 1: 10 000. Each glacier was digitized five times for each time period using imagery from the study. G85164W81925N, G75159W81335N and G69499W82211N were selected based on their range in size, distribution and terminal environment: G85164W81925N (5.99 km2 in 1999) is a marine-terminating glacier in the northeast, G75159W81335N (1.00 km2 in 1999) is a small ice cap in the southern region, and G69499W82211N (254.52 km2 in 1999) is a large land-terminating glacier in the western region (Fig. 2). The mean error for both time periods varied between 0.004 km2 (0.07%) for G85164W81925N, 0.004 km2 (0.69%) for G75159W81335N and 0.136 km2 (0.05%) for G69499W82211N. The largest of these errors (0.14 km2) was summed with the satellite error (0.0013 km2) to provide a total error. Based on these error calculations, glacier area changes were considered significant if they were >0.14 km2.
2.6. Climate data
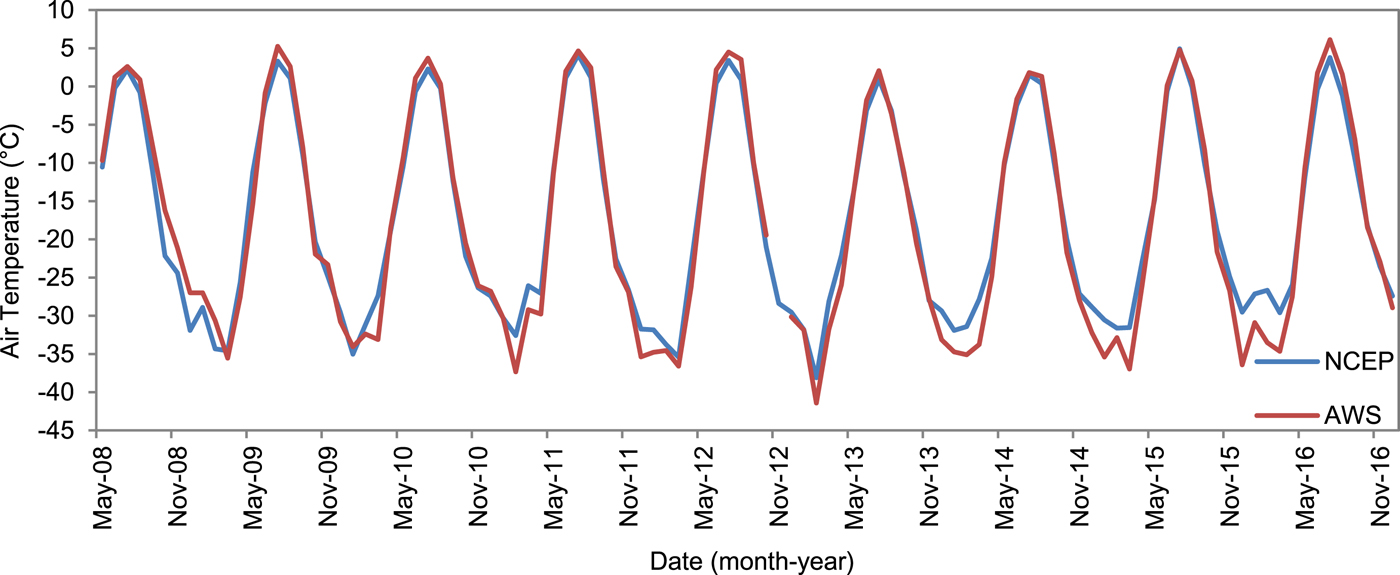
To examine climate conditions since 1950, NCEP/NCAR Reanalysis monthly mean data was downloaded from the NOAA Earth System Research Laboratory website (http://www.esrl.noaa.gov/psd/data/reanalysis/reanalysis.shtml). These data are drawn from an assimilated gridded (2.5° × 2.5° grid) dataset, based on observations from the land surface, ship, rawinsonde, piloted balloon, aircraft, satellite and other data (Kalnay and others, Reference Kalnay1996). It should be noted that NCEP/NCAR data prior to 1979 are of a lower quality to the lack of assimilation data, although this is considered to be of minor significance as this study is primarily concerned with changes in conditions since ~1999. For this study, mean monthly surface air temperatures from 1948 to 2016 were analyzed for grid cells centered on Northern Ellesmere Island from 80.587–83.190°N to 60.678–92.296°W. This climate dataset was verified by comparing observations collected by an automatic weather station in Purple Valley (Fig. 2) over the period 2008–16 to the NCEP/NCAR data gridcell centered on this region (82.500°N, −80.999°W). The close resemblance between these datasets (Fig. 3) suggests that the reanalysis data are suitable for assessing trends in air temperature across Northern Ellesmere.
Comparison of NCEP/NCAR Reanalysis and AWS mean monthly surface air temperature datasets from May 2008 to November 2016 for Purple Valley, Northern Ellesmere Island. November 2012 AWS data omitted due to sensor error.
3. RESULTS
3.1. Regional glacier inventory
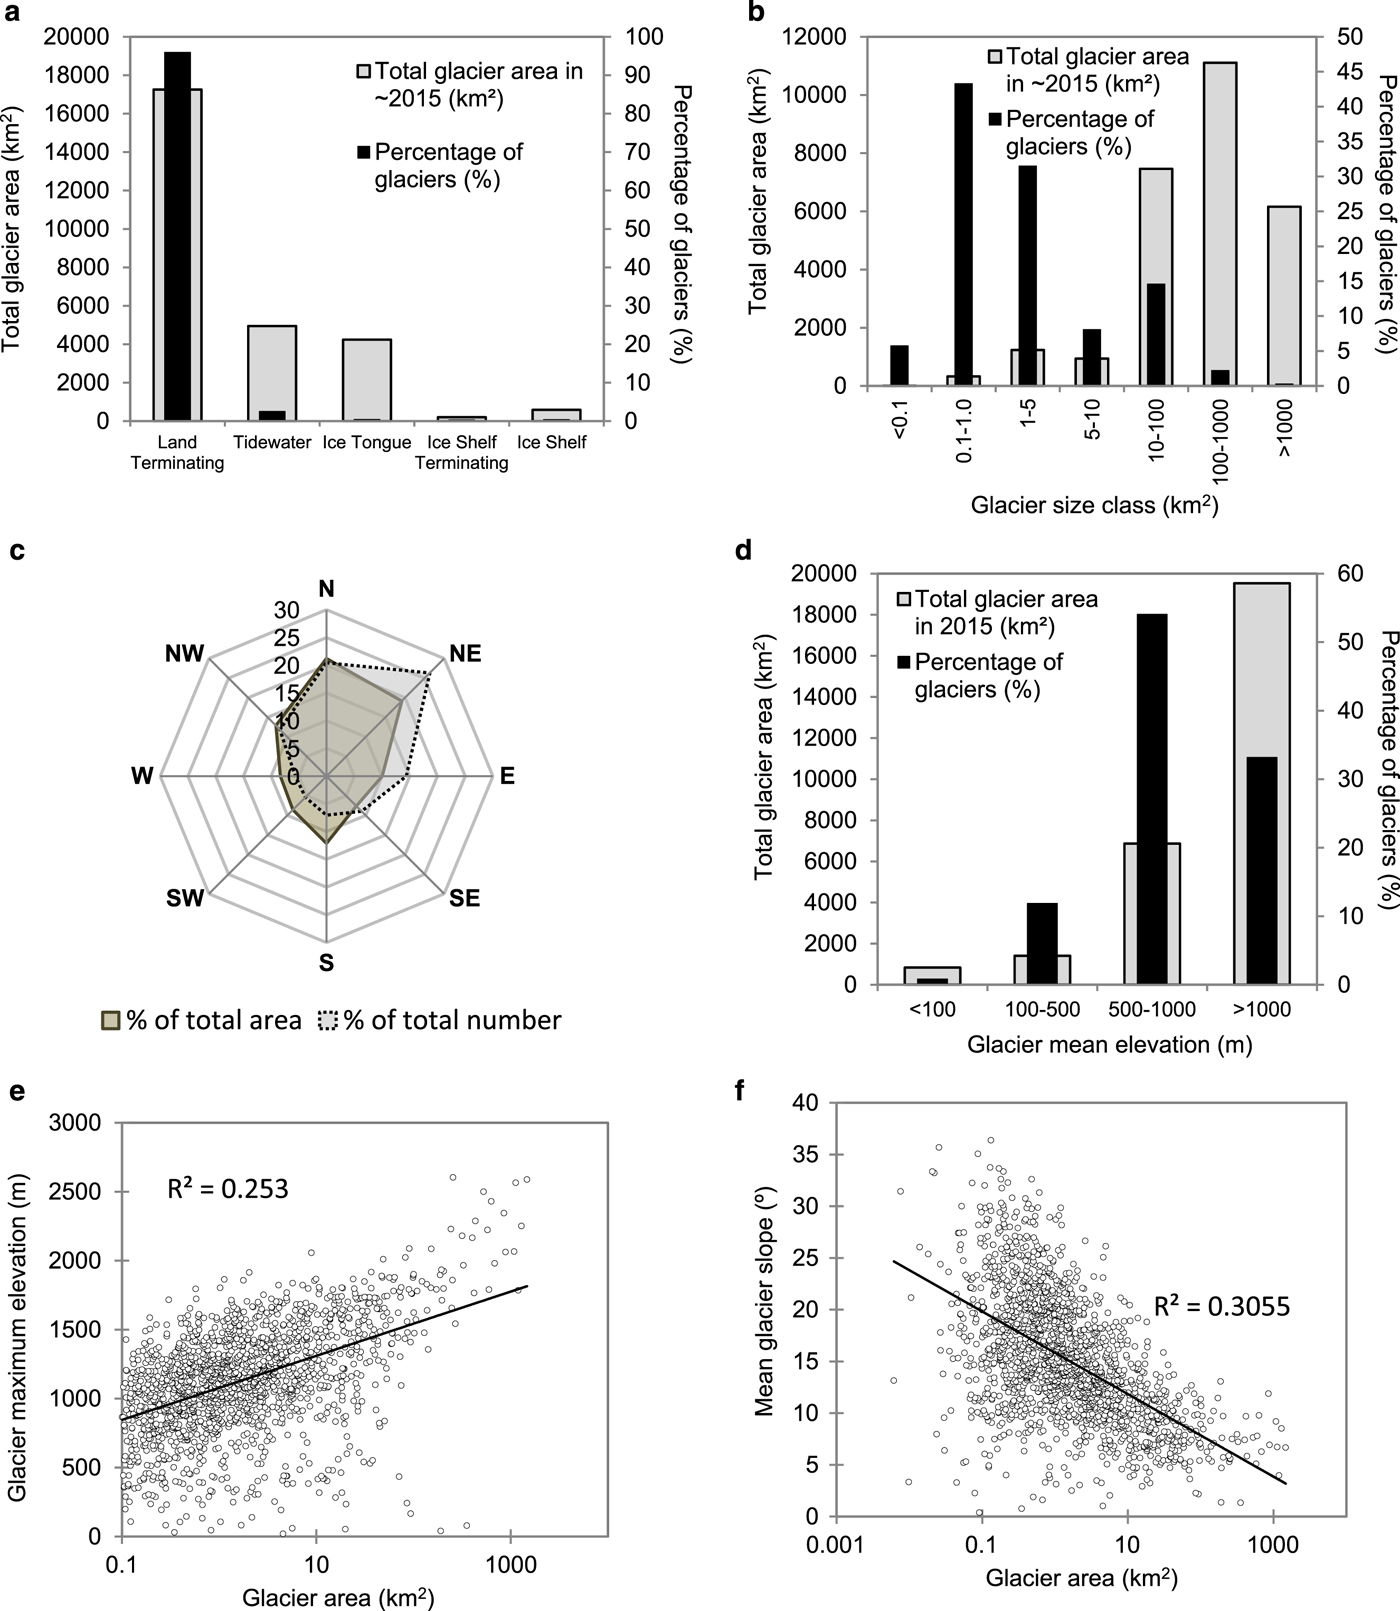
For ~2015 a total of 1768 glaciers were identified, comprising 1702 land-terminating glaciers, 45 tidewater glaciers, eight marine-terminating glaciers with ice tongues, six ice shelf terminating glaciers and seven ice shelves or remnant ice shelves (Table 2; Fig. 2b and Fig. 4a). Land-terminating glaciers made up the highest proportion of the total ice area (63.4%), followed by tidewater glaciers (18.2%) (Table 2; Fig. 4a). Glaciers between 0.1 and 1 km2 in size made up 43.3% of the total number of glaciers, but only 1.2% of their total area (Fig. 4b). In contrast, the majority (40.8%) of glaciers were between 100 and 1000 km2 in size (Fig. 4b). The largest single ice mass is M'Clintock Glacier (G75759W82147N), a marine-terminating glacier with an ice tongue, measuring 1468.4 km2 in area and with a centreline flow length of ~44 km (Fig. 2). The majority of individual glaciers had a north-east facing aspect, while the majority of the total ice area had a north-facing aspect (Fig. 4c).
Glacier inventory characteristics for ~2015: Total glacier area (km2) and number of glaciers in each: (a) terminus environment; (b) size class; (c) aspect class; (d) elevation class, and relationship between glacier area and (e) maximum elevation; (f) mean glacier slope. Note logarithmic scales on (e) and (f).
Overview of glacier inventory, with details as a total area and percentage of each glacier type
Mean glacier elevation ranged from 19 m a.s.l. (M'Clintock Ice Shelf; G77428W83023N) to 1519 m a.s.l. (G73513W81780N). Turnstone Glacier (G74388W81792N) had the highest maximum elevation (2603 m a.s.l.) as it flowed from Barbeau Peak. Overall, 54.1% of glaciers had a mean elevation between 500 and 1000 m a.s.l., with <1% having a mean elevation <100 m a.s.l. (Fig. 4d). There was a fairly strong relationship (r 2 = 0.253, P = 3.23 × 10−44) between maximum elevation and glacier area (Fig. 4e), with the highest elevations concentrated from east to west along the main spine of the icefields. Glaciers with ice tongues had the highest mean difference in the highest and lowest points of elevation: 1595.0 m, compared with ice shelves with the lowest mean relief of 33.4 m. Glacier slope varied inversely with glacier area (r 2 = 0.3055, P = 5.53 × 10⁻¹⁹), with smaller glaciers tending to be steeper (Fig. 4f). By glacier type, ice shelves tended to have the lowest gradient (mean slope of 2.0°) which is reflected in their large flat structure. The steepest glaciers, with a mean slope of >30°, were land-terminating with areas <1 km2.
The central part of the Northern Ellesmere Icefield comprises the largest contiguous ice mass in the study region, with an area of 19 445 km2 in 2015 (outlined in black on Fig. 2) and length of up to ~300 km and width of ~160 km, located between 81°N and 83°N. It had a mean elevation of 1203 m a.s.l. This icefield contained 360 glaciers in 2015, of which 344 were land-terminating, 12 were tidewater-terminating and four were marine-terminating with ice tongues. Land-terminating glaciers made up the majority of the icefield and had a total area of 11 294 km2. All of the marine-terminating glaciers drained along the northern coast, with the exception of one tidewater glacier (Otto Glacier/G82716W81419N) flowing off the west coast (Fig. 2).
3.2. Change in glacier area, ~1999–2015
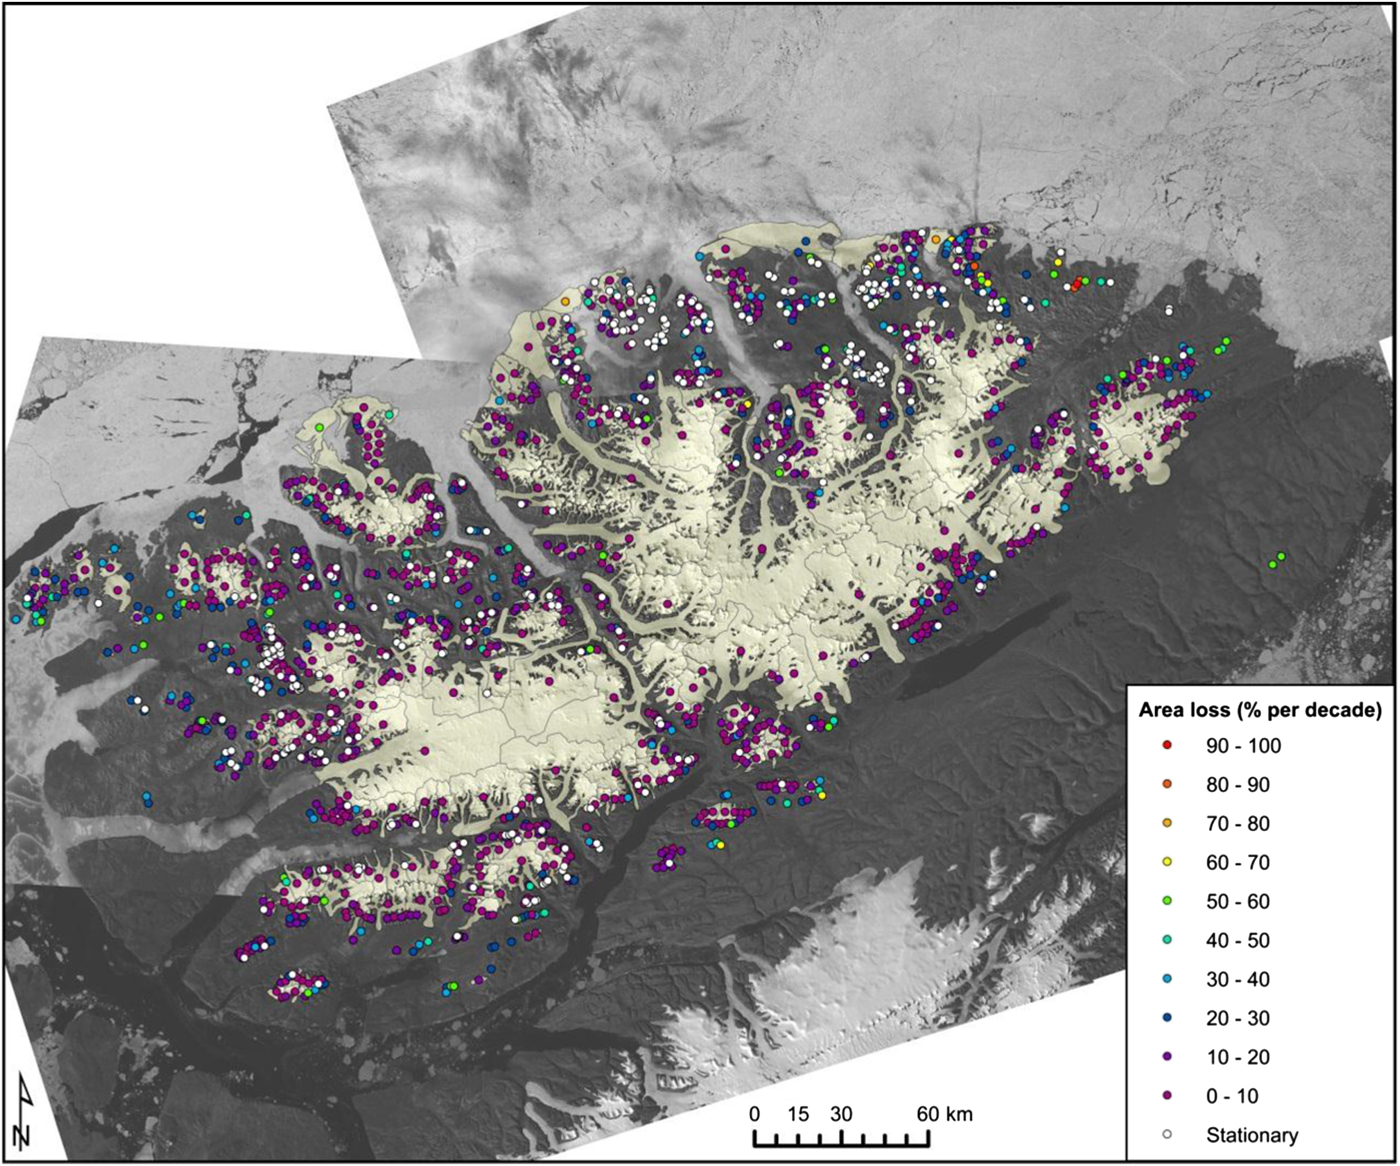
Over the study period, changes in glacier area primarily occurred due to the calving of ice shelves and ice tongues, changes in the position of land-terminating glacier termini, narrowing of glacier trunks and tributary branches, and increases in the area of nunataks. In general, there was a widespread decrease in glacier area for almost all glaciers in the study area (Table 2; Fig. 5). Out of the 1773 glaciers present in the first period, 1353 (76.3%) of them lost >0.14 km2 (the limit of uncertainty) of their area. The remaining 420 glaciers all decreased in area, but not beyond the error limits of this study, and are therefore classified as stationary. No glaciers increased in area over the period ~1999–~2015.
Magnitude of area loss for each glacier basin between 1999 and 2016, overlaid on a Landsat OLI/TIRS mosaic from 2015/16 (Table 1). Basin delineations are for ~1999. Stationary results refer to glaciers with area loss within the limits of uncertainty.
3.2.1. Land-terminating glacier change
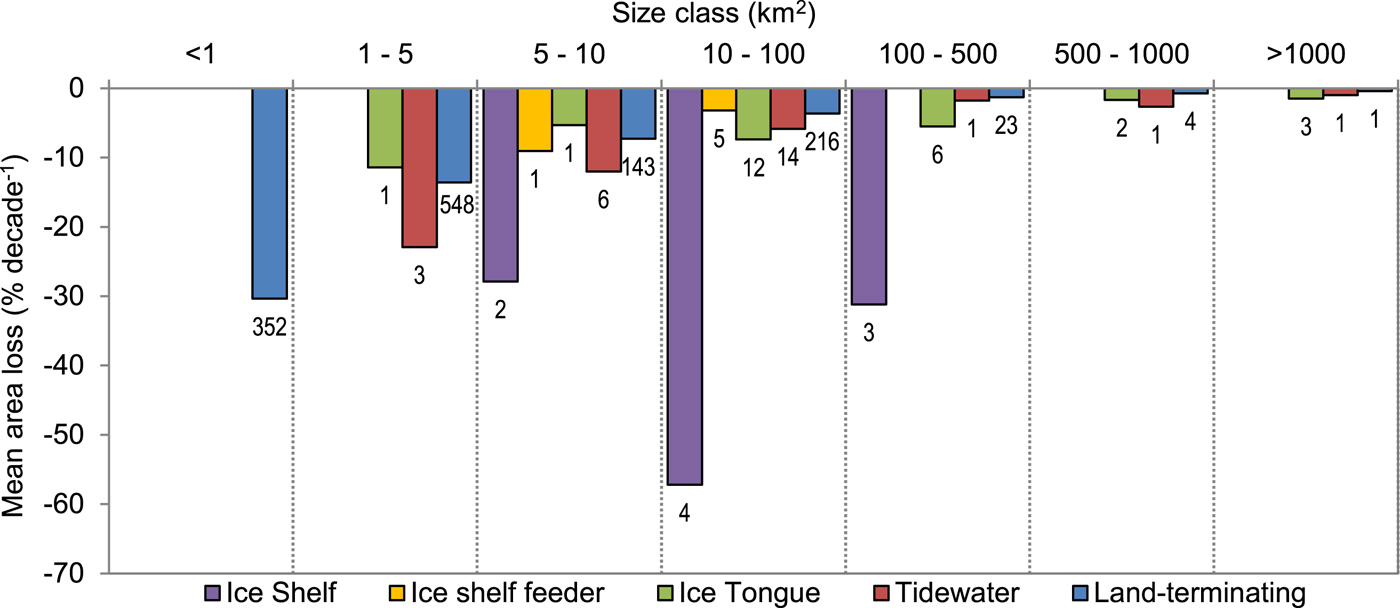
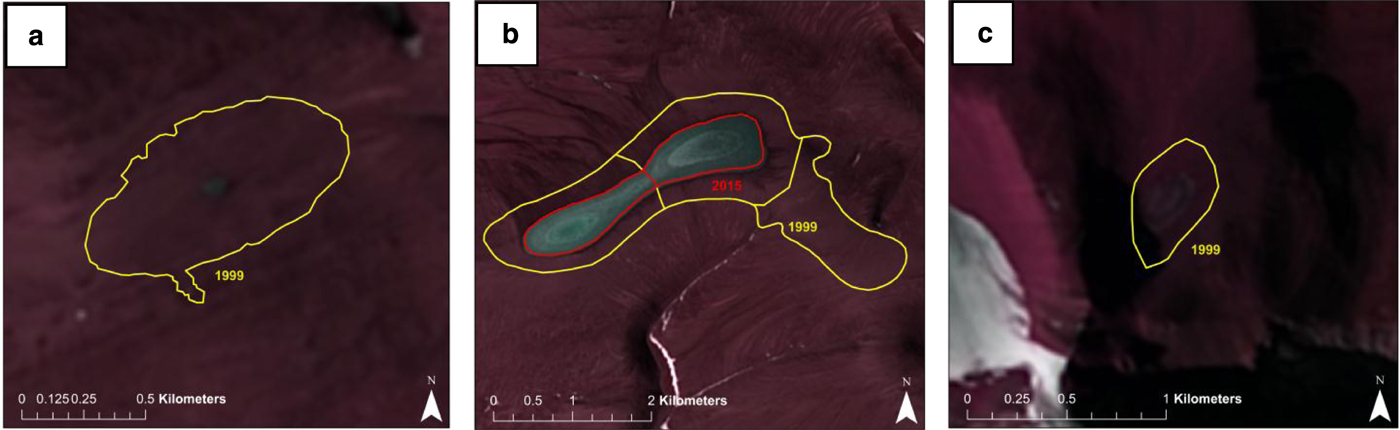
A total of 1703 land-terminating glaciers were outlined across Northern Ellesmere Island for ~1999 (Table 2). Between ~1999 and ~2015, 416 were considered stationary and 1287 shrank beyond the limits of uncertainty. Of these 1287 glaciers, their total area loss was 844.7 km2 (4.8% of their initial area), but 150 glaciers (11.7%) lost >50% of their initial area. Separated by size class, the highest mean losses occurred from glaciers that measured <1 km2 in the first time period, at a mean rate of 30.4% decade−1 (Fig. 6). With each increase in size class, the mean rate of area loss decreased, with the lowest mean area losses (0.4% decade−1) belonging to glaciers >1000 km2. The greatest total area loss of 11.9 km2 (14.3%) occurred from G89730W81726N, a medium-sized (83 km2 in 1999) ice cap on the northwest coast of Northern Ellesmere Island (Fig. 2). Relative to initial area, the greatest losses came from G74438W81359N, G76500W81203N and G76132W82570N, that all disappeared (Fig. 7). These small glaciers were all <1.5 km2 in initial area and distributed north and south of the Northern Ellesmere Icefield (Fig. 2).
Mean rate of glacier loss (% decade−1) for glaciers that lost mass between ~1999 and ~2015 for each glacier type (as classified initially), separated into size classes.
Outlines from 1999 of small ice caps that lost 100% of their area: (a) G74438W81359N overlaid on Landsat 8 image from 12 July 2015 (#7 on Fig. 2a); (b) G76500W81203N (eastern-most basin) overlaid on Landsat 8 image from 14 July 2015 (#13 on Fig. 2a); and (c) G76132W82570N overlaid on Landsat 8 image from 12 July 2015 (#12 on Fig. 2a).
3.2.2. Tidewater glacier change
A total of 28 glaciers were classified as tidewater in ~1999, with a total area of 1894.8 km2 (Table 2). By ~2015, 24 tidewater glaciers had shrunk and lost a total area of 61.9 km2, 3.3% of the initial ice area, at a mean rate of 8.7% decade−1. Four glaciers did not lose area beyond the limit of uncertainty and were therefore classified as stationary. According to size class, the smallest tidewater glaciers (three glaciers measuring 1–5 km2) had the greatest mean loss of 22.9% decade−1 (Fig. 6). Similar to land-terminating glaciers, as the size class increased the mean rate of ice loss decreased with the exception of tidewater glaciers between 500 and 1000 km2 that had a higher mean loss (2.7% decade−1) than glaciers 100–500 km2 (1.8% decade−1). The greatest total area loss occurred from Otto Glacier (G82716W81419N), the largest tidewater glacier on Northern Ellesmere, which lost 19.5 km2, 1.6% of its initial ice area. However, this glacier is a known surge-type glacier (Hattersley-Smith, Reference Hattersley-Smith1969; Copland and others, Reference Copland, Sharp and Dowdeswell2003), which may explain some of these losses. The highest relative rate of area loss occurred from G74911W83042N and G91546W81713N which both lost ~27% decade−1. Two glaciers (Bent Glacier/G78692W81412N, and G85628W82087N) retreated to the point of becoming land-terminating.
3.2.3. Ice tongue change
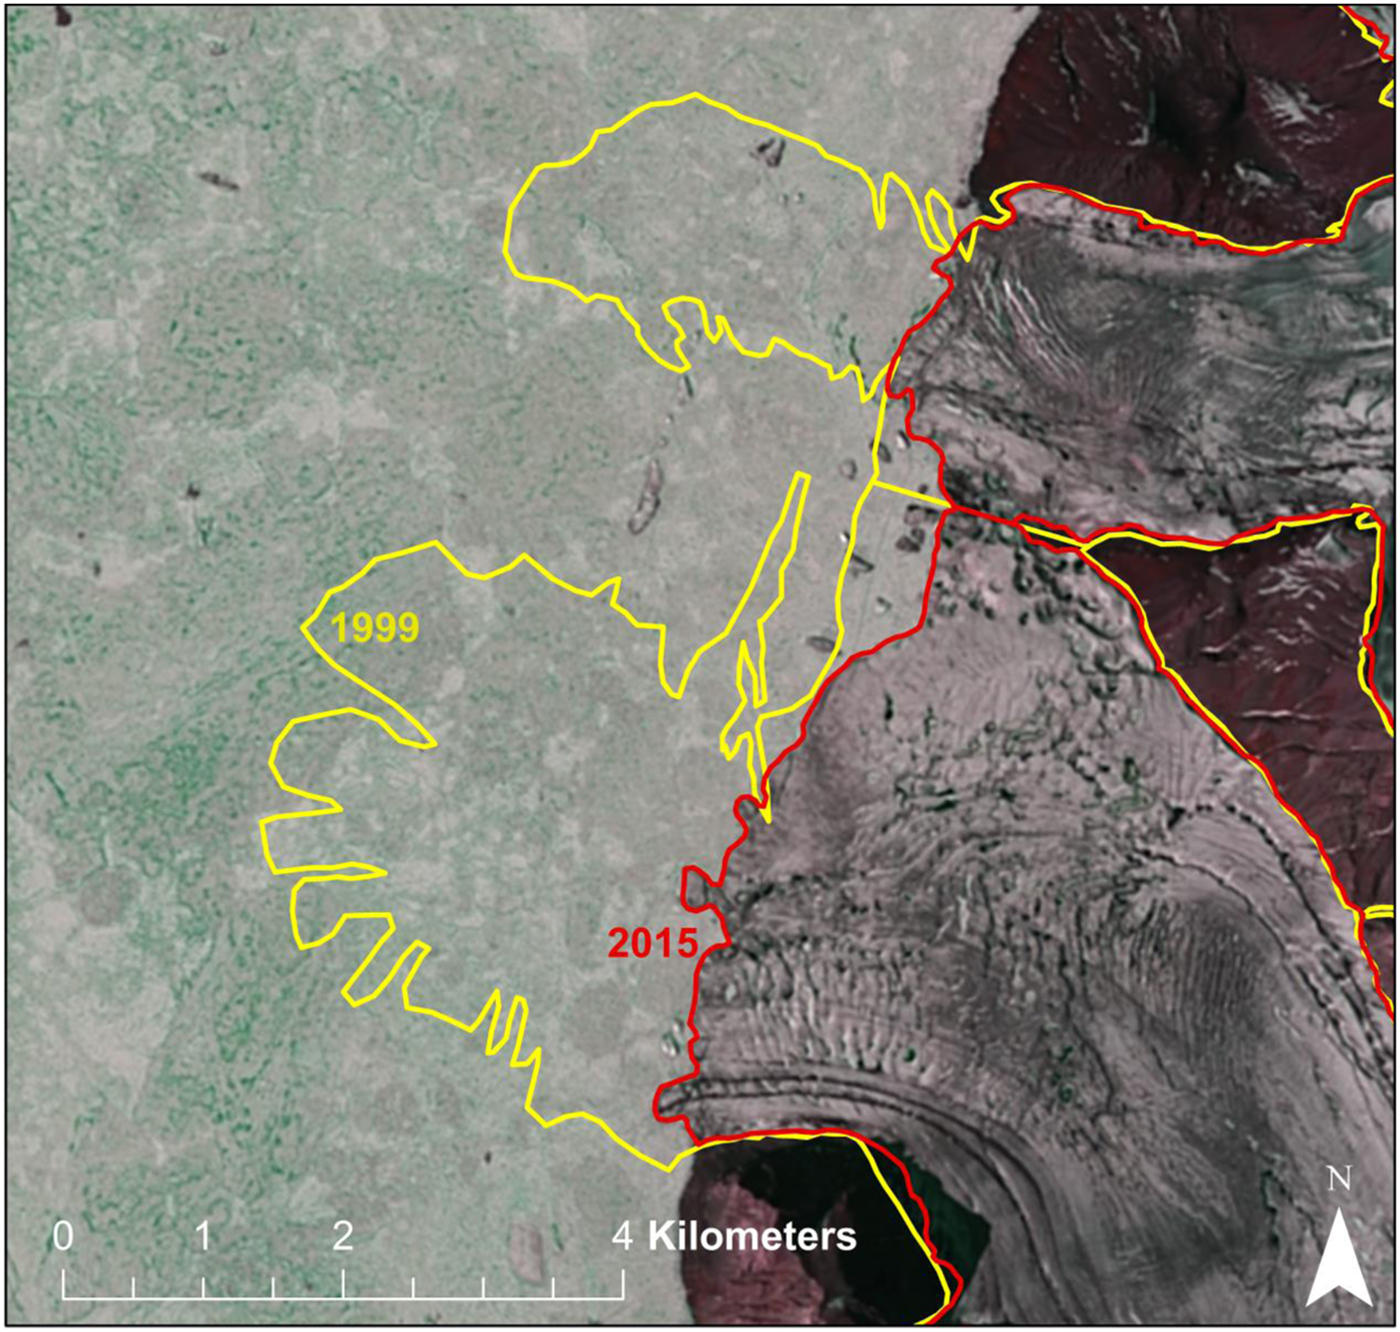
In the first period, 27 marine-terminating glaciers with ice tongues were identified along the northern coast of Ellesmere Island, covering an area of 7843.7 km2 (Table 2). All 23 glaciers shrank by the year ~2015, with a total loss of 313.98 km2, or 3.6% of their initial area at a mean rate of 6.1% decade−1. Classed by size, glaciers with ice tongues between 1 and 5 km2 had the highest mean area loss of 11.4% decade−1 (Fig. 6). Of the 23 glaciers with ice tongues measured, only eight remained by the second period: G79570W82808N, Ayles (G80489W82741N), Serson (G84958W82170N), G79117W82870N, G80481W81907N, Disraeli (G72723W82423N), Milne (G78878W82327N) and M'Clintock (G75759W82147N) glaciers. The remaining 19 retreated toward their grounding lines, causing the glaciers to lose their ice tongues and become classified as tidewater glaciers instead (Fig. 8). The greatest total area loss occurred from Disraeli Glacier, with a loss of 35.6 km2, equivalent to 2.7% of its initial area. The greatest rate of area loss, relative to its area, occurred from G80169W82886N at 15.5% decade−1.
3.2.4. Ice shelf change
Between 1999 and 2009, nine ice shelves and/or ice shelf remnants were identified along the northern coastline of Northern Ellesmere Island with a total area of 1028.7 km2 (Table 2). From west to east, these comprise the Serson (G86130W82356N), Wooton (G84583W82434N), Petersen (G82050W82526N), Milne (G81511W82702N), Ayles (G80719W82854N), East Ayles (G79679W82827N), M'Clintock (G77428W83023N), Ward Hunt (G74723W83074N) and Markham (G71378W83067N) ice shelves. By ~2015, the ice shelves lost 436.1 km2 of ice area, 42.4% of their original area. The greatest total area loss occurred from the Serson Ice Shelf (G86130W82356N), which lost 137.58 km2, leaving behind a small ice shelf fragment on the northeast coast of Serson Bay. The Markham (G71378W83067N; 49.1 km2) and Ayles (G80719W82854N; 75.4 km2) ice shelves lost their entire area.
3.2.5. Ice shelf terminating
In ~1999, six glaciers terminating into ice shelves occurred along the northern coast of Ellesmere Island, contributing mass to the Petersen, Milne and East Ayles ice shelves. By ~2015, these glaciers continued to flow into these ice shelves, but had lost a total area of 10.3 km2, at a mean rate of 4.2% decade−1. The greatest total area loss of 3.5 km2 occurred from G81767W82616N, a glacier flowing into the south-west region of the Milne Ice Shelf (G81511W82702N). The greatest loss relative to initial size occurred to G81776W82542N, a glacier flowing into the north-east side of Petersen Ice Shelf, which lost 15.4% at a rate of 9% decade−1.
3.3. Relationship between area changes and terrain
To better understand the potential relationships between area losses and physiography, 11 terrain variables (Section 2.3; Table 3) were acquired from the 1346 glaciers that underwent shrinkage between ~1999 and ~2015 and had coverage in the ArcticDEM. The terminus environment for each glacier was classified as 1 if it terminated off the coast and 0 if it terminated on land. Glaciers that underwent considerable change prior to the acquisition of the 2012–15 satellite imagery used to generate the ArcticDEM, such as Serson Ice Shelf, were excluded from the terrain analysis.
Factor loadings for each significant principal component (eigenvalue >1) identified in the PCA. Bolded values indicate dominant terrain parameter(s) for each principal component
Once the terrain analysis had been completed, principal component analysis (PCA) was used to determine the relationship between terrain variables and remove collinearity between them. The PCA identified four significant components (eigenvalue >1) (Table 3). Component 1 is primarily an altitude factor that describes glaciers with high minimum, maximum and mean elevations, which tend to have steeper slopes and terminate on land. Component 2 is primarily a size factor that describes glaciers with longer flow lengths and larger areas, which also tend to reach to higher maximum and mean elevations. Component 3 is a location factor, dominated by glaciers that are located in areas that are further north and east than average. Component 4 is a north-facing aspect factor.
Over the period of study, components 2 and 3 were significantly (P < 0.0001) correlated with the % decade−1 area changes (Table 3). Component 2 was the most important factor (r = −0.461), which indicates that the biggest % decade−1 changes occurred on relatively short and small glaciers at lower elevations. Component 3 (r = 0.205) suggests that greater area losses occurred in the north-east. When the terrain factors for component 2 are plotted against area changes (Fig. 9), this reaffirms the fact that the terrain factors within component 2 are significantly correlated with area loss (P < 0.0001). The component 3 terrain factors, latitude and longitude, have a significant (P < 0.001) but the weak positive relationship with area changes; r 2 = 0.022 and r 2 = 0.007, respectively.
Relationship between loss (% decade−1) and: (a) mean elevation; (b) maximum elevation; (c) flow length (note log scale on x-axis) and; (d) glacier area (note log scale on x-axis).
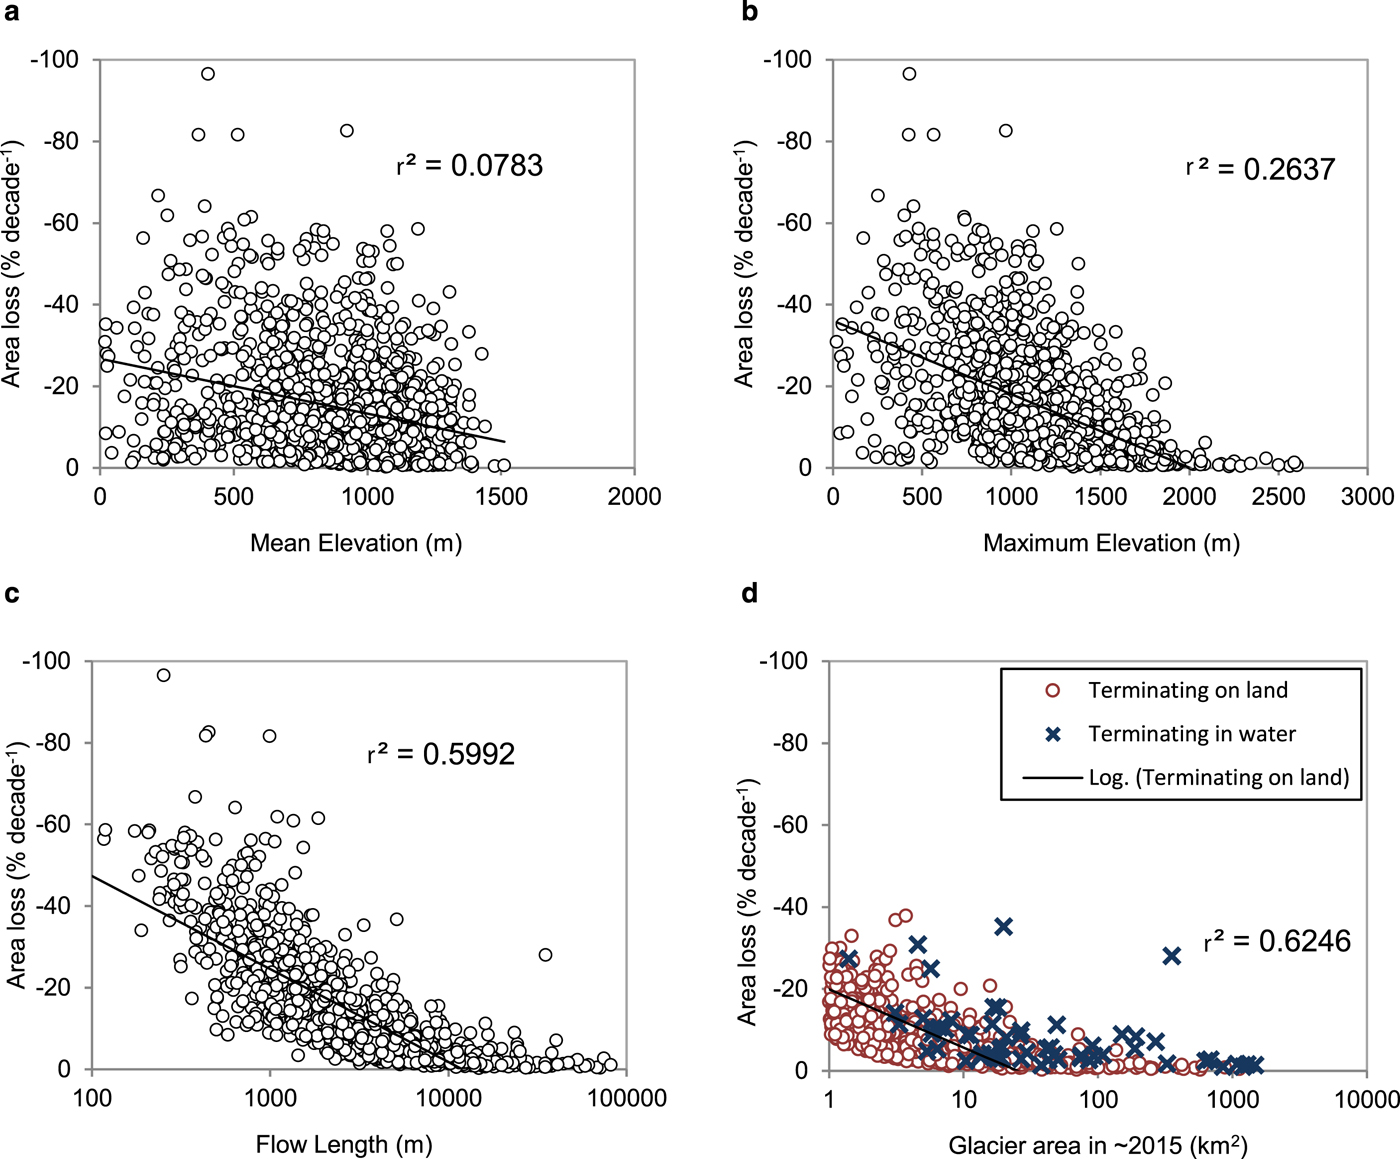
From these analyses, it is apparent that glacier size, elevation and flow length have been the dominant topographic controls on glacier shrinkage over the period ~1999–2015. In this case, the highest shrinkage rates occurred on small, short, low elevation glaciers. This is consistent with our results that show higher area changes from the small isolated remnant ice caps that surround the main icefields (Figs 6, 7). For example, ice masses that lost >50% decade−1 (with the exception of ice shelves) had initial areas <5.4 km2, maximum elevations <1676 m and flow lengths <4745 m.
3.4. AAR changes
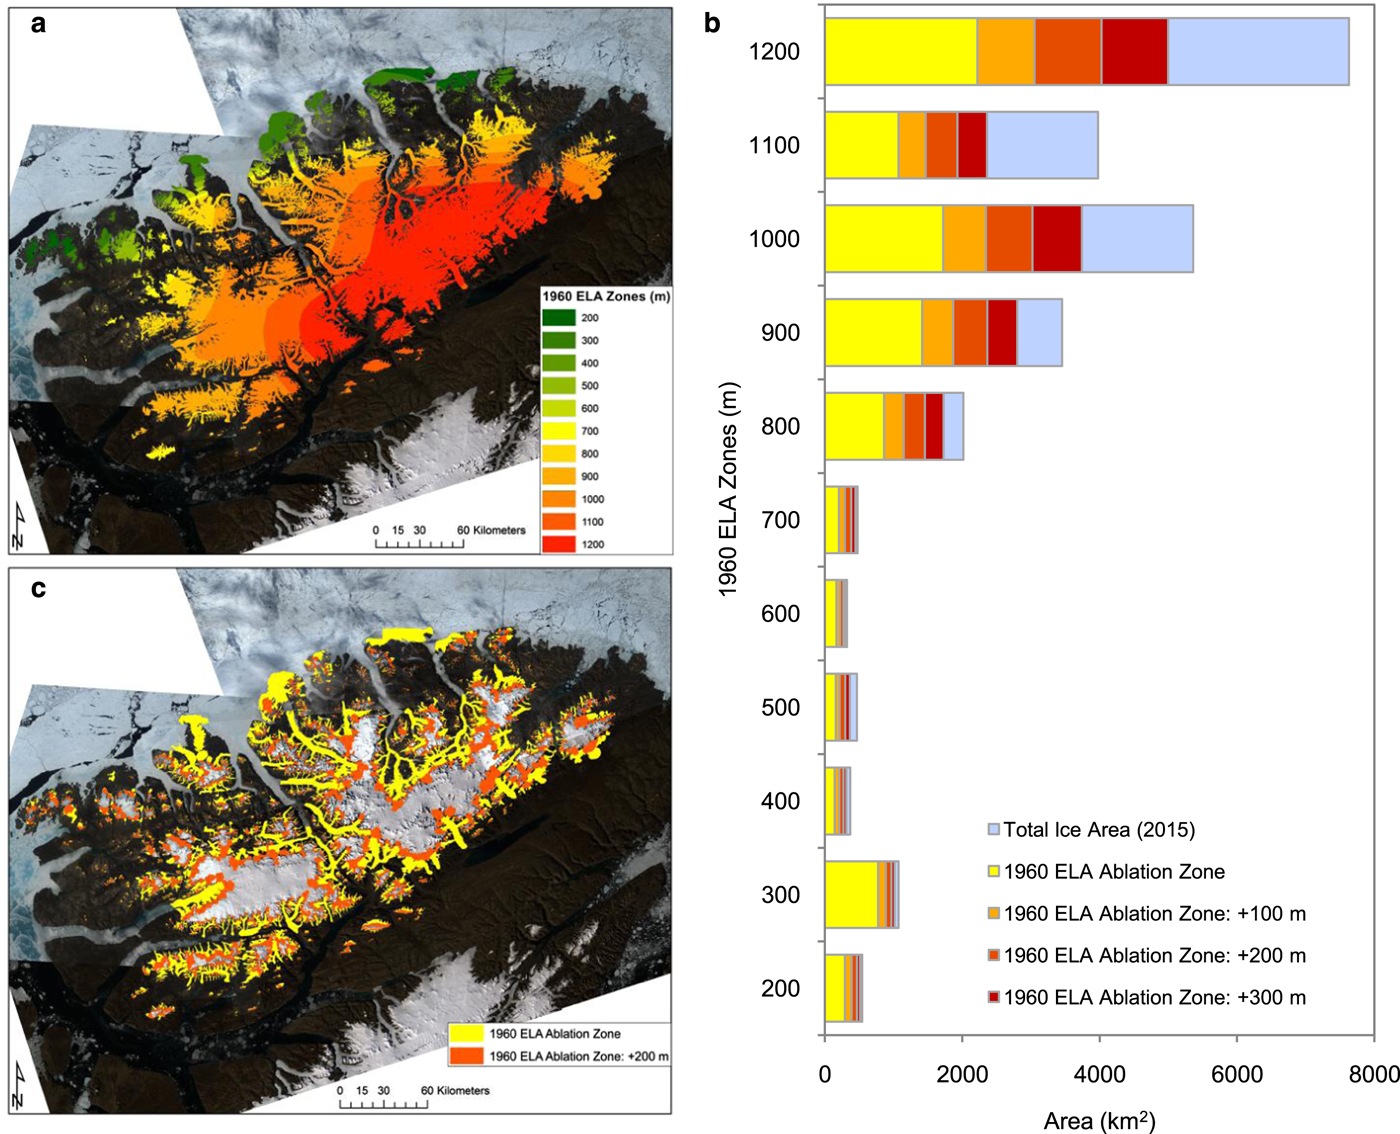
In order to examine the past and future susceptibility of the glacier cover across Northern Ellesmere to melt, the ELA at the start of the study period (Fig. 10a) was used to calculate the regional size of the ablation zone, and from that the regional AAR. In 1999, 35.2% of the ice area was in the ablation zone (AAR = 0.648) (Fig. 10b, c). If this ELA rose by a conservative 100 m, the ablation zone would comprise 47.1% of the total glacier cover (AAR = 0.529). If it rose by 200 or 300 m, as seems plausible based on measurements on nearby ice caps (Burgess, Reference Burgess2017; Thomson and others, Reference Thomson, Zemp, Copland, Cogley and Ecclestone2017), the ablation zone area would then comprise 60.2% (AAR = 0.398) or 72.3% (AAR = 0.277) of the overall glacier cover, respectively.
(a) 1960 ELA trend surface digitized from Wolken and others (Reference Wolken, England and Dyke2008), assumed to represent conditions at the start of the study period, overlaid on a Landsat 8 mosaic from 2015/2016 (Table 1); (b) Total ablation area (as a proportion of total ice area) for 1960 ELA and at 100 m increments (c) Total ablation area based on the 1960 ELA zones and with a 200 m increment, overlaid on a Landsat OLI/TIRS mosaic from 2015/16 (Table 1).
3.5. Climate analysis
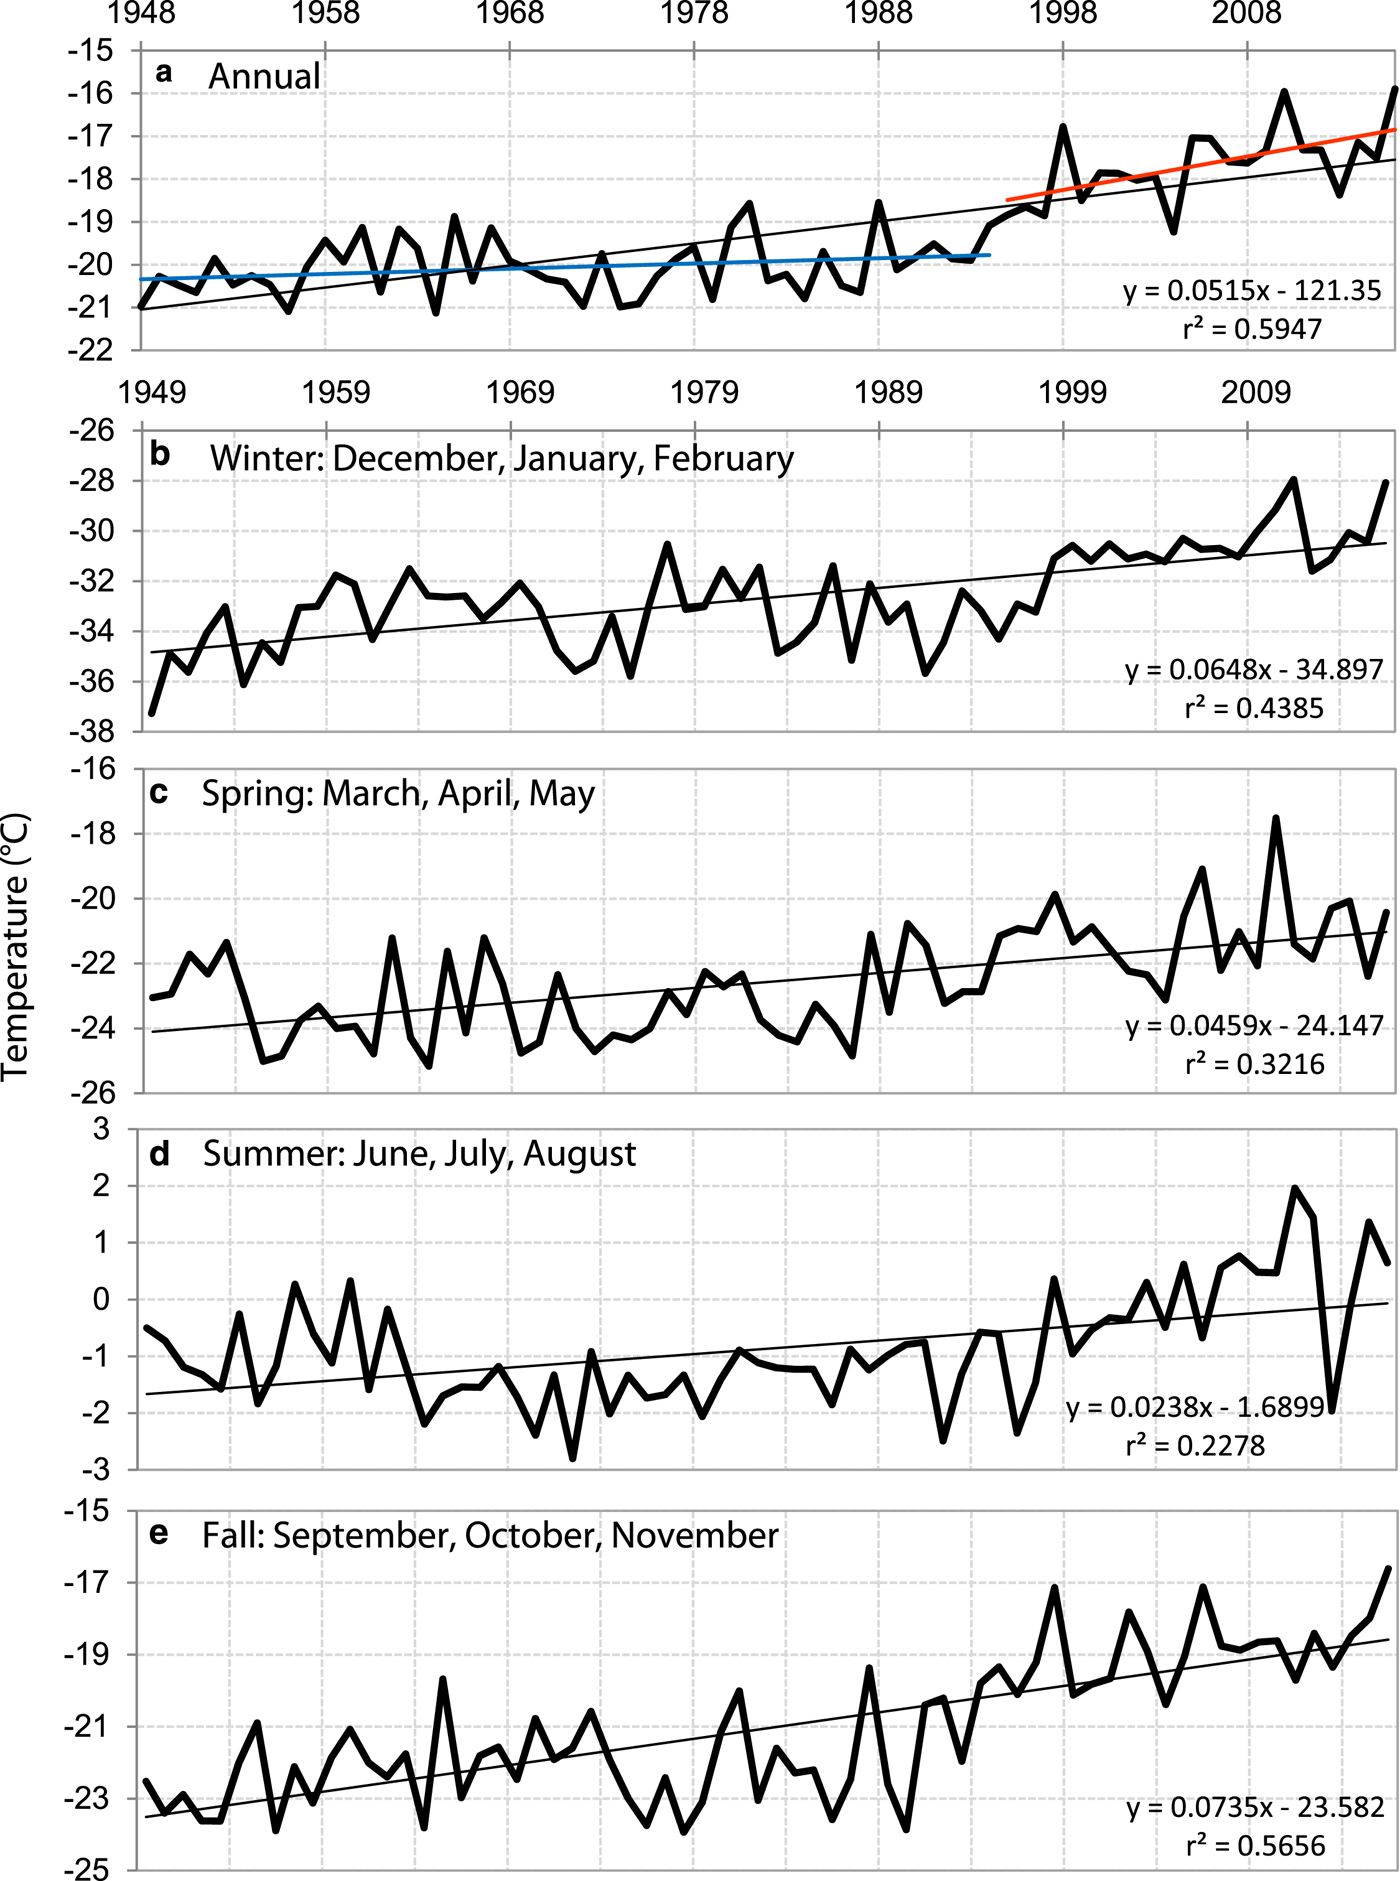
Mean annual surface air temperatures across Northern Ellesmere Island increased by 3.6°C (0.5°C decade−1) between 1948 and 2016 (r 2 = 0.59, P = 9.01 × 10⁻¹⁵; Fig. 11a). A shift seems to have occurred in the mid-1990s when temperature increases accelerated from 0.12°C decade−1 from 1948 to 1994 to 0.78°C decade−1 from 1995 to 2016. Since 1948, fall (September, October, November) has shown the greatest overall increase in mean monthly surface temperature by 0.74°C decade−1 (P = 1.45 × 10⁻¹³), followed by winter (December, January, February) at 0.65°C decade−1 (P = 7.75 × 10⁻¹⁰) and spring (March, April, May) at 0.46°C decade−1 (Fig. 11). Summer (June, July, August) had the weakest rate of warming at 0.24°C decade−1 (P = 3.86 × 10−05), although there has been a regime shift from mean negative to mean positive summer surface air temperatures since the year 2000. Of the 20 warmest mean annual surface air temperatures since 1946, 16 have occurred since 2000. Every summer since 2000 has exceeded the climatological summer mean temperature (−0.7°C) by 0.6–2.7°C. Compared with the climatological mean from 1981 to 2010, mean monthly temperature anomalies have been consistently above the 30-year average since 2000.
Time series of (a) mean annual surface air temperatures (1948–2016). The linear trend from 1948–94 is represented in blue, while the linear trend from 1995 to 2016 is shown in red; (b–e) seasonal surface air temperatures (1949–2016). Data derived from NCEP/NCAR Reanalysis, averaged across the region 80.587–83.190°N, 60.678–92.296°W.
4. DISCUSSION
From the above results, it is clear that the ice cover of Northern Ellesmere Island has been undergoing widespread loss since 1999, with two trends standing out among the observations: (1) The dominance of the shrinkage of relatively small, low elevation glaciers in terms of relative area loss; (2) The substantial loss of floating ice from ice shelves and ice tongues along the northern coast. In the following analysis, we begin by comparing our inventory with others of the study region. We then examine the relationships between large area changes and small land-terminating glaciers, together with changes in the ELA and AAR. To gain a better understanding the rapid loss of floating ice termini, we then examine the influence of oceanographic factors.
4.1. Comparison against previous glacier inventories
One previous complete glacier inventory for Northern Ellesmere Island includes the outlines in the GLIMS database. These outlines were provided to GLIMS by the Randolph Glacier Inventory (RGI 6.0), a global inventory of glacier outlines (https://www.glims.org/RGI/). According to the inventory metadata these outlines provide coverage for 1999 and were completed by several analysts using a semi-automated glacier classification. Our 1999 inventory differs from the GLIMS inventory in several ways, including total area values and basin delineations. According to the GLIMS database, Northern Ellesmere had an area of 27 377 km2, some 1569 km2 less than the area calculated in our study. The main reason for this difference is because the GLIMS dataset does not include all the floating termini extending from the northern coastline: ice shelves and ice tongues. For example, the area covered by ice shelves in our inventory amounts to >1050 km2. In addition, our inventory incorporates several more small ice caps (along the northern coastline) and better outlines nunataks across the region. Our basin delineations also differ from those of the GLIMS database, because our delineations were generated with the recently released, high-resolution ArcticDEM and verified manually.
A comprehensive inventory (from 1959 to 2015) of the floating portion of ice shelves and ice tongues along the northern coast of Ellesmere Island was produced by Mueller and others (Reference Mueller, Copland and Jeffries2017a, Reference Mueller, Copland, Jeffries, Copland and Muellerb). These outlines were digitized manually using anecdotal/survey data (1906), aerial photographs/maps (1959), optical satellite imagery (1963–1992) and SAR satellite imagery (2003–2015). The outlines include only floating ice that ends at the grounding line (i.e., excluding any land ice). In contrast, our ice tongue measurements include the entire drainage basin for each glacier, making a direct comparison with our dataset difficult. However, both datasets for the ice shelves are comparable because they both only include floating ice. For 2015, the ice shelf inventory by Mueller and others (Reference Mueller, Copland and Jeffries2017a, Reference Mueller, Copland, Jeffries, Copland and Muellerb) calculated a total area of 532.2 km2, whereas our inventory calculated a total area of 592.6 km2. The greatest difference between the two datasets is in the outlines of Ward Hunt Ice Shelf, where the discrepancy between the two datasets was 53.4 km2. Unlike the inventory by Mueller and others (Reference Mueller, Copland and Jeffries2017a, Reference Mueller, Copland, Jeffries, Copland and Muellerb), our outlines of Ward Hunt do not exclude any of the small ice rises on the eastern half of the ice shelf. In comparing the remaining ice shelf extents, the difference in area measurements does not exceed 4.3 km2.
An inventory describing the distribution of surge-type glaciers across the Canadian High Arctic was generated by Copland and others (Reference Copland, Sharp and Dowdeswell2003), and included Northern Ellesmere. Copland and others (Reference Copland, Sharp and Dowdeswell2003) used 1959/60 aerial photographs and 1999–2000 Landsat 7 imagery to visually identify potential surging glaciers based on the presence of surface features (e.g. looped medial moraines, intense folding, heavy crevassing and rapid advance) consistent with surge activity. The findings identified eight possible surge-type glaciers across Northern Ellesmere, four likely surge-type glaciers and one observed surge. The observed surge was from Otto Glacier (G82716W81419N), a glacier that was reported to have surged between 1950 and 1959 (by Hattersley-Smith, Reference Hattersley-Smith1969) and continued to surge or surge again by 1999 (Copland and others, Reference Copland, Sharp and Dowdeswell2003). An active surge was also reported for the Milne Glacier from 1966 to 1983, when the glacier advanced by 4.25 km at a rate of 250 m a−1 (Jeffries, Reference Jeffries1984). Based on the recent surge activity of the Otto and Milne Glaciers, it is possible that the losses reported in our study (22.54 and 19.48 km2, respectively) may be linked to the quiescent phase of their surge cycles. If all 13 of the glaciers identified by Copland and others (Reference Copland, Sharp and Dowdeswell2003) as being surge-type retreated solely as a result of surge behaviour, then this would account for 10.9% of the area changes determined across Northern Ellesmere in our study. However, the actual area changes attributable to surging are likely much less than this as only Otto and Chapman glaciers are known to have surged during the period 1999–2015 (Van Wychen and others, Reference Van Wychen2016).
4.2. Loss of small ice caps
Based on the terrain analysis presented in Section 3.3, the largest area changes occurred from small, low elevation glaciers. Separated by size class, the largest area changes occurred from land-terminating glaciers that were <1 km2, with a mean loss of 30.4% decade−1 (Fig. 6). Based on the results from Sharp and others (Reference Sharp, Kargel, Bishop, Kaab, Raup and Leonard2014), this trend was also apparent on Northern Ellesmere between ~1960 and ~2000, when 218 glaciers <1 km2 and 1–5 km2 in size had the highest mean losses of 29.2% (0.73% decade−1) and 25.6% (0.64% decade−1), respectively. For the other size classes described by Sharp and others (Reference Sharp, Kargel, Bishop, Kaab, Raup and Leonard2014), losses ranged from 22.2% for glaciers 5–10 km2 in area, decreasing to 2% for glaciers >10 000 km2. Sharp and others (Reference Sharp, Kargel, Bishop, Kaab, Raup and Leonard2014) also noted this trend on Agassiz Ice Cap, Prince of Wales Icefield, South Ellesmere Island, Axel Heiberg Island and Devon Island. Similarly, Thomson and others (Reference Thomson, Osinski and Ommanney2011) described a trend of significant retreat of small independent ice masses on Axel Heiberg Island, which included ice caps <25 km2, along with the complete disappearance of 90% of ice masses smaller than 0.2 km2 over the period 1958–2000.
Braun and others (Reference Braun, Hardy and Bradley2004) examined the mass balance and area fluctuations of four ice caps on the Hazen Plateau of Northern Ellesmere from 1959 to 2002, including the St. Patrick Bay (also in our study; Fig. 2), Murray and Simmons Ice Caps. In their study, the substantial loss observed from these small ice caps was attributed to low winter snow accumulation, the absence of ice flow and small vertical relief. Braun and others (Reference Braun, Hardy and Bradley2004) described these small ice masses as relicts of the Little Ice Age, no longer sustainable in the current climate as the ELA rises above their summits (>1103 m). Rising ELAs have also been observed in the mass-balance records of White Glacier, Axel Heiberg Island, the nearest long-term mass-balance monitoring site to Northern Ellesmere (Fig. 1). If the ELA at the start of our study period in ~1999 ascended as much as the ~200 m rise in ELA recorded at White Glacier since 1999 (Thomson and others, Reference Thomson, Zemp, Copland, Cogley and Ecclestone2017), then 60.2% of the regional glacier cover across Northern Ellesmere would be in the ablation zone (AAR = 0.398), and 589 (33.3%) glaciers would be completely below the ELA. According to Dyurgerov and others (Reference Dyurgerov, Meier and Bahr2009) most glaciers with balanced regimes will have an AAR of ~0.40 to 0.80, which would suggest that Northern Ellesmere is out of balance with the current climate. If the ELA were to rise 300 m, 940 (53.2%) glaciers would be completely below the ELA and the regional AAR would only be 0.277 (Fig. 10).
Serreze and others (Reference Serreze, Raup, Braun, Hardy and Bradley2017) described the continued loss of the Hazen Plateau ice caps up to 2016, and revealed that the St. Patrick Bay Ice Caps only had 5% of their 1959 area remaining (10.42 km2 in 1959 vs 0.50 km2 in 2016). The authors noted that the ice caps even shrank noticeably between 2014 and 2015, in direct response to the particularly warm summer of 2015. The rapid loss of these ice caps was also attributed to the more pronounced appearance of dirt layers on the ice surface, leading to a decrease in summer surface albedo. In 2016 the Murray and Simmons ice caps still had 39% and 25% of their 1959 ice areas remaining, respectively, which was linked to their higher mean elevations (up to ~290 m higher), thus providing relatively cooler summer conditions.
4.3. Loss of floating glacier termini
Between 1999 and 2015, there was a marked loss in floating glacier termini, including the loss of 18 ice tongues, the complete loss of the Ayles and Markham ice shelves, and substantial decreases in the Serson and Ward Hunt ice shelves. Unlike land-terminating glaciers that typically shrink gradually under atmospheric forcing, marine-terminating glaciers and ice shelves are subject to oceanographic forcing and can lose mass rapidly through calving.
Detailed studies have been conducted on several Arctic ice shelves, including the Petersen and Ayles, that document the events leading up to calving events (Copland and others, Reference Copland, Mortimer, White, Richer McCallum, Mueller, Copland and Mueller2017). In the study by White and others (Reference White, Copland, Mueller and Van Wychen2015), the Petersen Ice Shelf is shown to have undergone a series of calving events between 2005 and 2012, during record high summer temperatures, that resulted in a ~61% loss in ice area. The calving events were initiated by the loss of >50-year-old multi-year landfast sea ice (MLSI) that fringed the ice shelf front in 2005, and by open water events in 2008, 2011 and 2012. White and others (Reference White, Copland, Mueller and Van Wychen2015) also reported that in situ thinning and pre-existing fractures in the ice shelf would have weakened it, thus allowing ice islands to separate from the ice shelf during open water events and drift away. Copland and others (Reference Copland, Mueller and Weir2007) described the conditions leading to the complete collapse of the Ayles Ice Shelf in August 2005 that resulted in it calving within the space of a few hours and producing an 87.1 km2 ice island. Similar to the Petersen, Copland and others (Reference Copland, Mueller and Weir2007, Reference Copland, Mortimer, White, Richer McCallum, Mueller, Copland and Mueller2017) reported that this collapse was initiated by record high summer temperatures in 2005, and by the loss of landfast sea ice that had previously fringed the ice shelf. Copland and others (Reference Copland, Mueller and Weir2007) also reported that high offshore winds occurred during the event.
For marine-terminating glaciers with floating termini, the presence of ice mélange and sea ice provides a seasonally dependent stabilizing mechanism that allows the termini to remain intact and possibly advance (Reeh and others, Reference Reeh, Thomsen, Higgins and Weidick2001; Pimentel and others, Reference Pimentel2017). This has been evident with ice tongues composed of agglomerated ice blocks such as at the front of Jakobshavn Isbrae, Greenland (Amundsen and others, Reference Amundsen2010). During winter, sea ice forms and binds the ice mélange and prevents glacier calving, while the retreat of sea ice in spring causes the mélange to weaken and calving to recommence. Todd and Christoffersen (Reference Todd and Christoffersen2014) examined the calving dynamics of Store Glacier in West Greenland and found that the presence of ice mélange was principally responsible for the observed seasonal advance of the terminus.
These factors may have also played an important role in the loss of the floating ice tongues observed in this study, particularly in Yelverton Inlet and Bay where several ice tongues disappeared over the study period. According to Pope and others (Reference Pope, Copland and Mueller2012), 932.6 km2 of MLSI occupied Yelverton Inlet and Bay, including Kulutingwak Fiord in 1959. By August 2005, ~330 km2 of MLSI broke away from Yelverton Bay and was soon followed by the fragmentation of 690 km2 of older MLSI from Yelverton Inlet. In summer 2008 fragments of MLSI in Yelverton Bay and Kulutingwak Fiord broke apart and drifted away. In summer 2010 the last remaining plug of MLSI in Yelverton Inlet broke away, along with sections of MLSI from Kulutingwak Fiord. The loss of MLSI from this region means that the glaciers flowing into this system would then be exposed to an entirely new environment consisting of open water and young, thinner sea ice. It is likely that the loss of the floating ice tongues was a direct response to the loss of the back pressure previously provided by the thick and semi-permanent MLSI cover.
5. SUMMARY AND CONCLUSION
According to our observations between ~1999 and ~2015, regional ice coverage has decreased by 5.89% (3.68% decade−1) over the 16-year study period. This equates to an area loss of 822 km2 decade−1. From 1948–2016, the highest rate of warming occurred during fall and winter at 0.74 and 0.65°C decade−1, respectively. Although summer showed the lowest rate of temperature increase (0.24°C decade−1), the change in the mean summer temperature over time has resulted in a change from mean negative temperatures to mean positive temperatures since 2007 (with the exception of 2014). There is evidence for a small increase in precipitation over time on Ellesmere Island at Eureka (~10% between 1961 and 2007; Lesins and others, Reference Lesins, Duck and Drummond2010), but this is insufficient to compensate for the rapid recent increase in air temperatures.
Recent area losses from some glaciers, such as the Milne (G78878W82327N) and Otto (G82716W81419N), could be explained by retreat during quiescent periods after potential surge-type behaviour observed over past decades (Hattersley-Smith, Reference Hattersley-Smith1969; Jeffries, Reference Jeffries1984; Copland and others, Reference Copland, Sharp and Dowdeswell2003), but this is likely much <10% of the regional total. Two main trends for the remaining glaciers include the rapid loss of small, low elevation land-terminating glaciers and the loss of floating glacier termini in the form of ice tongues and ice shelves. The loss of small glaciers is a trend that has continued since the 1950s, and has been observed in other regions across the CAA as well (Braun and others, Reference Braun, Hardy and Bradley2004; Thomson and others, Reference Thomson, Osinski and Ommanney2011; Sharp and others, Reference Sharp, Kargel, Bishop, Kaab, Raup and Leonard2014; Serreze and others, Reference Serreze, Raup, Braun, Hardy and Bradley2017). Our analysis also revealed the complete loss of three small ice caps. The increased loss of small ice caps on Northern Ellesmere can be attributed to their increased sensitivity to the accelerated warming in the region, and the decrease in their surface albedo due to the accumulation of surface debris (Serreze and others, Reference Serreze, Raup, Braun, Hardy and Bradley2017). Small glaciers with relatively higher mean elevation are slightly less sensitive due to their cooler summer temperatures at high altitudes (Serreze and others, Reference Serreze, Raup, Braun, Hardy and Bradley2017). This is apparent in our study, where for land-terminating glaciers <10 km2, glaciers with mean elevations <700 m had a mean loss of 25.7% decade−1 whereas glaciers with mean elevations >700 m had a mean loss of 16.0% decade−1.
Over our 16-year study period, there was a substantial change in the amount of floating ice. Ice shelves lost ~42.4% of their initial ice area, including the complete loss of the Ayles Ice Shelf (−83.5 km2) and nearly the complete loss of the Serson Ice Shelf (−184.0 km2). Our inventory also identified the loss of 18 floating ice tongues, causing these marine-terminating glaciers to retreat to their grounding lines. Past studies have linked the loss of ice shelves to warmer summer temperatures, offshore winds and the loss of the protective barrier created by MLSI (Copland and others, Reference Copland, Mueller and Weir2007, Reference Copland, Mortimer, White, Richer McCallum, Mueller, Copland and Mueller2017; White and others, Reference White, Copland, Mueller and Van Wychen2015). These factors may have also played an important role in the loss of floating ice tongues observed in this study, particularly in Yelverton Inlet and Bay where several ice tongues have disappeared since the loss of MLSI in this region in summers 2008 and 2009 (Pope and others, Reference Pope, Copland and Mueller2012).
This study demonstrates that the icescape of Northern Ellesmere is changing and, if current temperatures persist or continue to increase, small ice caps will be the first to vanish and coastal zones will become free of floating glacier termini and ice shelves. If the ELA has risen by 300 m since 1960 levels, which seems possible given the rapid recent changes recorded by mass-balance programs on other nearby ice caps, then >50% of glaciers are currently completely in the ablation zone. It is important that regional inventories such as this one continue to be created and updated to monitor changing glacial landscapes in a warming climate.
ACKNOWLEDGEMENTS
This work was funded by grants from the Natural Sciences and Engineering Research Council (NSERC) of Canada, Canada Foundation for Innovation, University of Ottawa, Polar Continental Shelf Program, the Royal Canadian Geographic Society and ArcticNet, a Network of Centres of Excellence of Canada. We would like to acknowledge the Polar Geospatial Center (University of Minnesota) for providing early access to the ArcticDEM. Adrienne White was supported by graduate scholarships from NSERC, the Ontario Graduate Scholarship, the Association of Canadian Universities for Northern Studies, the Garfield Weston Foundation and awards from the Northern Scientific Training Program.


 Open access