

1. Introduction
The fear of missing out (FoMO) has become a widely referenced motivator of cryptocurrency (henceforth crypto) investment. For example, a 2022 New York Times Money feature “Everyone Has Crypto FoMO” highlights the apparently widespread prevalence of FoMOFootnote 1 , while the same year’s NFL Superbowl featured several crypto exchange advertisements with “Don’t Miss Out” themes.Footnote 2 While this suggests a common understanding of FoMO, consensus is lacking in its conceptualisation and measurement in an investment setting. It is unclear whether FoMO extends to other assets, notably stocks, and how FoMO relates to established predictors of consumers’ investment choices, primarily financial literacy, and risk tolerance. This is the focus of our paper. We propose and evaluate a simple model of crypto and stock investment to investigate the direct effect of FoMO on investment, whether financial literacy is an antecedent of FoMO, and whether FoMO has an indirect influence on investment via risk tolerance.
FoMO has been defined as the “pervasive apprehension that others might be having rewarding experiences from which one is absent” (Przybylski et al. Reference Przybylski, Murayama, DeHaan and Gladwell2013: 1841). FoMO was first proposed to explain the purchase of limited-edition sneaker brands (Herman Reference Herman2000) but has predominantly been used to explain (problematic) social media and mobile-phone use (Buglass et al. Reference Buglass, Binder, Betts and Underwood2017; Wang et al. Reference Wang, Xingchao Wang, Pan Zeng, Wang, Guo and Lei2019). While most conceptualisations propose FoMO as the motivator of behaviour, Buglass et al. (Reference Buglass, Binder, Betts and Underwood2017) suggest the behaviour (e.g., social network use) leads to FoMO, while Lo Coco et al. (Reference Lo Coco, Salerno, Franchina, La Tona, Di Blasi and Giordano2020) proposes a bi-directional relationship. FoMO has been associated with other behaviours such as TV viewing (Conlin et al. Reference Conlin, Billings and Auverset2016, Maxwell et al. Reference Maxwell, Tefertiller and Morris2022), broadened to a consumer-centric version linked to missing consumption experiences (Good and Hyman Reference Good and Hyman2021), and associated with types of consumption (e.g., conformity and conspicuous consumption, Argan et al. Reference Argan, Argan, Aydınoğlu and Özer2022). Relative to the already large FoMO literature, as evidenced by three recent meta-analyses (Akbari et al. Reference Akbari, Seydavi, Palmieri, Mansueto, Caselli and Spada2021; Fioravanti et al. Reference Fioravanti, Silvia Casale, Alfonso Prostamo, Ricca and Rotella2021; Zhang et al. Reference Zhang, Li and Yu2021), research on FoMO in an investment context is small. Available literature suggests higher FoMO among crypto and stock owners versus non-investors (Kim et al. Reference Kim, Hong, Hwang, Kim and Han2020), a mediating role for FoMO on “dark Tetrad” personality traits for crypto attitudes and crypto intentions (Martin et al. Reference Martin, Chrysochou, Strong, Wang and Yao2022), and a positive role of FoMO in initial coin offerings (ICOs) (Karkkainen Reference Karkkainen2022). Few papers consider the role of FoMO in stock investing though some consider the role of FoMO in aspects of stock investment or investing generally (Argan et al. Reference Argan, Altundal and Argan2022; Gupta and Shrivastava Reference Gupta and Shrivastava2021; Narula et al. Reference Narula, Shiva and Shahi2020).
Our interest in the role that an individual’s own fear of missing out plays in financial asset ownership complements a large empirical literature that has sought to explain why others miss out on participating in risky asset markets. In the case of stocks, non-participation “is likely to be a mistake” (Campbell Reference Campbell2016; 10), which implies the role of knowledge in investing. Similarly, FoMO implies knowledge of expected investment benefits that may be missed or at least an awareness of the investment option. Either is consistent with the view that perception of missing out is a necessary part of FoMO (Gupta and Sharma Reference Gupta and Sharma2021). Financial literacy is a positive predictor of stock market participation (Lusardi and Mitchell Reference Lusardi and Mitchell2014; van Rooij et al. Reference van Rooij, Lusardi and Alessie2011b; Yoong Reference Yoong, Olivia and Lusardi2011) and stock portfolio diversification (Abreu and Mendes Reference Abreu and Mendes2010; Giofré Reference Giofré2017; Guiso and Jappelli Reference Guiso and Jappelli2009; Koh et al. Reference Koh, Mitchell and Rohwedder2020) which suggests that in addition to a direct effect of financial literacy (knowledge) on investment, financial literacy may work indirectly through FoMO to impact investment decisions.
For crypto, there is less consensus as to the role of financial literacy with the attention given to crypto described as a “mania” (Smales Reference Smales2019) with patterns of prices driven by individual investors suggesting a speculative bubble (Cheah and Fry Reference Cheah and Fry2015), not discouraged by early advice from some central banks to avoid participation in crypto assets (Hackethal et al. Reference Hackethal, Hanspal, Lammer and Rink2021). This suggests FoMO may directly predict crypto ownership, independent of financial literacy. However, other crypto characteristics suggest a positive financial literacy role, given diversification benefits (Bouri et al. Reference Bouri, Shahzad, Roubaud, Kristoufek and Lucey2020; Chopra and Mehta Reference Chopra and Mehta2022).Footnote 3 For example, Bitcoin’s “unique risk-return characteristics follows a different volatility process when compared with other assets and is uncorrelated with other assets” (Baur et al. Reference Baur, Dimpfl and Kuck2018: 109). Understanding this role requires a higher level of financial literacy, though it is not obvious diversification benefits are a FoMO driver.
Modern portfolio theory (MPT) includes emotions, given it “implicitly assumes that human beings dislike high variance, as high variance tends to increase feelings of anxiety or fear” (Uberti et al. Reference Uberti, Lucarelli and Brighetti2013: 5). More generally “non-portfolio factors” can be accommodated in MPT as “the expected utility maxim provides a framework of analysis” (Markowitz Reference Markowitz1959: 210), and “fear or some other risk aversion relevant emotions can be thought as a state-contingent increase in the curvature of the utility function” (Guiso Reference Guiso, Faia, Hackethal, Halliassos and Langenbucher2015: 294). Other models present a means of including emotions more directly such as Uberti et al.'s (2013) generalized mean-variance theory or the broader two-factor Security-Potential/Aspiration model (Lopes Reference Lopes and Berkowitz1987; Lopes and Oden Reference Lopes and Oden1999), which combines dispositional and situational factors to explain risky choices. We expect both risk tolerance (dispositional preference between Security and Potential) and FoMO (which may act to set an Aspiration level (A)) to explain investment choice. This allows separating how an individual “usually looks at risks” from how an individual “reflects the opportunities at hand” (Lopes Reference Lopes and Berkowitz1987, 19), including new assets like crypto.
FoMO has predominantly been studied as a personality trait (Maxwell et al. Reference Maxwell, Tefertiller and Morris2022). Przybylski et al. (Reference Przybylski, Murayama, DeHaan and Gladwell2013) identify FoMO as a latent trait, situationally activated when individuals’ basic needs are not met (Zhang et al. Reference Zhang, Jiménez and Cicala2020). Others broaden the construct and distinguish state-FoMO, a specific cognition within the online context, from trait or dispositional-FoMO, reflecting a relatively stable individual characteristic (Wegmann et al. Reference Wegmann, Oberst, Stodt and Brand2017). Zhang et al. (Reference Zhang, Jiménez and Cicala2020) propose FoMO as an emotional response to perceived threats to the self-conceptFootnote 4 , private (personal) and public (social) and define FoMO as “a fear of missing an experience that can help an individual maintain or enhance their private/public self” (Zhang et al. Reference Zhang, Jiménez and Cicala2020: 1622). A personal dimension is expected to be more relevant to the investment context, where investing is expected to be linked to the individual benefits the investment provides. Our approach is consistent with treating FoMO as a trait, capturing individuals’ disposition to the emotional response of anxiety and apprehension from the perception of missing out on investment benefits. We use a psychometrically validated FoMO scale (Zhang et al. Reference Zhang, Jiménez and Cicala2020) but, consistent with the approach of Dohmen et al. (Reference Dohmen, Armin Falk, Sunde, Schupp and Wagner2011) when examining risk attitudes, we also explore whether there is “value-added from asking context-specific questions” (Dohmen et al. Reference Dohmen, Armin Falk, Sunde, Schupp and Wagner2011: 525) by exploring FoMO for specific investments. We are also interested in the role FoMO plays in explaining gender differences in investment, in a similar vein to Jacobsen et al.’s (Reference Jacobsen, Lee, Marquering and Zhang2014) examination of optimism. To investigate these relationships, we utilise a sample of undergraduate students drawn from a large Australian university. While student samples reduce the ability to generalise results, in the case of crypto young adults are a key demographic. For example, while the average age of Australian investors is 46 years (ASX 2020), estimates for the proportion of those aged 18–34 years owning crypto range from 47 percent (Finder 2022) to 58 percent (ASIC 2022), comparable to the US where 43 percent of 18–29 year-olds have invested in crypto (Perrin Reference Perrin2021). Further, the incidence and effects of FoMO are higher among younger adults (Australian Psychological Society 2015), making the current 18–25-year-old sample of interest.
Our contribution is fourfold. First, we provide a comparison of context-free and investment context-specific FoMO scales on the reported current and intended ownership of stock and crypto. While it is argued “theoretically, individuals may fear missing out on any type of consumption experience” [emphasis added] (Zhang et al. Reference Zhang, Jiménez and Cicala2020, 1631), in the case of stock or crypto investment, the association between these dimensions and the propensity to invest has not been investigated. Our second contribution is estimating the direct and indirect effects of FoMO, and financial literacy as an antecedent to FoMO. This complements emerging literature documenting the demographic characteristics of crypto investors (e.g., Hackethal et al. Reference Hackethal, Hanspal, Lammer and Rink2021). Third, we assess whether FoMO can explain gender differences in stock and crypto ownership, and whether there are gender differences in the sensitivity to FoMO. In addition, our paper can contribute to the emerging policy discussion of the appropriate regulatory oversight of cryptocurrencies and crypto assets for retail investors. For example, the Australian government has commenced a “token stocktake” as part of its consultation on “a framework for industry and regulators, which allows consumers to participate in the market while also better protecting them” (Chalmers Reference Chalmers2023).
To preview our results, we find FoMO has a significant association (medium effect sizeFootnote 5 ) with current crypto investment and future stock or crypto investment intentions. Financial literacy and risk tolerance have larger associations than FoMO with current stock ownership, whereas for current crypto ownership, FoMO has a larger association. Financial literacy retains a significant small effect for future stock investment but is not economically meaningful for crypto. We add to our understanding of the role of financial literacy, finding it to be an antecedent of FoMO, more so for stocks. While our evidence supports a role of FoMO on investment via risk tolerance, it is a small effect. FoMO does not appear to explain more than a small amount of previously documented gender differences in financial asset ownership in our sample. Finally, in terms of measurement, context appears to matter when measuring FoMO with more context-specific measures (i.e., stock, or crypto) having the largest associations.
The next section briefly reviews the literature that has examined emotions in asset pricing and reviews evidence on the strong gendered differences in the level of participation in financial asset markets. The latter highlights the characterisation of non-participation (missing-out) on risky assets as a mistake. This section also reviews the role of financial literacy and risk tolerance as well as evidence on the correlations of FoMO including the role of personality. Section 3 reviews the data and method and the following section presents the analysis. The final section provides a summation and suggestions for future research.
2. Literature
“Missing-out” or “non-participation” in stock markets is one of several “unambiguous mistakes” (Campbell Reference Campbell2016: 10) consumers make where costs of non-participation are staggering (Bucher-Koenen et al. Reference Bucher-Koenen, Alessie, Lusardi and van Rooij2021). Stock participation varies markedly across countries. For example, the U.S. direct participation rate is less than half of that in Australia (15 vs 34 percent), though more than a quarter larger than in Germany (15 vs 11 percent) (Badarinza et al. Reference Badarinza, Campbell and Ramadorai2016). Early estimates (2018) suggested smaller differences in crypto ownership rates across countries relative to stock with crypto ownership in the US (8 percent), Europe (nine percent), and 7 percent in Australia (ING 2018). However, crypto ownership rates are increasing rapidly, reflecting a global phenomenon (Feyen et al. Reference Feyen, Kawashima and Mittal2022), doubling across a range of countries between 2020 and 2022. For example, in Australia (from 8 to 18 percent), Singapore (10 to 25 percent), and Thailand (18 to 44 percent) (Statista 2022).Footnote 6
2.1. FoMO, emotions, and personality
Examining FoMO’s role adds to a literature that considers emotions and traits in investment and asset pricing. Aside from a direct effect of FoMO on investing, a possible indirect effect of FoMO is via risk tolerance, given “emotions determine tolerance for risk” (Shefrin Reference Shefrin2002: 121). A distinction can be made between incidental and integral emotions (Hasan et al. Reference Hasan, Kumar and Taffler2021: Zaleskiewicz and Traczyk Reference Zaleskiewicz, Traczyk, Zaleskiewicz and Traczyk2020). For example, incidental emotions relating to weather (e.g., Hirshleifer and Shumway Reference Hirshleifer and Shumway2003; Kamstra et al. Reference Kamstra, Kramer and Levi2003, Kramer and Weber Reference Kramer and Mark Weber2012), mood (e.g., Hirshleifer et al. Reference Hirshleifer, Jiang and DiGiovanni2020), and sentiment (Baker and Wurgler Reference Baker and Wurgler2006) are found to be linked to asset returns. FoMO can be grouped with integral emotions such as fear (Durand et al. Reference Durand, Lim and Kenton Zumwalt2011; Drechsler Reference Drechsler2013) and excitement and anxiety (Andrade et al. Reference Andrade, Odean and Lin2015; Hasan et al. Reference Hasan, Kumar and Taffler2021).
Claims that standard financial theories cannot explain return and price patterns of early cryptocurrencies (i.e., Bitcoin, Kristoufek Reference Kristoufek2013) led to an interest in psychological mechanisms underpinning crypto trading and trader risks (Oksanen et al. Reference Oksanen, Mantere, Vuorinen and Savolainen2022), and personality differences among stock, crypto, and non-investors (Kim et al. Reference Kim, Hong, Hwang, Kim and Han2020). Experimental evidence suggests “the marginal price of securities is set by investors whose personalities ‘attract’ them to traits in those securities.” (Durand et al. Reference Durand, Newby, Peggs and Siekierka2013: 125). Recent meta-analyses (Highhouse et al. Reference Highhouse, Wang and Zhang2022) provide evidence of significant correlation between risk propensity and Big-5 personality traitsFootnote 7 , similar to results using self-reported investment behaviours (Pinjisakikool Reference Pinjisakikool2018) and in trading behaviour in an experimental setting (Oehler et al. Reference Oehler, Wendt, Wedlich and Horn2018).
Similar associations between FoMO and personality have been investigated with small associations between FoMO and Big-5 personality traits (Rozgonjuk et al. Reference Rozgonjuk, Sindermann, Elhai and Montag2021).Footnote 8 FoMO sentiment is argued as a motivator for ICOs as perceived scarcity creates an incentive to purchase so as not to miss out on the investment opportunity (Karkkainen Reference Karkkainen2022). Personality differences are argued to be common across crypto and stock investors (e.g., openness) given “higher FoMO scores of investors (Bitcoin and share) compared to those of non-investors indicate that the former are more sensitive to rewarding experiences than the latter” (Kim et al. Reference Kim, Hong, Hwang, Kim and Han2020, 7). Eckel and llbrunn (Reference Eckel, Sascha and llbrunn2015) highlight a positive correlation between aggregate Type-A personality scores (and proportion of male traders) and price bubbles in experimental asset markets. Finally, regret (Loomes and Sugden Reference Loomes and Sugden1982), or at least the fear of regret, is linked to FoMO’s role in purchase likelihood (Good and Hyman Reference Good and Hyman2021), given FoMO is concerned with failures to act Metz (Reference Metz2019).Footnote 9
2.2. The role of financial literacy and risk tolerance
As previously noted, financial literacy is a positive predictor of stock market participation and stock portfolio diversification (Lusardi and Mitchell Reference Lusardi and Mitchell2014; van Rooij et al. Reference van Rooij, Lusardi and Alessie2011b; Yoong Reference Yoong, Olivia and Lusardi2011). The evidence for the relationship between financial literacy and crypto participation is less extensive and is inconclusive. For example, a negative relationship is reported between objective financial literacy and crypto ownership (Kim et al. Reference Kim, Hanna and LeeIn Press; Zhao and Zhang Reference Zhao and Zhang2021, U.S. samples), while a positive relationship is reported using subjective financial literacy and crypto ownership (Arias-Oliva et al. Reference Arias-Oliva, Pelegrín-Borondo and Matías-Clavero2019; Kim et al. Reference Kim, Hanna and LeeIn Press; Zhao and Zhang Reference Zhao and Zhang2021, in Spanish and U.S. samples, respectively). Cross-country analysis identifies a negative relationship between objective financial literacy and investment, notwithstanding greater crypto awareness (Panos et al. Reference Panos, Karkkainen and Atkinson2021).Footnote 10 Heterogeneity is also evident for crypto, with crypto owners without experience in conventional risky assets having significantly lower objective financial literacy than both crypto owners with experience, and non-crypto owners with conventional risky asset experience (Fujiki Reference Fujiki2021, Japanese sample).
Financial risk tolerance, or its inverse financial risk aversion (Faff et al. Reference Faff, Mulino and Chai2008), is central to investment decision-making in addition to its role in the saving and borrowing choices of individuals and households (Campbell Reference Campbell2006). Empirical estimates provide the intuitive result that stockholders have higher risk tolerance than non-stockholders (Elminejad et al. Reference Elminejad, Havranek and Irsova2022). Crypto investors are identified as more risk-tolerant (Santoso and Modjo Reference Santoso and Modjo2022), relatively more risk-seeking (Hackethal et al. Reference Hackethal, Hanspal, Lammer and Rink2021), and risk-loving (Conlon and McGee Reference Conlon and McGee2020).
2.3. Gender differences in financial literacy, risk tolerance, and FoMO
Men are more likely to participate in stock markets (Almenberg and Dreber Reference Almenberg and Dreber2015; Bacher Reference Bacher2022; Kaur and Vohra Reference Kaur and Vohra2012; Ke Reference Ke2021; Li et al. Reference Li, Li and Luo2021; van Rooij et al. Reference van Rooij, Lusardi and Alessie2011b; Lusardi and Mitchell Reference Lusardi and Mitchell2008) and allocate more to stock (e.g., retirement savings Agnew et al. Reference Agnew, Balduzzi and Sundén2003; Gerrans et al. Reference Gerrans, Clark-Murphy and Speelman2010; Säve-Söderbergh Reference Säve-Söderbergh2012). Gender differences in ownership appear more skewed for crypto. In Australia, a 3:2 male-to-female ratio for stocks (ASX 2020) compares with up to 3:1 for crypto (BTC Markets 2021), though less skewed for previous stock investors (35 vs. 49 percent, female vs males). The split is more skewed in the U.K. at 4:1 (Karim and Tomova Reference Karim and Tomova2021), comparable to Japan (Fujiki Reference Fujiki2021). Similar differences are indicated in administrative data for crypto-based products (e.g., contracts for difference and structured products, Hasso et al. Reference Hasso, Pelster and Breitmayer2019; Hackethal et al. Reference Hackethal, Hanspal, Lammer and Rink2021). These contrast with 2019 data from Malaysia and the Philippines where male vs. female ownership differences are smaller (26 vs. 20 and 34 vs. 30 percent, respectively), and Vietnam where the difference is reversed (38 (female) vs. 32 percent) (OECD 2019).
The skewed participation profile in stock and crypto investments by gender has drawn considerable attention to the underlying basis of the differences, notably the role of financial literacy and risk tolerance.Footnote 11 Lower financial literacy has been proposed as an explanation for lower female stock ownership rates (Almenberg and Dreber Reference Almenberg and Dreber2015; Bucher-Koenen et al. Reference Bucher-Koenen, Lusardi, Alessie and van Rooij2017; Lusardi and Mitchell Reference Lusardi and Mitchell2014). Bucher-Koenen et al. (Reference Bucher-Koenen, Alessie, Lusardi and van Rooij2021) and Cupák et al. (Reference Cupák, Fessler and Schneebaum2021) argue a combination of low financial literacy and self-confidence, explains a large part of the gender gap, while Merkoulova and Veld (Reference Merkoulova and Veld2022) find (ignorance) of expected stock returns is a significant part of gender differences in stock investing. Bannier et al. (Reference Bannier, Meyll, Röder and Walter2019) report a gender gap in “Bitcoin literacy” but do not consider its role in crypto ownership.Footnote 12 As with financial literacy, lower risk tolerance among women (Charness and Gneezy Reference Charness and Gneezy2012; Cupák et al. Reference Cupák, Fessler, Schneebaum and Silgoner2018; Dohmen et al. Reference Dohmen, Armin Falk, Sunde, Schupp and Wagner2011; Gneezy et al. Reference Gneezy, Leonard and List2009; Yoong Reference Yoong, Olivia and Lusardi2011) has been used to explain lower participation in risky financial markets (primarily stocks), though Nelson (Reference Nelson2015, Reference Nelson2016) argues that effect sizes are often not substantive. For crypto, gender breakdowns are unavailable but overall higher risk tolerance is associated with crypto investors (Kim et al. Reference Kim, Hong, Hwang, Kim and Han2020; Zhao and Zhang Reference Zhao and Zhang2021).Footnote 13 Evidence of gender difference in FoMO is not consistent with three meta-analyses reporting no moderating role of gender on FoMO and social media use (Akbari et al. Reference Akbari, Seydavi, Palmieri, Mansueto, Caselli and Spada2021; Fioravanti et al. Reference Fioravanti, Silvia Casale, Alfonso Prostamo, Ricca and Rotella2021; Zhang et al. Reference Zhang, Li and Yu2021).
To summarize, the literature establishes an expectation that FoMO has a positive direct effect on stock and crypto ownership. We expect financial literacy to predict FoMO, and FoMO to have an indirect effect on ownership via higher risk tolerance. We propose gender differences in both the level of FoMO and sensitivity to FoMO account for a significant proportion of gender differences in ownership, controlling for risk tolerance and financial literacy. We explore whether observed gender differences in FoMO and investing behaviours are substantive (Nelson Reference Nelson2015, Reference Nelson2016), and we extend the literature by investigating whether FoMO explains gender differences, and whether FoMO effects vary by gender. Finally, we expect the role of personality on asset ownership to be mediated by FoMO and risk tolerance.
3. Survey and data
To examine the expectations established in the previous section, we analyze data from a survey of undergraduate students at The University of Western Australia as part of a program examining the financial literacy of young adults, including students who enroll in an elective personal finance unit. A link to the online Qualtrics survey was made available through BlackBoard for the week prior to the semester. Those enrolled in the unit receive course credit (2%) for survey completion, and all survey participants enter a prize draw for one of ten $50 gift cards. From the 996 completed surveys, 63 from students older than 25 years were dropped to maintain a more homogenous age-group. The final sample (52 percent female) comprised STEM (52 percent), Humanities and Social Sciences (HASS, 20 percent), and Commerce majors (28 percent). Approximately 43 percent of the sample enrolled in the personal finance unit elective. The sample is more ethnically diverse than Kim et al. (Reference Kim, Hong, Hwang, Kim and Han2020) including 41% Australian/New Zealander, 42% Asian, 7% European/British. The survey was conducted in the last week of July 2021. Crypto and stock prices had risen substantially in the 12 months prior to the survey in the last week of July 2021. For example, Bitcoin (Ethereum) moved from US$11,810 (US$542) to US$41,697 (US$3,458) in the 12 months ending July 2021, which was nonetheless approximately 50 (40) percent lower than the 12-month peak of US$61,283 (US$4,994) 3 months earlier. Australian stocks also enjoyed a sustained 12-month rise with the market (All Ordinaries Index) increasing approximately 26 percent to the end of July 2021.
Three sets of FoMO scales were estimated and Panel A in Table 1 presents the items for each. The first included the Personal (five-items) and Social (four-items) dimensions proposed by Zhang et al. (Reference Zhang, Jiménez and Cicala2020). Analysis supported the proposed two-factor structure over a single-factor structureFootnote 14 and the Cronbach alpha for both dimensions support they are reliable measures (Personal 0.92, Social 0.93). The second set included the adapted investment version of the Personal scale (Adapted Personal) which also indicated a reliable scale (Cronbach alpha 0.94). Table 1 indicates that the Social and Personal scales had a medium correlation (0.47, CI 0.42–0.52)Footnote 15 consistent with Zhang et al. (Reference Zhang, Jiménez and Cicala2020). The Adapted Personal scale also had a small to medium correlation with the Personal scale (0.40, CI 0.33–0.46) but a small correlation with Social (0.24, CI 0.16–0.31). The final set included single-item direct measures of FoMO. All respondents were asked “To what extent do you fear missing out on the financial returns on the following investment opportunities if you don’t invest in them? Not at all, Slightly, Moderately, Considerably, A Great Deal”.Footnote 16 In addition to crypto and stocks, three other assets were also rated: home, gold, and superannuationFootnote 17 (retirement savings). Similar to stock and crypto, lower female ownership rates are reported for home ownership (CoreLogic 2022) and retirement savings in Australia, consistent with international evidence (Feng et al. Reference Feng, Gerrans, Moulang, Whiteside and Strydom2019). Gold is included as a contrast asset which also attracts a lot of attention but is expected to be a small proportion of individual portfolios.
FoMO scales summary scores. This table presents the items used in the FoMO scales (Panel A) and summary statistics for the scales (Panel B). Correlations significant at 95 percent confidence level indicated by *. N = 933 (Female=489, Male 444) for all variables except Personal Inv n = 723 (Female= 349, Male=337)
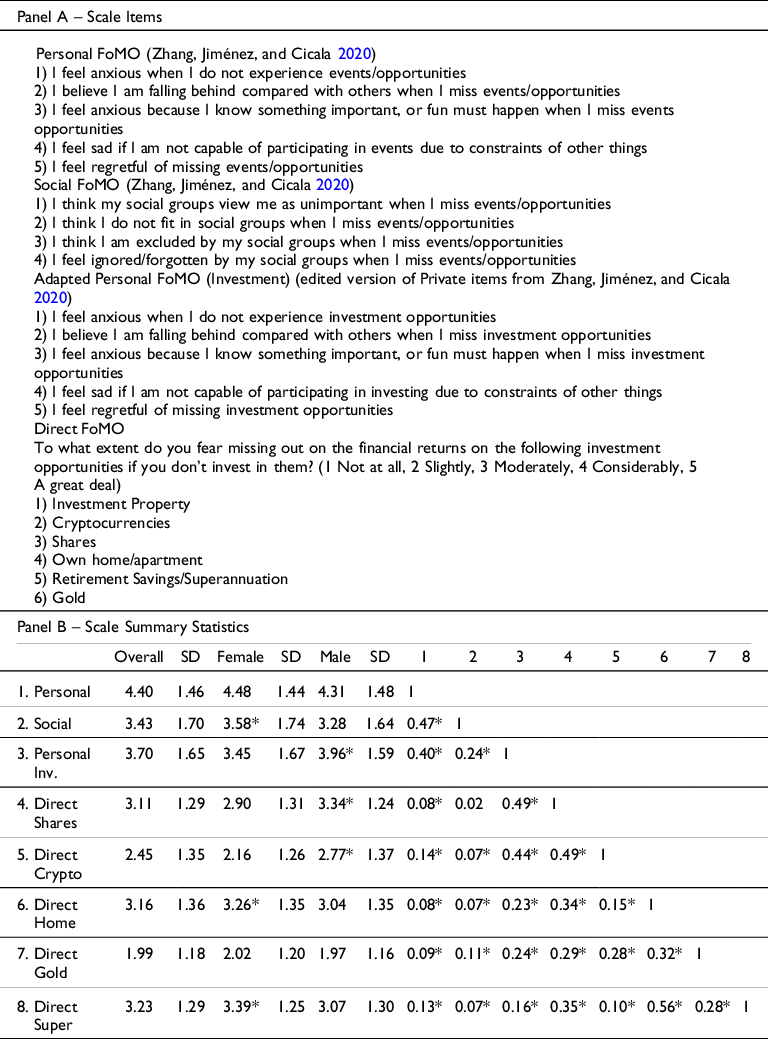
Each of the direct measures has a non-significant correlation or does not reach a small correlation size with the Personal or Social scales. Direct SharesFootnote 18 FoMO had a medium correlation (0.48, CI 0.44–0.54) with direct Crypto FoMO and a similar correlation with Adapted Personal (0.49, CI 0.43–0.54 and 0.44, CI 0.38–0.50, respectively). Adapted Personal had a small correlation with Home (0.23, CI 0.16–0.30), Gold (0.24, CI 0.17–0.31), and Super (0.16, CI 0.09–0.24). Risk tolerance scores (using the five-item scale of Jacobs-Lawson and Hershey (Reference Jacobs-Lawson and Hershey2005), Cronbach alpha 0.80) were significantly higher for males (Hedges g 0.49, CI 0.37–0.63). Financial literacy was assessed using the 13-item scale of Fernandes et al. (Reference Fernandes, Lynch and Netemeyer2014) (Kuder-Richardson coefficient of reliability (KR-20) 0.76). The Big-5 personality scores were collected using the 10-item version of Rammstedt (Reference Rammstedt2007)Footnote 19 with Spearman–Brown coefficients across the five dimensions averaging 0.44. In the regression estimations in the next section, all predictor variables were standardized.
4. Analysis and results
4.1. Asset ownership and scale summary
Most of the sample have not invested in either shares or crypto (66.2 percent). The smallest group have invested in crypto but not shares (8.6 percent) with 15.1 percent investing in shares but not crypto. Overall, 10.4 percent of respondents have both shares and crypto. Ownership of financial assets is significantly higher among males for both shares (37.3 vs 15.9 percent) and crypto (31.6 vs 7.1 percent).Footnote 20 Males also report a higher likelihood (extremely unlikely 1 to extremely likely 5) of future investment in shares (3.87 vs 3.01, 0.49 CI 0.36–0.62)Footnote 21 and crypto (3.01 vs 2.33, Hedge’s g 0.51 CI 0.38–0.64).Footnote 22 Table 2 indicates that many gender differences identified in the literature are evident in the sample. The mean score on the 13-item financial literacy scale is almost two questions higher for males (7.93 vs 6.13, Hedge’s g 0.62 CI 0.49–0.76). Consistent with Bucher-Koenen et al. (Reference Bucher-Koenen, Alessie, Lusardi and van Rooij2021), some of the differences may be confidence as females had more “Don’t Know” responses (4.17 vs 3.00).Footnote 23 Male risk tolerance is significantly higher (3.8 vs 3.2, Hedge’s g 0.50, CI 0.37–0.63).
Summary statistics. In Panel A, Mean score was significantly higher by gender (95 % confidence level) indicated by *. N = 933 (Female = 489, Male 444) for all variables except for Personal Inv n = 723 (Female = 349, Male = 337). In Panel B, correlations are significant at 95% confidence level, indicated by *
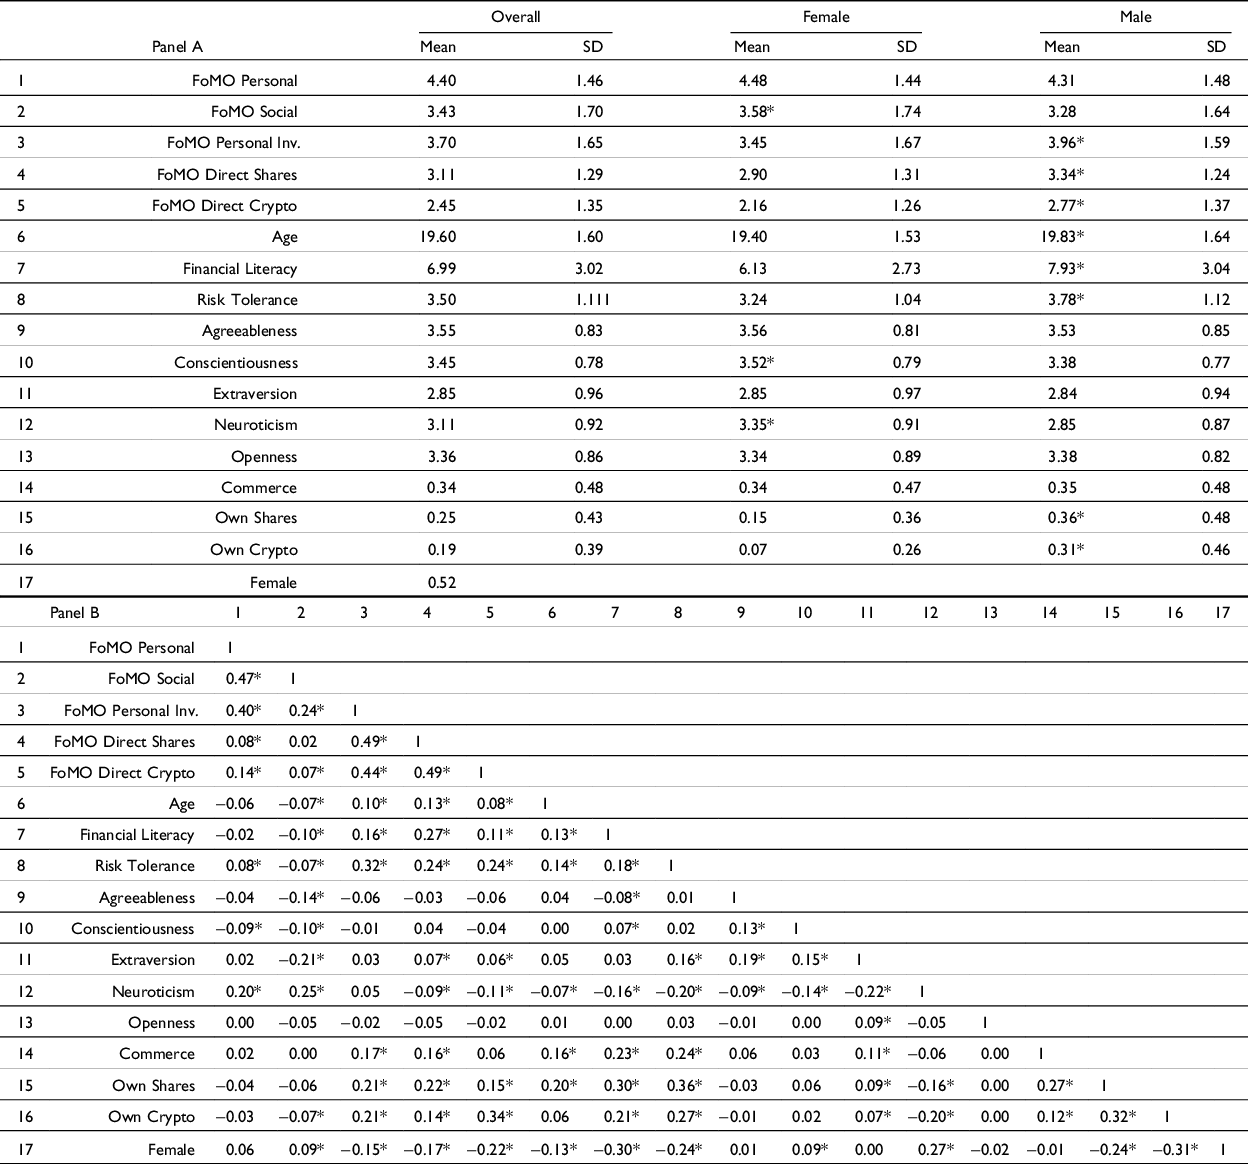
Of the three sets of FoMO measures, mean scores are highest for Personal (4.40, range 1 to 7) and lowest for Social (3.43, range 1 to 7). Personal and Social scores are positively correlated with social media use though not as strongly (Personal 0.20 and Social 0.09) as reported in Zhang et al. (Reference Zhang, Jiménez and Cicala2020) (Personal 0.31 and Social 0.19).Footnote 24 In contrast, Direct FoMO Shares score are not significantly related with social media use, and the Crypto score has a small correlation (0.08). Scores for Social and Personal FoMO scales are higher for females though only significant for Social (Hedge’s g 0.18, CI 0.05–0.31). In contrast, Adapted Personal (Hedge’s g 0.31, CI 0.16–0.46) and Direct Shares FoMO scores (Hedge’s g 0.34, CI 0.21–0.47) are significantly higher for males. Direct Crypto FoMO scores are also significantly higher for males (Hedge’s g 0.46, CI 0.33–0.59). Ranking by mean Direct FoMO scores shows gender differences again. For males, the highest score is for Shares, whereas for females, it is Super followed by Home. Males have significantly higher scores for Direct FoMO Shares (Hedges g 0.34, CI 0.21–0.47) and Direct FoMO Crypto (Hedges g 0.46, CI 0.33–0.59).
4.2. Current ownership and FoMO
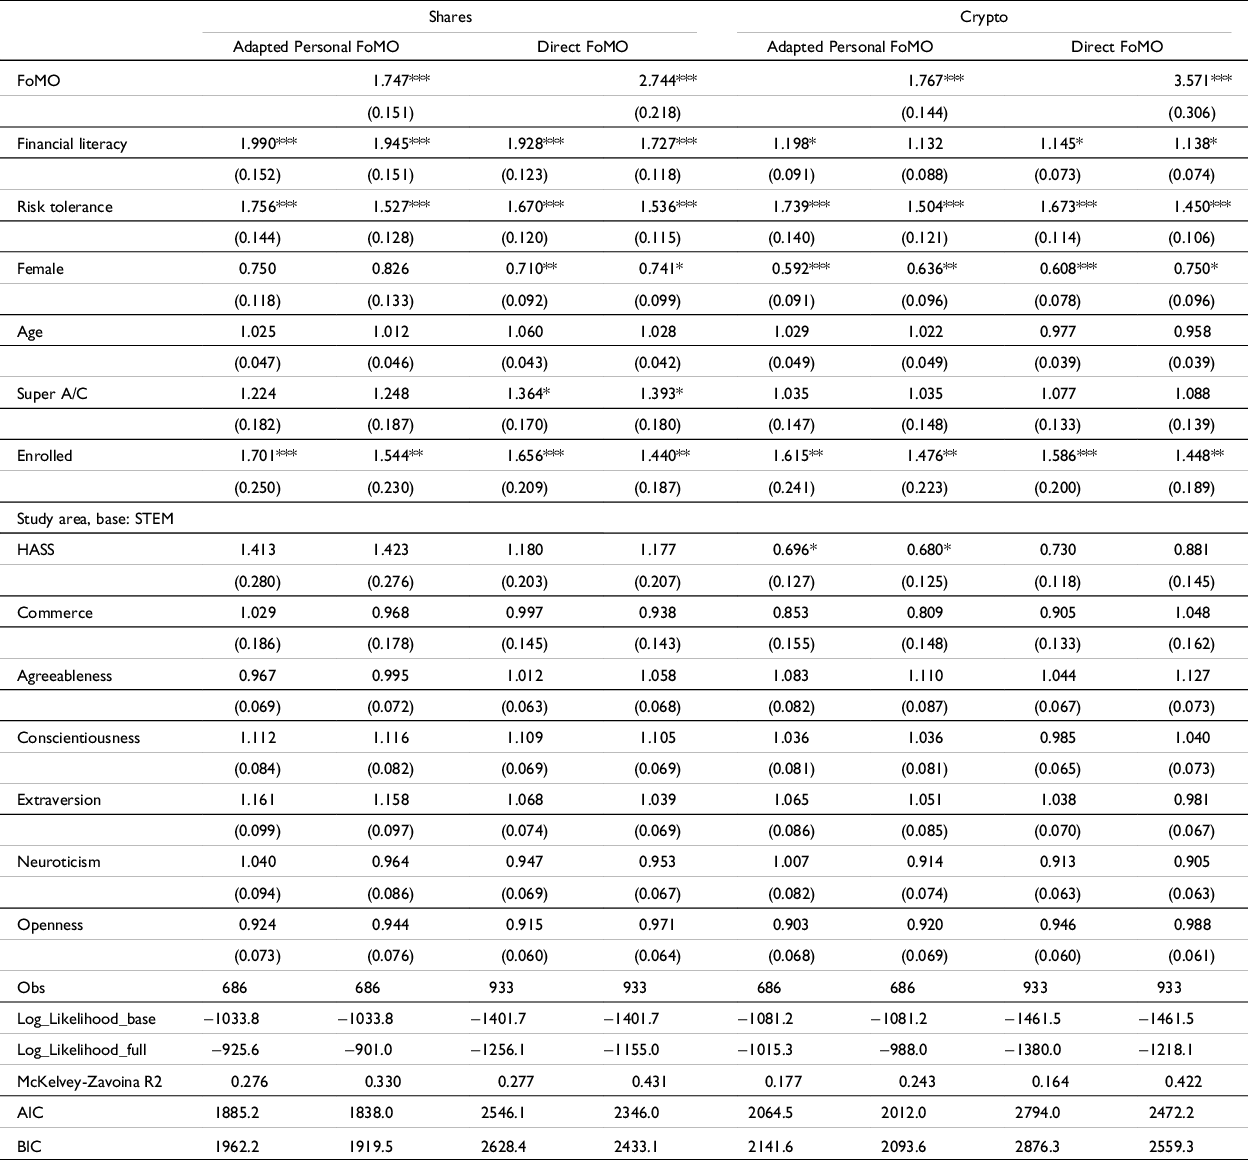
Tables 3 and 4 present odds ratios from a logit regression of current shares and crypto ownership, respectively, using the different FoMO scales. Personal and Social FoMO scales are not significant for shares or crypto ownership. However, both the Adapted Personal scale and the Direct FoMO measures are both significantly positively related to ownership of both assets. When measured unconditionally, the odds ratios suggest a small to medium effect size for FoMO and shares ownership but when other variables are controlled for the effect size is small.Footnote 25 The odds ratio of owning shares is 1.277 times (1.289) higher for a one-standard deviation (SD) higher Adapted Personal FoMO (Direct FoMO). For crypto, the effect of FoMO is higher than for shares, but this is sensitive to the choice of FoMO scale. The odds-ratio of ownership is 1.545 times higher based on the Adapted Personal scale or 2.156 times higher using Direct FoMO.
Current shares ownership and FoMO. This table presents the estimated odds ratios of current share ownership. Four measures of FoMO are estimated. The first four columns use the Personal and Social dimensions of Zhang et al. (Reference Zhang, Jiménez and Cicala2020). Columns five and six use the adapted investment version of the Personal dimension, and the final two columns use the direct measure of FoMO. Risk tolerance is the score from Jacobs-Lawson and Hershey (Reference Jacobs-Lawson and Hershey2005) and financial literacy is the factor score on the 13-item scale of Fernandes et al. (Reference Fernandes, Lynch and Netemeyer2014). Super A/C, Enrolled, and Commerce are all indicator variables indicating whether the respondent had a superannuation account, whether they enrolled in the personal finance unit, and whether they were a Commerce major. Remaining variables are the Big-5 personality traits (John et al. Reference John, Donahue and Kentle1991; Rammstedt Reference Rammstedt2007). Robust standard errors are presented in parentheses and significance is indicated by * p < 0.05, ** p < 0.01, and *** p < 0.001

Current cryptocurrency ownership and FoMO. This table presents the estimated odds ratios of current crypto ownership. Four measures of FoMO are estimated. The first four columns use the Personal and Social dimensions of Zhang et al. (Reference Zhang, Jiménez and Cicala2020). Columns five and six use the adapted investment version of the Personal dimension, and the final two columns use the direct measure of FoMO. Risk tolerance is the score from Jacobs-Lawson and Hershey (Reference Jacobs-Lawson and Hershey2005) and financial literacy is the factor score on the 13-item scale of Fernandes et al. (Reference Fernandes, Lynch and Netemeyer2014). Super A/C, and Enrolled are all indicator variables indicating whether the respondent had a superannuation account, and whether they enrolled in the personal finance unit. HASS (Humanities, Arts, and Social Sciences) and Commerce are indicators for the study area of the student’s major with the reference category being STEM. Remaining variables are the Big-5 personality traits (John et al. Reference John, Donahue and Kentle1991). All variables, excluding indicators, are standardized. Robust standard errors are presented in parentheses, with significance indicated by * p < 0.05, ** p < 0.01, and *** p < 0.001
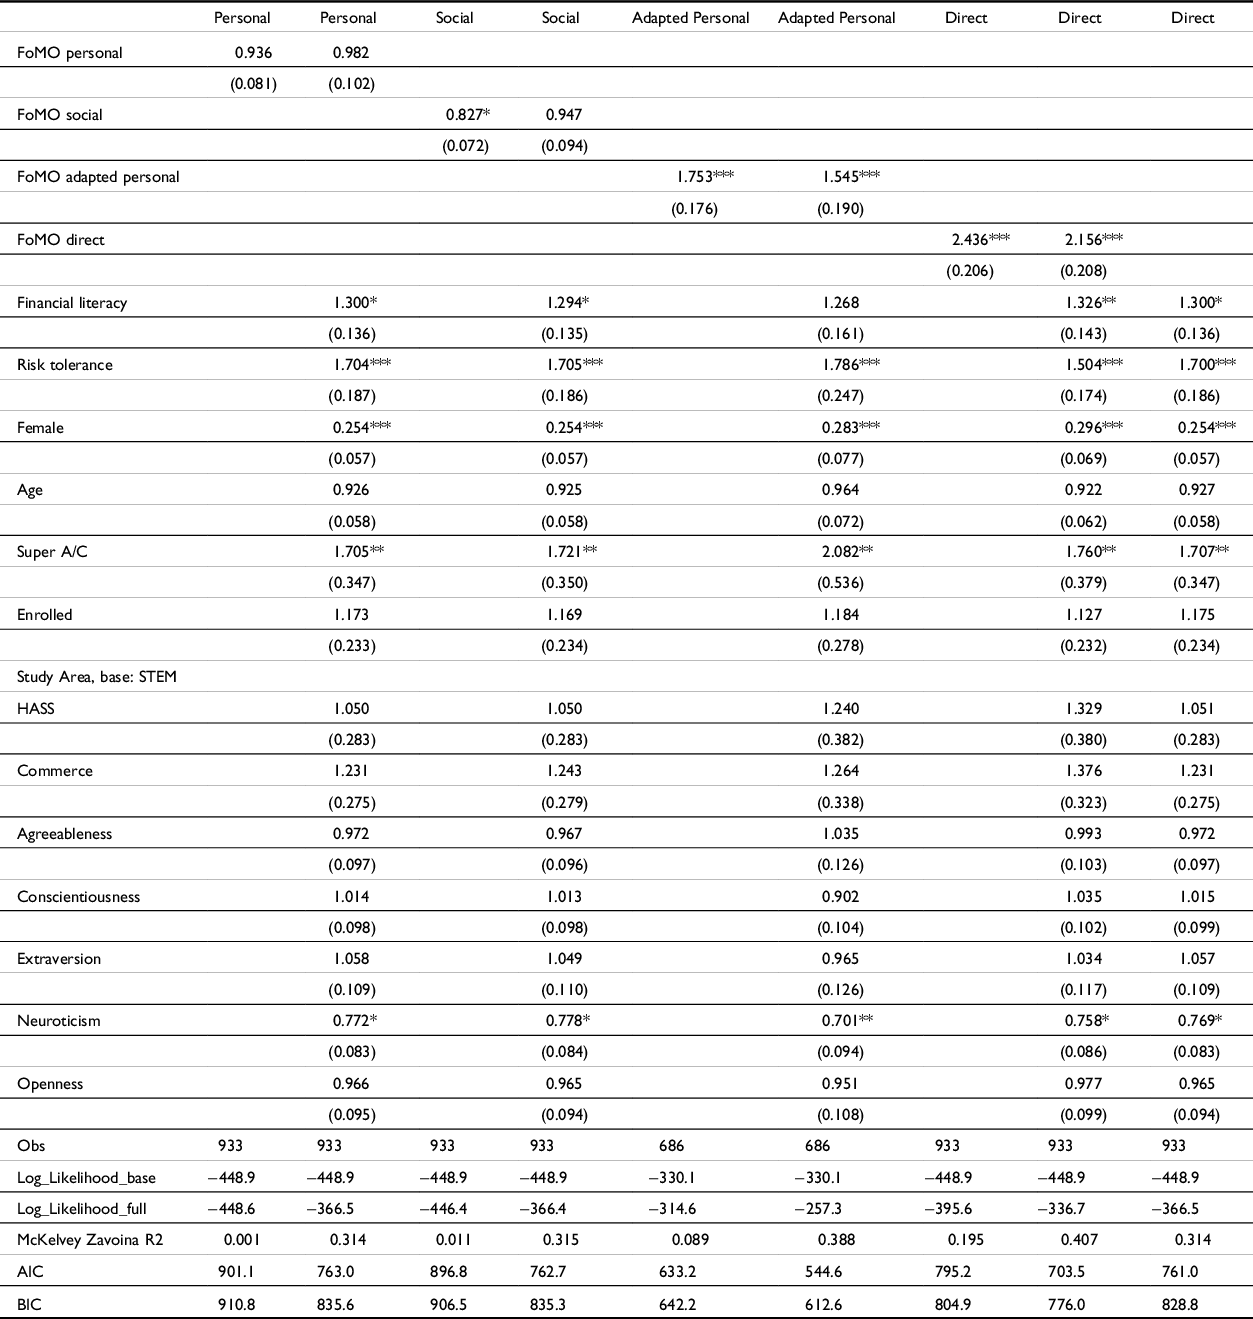
We do not have access to a large range of additional student demographics, but of the small number of controls, age (Age), and ownership of a superannuation account (Super A/C) are weakly positively related to shares ownership. However, for crypto Age is not significant but Super A/C is. Commerce students are significantly more likely to own shares, at least twice the odds of both their fellow HASS and STEM peers. None of the Big-Five personality traits are significant in directly explaining share ownership though those scoring higher on Neuroticism have significantly (weakly) lower odds ratio of owning crypto. A likelihood ratio test of the set of Big-5 variables indicates they do not improve model fit for either asset. The significantly lower ownership rates for females of shares and crypto is robust to the inclusion of additional variables. For shares (and using Direct FoMO, second last column), the odds ratio of females owning shares is a little more than half that of males, controlling for other variables. For shares ownership, including FoMO does not significantly impact the estimated gender difference (compare last two columns Table 3) contrary to expectations. Using the decomposition method of Breen et al. (Reference Breen, Bernt Karlson and Holm2013) to account for non-linear estimation, the reduction in gender effect is approximately 4 percent for shares and is not significant. For crypto, the odds ratio for female is lower again at 0.294 times that of males. Inclusion of FoMO (compare the last two columns of Table 4) significantly reduces the estimated gender effect by 15 percent.Footnote 26
Financial literacy and risk tolerance are both positively related to owning both assets. Focussing on FoMO Direct results (last three columns), the odds ratio of owning shares is 1.562 times higher for a one-SD higher Financial Literacy score. For crypto, the effect is weaker, with the odds ratio 1.326 times higher.
4.3. Direct and indirect effects – Current ownership
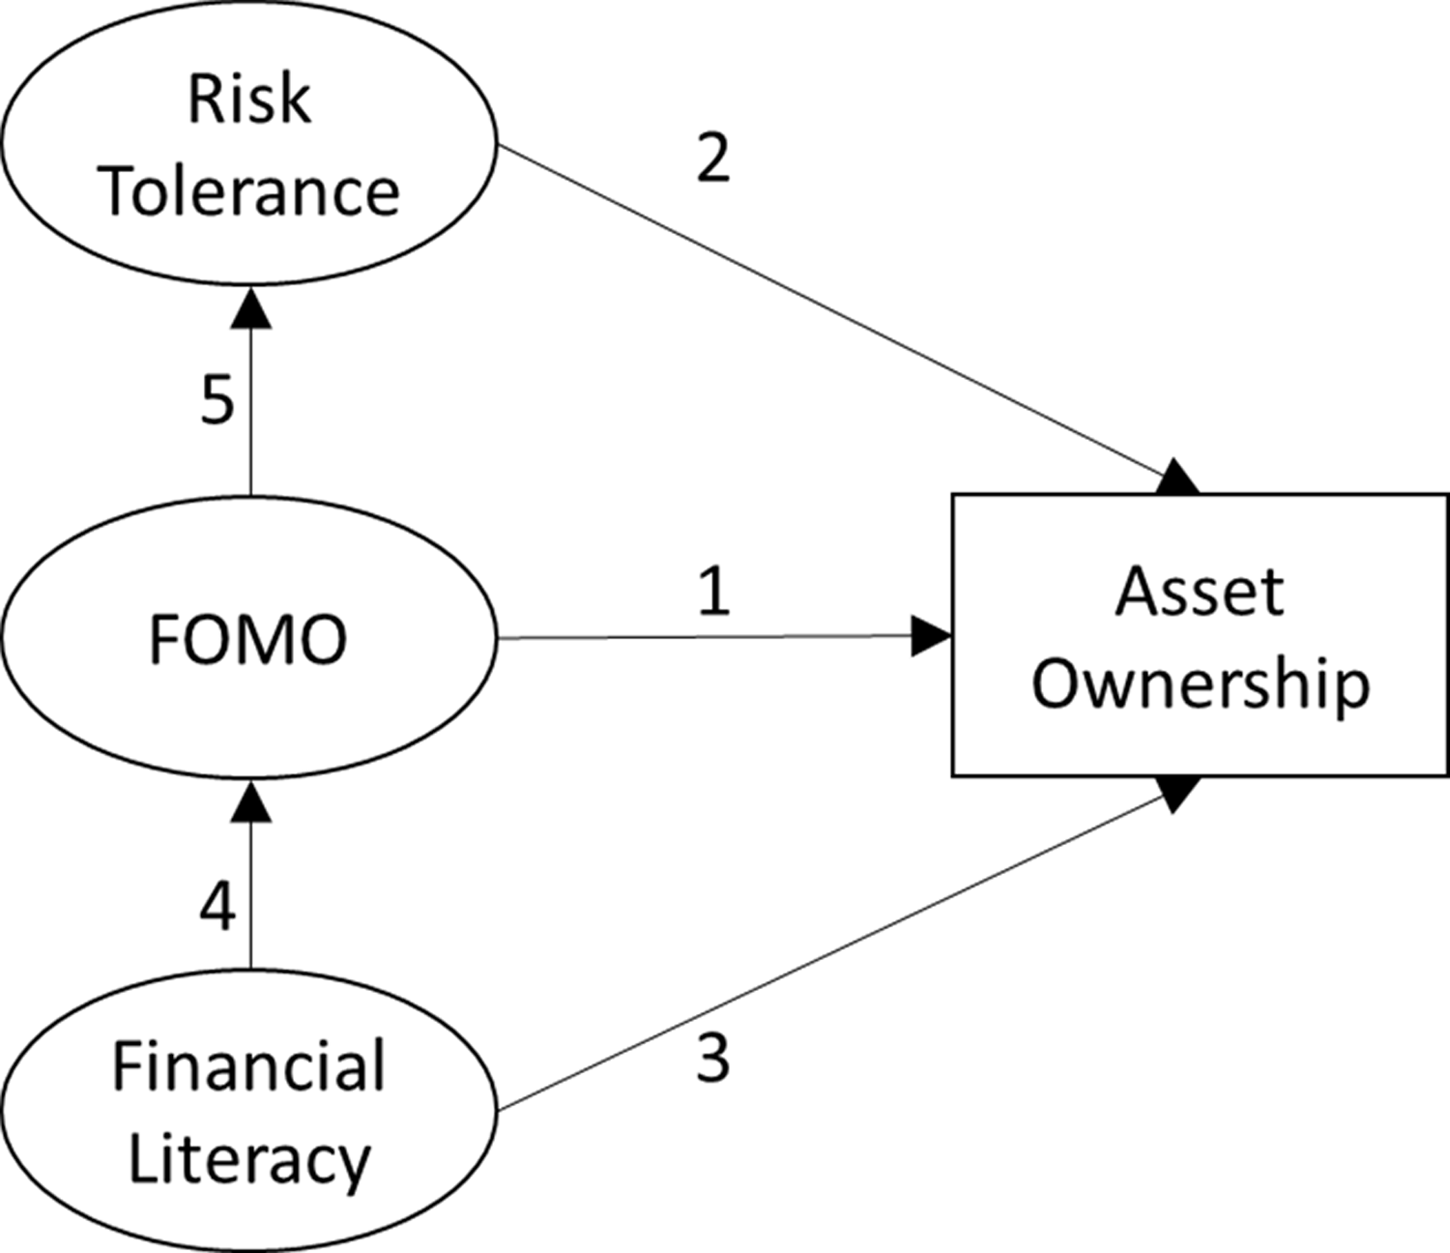
Having established significant relationships between context-specific (Adapted Personal and Direct) FoMO and asset ownership, the simple model in Figure 1 was estimated with results in Table 5.Footnote 27 In addition to direct effects from FoMO (arrow 1), Risk Tolerance (2), and Financial Literacy (3), indirect effects are expected for Financial Literacy via FoMO on asset ownership (4, 1) and for FoMO via Risk Tolerance on ownership (5, 2). Controls for the Big-Five and Age are included.
Model of direct and indirect effects on asset ownership.
Current ownership model – Shares and crypto. This table presents estimates for the simple model presented in Figure 1 using gsem in Stata. Estimates in columns one and five are odds ratios from logistic regressions and remaining columns present coefficients from OLS regressions. The respective Direct FoMO scales are presented. Risk tolerance is the score from Jacobs-Lawson and Hershey (Reference Jacobs-Lawson and Hershey2005) and financial literacy is the factor score on the 13-item scale of Fernandes et al. (Reference Fernandes, Lynch and Netemeyer2014). Remaining variables are the Big-5 personality traits (John et al. Reference John, Donahue and Kentle1991; Rammstedt Reference Rammstedt2007). All variables are standardized. Robust standard errors are presented in parentheses, and significance is indicated by * p < 0.05, ** p < 0.01, and *** p < 0.001.
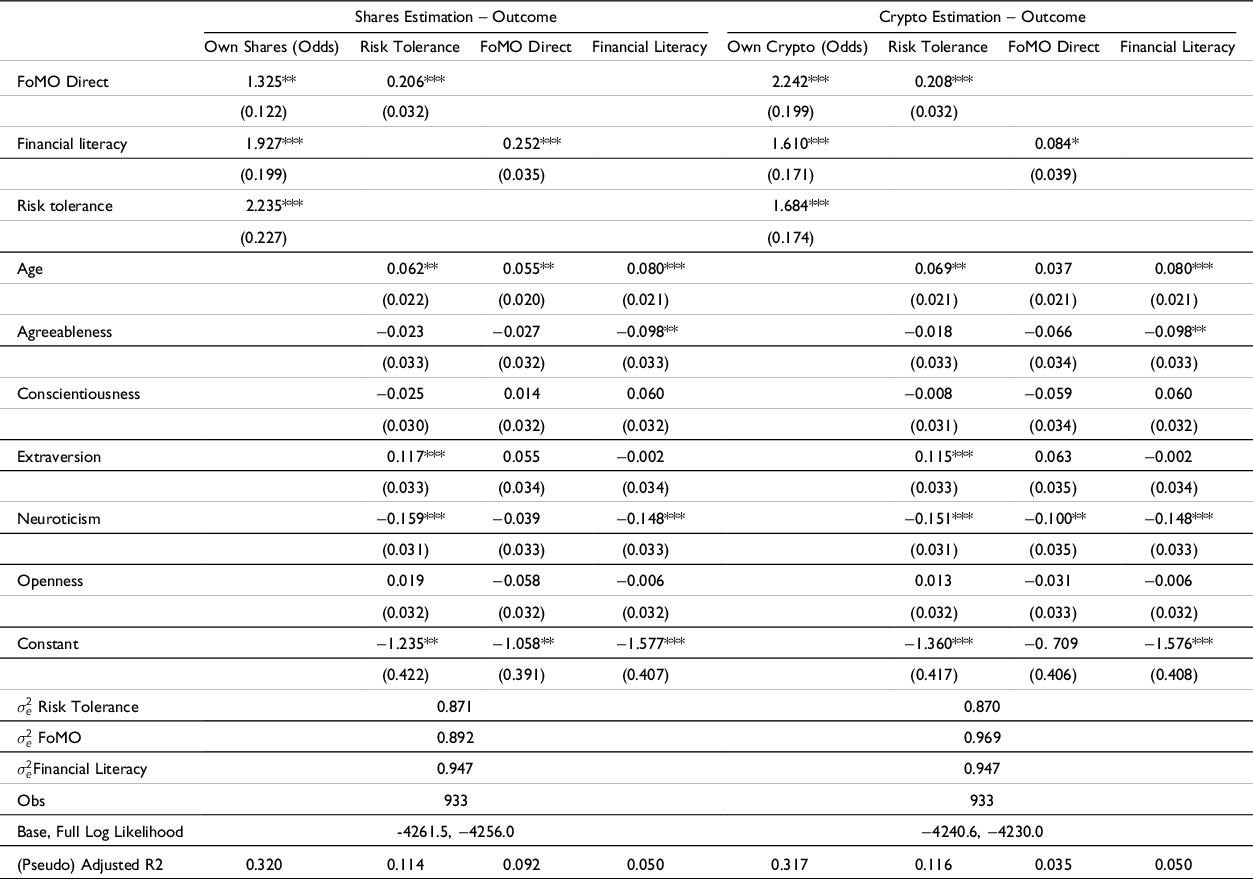
The Big-Five traits are not significant as direct predictors of shares and crypto ownership, apart from a weak negative relationship between Neuroticism and crypto. Extraversion is significantly positively associated with Risk Tolerance. None of the Big-Five traits are significant predictors of FoMO for shares, but Neuroticism is negatively associated with FoMO for crypto.Footnote 28 Neuroticism has a negative relationship with Financial Literacy, as does Agreeableness. Age is a positive and significant predictor of FoMO Direct Shares but not for FoMO Direct Crypto.Footnote 29
4.3.1. Shares
The results support a proposed indirect effect of Financial Literacy in addition to its direct effect. FoMO was expected to result in higher Risk Tolerance and the estimated indirect effect of FoMO via Risk Tolerance is consistent with this. The direct effect of FoMO on share ownership is significant, but small, with the odds ratio for ownership 1.325 times higher for a one-SD higher FoMO. The indirect effect of FoMO via Risk Tolerance is significant and positive, though small, with the odds ratio 1.180 times higher for a one SD FoMO increase.Footnote 30
In addition to a significant direct effect of Financial Literacy on share ownership, there is a small indirect effect via FoMO. The direct effect is odds of ownership 1.930 times higher for a one SD increase in Financial Literacy which exceeds a small effect threshold. The indirect effect of Financial Literacy via increased FoMO is statistically significant (odds ratio 1.074 times higher) but the size does not reach a small effect threshold. In addition, a significant indirect effect of Financial Literacy extends via FoMO through Risk Tolerance but the increase (odds ratio 1.043) is not meaningful. Collectively, the indirect effect is approximately 13 percent of the total effect of Financial Literacy on shares ownership.Footnote 31 FoMO’s association with share ownership is small (odds ratio 1.326 times higher) with an indirect effect via Risk Tolerance similar (odds ratio 1.322).
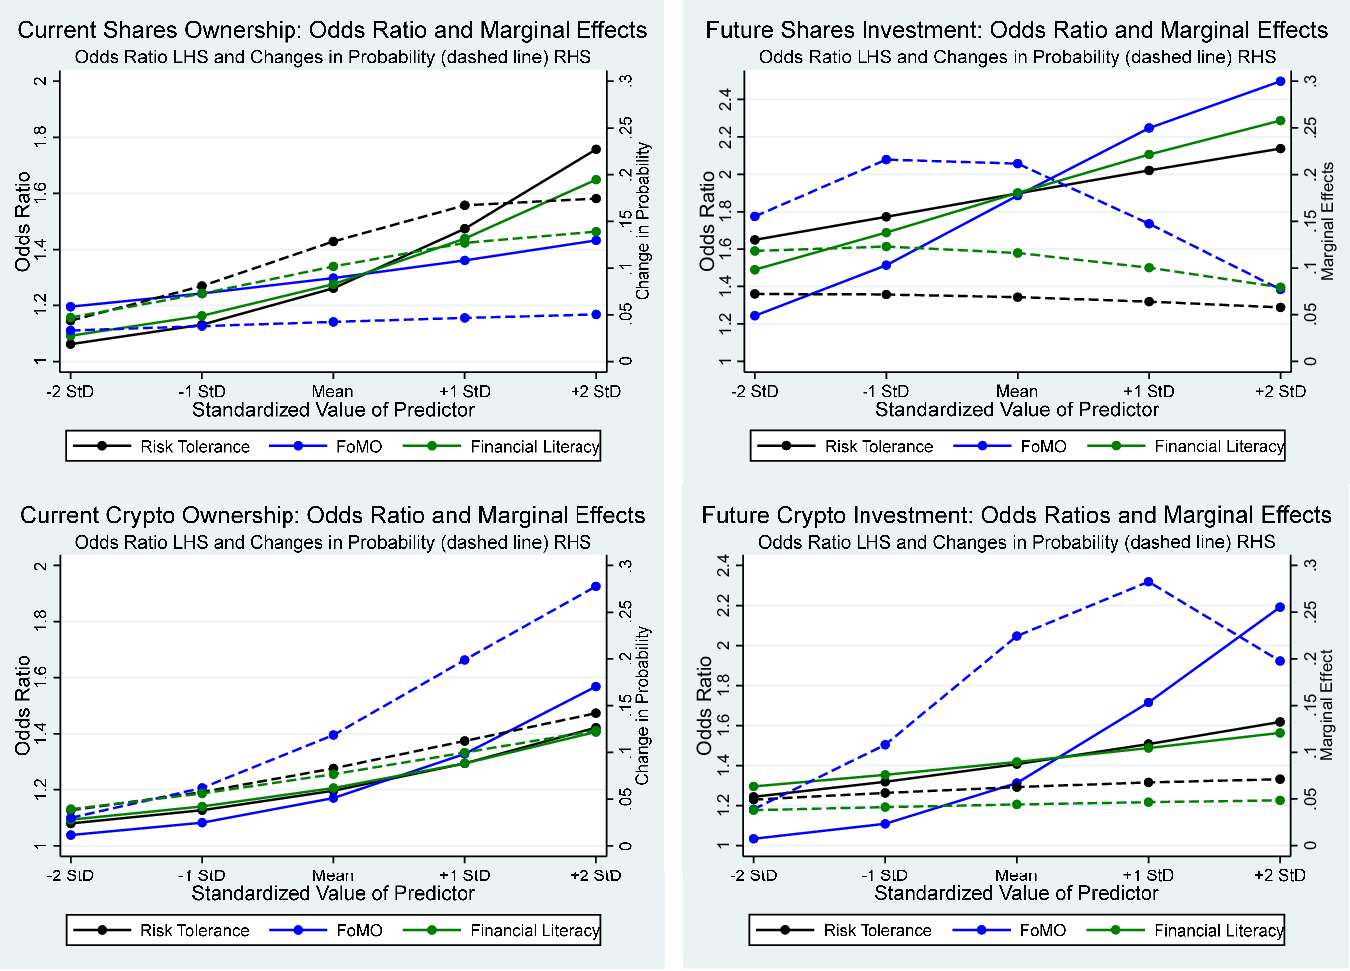
The estimates reported are average effects, but they can change over their distribution. To investigate, odds ratios and marginal effects for the direct effects were estimated at their mean and one and two SDs above and below the mean. The top left panel of Figure 2 indicates that for Shares the marginal effect of FoMO is largely constant across its distribution. No pairwise comparisons of marginal effects along the distribution are significantly different. In contrast, there is a larger change in ownership probability if the increase in Financial Literacy or Risk Tolerance is from a higher base level. For example, starting at a low level (one-SD below the mean) of Financial Literacy (Risk Tolerance), share ownership probability increases by nine (9.5) percentage points if Financial Literacy (Risk Tolerance) increases by one SD. At one SD above the mean, the same increase is associated with a 19 (25) percentage point change in Financial Literacy (Risk Tolerance).
Sensitivity of effects on current and future asset ownership.
4.3.2. Crypto
As with shares, indirect effects are evident for crypto. A small direct effect estimated for Financial Literacy is complemented via an indirect effect through FoMO, though not economically large (crypto ownership odds are 1.070 times higher for an increase in Financial Literacy via FoMO). The indirect effect of Financial Literacy through FoMO and Risk Tolerance to Crypto ownership is also not meaningful. As previously noted, the direct effect of FoMO on crypto ownership is approximately a medium effect with the odds ratio for ownership 2.242 times higher given a one-SD FoMO increase. The indirect effect of FoMO via Risk Tolerance is small. A one SD increase in FoMO has an indirect effect on ownership via Risk Tolerance with the odds ratio 1.145 times higher. The lower left panel of Figure 2 indicates that the role of FoMO is significantly different across its distribution. At a low FoMO level, one SD below the mean, crypto ownership probability increases by approximately six percentage points if FoMO increases by one SD. At one SD above the mean, the same FoMO increase is associated with a 20-percentage point change. Similar non-linearities are evident with Risk Tolerance and Financial Literacy, though more modestly. For example, for Financial Literacy, the comparable effects on crypto ownership change from approximately six percentage points to 10, and for Risk Tolerance from 6 to 11.
In summary, FoMO emerges with the strongest association with current crypto ownership, exceeding a small effect size, larger than the role of risk tolerance and financial literacy. In contrast, for shares, FoMO is not economically meaningful relative to the positive roles of risk tolerance and financial literacy. When FoMO is accounted for the estimated gender difference in share ownership is not significantly reduced, and for crypto, the reduction is only modest.
4.3.3. Moderating effects
Moderating effects were investigated for gender and current ownership of the other asset. In both cases, a likelihood ratio test rejects a constrained model of equality of effects (Gender: χ2 131.85 (27df), p-value < 0.01; Own Other Asset: χ2 135.32 (27df), p-value < 0.01). Differences in ownership probability were compared by the group at each point on the distribution.Footnote 32 For current share ownership, the gender difference in ownership probability (higher for males) is evident over the range of each variable but increases significantly with risk tolerance. For example, the gender difference widens from 7.3 percentage points at mean levels of risk tolerance to 15.3 percentage points one SD above the mean (χ2 10.4 (1df), p-value < 0.01). For FoMO and financial literacy, the gender gap significantly widens for similar changes, but the economic magnitude is small.Footnote 33 FoMO’s estimated effect on share ownership is also moderated by ownership of crypto. Those who own crypto have a 14.5 percentage point higher probability of owning shares at a mean level of FoMO which widens to 17.0 percentage points at a one SD higher FoMO level (χ2 14.5 (1df), p-value <0.01). A difficulty here is that ownership of crypto is strongly skewed by gender, as 80 percent of those owning crypto are males. Hence, a split by crypto ownership largely reflects gender differences.
For crypto, the effect of FoMO is significantly larger for males and for those currently owning shares. For example, at a mean FoMO level, the gender difference in crypto ownership is 14.3 percentage points but at one SD higher FoMO the gap is 20.4 percentage points (χ2 34.4 (1df), p-value < 0.01), and significantly larger again at two SDs above the mean (24.5 percentage points, χ2 14.0 (1df), p-value < 0.01). A gender moderation of the positive effect of Financial Literacy is observed. For example, the 14 percentage point gender difference in predicted crypto ownership at the mean level of Financial Literacy increases to 22.7 percentage points at two-SDs higher (χ2 31.3 (1df), p-value < 0.01). This is largely due to the probability for males increases by 13.0 percentage points over the Financial Literacy increase, whereas for females, the change is 4.2 percentage points.
4.3.4. Endogeneity
A potential problem with using financial literacy is endogeneity, as while we propose higher financial literacy predicts asset ownership, financial literacy may be higher due to ownership. To investigate, an instrumental variable probit regressionFootnote 34 is estimated with financial literacy instrumented with a measure of whether the participant had completed a business, accounting, or economics-related course at high school. Variations of this instrument have been used previously (Lusardi and Mitchell Reference Lusardi and Mitchell2007; Sekita et al. Reference Sekita, Kakkar and Ogaki2022; van Rooij et al. Reference van Rooij, Lusardi and Alessie2011b; van Rooij et al. Reference van Rooij, Lusardi and Alessie2012). For both shares and crypto, a Wald-test fails to reject exogeneity (Shares: χ2 1.01, p-value 0.315; Crypto χ2 0.96, p-value 0.328).Footnote 35 We report the instrumental results in Online Appendix Table 1, but given the failure to reject exogeneity, we rely on the previous results reported.Footnote 36
As with possible endogeneity of financial literacy, the same question can be asked of FoMO: does FoMO change once invested? Consistent with the dominant view of FoMO as a latent trait (Przybylski et al. Reference Przybylski, Murayama, DeHaan and Gladwell2013; Zhang et al. Reference Zhang, Jiménez and Cicala2020), FoMO has been primarily treated, theoretically, and empirically, as exogenous. A parallel can be drawn with how risk aversion is typically treated as a generally stable trait in the empirical literature examining stock participation (e.g., Bannier and Neubert Reference Bannier and Neubert2016; Cupák et al. Reference Cupák, Fessler, Hsu and Paradowski2022; Sivaramakrishnan et al. Reference Sivaramakrishnan, Srivastava and Rastogi2017; van Rooij et al. Reference van Rooij, Lusardi and Alessie2011b) notwithstanding the possibility that risk aversion may change given the experience of investing.Footnote 37 Using a FoMO scale evaluating the stable trait might alleviate endogeneity concerns, whereas using scales adapted to be more state/context specific may not. The direction of any possible change in FoMO is unclear. Investing in a stock or a cryptocurrency may reduce anxiety and apprehension for that specific stock or crypto but leave the predisposition (trait) to feel the anxiety (FoMO) unchanged. Many investors have non-diversified portfolios. For example, in a sample of Australian investors, the median number of stocks and cryptocurrencies is three each, and 36 percent of investors hold only one of either (Australian Securities and Investments Commission 2022). Hence, for a majority of investors, there are many stocks and cryptocurrencies remaining to fear missing out on, possibly leaving FoMO unchanged. Conversely, new investments may result in greater awareness of other investment opportunities, possibly amplified by the investment platforms promoting further trades, which may increase FoMO. As noted previously, there is no shortage of new offerings promoted by platforms and celebrities targeting potential investors.Footnote 38 This possibility, i.e., the behaviour begets more FoMO, has been proposed in FoMO-social media literature (e.g., Buglass et al. Reference Buglass, Binder, Betts and Underwood2017; Bloemen and De Coninck Reference Bloemen and De Coninck2020). Finally, investments are characterized by the asset and time. In the wake of the collapse of FTX while the number of cryptocurrencies remained numbered in the many thousandsFootnote 39 , a more context-specific (state) FoMO may have reduced for prospective investors, just as FoMO focussed on an event which has passed may wane (Maxwell et al. Reference Maxwell, Tefertiller and Morris2022). Resolving these questions will require further longitudinal work, to establish the temporal stability of FoMO in general (Lo Coco et al. Reference Lo Coco, Salerno, Franchina, La Tona, Di Blasi and Giordano2020), and in an investment context, as well as establish the relationship between FoMO and portfolio development and composition.
4.4. Future investment
To investigate whether the relationships for current ownership are reflected in investment intentions, an ordinal logit regression of the likelihood of investing in crypto and shares (Extremely Unlikely (1) to Extremely Likely (5)) was estimated using the Adapted Personal FoMO and Direct FoMO scores.Footnote 40 The estimations presented in Table 6 indicate similar effects as with current ownership. The Big-Five personality traits, Age, Study area, or ownership of superannuation are not significant. Female students are less likely to invest (odds of a more likely response are 0.75 times that of males using the Direct scale), though this is only weakly significant and reflects a small effect.Footnote 41 Those enrolled in the personal finance unit are significantly more likely to intend to invest in both assets, potentially reflecting a motivation for unit enrolment. The Direct FoMO scale results in better model fit for both assetsFootnote 42 , and the estimated FoMO effect is larger and exceeds a medium effect size.
Likelihood of future share and crypto investment. This table presents the estimated odds of future investment in shares and crypto. The Adapted Personal FoMO score and Direct FoMO scores are used in the estimations. Risk tolerance is the score from Jacobs-Lawson and Hershey (Reference Jacobs-Lawson and Hershey2005) and financial literacy is the factor score on the 13-item scale of Fernandes et al. (Reference Fernandes, Lynch and Netemeyer2014). Super A/C, enrolled, and commerce are all indicator variables indicating whether the respondent had a superannuation account, whether they enrolled in the personal finance unit, and whether they were a Commerce major. Remaining variables are the Big-5 personality traits (John et al. Reference John, Donahue and Kentle1991; Rammstedt Reference Rammstedt2007). Robust standard errors are presented in parentheses, significance indicated by * p < 0.05, ** p < 0.01, and *** p < 0.001
For future share ownership, the inclusion of FoMO does not significantly impact the estimated gender difference (columns three and four in Table 6), similar to current share ownership. However, for crypto, there is a large difference with the inclusion of FoMO reducing the estimated gender difference, using the decomposition method of Breen et al. (Reference Breen, Bernt Karlson and Holm2013) to account for non-linear estimation, by an estimated 56 percent (last two columns Table 6).
4.4.1. Direct and indirect effects – Future investment
To enable estimation of the same simple model as for current investment, “Extremely likely” and “Very likely” responses were recoded to one with the remaining responses coded as zero. Recoded this way suggests a high intended share ownership rate (60 percent, 70/52 percent male/female) relative to current adult participation rates, which vary from 34 percent of the adult population (ASX 2020) to 49 percent (Blackburn Reference Blackburn2021).Footnote 43 However, it is comparable to reported rates among Gen-ZFootnote 44 considering investing in the future, estimated to be 87/79 percent for males/females. The Direct measures of FoMO are again used in the estimations, and results are reported in Table 7.Footnote 45 FoMO has the largest estimated effect, exceeding a medium size effect for shares (0.569, CI 0.471–0.666) and crypto (0.668, CI 0.566–0.770). The effect of financial literacy is comparable to that estimated for current ownership. The odds of future shares ownership are 1.899 times higher for a one SD increase in Financial Literacy, which is a small effect (0.354, CI 0.256–0.452). The same increase in Financial Literacy for crypto results in an odds ratio 1.330 times higher, which does not reach a small effect threshold (0.157, CI 0.060–0.254). Risk tolerance has a small positive effect for both shares (0.220, CI 0.118–0.322) and crypto (0.219, CI 0.122–0.315).
Future share and crypto investment model. This table presents estimates for the simple model presented in Figure 1 using gsem in Stata for future investment. Results are restricted to the logistic regressions of the constructed indicator of intention to invest where “Likely to” and “Extremely Likely” responses are coded as one and remaining responses (Extremely Unlikely, Unlikely, Neither Unlikely or Likely) scored as zero. The remaining indirect paths in Figure 1 are not reported as they are the same as reported in Table 5. The respective Direct FoMO scales are used. Risk tolerance is the score from Jacobs-Lawson and Hershey (Reference Jacobs-Lawson and Hershey2005) and financial literacy is the factor score on the 13-item scale of Fernandes et al. (Reference Fernandes, Lynch and Netemeyer2014). All variables are standardized. Robust standard errors are presented in parentheses and significance is indicated by * p < 0.05, ** p < 0.01, and *** p < 0.001

Figure 2 presents estimated odds ratios and marginal effects over a range of scores for each variable to investigate non-linearity of effects. For shares (top right panel), while the odds ratio increases over the range of each variable, the significant variation in marginal effects is isolated to FoMO. For example, a change in FoMO from one SD below the mean has a larger marginal effect (22 percentage points) than at one SD higher than the mean (15 percentage points, difference χ2 22.60, p-value <0.01). A similar pattern is observed for financial literacy though the change is smaller (12 percentage points increase vs 10 percentage points, difference χ2 11.63, p-value <0.01). For risk tolerance, estimated marginal effects do not vary significantly. In sum, while the effects of financial literacy and risk tolerance are largely of the same magnitude across their distribution, differences associated with FoMO are larger at low to mean FoMO levels.
The lower right panel of Figure 2 suggests a similar variation in FoMO for future crypto investment. Larger effects are estimated at already high levels of FoMO. For example, the marginal effect of an increase in FoMO is 28 percentage points at a level one-SD above the mean versus 11 percentage points at one-SD below the mean (difference χ2 49.95, p-value <0.01). None of the variations in estimated marginal effects for financial literacy and risk tolerance are significant. As with current ownership, the indirect effect of financial literacy via FoMO is larger for shares. The increased odds ratio (1.296 times higher) does not exceed a small effect. Indirect effects of FoMO via risk tolerance are not economically meaningful for either shares or crypto.
In summary, FoMO has a relatively more significant role in investment intentions for both assets. Risk tolerance is again positively related to a more likely response, and financial literacy is only significant for future shares investment. Notably, FoMO accounts for a large (more than half) of the estimated gender difference for crypto responses.
4.4.2. Group differences
A likelihood ratio test suggests differences in estimates by gender for shares (χ2 (23df) 124.6, p-value <0.01) and crypto (χ2 (23df) 150.95, p-value <0.01). Similar tests based on current ownership of each asset also suggested differences for shares (χ2 (23df) 209.56, p-value <0.01) and crypto (χ2 (23df) 243.41, p-value <0.01).Footnote 46 To investigate, future investment probabilities were estimated by gender and current ownership of the asset.Footnote 47 For future share investment, while the level of risk tolerance, financial literacy, and FoMO is significantly higher for males, there is no significant variation in their effect by gender. However, effects are moderated by whether an individual currently owns shares. The overall effect of FoMO on intention to own shares is larger for those currently owning shares and varies over FoMO. For example, at higher FoMO (one-SD above the mean), the marginal effect is larger for those who do not currently own shares (15.7 percentage points vs 7.0 percentage points, χ2 19.483, p-value <0.01) whereas at a very low level (two-SDs below mean) the marginal effect is higher for those who currently own shares (25.5 vs 14.1 percentage points, χ2 19.876, p-value <0.01). The effect of financial literacy is also higher for those owning shares, robust across levels of financial literacy. The effect of risk tolerance on future share ownership is larger for those who currently own shares, driven by larger effects for those not owning shares. That is, for those currently owning shares, increasing risk tolerance does not result in a higher future probability, whereas it does for those who do not own shares.
For crypto, gender does not moderate effects on future crypto ownership probability. For those currently owning crypto, there is a significantly higher probability of future investment in crypto. Current ownership of crypto moderates the effect of FoMO on future ownership. The marginal effect of FoMO is significantly larger for those currently owning crypto (24.3 vs 15.6 percentage points, χ2 19.483, p-value <0.01), indicating that FoMO remains significantly higher given current ownership, and possibly that FoMO doesn’t dissipate with ownership. This is consistent with the limited longitudinal evidence of stable FoMO scores over a 4-month period in a sample of Italian college students (Bonfanti et al. Reference Bonfanti, Salerno, Brugnera and Lo Coco2022), and higher FoMO scores 12 months after initial measurement in a sample of adolescents (12–16 years) (Lo Coco et al. Reference Lo Coco, Salerno, Franchina, La Tona, Di Blasi and Giordano2020). The larger FoMO effect for current owners is isolated to those with low (one-SD below the mean) or mean FoMO levels. An increase at these levels is associated with a larger increase in future probability for current owners of 13.9 and 22.0 percentage points, respectively.
5. Discussion and conclusion
The use of FoMO in crypto exchange advertisements is an example of how institutions expect emotions to play a role in investment decisions. Investment theory, while not discounting the role of emotions or “non-portfolio factors” (Markowitz Reference Markowitz1959: 210), assumes individuals’ decisions are built on risk-premium expectations, which should result in their participation irrespective of their degree of risk aversion (Campbell Reference Campbell2006). For stocks, lack of participation has focussed attention on the role of investor characteristics that establish barriers, notably financial literacy; investor attitudes that predispose against participation, notably risk aversion/tolerance; and demographics, notably gender. Including FoMO builds on work that has established a role for emotions in investment decisions (e.g., Drechsler Reference Drechsler2013; Durand et al. Reference Durand, Lim and Kenton Zumwalt2011; Uberti et al. Reference Uberti, Lucarelli and Brighetti2013), and literature examining differences in psychological status and personality between investors and non-investors.
Our undergraduate sample has the advantage that it is an age-group over-represented in crypto investment, but the disadvantage is that results may not generalise. Also, our results are captured by data collection timing as crypto and stock prices had risen substantially over the preceding 12 months, though crypto had also experienced substantial declines in the preceding 3 months. Future work can investigate the robustness of results to older age groups and to different market conditions. Also, our data are cross-sectional which prevents conclusions of causality and limits our ability to examine endogeneity. Longitudinal FoMO data in an investment context is needed to address this.
Consistent with prior evidence, we find significant gender differences in current stock (31 vs 15 percent, males vs females) and crypto investment (31 vs 7 percent, males vs females). While scores on context-free FoMO scales (Zhang et al. Reference Zhang, Jiménez and Cicala2020) are higher for females, investment-specific FoMO scores are higher for males. While context-free personal and social FoMO scales of Zhang et al. (Reference Zhang, Jiménez and Cicala2020) correlate with behaviours previously investigated (i.e., social media use), they do not correlate with stock and crypto investment. However, an adapted investment version of Zhang et al.’s personal scale does. Single-item direct measures of FoMO (e.g., stocks and crypto) have the strongest correlation with current investment behaviour and intentions and using either suggests significant positive direct FoMO effects. Context matters when examining associations between FoMO and investment. While direct FoMO scores are the most informative, a limitation in our analysis is that they were measured with single items. Future work could focus on developing multiple-item direct scales that allow alternative framing, for example, to consider current ownership status.
Estimates from a simple model of investment identify a significant role for FoMO along with financial literacy and risk tolerance for current investment and future investment intentions for both stocks and crypto. FoMO effects are largest (medium size) for crypto and for future investment intentions. FoMO effects are the smallest for a current stock investment and do not reach a small effect threshold. Risk tolerance and financial literacy have larger effects than FoMO on current ownership of stocks. While risk tolerance and financial literacy have positive effects for current crypto investment, they are small and smaller than FoMO. Financial literacy retains a significant small effect for future stock investment but not for crypto. The role of personality traits in investment behaviour and intentions appears to be accounted for by risk tolerance. Of the Big-5 personality traits, only neuroticism is significantly (weakly negative) related to investment (current crypto), but extraversion (positive) and neuroticism (negative) are significantly related to risk tolerance. A limitation in our analysis is the use of an abbreviated scale (Rammstedt Reference Rammstedt2007), which may result in noisier Big-5 estimates and contribute to our results.
In addition to direct effects, financial literacy has an indirect effect on investment via FoMO, suggesting FoMO has some basis in knowledge though this is a small effect and only robust for stocks. Financial literacy is a significant predictor of FoMO for stocks but only weakly for crypto. A role of FoMO via risk tolerance on investment is supported as FoMO is a significant positive predictor of risk tolerance though it is not economically meaningful.
FoMO explains only a small amount of gender difference in current crypto ownership, and it does not significantly explain the observed gender difference for stocks. Gender moderates the effect of risk tolerance on current ownership of stocks as in addition to significantly higher average risk tolerance, marginal effects of risk tolerance is larger for males. For current crypto ownership, FoMO has a larger effect for males and for those with experience investing in stocks. Similarly, FoMO’s effect on crypto investment intentions is larger for those who currently own crypto, suggesting FoMO’s effect does not dissipate.
Finally, our paper is agnostic on whether FoMO is good or bad. FoMO has been investigated primarily within the context of problematic social media use and associated poor health outcomes. Our study does not investigate FoMO consequences beyond impacts on risk tolerance and investment. To the extent non-participation in stock markets is a mistake (Campbell Reference Campbell2016), FoMO might serve a positive role. Given (small) positive associations between financial literacy and FoMO (stocks), this raises interest in the role of interventions directly addressing FoMO. For crypto, where the level and marginal effect of FoMO is larger for males, outcomes such as intensity of participation/trading and consequences are of interest. Evidence in these areas would help clarify “what is to fear from the fear of missing out?”.
Supplementary material
To view supplementary material for this article, please visit https://doi.org/10.1017/flw.2023.6


 Open access