


Introduction
The January 2022 eruption of the Hunga submarine volcano (20°32’S, 175°23’W) injected vast amounts of water vapour into the stratosphere, as was first observed by Millán et al. (Reference Millán, Santee, Lambert, Livesey, Werner and Schwartz2022) and Vömel et al. (Reference Vömel, Evans and Tully2022). This stratospheric moist plume gradually ascended to high Southern Hemisphere latitudes and reached the edge of the Antarctic polar vortex in June–July 2022 (Manney et al. Reference Manney, Santee, Lambert, Millán, Minschwaner and Werner2023, Fleming et al. Reference Fleming, Newman, Liang and Oman2024, Zhou et al. Reference Zhou, Dhomse, Feng, Mann, Heddell and Pumphrey2024). However, strong transport barriers at the vortex edge prevented its immediate entry into the vortex core (Manney et al. Reference Manney, Santee, Lambert, Millán, Minschwaner and Werner2023). The excess moisture pervaded high Southern Hemisphere latitudes, with the breakdown of the vortex occurring in November–December 2022 (Manney et al. Reference Manney, Santee, Lambert, Millán, Minschwaner and Werner2023, Fleming et al. Reference Fleming, Newman, Liang and Oman2024, Zhou et al. Reference Zhou, Dhomse, Feng, Mann, Heddell and Pumphrey2024). By austral autumn (May) 2023, Aura Microwave Limb Sounder (MLS; Waters et al. Reference Waters, Froidevaux, Harwood, Jarnot, Pickett and Read2006) observations revealed unprecedented stratospheric H2O concentrations in the Antarctic stratosphere (Santee et al. Reference Santee, Manney, Lambert, Millán, Livesey and Pitts2024, Wohltmann et al. Reference Wohltmann, Santee, Manney and Millán2024). The presence of such high moisture levels in the polar lower stratosphere had significant implications for polar stratospheric cloud (PSC) formation. MLS data showed that increased water vapour contributed to early PSC activity, increasing heterogeneous chlorine activation in the 2023 Antarctic winter, especially in May–June (Santee et al. Reference Santee, Manney, Lambert, Millán, Livesey and Pitts2024). Although this early PSC formation led to notable dehydration via ice PSC sedimentation, the cumulative season-long, halogen-catalysed ozone loss remained comparable to that observed in previous years, with only limited additional depletion directly attributable to Hunga (Santee et al. Reference Santee, Manney, Lambert, Millán, Livesey and Pitts2024, Wohltmann et al. Reference Wohltmann, Santee, Manney and Millán2024).
Modelling studies had anticipated an expansion of the ozone hole by 10–30 Dobson units (DU) in 2023 (Fleming et al. Reference Fleming, Newman, Liang and Oman2024, Zhou et al. Reference Zhou, Dhomse, Feng, Mann, Heddell and Pumphrey2024). The ozone hole developed early in August and reached its maximum extent from late September to early October. Based on satellite ozone measurements, Kramarova et al. (2024) established that the 2023 Antarctic ozone hole ranked as the 16th largest in 44 years. Lecours et al. (Reference Lecours, Boone and Bernath2024) analysed ACE-FTS (Atmospheric Chemistry Experiment- Fourier Transform Spectrometer; Lecours et al. Reference Lecours, Bernath, Sorensen, Boone, Johnson and LaBelle2022, Reference Lecours, Bernath, Boone and Crouse2023; Lavy et al. Reference Lavy, Bernath, Lecours, English and Fromm2024) satellite observations and found an increase in the fraction of ice-mix PSCs in 2023 compared to 2022 (11% vs 7%) and a shift in sulphate aerosol properties. These findings are consistent with enhanced OH concentrations promoting SO2 oxidation, as previously discussed by Zhu et al. (Reference Zhu, Bardeen, Tilmes, Mills, Wang and Harvey2022, Reference Zhu, Portmann, Kinnison, Toon, Millán and Zhang2023) and Fleming et al. (Reference Fleming, Newman, Liang and Oman2024).
PSCs are high-altitude clouds, forming typically between 15 and 26 km above mean sea level, that develop in the polar winter stratosphere of both hemispheres (Tritscher et al. Reference Tritscher, Pitts, Poole, Alexander, Cairo and Chipperfield2021). They consist of supercooled ternary solution (STS) droplets, nitric acid trihydrate (NAT) crystals and water-ice particles. Ground-based and satellite-borne lidars have long been used to detect and classify PSCs based on their backscatter and depolarization characteristics. CALIOP (Cloud-Aerosol Lidar with Orthogonal Polarization), the lidar onboard the CALIPSO (Cloud-Aerosol Lidar and Infrared Pathfinder Satellite Observation) satellite (Winker et al. Reference Winker, Pelon, Coakley, Ackerman, Charlson and Colarco2010), provided a global record of PSCs until its decommissioning in August 2023.
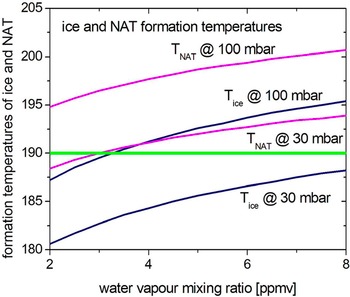
The ground-based lidar observatory at Concordia Station (Dome C; 75°06’S, 123°23’E) has been continuously monitoring PSCs since 2014. Located near the centre of the Antarctic plateau, it typically remains within the polar vortex during winter, and it is one of very few platforms providing long-term lidar PSC observations in Antarctica. CALIOP observations of PSCs near Dome C were made in June 2023, shortly before the mission terminated in early August, followed by exceptional ground-based detections of ice PSCs in September; both suggesting a clear impact of the Hunga-injected water vapour. These events occurred in the context of enhanced stratospheric humidity and colder temperatures due to radiative effects (Schoeberl et al. Reference Schoeberl, Wang, Ueyama, Taha, Jensen and Yu2022, Coy et al. Reference Coy, Newman, Wargan, Partyka, Strahan and Pawson2022). The increase in water vapour shifted the formation thresholds of PSCs to higher temperatures (Fig. 1), thus promoting PSC formation even under less extreme cooling. The relevant thresholds for PSC formation (T NAT for NAT particles and T ice for ice nucleation) depend on local temperature and the mixing ratios of H2O and HNO3 (Hanson & Mauersberger 1988, Murphy & Koop Reference Murphy and Koop2005, Romps Reference Romps2021). Typical supercooling requirements range from 2 to 4 K for both NAT (Schlager & Arnold Reference Schlager and Arnold1990, Massie et al. Reference Massie, Dye, Baumgardner, Randel, Wu and Tie1997) and ice (Carslaw et al. Reference Carslaw, Wirth, Tsias, Luo, Dornbrack and Leutbecher1998, Daerden et al. Reference Daerden, Larsen, Chabrillat, Errera, Bonjean and Fonteyn2007). The formation of PSCs removes H2O and HNO3 from the gas phase, leading to dehydration and denitrification of the lower stratosphere. Recent model simulations by Zhou et al. (Reference Zhou, Dhomse, Feng, Mann, Heddell and Pumphrey2024) and MLS observations reported by Millán et al. (Reference Millán, Read, Santee, Lambert, Manney and Neu2024) indicate that ice PSC sedimentation during the 2023 Antarctic winter was initially the primary mechanism of Hunga water vapour removal. Nevertheless, transport processes, especially stratosphere-to-troposphere exchange at mid- and high latitude, are expected to eventually redistribute the Hunga-hydrated air parcels to lower levels.
The formation temperatures for nitric acid trihydrate (NAT) and ice have been calculated following the formulas presented by Hanson & Mauersberger (1988) for NAT and by Murphy & Koop (Reference Murphy and Koop2005) and Romps (Reference Romps2021) for ice. A HNO3 mixing ratio of 5 ppbv has been assumed. Blue and magenta lines represent the formation temperatures for ice and NAT, respectively, calculated for pressure levels of 30 and 100 mbar. The green line at 190 K shows a typical stratospheric temperature during winter.

Here, we present the first ground-based lidar evidence of the effects of the Hunga eruption on PSC occurrence in Antarctica. Our analysis focuses on the exceptional ice PSCs detected over Dome C in September 2023, placing them in the context of the broader evolution of the 2023 stratosphere.
Methods
The lidar observatory at Concordia Station is one of the two Antarctic lidar stations affiliated with the Network for the Detection of Atmospheric Composition Change (NDACC); the other one is Dumont d’Urville (DDU; 66°39’S, 140°00’E). In a recent study (Tesche et al. Reference Tesche, Achtert and Pitts2021), Concordia Station was identified as one of the best locations for the observation of PSCs due to the location’s limited cirrus cloud cover and its position on the Antarctic plateau, which is inside the polar vortex for most of the winter. The ground-based lidar hardware and data processing have been described in detail previously (Snels et al. Reference Snels, Colao, Cairo, Shuli, Scoccione and De Muro2021, Di Liberto et al. Reference Di Liberto, Colao, Serva, Bracci, Cairo and Snels2024). In brief, the lidar consists of a compact laser emitting pulses at 532 nm, with a repetition rate of 10 Hz, and two receivers with diameters of 35.6 and 15.2 cm. The larger telescope is dedicated to the observation of PSCs, whereas the smaller one observes the lower troposphere. The larger receiver has several detection channels and allows the separation of signals at 532 nm with parallel and cross-polarization with respect to the laser emission. The optical signals are detected with miniaturized photomultipliers coupled to photon counting boards, with a temporal resolution of 400 ns, corresponding to a vertical lidar profile resolution of 60 m. The essential components of the lidar can be remotely controlled, including the alignment of the laser beam with respect to the receiver, the data acquisition and the setting of the laser parameters (Di Liberto et al. Reference Di Liberto, Colao, Serva, Bracci, Cairo and Snels2024). Raw data are stored locally and transmitted to a server in Italy when a measurement session is terminated. Usually, two to four measurement sessions of a duration of 32 min are held every day, possibly in coincidence with overpasses of the CALIPSO satellite while this was operational. Raw data are processed to produce vertical profiles of two optical parameters, the backscatter ratio R and the perpendicular backscatter coefficient βperp. These two parameters and their errors have been used for the detection and classification of PSCs, following an algorithm (e.g. see Snels et al. Reference Snels, Colao, Cairo, Shuli, Scoccione and De Muro2021) similar to the CALIOP version 2 detection and composition classification algorithm (e.g. see Pitts et al. Reference Pitts, Poole and Gonzalez2018).
Ancillary data are taken from the MLS instrument on the Aura satellite (Waters et al. Reference Waters, Froidevaux, Harwood, Jarnot, Pickett and Read2006) and MERRA-2 (Modern-Era Retrospective analysis for Research and Applications; Gelaro et al. Reference Gelaro, McCarty, Suarez, Todling, Molod and Takacs2017). The closest data point on a longitude-latitude grid to Concordia Station was considered representative of the atmospheric conditions around Concordia Station. The HNO3 and H2O mixing ratios were obtained from MLS data (version v04), whereas daily temperatures were obtained by averaging the eight temperatures per day provided by MERRA-2.
Results and discussion
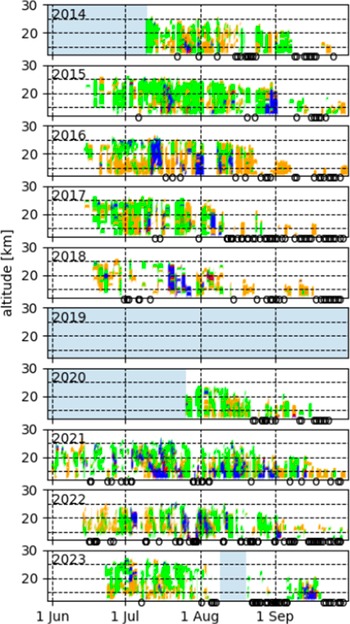
PSCs have been observed at Concordia Station during the Southern Hemisphere polar winter (June–September) every year since 2014, except for 2019, when multiple instrument failures occurred. Figure 2 shows the observed PSCs from 2014 up to 2018 and from 2020 to 2023 at Concordia Station. The most abundant PSC compositions observed are NAT (green) and STS (orange), with water-ice (dark blue) observed mainly in July and August. An exception occurred in September 2023, when the strong presence of water-ice PSCs was recorded, which is remarkable since this PSC type has rarely been observed at Concordia Station during this part of the season in previous years (2014–2022). We also considered lidar observations of PSCs at DDU. However, the coastal (sea-level) location of DDU is less favourable for the observation of PSCs than that of Concordia Station on the Antarctic plateau, which is inside the vortex and relatively free of cirrus clouds for most of the season. Consequently, the frequency of PSC observations at DDU is generally much lower (by a factor of ~10) than that at Concordia Station, and ice PSCs were not observed either in 2023 or in previous years during the month of September.
Nine years of ground-based polar stratospheric cloud (PSC) observations at Concordia Station. The different PSC classes are indicated with the following colours: orange = supercooled ternary solution; green = nitric acid trihydrate mixtures; red = enhanced nitric acid trihydrate mixtures; dark blue = ice. The small circles at the bottom of each panel indicate that measurements were taken but no PSCs were observed. It is possible for a given day to be characterized by both open circles and coloured squares in cases when multiple measurement sessions that yielded different PSC detection outcomes at different times were performed. Unshaded areas with no circles represent times when the ground-based lidar was deliberately non-operational; for example, measurements in a given year typically do not commence until mid-June. Shaded (light blue) areas indicate periods of instrument failures that precluded data collection.

As reported by Manney et al. (Reference Manney, Santee, Lambert, Millán, Minschwaner and Werner2023), the water vapour ejected by the Hunga eruption did not penetrate the 2022 Antarctic polar vortex, but subsequent measurements showed increased water vapour concentrations at altitudes of 20–28 km in the early winter of 2023 (Santee et al. Reference Santee, Manney, Lambert, Millán, Livesey and Pitts2024, Wohltmann et al. Reference Wohltmann, Santee, Manney and Millán2024). The more abundant water vapour and the colder stratospheric temperatures with respect to previous years provided optimal conditions for enhanced PSC formation. Santee et al. (Reference Santee, Manney, Lambert, Millán, Livesey and Pitts2024) used trace gas measurements from MLS and PSC observations from CALIOP to investigate how the polar chemistry and ozone depletion in 2023 were affected by the increased water vapour and accompanying anomalies in stratospheric temperatures and circulation caused by the Hunga eruption (Coy et al. Reference Coy, Newman, Wargan, Partyka, Strahan and Pawson2022, Schoeberl et al. Reference Schoeberl, Wang, Ueyama, Taha, Jensen and Yu2022).
We have used the Concordia Station lidar observations to further investigate the impact of Hunga on PSC formation during the 2023 Antarctic winter. The lidar at Concordia Station made daily observations from 22 June until 31 October 2023, except for 8–21 August, when observations were not performed due to instrument issues. During the months of July and August, PSCs are frequently observed, although substantial interannual variability is evident (see Fig. 2). These variations are partly due to thick cirrus clouds, bad weather conditions and instrument failures. This makes it difficult to make a comparison between different years or to determine anomalies with respect to a baseline. On the other hand, the frequency of PSC observations in September is much lower, and most PSCs observed are STSs or NATs. This makes the observation of ice PSCs in 2023 clearly stand out with respect to the previous 10 years. As shown in Fig. 2, PSCs were observed during the first half of September 2023 at up to 22 km in altitude. In addition, ice PSCs were observed for 5–6 days in September, which was unprecedented during the last 10 years.
It would be interesting to look for anomalous PSC occurrences in May and June, but, unfortunately, the Concordia Station lidar was not active in May and during a large part of June. To investigate this early-season period, we examine CALIOP observations that have a footprint close to Concordia Station’s location (Fig. 3). For each day, we only include the CALIOP profile closest to Concordia Station, which on average is 150 km away, with the largest separation being 300 km. It has been shown previously (Snels et al. Reference Snels, Colao, Cairo, Shuli, Scoccione and De Muro2021, Di Liberto et al. Reference Di Liberto, Colao, Serva, Bracci, Cairo and Snels2024) that there is good agreement in terms of PSC detection and classification between the ground-based observations and quasi-coincident CALIOP measurements obtained when CALIPSO overpasses fall within a few hundred kilometres of Concordia Station. Perfect agreement cannot be expected, since even if PSCs extend over a large area, the ground-based and space-borne lidars rarely sample exactly the same airmasses.
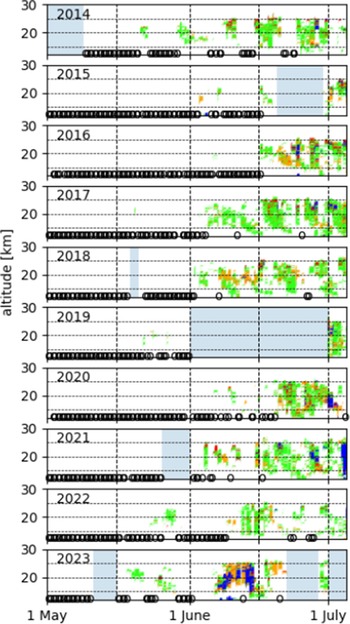
The polar stratospheric clouds (PSCs) observed by CALIOP (Cloud Aerosol Lidar with Orthogonal Polarization) within 300 km of Concordia Station from 2014 to 2023 for the months of May and June. The different PSC classes are indicated with the following colours: orange = supercooled ternary solution; green = nitric acid trihydrate mixtures; red = enhanced nitric acid trihydrate mixtures; dark blue = ice. The small circles at the bottom of each panel indicate that measurements were taken but no PSCs were observed. Shaded (light blue) areas indicate periods when CALIOP was not operational.

During the early 2023 winter, CALIOP observed NAT PSCs near Concordia Station beginning in May, with ice PSCs appearing in the first half of June. It should be noted that the ground-based lidar started observations on 22 June 2023.
During the last 10 years, mostly NAT PSCs have been observed by CALIOP in June in proximity to Concordia Station, and ice PSCs have been virtually absent during the first half of June (Fig. 3). On the other hand, in 2023, during the first half of June, ice PSCs were present for ~1 week, which is in strong contrast with the previous 10 years. The occurrence of PSCs in May at Concordia Station is also more pronounced compared with other years.
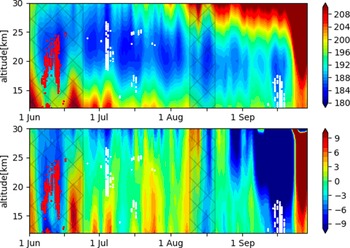
To illustrate the importance of thermal conditions for PSC occurrence, Fig. 4 reports MERRA-2 temperatures between 12 and 30 km over Concordia Station for 2023, showing values below ~190 K until 20 September. A marked negative temperature anomaly in September (relative to the 2014–2022 average) and a weaker anomaly in June are evident, whereas temperatures in the rest of the winter lie within interannual variability, with a small negative anomaly in the middle of August and some small positive anomalies during July and August.
Upper panel: temperatures in Kelvin at Concordia Station from MERRA-2 (Modern-Era Retrospective analysis for Research and Applications) for the period 1 June until the end of September, from 12 to 30 km. Lower panel: temperature anomalies in Kelvin at Concordia Station from MERRA-2 for the period 1 June until the end of September, from 12 to 30 km. The temperature anomalies were obtained from the difference between the 2023 values with respect to the 2014–2022 average values. Both panels: the red and white circles indicate where ice polar stratospheric clouds were observed by CALIOP (Cloud Aerosol Lidar with Orthogonal Polarization) and ground-based lidar, respectively. The hatched areas indicate periods when ground-based lidar data are unavailable due to instrumental issues.

These cold conditions are consistent with radiative effects associated with the excess stratospheric H2O injected by the Hunga eruption (Coy et al. Reference Coy, Newman, Wargan, Partyka, Strahan and Pawson2022, Schoeberl et al. Reference Schoeberl, Wang, Ueyama, Taha, Jensen and Yu2022, Vömel et al. Reference Vömel, Evans and Tully2022, Fleming et al. Reference Fleming, Newman, Liang and Oman2024). Ice PSCs were observed by the ground-based lidar in the first half of July and from 14 to 18 September, and by CALIOP in the first half of June, matching the timing of the two temperature anomalies.
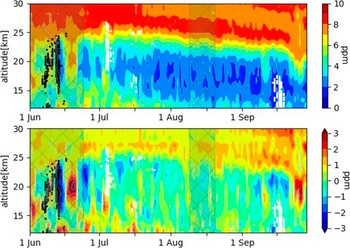
The relation between water vapour and the occurrence of ice PSCs can be studied by considering water vapour mixing ratios in 2023 and anomalies with respect to the previous years (2014–2022; see Fig. 5). Santee et al. (Reference Santee, Manney, Lambert, Millán, Livesey and Pitts2024) reported that vortex-averaged H2O and HNO3 as observed by MLS show strong gas-phase depletion, starting between mid-May and early June. By comparing PSC measurements from CALIOP and H2O and HNO3 mixing ratios observed by MLS, several previous studies (e.g. Lambert et al. Reference Lambert, Santee, Wu and Chae2012, Reference Lambert, Santee and Livesey2016) have demonstrated that the depletion of gas-phase H2O and HNO3 can be attributed to PSC formation under favourable meteorological conditions. Santee et al. (Reference Santee, Manney, Lambert, Millán, Livesey and Pitts2024 and references therein) reported that negative anomalies persisting even at temperatures above the PSC formation threshold indicate locally irreversible removal of H2O (dehydration) and HNO3 (denitrification) through the sedimentation of PSC particles. When these particles eventually evaporate, they release water and nitric acid, leading to the hydration and nitrification of the lower atmosphere. Millán et al. (Reference Millán, Read, Santee, Lambert, Manney and Neu2024) and Zhou et al. (Reference Zhou, Dhomse, Feng, Mann, Heddell and Pumphrey2024) reported that dehydration by Antarctic PSCs was the primary removal process for the excess water vapour introduced by Hunga through the end of 2024. Whereas Santee et al. (Reference Santee, Manney, Lambert, Millán, Livesey and Pitts2024) described vortex-average conditions (see fig. 1b in Santee et al. Reference Santee, Manney, Lambert, Millán, Livesey and Pitts2024), we report a similar behaviour around Concordia Station. Figure 5 shows water vapour mixing ratios in parts per million as observed by MLS at Concordia Station in 2023 and water vapour anomalies in 2023 with respect to the average values over the 2014–2022 period.
Upper panel: water vapour mixing ratios in parts per million (ppm) as observed by Aura Microwave Limb Sounder (MLS) at Concordia Station in 2023. Lower panel: water vapour anomalies in ppm in 2023 with respect to the average values over the 2014–2022 period. The water vapour mixing ratios (ppm) have been taken from MLS and correspond with the closest point on the latitude-longitude grid with respect to Concordia Station. The black and white circles represent the ice polar stratospheric clouds as observed by CALIOP (Cloud Aerosol Lidar with Orthogonal Polarization) and ground-based lidar, respectively. The hatched areas correspond with periods of instrumental issues of the ground-based lidar, resulting in the absence of data.

The evolution of water vapour mixing ratios at Concordia Station shows pronounced negative anomalies (several ppm) at ~20 km during both cold episodes, but their interpretation differs. In June, ice PSCs span the full altitude range of the low-H2O layer (~16–23 km), indicating that the decrease in H2O primarily reflects temporary condensation into existing PSCs rather than irreversible dehydration. The subsequent warming and recovery of H2O mixing ratios at those altitudes supports this view. In September, ice PSCs are mainly detected below ~17–18 km, whereas the negative H2O anomaly extends higher, up to ~22–23 km. Thus, at lower altitudes the water vapour decrease probably results from condensation in active PSCs, whereas at higher altitudes, where no ice is detected, the sustained H2O deficit is consistent with residual dehydration due to prior sedimentation of ice formed earlier in the season (Millán et al. Reference Millán, Read, Santee, Lambert, Manney and Neu2024, Santee et al. Reference Santee, Manney, Lambert, Millán, Livesey and Pitts2024, Zhou et al. Reference Zhou, Dhomse, Feng, Mann, Heddell and Pumphrey2024). Weak negative H2O anomalies persist through mid-September below 20 km, where no PSCs are detected, whereas after 20 September a strong downward shift of moist air is observed. Different processes might contribute here, including early vortex weakening and limited mid-latitude mixing.
Conclusion
Unlike typical volcanic eruptions that mainly inject sulphur dioxide into the stratosphere, Hunga’s submarine eruption in 2022 released vast amounts of water vapour. This additional water vapour was eventually transported to the Antarctic vortex, contributing to early and prolonged PSC formation throughout the 2023 polar winter (Santee et al. Reference Santee, Manney, Lambert, Millán, Livesey and Pitts2024).
Ground-based lidar observations at Concordia Station, complemented by satellite-based lidar data, revealed that, although it is difficult to quantify the anomalous PSC activity in July and August, exceptional occurrences of PSCs were detected in May, June and September. Notably, there was a strong presence of ice PSCs, an unprecedented phenomenon considering previous observations for these parts of the season. A strong correlation between the local temperature at Concordia Station and PSC formation was observed, particularly for ice PSCs, in months when they were previously practically absent. Because negative water vapour anomalies in June and September were observed to be coincident with ice PSC detections, the low water vapour mixing ratios were probably due mainly to temporary sequestration in existing PSCs, although some degree of dehydration arising from permanent removal by sedimentation of ice PSCs cannot be ruled out.
Manney et al. (Reference Manney, Santee, Lambert, Millán, Minschwaner and Werner2023) noted that the observed water vapour anomalies in the Southern Hemisphere polar region are expected to persist for several years (see also Khaykin et al. Reference Khaykin, Podglajen, Ploeger, Grooss, Tence and Bekki2022, Millán et al. Reference Millán, Santee, Lambert, Livesey, Werner and Schwartz2022, Reference Millán, Read, Santee, Lambert, Manney and Neu2024). This suggests that anomalous PSC occurrences at Concordia Station may continue in the coming years. However, due to the saturation of heterogeneous processes (Santee et al. Reference Santee, Manney, Lambert, Millán, Livesey and Pitts2024), the overall resulting impact on the chemistry (as distinct from PSC formation) in the Antarctic vortex was modest in 2023, and it is very likely to diminish in time.
Acknowledgements
Logistical and winter-time technical assistance was provided by the Piano Nazionale della Ricerca in Antartide (PNRA). The authors thank Igor Petenko, Giampietro Casasanta, Simonetta Montaguti, Alfonso Ferrone, Filippo Cali Quaglia, Meganne Christian, Alberto Salvati, Rodolfo Canestrari, Angelo Galeandro and Davide Carlucci for performing the ground-based lidar measurements at Dome C during the winter and Maurizio Viterbini and Ilir Shuli for their valuable technical expertise. Helpful comments by two reviewers, and in particular the valuable suggestions provided by Dr Michelle Santee, are gratefully acknowledged.
Financial support
The authors acknowledge the financial support of PNRA for the Concordia Station lidar observatory in the framework of the projects 2009/B.08, OSS-12 and LIDAROBS and the support of the ISSI-PSC initiative project.
Competing interests
The authors declare none.
Author contributions
FS and FCa conducted the background research on the Hunga eruption and its consequences. LdL, FCo and AB conducted most of the fieldwork. MS led the collection and processing of the ground-based lidar data. MCP led the collection and processing of the CALIOP data. All authors contributed to the analysis and writing and agreed upon the manuscript’s final contents.
Data availability
All datasets supporting this research are publicly available. Ground-based lidar measurements at the Dome C station are distributed through the NDACC infrastructure (https://www-air.larc.nasa.gov/missions/ndacc/data.html). The MERRA-2 meteorological data can be accessed from https://disc.gsfc.nasa.gov/datasets/M2I3NPASM_5.12.4/summary. MLS L3 data are available at https://disc.gsfc.nasa.gov/datasets/ML3DBH2O_004/summary, https://disc.gsfc.nasa.gov/datasets/ML3DBT_004/summary and https://disc.gsfc.nasa.gov/datasets/ML3DBHNO3_004/summary.

 Open access