


1. Introduction
Extreme weather events impose significant costs on households – disrupting daily life, damaging property, and reducing access to essential goods and services (Chen and McCarl, Reference Chen and McCarl2009; Coronese et al., Reference Coronese, Lamperti, Keller, Chiaromonte and Roventini2019; Newman and Noy, Reference Newman and Noy2023). In the United States, hurricanes are among the most destructive and life-threatening natural disasters often producing widespread flooding, wind damage, and extended power outages (NOAA, 2024). These storms frequently displace households, strain emergency services, and cause financial hardship. Understanding how households respond to such events – and whether previous experiences shape future preparedness – is critical for designing effective adaptation and disaster management policies (Adger et al., Reference Adger, Arnell and Tompkins2005; Cinner et al., Reference Cinner, Adger, Allison, Barnes, Brown, Cohen, Gelcich, Hicks, Hughes, Lau, Marshall and Morrison2018; Petzold et al., Reference Petzold, Hawxwell, Jantke, Gonçalves Gresse, Mirbach, Ajibade, Bhadwal, Bowen, Fischer, Joe, Kirchhoff, Mach, Reckien, Segnon, Singh, Ulibarri, Campbell, Cremin, Färber, Hegde, Jeong, Nunbogu, Pradhan, Schröder, Shah, Reese, Sultana, Tello, Xu and Garschagen2023).
While prior research has shown that households often increase purchases of essential supplies in anticipation of storms, relatively few studies examine how past exposure affects responsiveness to subsequent events (Beatty et al., Reference Beatty, Shimshack and Volpe2019; Li and Mostafavi, Reference Li and Mostafavi2022; Pan et al., Reference Pan, Dresner, Mantin and Zhang2020). This study addresses that gap by leveraging year-over-year variation in hurricane exposure across counties in Florida, Georgia, and South Carolina. We merge storm data from the 2016 and 2017 hurricane seasons – specifically Hurricanes Hermine, Matthew, and Irma – with weekly household-level purchase records to test whether prior hurricane exposure influences stockpiling behavior. We define adaptation as the process by which households adjust their behavior to reduce harm from extreme weather – for instance, by preparing in advance and reducing last-minute purchases when new warnings are issued.
Previous research on adaptation yields mixed results. Survey evidence suggests that individuals with prior hurricane exposure, especially in Florida and Texas, perceive future risks as higher and report increased confidence in their ability to prepare (Wong-Parodi and Garfin, Reference Wong-Parodi and Garfin2022). However, a meta-analysis of 44 studies, including 14 on hurricanes, finds that while experience is positively associated with adaptive behavior, the effect sizes are small (van Valkengoed and Steg, Reference van Valkengoed and Steg2019). Moreover, it suggests that the intensity of experience – measured continuously – yields no stronger adaptive effects than simply experiencing a storm. These results raise questions about whether past warnings or storm severity meaningfully shape future household behavior.
We contribute to this literature by analyzing purchasing responses to Hurricane Irma in 2017 focusing on bottled water as a key preparedness item. Using detailed path and warning data from NOAA, we classify counties based on exposure to Irma and prior exposure to Hermine or Matthew in 2016. This classification yields four mutually exclusive county-level exposure groups. We also distinguish between warning-only exposure and landfall exposure to examine whether the intensity of prior experience matters. We then merge these county-level indicators with household purchase records from NielsenIQ HomeScan creating a weekly household panel that allows us to estimate triple-difference (DDD) event study models of adaptation behavior.
Our empirical strategy includes household and week fixed effects enabling us to control for time-invariant household characteristics and macro-level purchase trends. Identification relies on quasi-random variation in storm exposure across counties and weeks providing a credible basis for estimating how prior hurricane experiences affect household preparedness.
Using a difference-in-differences (DD) model, we find clear evidence that households respond to storm warnings by significantly increasing bottled water purchases during Irma. Purchase probability rises from a baseline of 12.1% to 17.3%, and both quantity and expenditure roughly double during the week of the storm. However, when we incorporate prior warning exposure extending the model to a DDD framework, we find no meaningful differences in behavior between previously exposed and unexposed households. This suggests that prior warnings alone do not induce adaptive behavior – households continue to stockpile at the same rate regardless of whether they were warned about earlier storms.
By contrast, the landfall-based model reveals evidence of behavioral change – though not necessarily in the direction of improved preparedness. Households that previously experienced a landfall event were more likely to engage in stockpiling during Irma, suggesting that they had not preemptively prepared and instead relied on late-stage purchasing. These findings imply that, if anything, stronger past experiences may heighten perceived risk without necessarily translating into earlier or more measured preparation. All of our results hold even after subgroup analyses by income and education and across a range of robustness checks, including placebo models and pre-trend assessments.
While our findings offer important insights, it is important to highlight several limitations of the work. First, we focus exclusively on demand-side behavior without accounting for supply constraints like retail stockouts or purchasing limits. For example, retailers may have imposed limits on bulk purchases or experienced stock shortages during hurricane warnings, which could influence consumer stockpiling behavior. Such constraints may impact our estimates of bottled water purchases during Hurricane Irma and potentially obscure evidence of full adaptation (Noda and Teramoto, Reference Noda and Teramoto2024; Wahdat and Lusk, Reference Wahdat and Lusk2025).
Second, our analysis is confined to a single year and focuses on households in just three US states that experienced storm exposure only one year prior. While this narrow spatial and temporal scope limits the generalizability of our findings, we believe the trade-off is justified by the strength of the identification strategy. To credibly test our adaptation hypothesis, we require a setting where storms occur close enough in time for past experiences to remain salient – a condition met in this context and supported by prior research showing that behavioral responses to extreme events diminish over time. Moreover, our use of NielsenIQ panel data is best suited to shorter time horizons, as it allows us to track geographically stable households and minimize complications from migration.Footnote 1 Nonetheless, we recognize that previous hurricanes (pre-2016) could make the more recent warnings in 2016 an imperfect proxy of experience. We suggest that future research explore longer timeframes, track the same households over time, and expand the geographic scope to include a wider array of extreme weather events in order to better assess the durability and generalizability of adaptive behaviors.
Third, our analysis focuses exclusively on bottled water. While bottled water is one of the most frequently purchased items in advance of extreme weather events and serves as a strong proxy for household preparedness, it is not the only good that households stockpile. Many also purchase non-perishable foods, batteries, first-aid supplies, medications, hygiene products, and other beverages. Omitting these items could affect our results if treatment assignment – living in a county affected by Irma, Hermine, or Matthew – is correlated with substitution patterns across goods. However, our models consistently satisfy the parallel trends assumption, suggesting that relative bottled water purchasing behavior was stable across treatment groups over time, and that our estimates are unlikely to be driven by differential substitution.
Fourth, our analysis considers household exposure to only three hurricanes. Expanding the sample to include additional storms would make it possible to observe multiple false alerts that households may have experienced, which could in turn reduce their trust in and responsiveness to genuine warnings. Future research could investigate this “cry-wolf” effect as a potential driver of under-preparedness for hurricanes.
And finally, although the NielsenIQ data are essential for studying consumer behavior at scale, they may not fully represent the demographic composition of the populations in each state. This limitation may affect the external validity of our findings. While we cannot address this directly, we include a comparison later in the paper between NielsenIQ households and those in the US Census data to help readers assess how well our sample reflects the broader population in each state.
Our paper contributes to the literature in several ways. First, we expand experience-based studies in the literature on household consumption. The study by Malmendier and Shen (Reference Malmendier and Shen2024) uses NielsenIQ Homescan consumer data and documents a lower total consumption for consumers experiencing negative employment shocks versus a higher consumption for those experiencing positive employment shocks. In another study, Malmendier (Reference Malmendier2021) shows that past experiences influence not only consumption expenditures but also beliefs about inflation and economic choices such as mortgage borrowing, home ownership, and investment, and the study by Lee and Zheng (Reference Lee and Zheng2025) advances the effects of temperature shocks on household retail consumption. The study by Severen and Van Benthem (Reference Severen and Van Benthem2022) also reports long-lasting effects of experiencing oil-price shocks in the 1970s during the initial driving years on the reduced preference to drive 20 years later. We depart from these experience-based studies by focusing on the effects of hurricane warning shocks on household consumption of bottled water. Second, we expand the literature on the effects of learning from past experiences of extreme weather events on adaptation. This literature has studied the effects of floods (Brody et al., Reference Brody, Lee and Highfield2017), wildfires (Gan et al., Reference Gan, Jarrett and Gaither2014, Reference Gan, Jarrett and Gaither2015), and hurricanes (Wong-Parodi and Garfin, Reference Wong-Parodi and Garfin2022; Zhai et al., Reference Zhai, Reilly and Guikema2023) without providing empirical evidence that the learning from previous warning experiences would be updated through the intensity of these previous experiences in the adaptation behavior.
The remainder of the paper proceeds as follows. In Section 2, we present our data, study region, and models and identification strategy. We then present our main results and a brief series of robustness checks in Section 3. Finally, in Section 4, we analyze the heterogeneity of our results based on variation in treatment definitions and household characteristics. Section 5 concludes.
2. Data and methods
We begin this section by detailing our data and how we use them to create our estimation sample, the geographic and temporal scope of the study, and summary figures and tables. We then present our core empirical framework and outline the identification strategy used to estimate the adaptation effects of hurricane exposure.
2.1. Data
The goal of this study is to test the hypothesis that households exposed to previous hurricanes learn from those experiences and, as a result, exhibit a diminished response to future exposures. One of the most immediate behavioral reactions to an impending storm is the stockpiling of essential supplies – food, water, and medicines – in anticipation of potential shortages or access disruptions. To evaluate this adaptive behavior, we focus specifically on bottled water purchases, a universally necessary item that households are likely to prioritize in preparation for a hurricane.
Although hurricanes occur in many regions, it is relatively rare to observe multiple storms occurring in quick succession over a broad geographic area with sufficient spatial variation to support a credible empirical strategy. One exception is the Southeastern United States, specifically Florida, Georgia, and South Carolina, during the 2016 and 2017 hurricane seasons. Over this period, three major hurricanes – Hermine and Matthew in 2016, followed by Irma in 2017 – affected these states. While the storms prompted widespread warnings, their paths varied enough across counties to generate meaningful variation in exposure. This spatial and temporal variation allows us to identify the effects of repeated hurricane warnings on household behavior. Our analysis focuses on the impact of Hurricane Irma (August 30–September 12) and the associated warnings on bottled water purchases in 2017 using exposure to Hurricanes Hermine (August 28–September 3) and Matthew (September 28–October 9) in 2016 to proxy for prior experience. Specifically, we classify households based on whether their county received a hurricane warning in 2016 allowing us to test whether prior exposure moderated their stockpiling behavior in response to Irma.Footnote 2
We construct our county-level hurricane warning indicators by integrating information from four main sources. First, we use tropical cyclone reports from NOAA for Hurricanes Hermine, Matthew, and Irma (NOAA, 2017b,c, 2021). Second, we draw from NOAA’s National Centers for Environmental Information (NCEI) monthly storm data publications for August, September, and October of 2016 and 2017 (NCEI, 2016a,b,c, 2017a,b). Third, we utilize archived data from NOAA’s WayBack Machine, which visually identifies counties issued hurricane warnings on specific dates during the hurricane season (NOAA, 2022). Lastly, we conduct targeted Google searches – restricted to the relevant hurricane seasons – using keyword combinations such as “hurricane name + warning + disaster + declaration + emergency” and “shoreline county name (not yet marked as warned) + hurricane name + warning.” Shoreline county names are sourced from FEMA’s official coastal county list (NOAA, 2017a).
Our data on bottled water purchases comes from the 2017 NielsenIQ scanner dataset. We restrict the sample to households located in Florida, Georgia, and South Carolina assigning each household to a county based on its FIPS code. The final sample includes 5,572 households. From these data, we extract weekly bottled water purchase records and expand the data resulting in 289,744 household-week observations. We aggregate across bottled water UPCs to calculate household-week totals for the volume of water purchased (in ounces) and total expenditure (in dollars). These measures are used to estimate treatment effects on the intensive margin. To examine extensive-margin outcomes, we construct a binary indicator for whether a household purchased any bottled water in a given week.
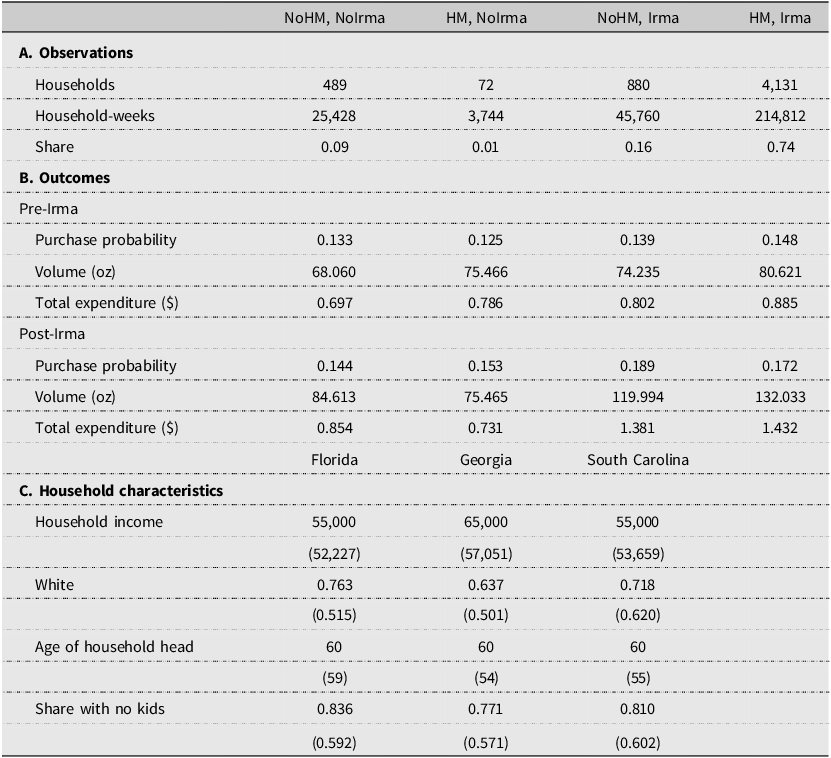
Before presenting our empirical model and main results, we provide baseline summary statistics (Table 1) and descriptive plots (Figure 1). Panel A. of Table 1 shows counts for households and household-weeks as well as shares of observations for each of our four treatment groups; the spatial distribution of the household-weeks across counties is shown in Panel (a) of Figure S1 in Appendix A. Although we have good coverage across each group, it is clear from these results that the largest portion of households live in counties affected by Irma and Hermine or Matthew with 74% of the people living in one of these counties. In addition, around 62% of the households in the sample are in Florida, 25% are in Georgia, and the rest are in South Carolina. Although we observe households warned and not warned about the hurricanes in all three states, Panel (b) of Figure S1 in Appendix A shows that the households warned about hurricanes in both years are mainly located in Florida.
Summary statistics

Notes: This table provides summary statistics based on our estimation sample. Panel A. provides counts of households and household-weeks and shares of observations broken out into the four treatment groups. Panel B. shows mean values for our three outcome variables – purchase probability and total ounces and dollars spent on water – for each treatment group and each treatment period, that is, pre- and post-Irma. Panel C. shows summary statistics for select household variables associated with the sample broken out by state. The top numbers are values based on the HomeScan data. The values in parentheses are statistics based on Census data from each state. Household Income is the median household income in $\$2017$
; No Kids is the share of households that do not have any kids; and Age of Household Head is the median age of the household head.
$\$2017$
; No Kids is the share of households that do not have any kids; and Age of Household Head is the median age of the household head.
Weekly purchase activity. This figure shows event study plots for purchasing (a) and total quantity of water purchased (b) and total expenditure (c). Each sub-figure has a different plot for each treatment group. The vertical dashed blue line defines the week of Irma’s arrival.

In Panel B, we present the means for each of the three outcome variables in our model – the weekly probability of purchasing bottled water, the total ounces purchased, and total dollars spent – disaggregated by treatment group and by whether the purchase occurred before or after Hurricane Irma’s arrival. These summary statistics show a clear increase in all outcomes following Irma, both in areas that experienced the storm and those that did not. However, the magnitude of these increases appears relatively consistent across locations that did and did not experience a previous storm. This pattern is further illustrated in Figure 1, which shows event study plots for each treatment group across the three outcome variables. Solid lines represent counties affected by Irma, while dashed lines correspond to counties that were not impacted. As expected, we observe spikes in purchasing behavior – including higher quantities bought and greater spending – in areas affected by Irma. Yet, these spikes appear similar whether or not the area had prior hurricane exposure. A comparable pattern is observed in areas not directly affected by Irma. While these findings do not constitute a formal test of our hypothesis, they provide preliminary evidence suggesting limited adaptation among households based on prior exposure – an issue we investigate more rigorously in the next section.
Finally, Panel C. of Table 1 reports summary statistics for key household characteristics. Each variable is presented, broken out by state, with the top row showing values from the NielsenIQ sample and the second row (in parentheses) displaying values taken from US Census data. A comparison of the NielsenIQ and Census data in Table 1 shows that NielsenIQ median household incomes are somewhat higher than state averages; respondents are whiter; they tend to be older; and households with children are noticeably absent. While the NielsenIQ dataset offers substantial advantages for analyzing consumer behavior at scale, we do note these differences.
2.2. Methods
To establish our main results, we estimate two empirical models. We begin by analyzing household purchasing behavior in response to Irma warnings regardless of whether a household has previously received a warning. This approach employs a standard event study DD specification as follows:
 $$ Y_{iw} = \lambda _{i} + \gamma _{w} + \sum _{k=-9, k \neq -1}^{5} \beta ^{DD}_{k}Irma_{i}Week_k + \epsilon _{iw}, $$
where the outcome variable Y iw represents a purchase outcome (the probability of purchasing, the quantity bought, or amount spent) for household i in week w. The term Irma i is an indicator of whether the household resides in a county warned about Hurricane Irma, and Week k captures the event time, where k indexes weeks relative to the week before the arrival of Irma (the omitted reference period is k = − 1, the week before the storm). The model includes household fixed effects (λ i ) to control for time-invariant observable and unobservable household characteristics, and week fixed effects (γ w ) to account for broader temporal trends in purchasing behavior. The coefficients of interest, β k DD , are the marginal effects of residing in an Irma-affected county in week k relative to both the omitted week and households in unaffected counties. The standard errors are clustered at the county level as this is the level treatment.
We estimate the DD model (equation (1)) to establish a baseline – that households respond to Irma’s warning. Our primary research question, however, focuses on whether this response varies depending on prior exposure, that is, whether households that received warnings about Hurricanes Hermine or Matthew (HM) in the previous year (during the 2016 hurricane season) exhibit a reduced need to respond to Irma in 2017 and thus indicate adaptive behavior. We test this hypothesis using the following event study DDD model:
 $$\eqalign{ {Y_{iw}} = & \ {\lambda _i} + {\gamma _w} + \sum\limits_{k = - 9,k \ne - 1}^5 {\beta _k^{DDD}} Irm{a_i}H{M_i}Wee{k_k} \cr & + \sum\limits_{k = - 9,k \ne - 1}^5 {\beta _k^1} Irm{a_i}Wee{k_k} + \sum\limits_{k = - 9,k \ne - 1}^5 {\beta _k^2} H{M_i}Wee{k_k} + { \in _{iw}}. \cr} $$
This model expands the DD specification in equation (1) with the terms associated with Irma treatment (Irma i ) broken into groups with and without previous exposure, HM i . The coefficients of interest, β k DDD , represents the marginal effects of living in an Irma-effected county in week k with previous exposure relative to counties without previous exposure, those without exposure to Irma or HM, and relative to the left-out period, k = − 1. Again, the model includes household and week fixed effects to control household-specific purchasing factors and broader temporal trends in purchasing behavior, and the standard errors are clustered at the county level.
In model 2, the expectation is that if households have adapted based on past experiences, then the coefficients for β k DDD for k ∈ [1, 5] should be negative, especially for the first week or two after Hurricane Irma.Footnote 3 The intuition is that the DDD model is really just the difference between two Irma versions of an event study DD model in equation (1): one for households with HM i = 1 and the other for households with HM i = 0. If households with HM i = 1 have stockpiled water at the beginning of the 2017 hurricane season or in the weeks before Irma based on their 2016 experience, then they would not need to shop at the time of the storm’s arrival relative to the HM i = 0 households and thus the β k DDD s, post storm, would be below one for those households for all outcome variables.
Alternatively, if β DDD k = 0 for all k, this would indicate no differential response among households previously warned about Hurricanes Hermine or Matthew, and thus no evidence of adaptation. However, this result must be interpreted with caution, as a zero estimate for β DDD k could arise for one of three distinct reasons: (1) all β DD k estimates are zero implying that no households responded to the Irma warning; (2) the β DD k estimates are positive and similar across groups post-Irma suggesting that both HM and non-HM households responded to Irma, but in the same way; or (3) the β DD k estimates are negative and similar post-Irma indicating that both groups responded negatively and uniformly. As we demonstrate using results from equation (1), all households exhibit a positive response to Irma’s arrival. Therefore, the relevant hypothesis test is whether β DDD k < 0 for k ∈ [1, 5], which would provide evidence of adaptation through a reduced response among previously warned households.
In addition to estimating the effect of hurricane warnings, we also examine how the intensity of exposure – specifically whether a storm made landfall – affects household behavior. To do this, we reestimate equation (2), replacing the HM i indicator with a new variable, HMLandFall i , which captures prior exposure based on whether the household both received a warning and experienced hurricane landfall. This allows us to assess whether more direct and severe exposure influences the degree of behavioral adaptation.
One potential concern with our models is the possibility that household-specific factors influence both where households choose to live and how they respond to storm-related shocks, for example, if households sort into locations based on differences in risk aversion, which could affect both treatment and outcomes. This type of endogeneity may be more problematic in longer panel datasets where households relocate or experience changes in underlying characteristics. However, in our case, we analyze household purchasing behavior over a two-year period during which household residency remains fixed. As a result, any time-invariant household-specific unobservables – such as initial location preferences or baseline purchasing tendencies – should be accounted for through the addition of household fixed effects. Moreover, the key identifying assumption in all of our DD models is that the parallel trends assumption holds. In our case, this would imply that household differences in risk aversion that impact levels, but not trends in purchasing would not impact our results. We address these issues further in a robustness check presented later in the paper.
3. Results and discussion
3.1. Main results
Our main findings are presented in Figure 2 with full regression results provided in Tables S1 and S2 in Appendix A. The DD results, shown on the left-hand side of the figure, indicate a significant increase in the likelihood of purchasing bottled water as well as the quantity purchased and total spent around the time of Hurricane Irma’s arrival in 2017. Specifically, the probability of purchasing bottled water rose from a baseline of 12.1% to 17.3% during the week of Irma’s landfall – an increase of 5.2 percentage points. In addition, the average volume purchased more than doubled, increasing from 61.78 ounces to 124.86 ounces, while average spending rose by 90% from $\$0.66$
to
$\$0.66$
to $\$1.26$
. This is consistent with past research indicating that households drastically increase purchases of water and other goods when a storm is imminent.
$\$1.26$
. This is consistent with past research indicating that households drastically increase purchases of water and other goods when a storm is imminent.
Results for event study DD and DDD models. This figure plots the lead and lag parameters for the DD model in equation (1) (panels (a), (c), and (e)) and the lead and lag parameters for the DDD model in equation (2) (panels (b), (d), and (f)). The dependent variables are the probability of purchasing, ounces bought, and dollars spent. All models include household and week fixed effects. Standard errors are clustered at the county level. The mean value of the outcome is the control group is shown in the lower left of the figure.

Turning to the DDD results, the right-hand sub-figures indicate that the differences in the DD estimates – when conditioned on prior hurricane warning exposure – are not statistically significant between the two groups. In particular, households that received warnings during Hurricanes Hermine or Matthew are no less likely to purchase or spend money on bottled water during Hurricane Irma than those without prior exposure. As noted earlier, if households had adapted based on previous warnings, we would expect the post-Irma coefficients β k DDD to be negative reflecting a reduced need to respond due to earlier preparation. Instead, we find no evidence of this pattern.
The preceding results test our central hypothesis – that households adapt based on prior experiences – but they do not explain why some households fail to modify their behavior, nor do they fully account for the lack of observed adaptation. While multiple explanations are possible, two widely cited behavioral tendencies offer insight: optimism, in which individuals underestimate the likelihood or severity of future risks, and inertia, where individuals persist in existing behaviors despite receiving new information. If households had meaningfully responded to hurricane warnings in the past – specifically during the 2016 season – then inertia, rather than optimism, would be the more plausible explanation for continued behavior patterns during Hurricane Irma. To explore this possibility, we estimate event study DD models using household purchasing data from the 2016 season treating Hermine and Matthew as the relevant exposures.
Estimates from the 2016 models for all three outcomes are presented in Figure S2 in the Appendix A. The results reveal a 5.9 percentage point increase in the probability of purchasing bottled water along with a doubling in both purchase volume and total expenditure. These effects closely mirror those observed in the 2017 models shown in Figure 2 suggesting that behavioral inertia likely explains the missing additional adaptation from 2016 warnings shown in our DDD models. In particular, the similarity between stockpiling behavior during the 2016 hurricane warnings and during Hurricane Irma indicates that households tend to replicate their past responses – even when those responses left them underprepared – rather than adjust their behavior based on prior experience.
3.2. Robustness checks
We also estimate a series of alternative models to assess the robustness of our main findings. One of the main assumptions of our model is that households’ 2017 responses are moderated by whether they were impacted by Hermine or Matthew in 2016. However, given that there were two storms, it is possible that households that were impacted by both did update their priors compared to those that only experienced one. Figure S3 shows results for a model where we redefine the 2016 moderator to be Hermine and Matthew. While the pattern changes a bit, we still find no evidence of adaptation in 2017 to experiences in 2016.
We also conduct a placebo-style test to examine whether our findings reflect something unique about the specific time periods associated with the 2016 and 2017 hurricanes. To do this, we use NielsenIQ panel data from 2015 and apply the same event study DD model framework assigning placebo storm dates in 2014 and 2015 based on the actual timing and treatment structure of Hurricanes Irma, Hermine, and Matthew. Results from these placebo models are presented in Figure S4 with panels (a), (c), and (e) showing estimates for 2014, and panels (b), (d), and (f) showing results for 2015. Across all outcomes, we find no evidence of behavioral changes around the placebo event dates suggesting that the effects identified in our main analysis are indeed specific to the actual hurricane events in 2016 and 2017.
Finally, to address concerns about household sorting and unobserved heterogeneity we conduct an additional robustness check. While we cannot directly test for sorting, we can evaluate whether time-invariant household characteristics impact our results – particularly by violating the parallel trends assumption that underpins our DD framework. Our baseline models include household fixed effects to account for time-constant differences that may influence both treatment assignment and purchasing behavior using within-household variation in weekly purchases during for identification. This setup assumes conditional parallel trends, that is, that after accounting for household fixed effects, treated and untreated groups follow similar purchasing trends, thus satisfying the DDD model’s identifying assumptions. Ideally, however, we would observe parallel trends even without conditioning on household characteristics, which would imply that county-level treatment assignment is effectively random and that pre-treatment trends are not confounded by unobserved household or county-level factors.
To test this, we reestimate the event study DDD model without household fixed effects including only county fixed effects, which matches the level at which treatment occurs. In this specification, the key identifying assumption is that pre-treatment trends are parallel across treatment groups, which would be reflected in the β k DDD coefficients being statistically indistinguishable from zero prior to Irma’s arrival. Results from this specification are shown in Figure S5. Across all three outcomes, the event study plots closely mirror the main results presented in Figure 2 providing strong evidence that treatment assignment is plausibly random at the household level and that pre-storm purchasing trends are not systematically different across treatment groups. This supports the validity of our identification strategy.
In summary, our event study DD results support prior findings that households increase purchases of essential supplies – such as bottled water in response to imminent disasters (Amaral et al., Reference Amaral, Chang and Burns2022; Beatty et al., Reference Beatty, Shimshack and Volpe2019; Chenarides et al., Reference Chenarides, Grebitus, Lusk and Printezis2021; Ellison et al., Reference Ellison, McFadden, Rickard and Wilson2021; Li and Mostafavi, Reference Li and Mostafavi2022; Pan et al., Reference Pan, Dresner, Mantin and Zhang2020). Our extension, testing whether household responses differ based on prior exposure, shows no evidence of adaptation: households respond to Hurricane Irma’s arrival in 2017 in similar ways regardless of whether they experienced an earlier storm warning storms.
4. Heterogeneity analysis
The previous section detailed our baseline findings and associated robustness checks. Here, we extend the model to explore additional channels through which treatment may influence household purchasing behavior.
4.1. Landfall exposure
We begin by examining whether storm intensity influences purchasing behavior. In our main analysis, prior exposure was defined based on whether a household received a warning. However, it is possible that warnings alone may not affect behavior, whereas actual storm landfalls may. To explore this, we reestimate the model in equation (2) using an alternative definition of 2016 exposure: whether a household resided in a county that experienced a landfall from either Hermine or Matthew. We estimate this model using the full sample as well as a Florida-only subsample. The Florida sample was chosen because it experienced more landfall events and offers a stronger basis for comparison between landfall and non-landfall counties; it also experienced just one landfall event in Hermine, which makes the impact of previous landfalls easier to disentangle.
Figure 3 presents the results from the landfall-based models. The left-hand panels report estimates for all three outcomes using 2016 landfall exposure to Hurricanes Hermine or Matthew as the moderating variable, while the right-hand panels display the results for the Florida-only subsample. As with earlier findings, there is no evidence that households exposed to prior landfall events reduce their need to shop or stock up during Hurricane Irma – in fact, the results suggest the opposite. Relative to Figure 2, the probability of shopping, the quantity of bottled water purchased, and total spending during the week of Irma are significantly higher in the full-sample landfall models. Under our previous definition of adaptive behavior, this result suggests that prior landfall exposure may lead to less preparedness with households needing to purchase more at the time of Irma. However, one could alternatively interpret this as a form of adaptive behavior if households, through experience, learn how much they will need but still choose to buy supplies only when the storm arrives. The Florida-only results exhibit a similar trend, though the smaller sample size limits the robustness of those findings.
Treatment moderation based on landfall exposure. This figure plots parameters estimated using equation (2) with 2016 moderation (exposure) based on hurricane landfall as opposed to hurricane warning. Panels (a), (c), and (e) are for the full data for Hermine or Matthew landfall in 2016, while panels (b), (d), and (f) are for Florida only with landfall based on Hermine. All models include household and week fixed effects. Standard errors are clustered at the county level. The mean value of the outcome is the control group is shown in the lower left of the figure.

The contrasting results between responses to storm intensity and to warnings underscore an important behavioral insight: households appear to adjust their purchasing behavior more in response to direct, high-intensity experiences – such as hurricane landfalls – than to warnings. While previous studies have suggested that both weak and strong hurricane experiences can produce similar adaptive responses (van Valkengoed and Steg, Reference van Valkengoed and Steg2019), our findings challenge that view. Specifically, our results show that learning from landfalls is more pronounced than from warnings, as evidenced by significantly increased bottled water stockpiling during Irma among households previously exposed to Hermine or Matthew landfalls.
This pattern may be explained by behavioral limitations (FEMA, 2020; Meyer and Kunreuther, Reference Meyer and Kunreuther2017). First, inertia may prevent households from altering their preparedness routines in response to warnings alone, particularly if those warnings did not result in severe consequences in the past. Second, salience may lead households to respond more strongly to vivid, high-impact experiences like landfalls, which are more memorable and emotionally charged than warnings. In this context, a landfall event may create a more lasting impression making the threat of future storms feel more immediate and real, thus prompting stronger behavioral responses. This interpretation is further supported by recent evidence showing increased beverage-related spending around Hurricane Ian in Florida (Wahdat and Lusk, Reference Wahdat and Lusk2024), suggesting that firsthand, high-intensity storm exposure is a key driver of adaptive consumer behavior.
4.2. Household characteristics
Previous research has also demonstrated that household characteristics can shape purchasing behavior in response to extreme weather events (Beatty et al., Reference Beatty, Shimshack and Volpe2019; Pan et al., Reference Pan, Dresner, Mantin and Zhang2020; Smiley et al., Reference Smiley, Noy, Wehner, Frame, Sampson and Wing2022), though this relationship is not consistently observed across all contexts (Wrenn et al., Reference Wrenn, Klaiber and Jaenicke2016). Building on this literature, we investigate whether household income and education levels influence how bottled water purchasing behavior is impacted by Hurricane Irma based on past warnings. To do so, we begin with the full sample and divide households into subgroups based on income and education. For income, we classify households as either high or low income using the median household income of $\$55,000$
in the NielsenIQ dataset. For education, we define a household as “educated” if at least one household head holds a four-year college degree or higher. We then estimate the DDD model specified in equation (2) separately for each subgroup.
$\$55,000$
in the NielsenIQ dataset. For education, we define a household as “educated” if at least one household head holds a four-year college degree or higher. We then estimate the DDD model specified in equation (2) separately for each subgroup.
Results from the household characteristics models are presented in Figure 4 (household income) and Figure 5 (education), with the left-hand panels displaying estimates for higher-income and more-educated households, and the right-hand panels for lower-income and less-educated households. Although these subgroup results are somewhat noisier than those in Figure 2 reflecting smaller sample sizes, the overall patterns remain consistent. We find no systematic differences in bottled water purchasing behavior between higher- and lower-income households or between more- and less-educated households. Additional models estimated for other characteristics, such as household age composition and presence of children, yield similarly consistent results.
Weekly purchase activity by household income. This figure shows results from our event study DDD model for all three outcomes broken out by high-income households ((a), (c), and (e)) and low-income households ((b), (d), and (f)). We define the low/high income break based on median income in the sample of $\$55,000$
in
$\$55,000$
in $\$2017$
. The mean value of the outcome is the control group is shown in the lower left of the figure.
$\$2017$
. The mean value of the outcome is the control group is shown in the lower left of the figure.

Weekly purchase activity by household education. This figure shows results from our event study DDD model for all three outcomes broken out by high-education households ((a), (c), and (e)) and low-education households ((b), (d), and (f)). We define the low/high education break based on whether the head of household has a four-year degree or higher. The mean value of the outcome is the control group is shown in the lower left of the figure.

5. Conclusion
Stockpiling essential supplies in anticipation of natural disasters is widely reported in the media and discussed in the disaster preparedness literature, yet often without incorporating behavioral responses into the analysis. This study addresses that gap by examining household purchasing behavior during the 2016 and 2017 hurricane seasons in three Southeastern US states. We provide new empirical evidence on how households prepare for extreme weather events, focusing specifically on bottled water purchases during Hurricane Irma and the influence of prior exposure to hurricane warnings and landfalls. Leveraging detailed household-level panel data linked to the timing and geography of storm warnings and landfall events, we estimate a series of event study DD and DDD models to test for behavioral adaptation. Our results show that households significantly increase both the likelihood and intensity of bottled water purchases during the week of Irma’s arrival indicating strong responsiveness to storm warnings. However, we find no evidence that households previously exposed to hurricane warnings in 2016 behaved differently during Irma suggesting limited learning or adaptation from past experiences.
When we redefine prior exposure to include only households located in counties that experienced an actual landfall, we observe somewhat stronger responses. Households with past landfall exposure purchase more bottled water during Irma compared to those without such experience indicating that more intense prior events may trigger stronger behavioral responses. This contrast between landfall-based and warning-based responses highlights the role of salience and experience intensity in shaping preparedness. These findings are consistent with behavioral theories such as inertia, where individuals repeat previous behaviors even when suboptimal, and salience, where more vivid and impactful experiences are more likely to influence future decisions. Importantly, this result challenges previous studies that suggest households respond similarly to weak and strong storm experiences, and underscores the need for policies that account for the psychological drivers of disaster preparedness.
From a policy perspective, these findings suggest that simply issuing warnings may not be sufficient to induce adaptive behavior, particularly for households that have not experienced severe past storms. Public preparedness campaigns may be more effective if they emphasize the tangible consequences of hurricanes or use narrative strategies to simulate the salience of landfall experiences. Additionally, targeting communication to inland or lower-risk areas, where adaptation is less likely, may help close gaps in preparedness. Future research should explore how information interventions, social norms, and repeated exposure interact to shape adaptive behavior over longer time horizons and across different types of natural hazards.
Supplementary material
For supplementary material accompanying this paper visit https://doi.org/10.1017/aae.2025.10025
Data availability statement
The household purchasing data used to estimate the models is proprietary and obtained via a joint agreement between Penn State University and the Kilts Center at the University of Chicago. Our analyses are based in part on data from Nielsen Consumer LLC and marketing databases provided through the NielsenIQ Datasets at the Kilts Center for Marketing Data Center at The University of Chicago Booth School of Business. The conclusions drawn from the NielsenIQ data are ours and do not reflect the views of NielsenIQ. NielsenIQ is not responsible for, had no role in, and was not involved in analyzing and preparing the results reported herein. The authors will make metadata available for researchers wishing to replicate the study.
Acknowledgments
This work was supported by the US Department of Energy, Office of Science, Biological and Environmental Research Program, Earth and Environmental Systems Modeling, MultiSector Dynamics under Cooperative Agreements DE-SC0022141 and DE-SC0016162. The authors thank Daniel Brent, Ellen McCullough, Mateusz Filipski, Shanjukta Nath, Karen Fisher-Vanden, John Weyant, Nicholas Robert, Qin Fan, Lidiia Iavorivska, PCHES seminar participants and workshop participants at UGA and PSU for initial discussions.
Researcher(s)’ own analyses calculated (or derived) based in part on data from Nielsen Consumer LLC and marketing databases provided through the NielsenIQ Datasets at the Kilts Center for Marketing Data Center at The University of Chicago Booth School of Business.
The conclusions drawn from the NielsenIQ data are those of the researcher(s) and do not reflect the views of NielsenIQ. NielsenIQ is not responsible for, had no role in, and was not involved in analyzing and preparing the results reported herein.
Author contribution
Conceptualization, E.R.M., D.H.W., E.C.J.; Methodology, E.R.M., D.H.W., E.C.J.; Formal analysis, E.R.M. and D.H.W.; Data curation, E.R.M.; Writing – original draft, E.R.M.; Writing – review and editing, E.R.M., D.H.W., E.C.J.; Supervision, D.H.W. and E.C.J.; Funding acquisition, D.H.W.
Financial support
This work was supported by the US Department of Energy, Office of Science, Biological and Environmental Research Program, Earth and Environmental Systems Modeling, MultiSector Dynamics under Cooperative Agreements DE-SC0022141 and DE-SC0016162.
Competing interests
None.
Code availability
The authors will make all code available for researchers wishing to replicate the study.
Declaration of generative AI and AI-assisted technologies in the writing process
During the preparation of this work the authors used no AI tools or services. The authors take full responsibility for the content of the published article.
Ethics approval
Not applicable.
Consent to participate
Not applicable.
Consent for publication
Not applicable.



 Open access

