


Introduction
Values of solidarity, universalism and decommodification are, by most scholars, stressed as distinctive features of the Swedish – and Nordic – welfare model (Blomqvist and Palme, Reference Blomqvist and Palme2020; Cox, Reference Cox2004). Over the past few decades, however, this model has come under strain, as policy in many areas has moved towards decreased coverage and less generous benefits (Alm et al., Reference Alm, Nelson and Nieuwenhuis2020).
As a final tier and safety net for citizens lacking sufficient financial means, social assistance (SA) offers support to the least well-off in society. Hence, SA may also be considered a test of how the basic values of Swedish welfare are maintained. The redistributive impact of SA is reliant on both eligibility thresholds and the magnitude of benefit levels. SA and other means-tested benefits stand out as exceptions among the otherwise universal programs that distinguish Swedish welfare. This coexistence of universal and residual redistributive principles is sometimes referred to as a welfare paradox, distinguishing not only Sweden but all Nordic countries (Lødemel, Reference Lødemel1997). The SA schemes are in many respects remains from early poor relief and as such associated with high stigma and comparatively less popular support (Lødemel and Schulte, Reference Lødemel and Schulte1992).
Official statistics do not provide information about those who are applying for SA, but are found non-eligible. Neither is there any systematic data with regard to benefit levels among those assessed as eligible. However, results from cross-sectional studies indicate that more than 1 out of 4 applications are declined (Stranz et al., Reference Stranz, Karlsson and Wiklund2017) and that a substantial share of those who receive SA gets far less than what they have applied for (Stranz and Wiklund, Reference Stranz and Wiklund2012).
Examining the development of SA assessments and benefit levels over time may offer an indication of the route Swedish welfare is following, and how the values of solidarity, universalism and decommodification are being upheld in relation to the most vulnerable strata of society. SA policies are not only a matter of administrative routines, but in essence also about normative foundations of welfare states (Leisering, Reference Leisering2019). In this article, we will present results from a study that will shed light on how the determination of eligibility in, and the generosity of, SA assessments in Sweden have developed over the last three decades. Using data from three different vignette studiesFootnote 1 conducted between 1994 and 2018, we will explore the distinguishing trends in SA assessments over these decades. Our analyses will focus not only on whether the availability of the benefit – in terms of the granting of applications – has changed, but also on the extent to which compensation levels may have altered over time. Departing from Lipsky’s (Reference Lipsky2010) notion that public policy may be regarded as an abstraction until it is actually carried out, we will analyze assessments and decisions made by individual SA caseworkers, instead of changes taking place within the formal regulative framework.
We believe that our findings will illustrate not only how a pivotal part of the archetypic Swedish welfare model, the last safety net, is changing character in terms of what protection it provides, but also how this is accomplished without any formal policy directives. This may add new knowledge to the discourse of the sustainability of the Nordic welfare regime.
Background
Since the early 1980s, Swedish SA has been regulated by the Social Services Act, which provides relatively general guidelines regarding eligibility and compensation levels. The law merely states that ’individuals unable to provide for their needs or to obtain provision for themselves in any other way are entitled to assistance for their livelihood and for their living in general’. The individual shall, through SA, be assured a ‘reasonable level of living’.
The responsibility for providing and financing the benefit lies with the Swedish municipalities: assessments of eligibility and benefit levels are shouldered by frontline professionals, who may be seen as prototypical street-level bureaucrats (cf. Lipsky, Reference Lipsky2010). The basic procedure for assessments has ever since the enactments of the law been carried out in a similar manner, based on a means-test where claimants are regarded eligible if they are: (a) available for work, make efforts to find a job or take steps to enhance their employability; and (b) not able to meet their economic needs by other means. The latter means non-eligibility if needs are covered by other benefits, although insufficient incomes from other programs are allowed. The work requisite has been present all over the period studied in this article. Locally organized activation measures and workfare arrangements have though increased markedly since the late 1990s although empirical knowledge on in what manner it is implemented, or how it affects social workers’ decisions or level of discretion, is sparse (Nybom, Reference Nybom2012).
A crucial component in the process of means-testing is how ’need’ is defined and calculated and how the phrase ’reasonable level of living’ is to be understood. When the Social Services Act entered into force in the early 1980s, national government refrained from defining any compulsory minimum level for SA. However, in order to point municipalities in a similar direction with regard to a minimum level, national government tasked central authorities with developing standards that took into account the intent of the law. The outcome was a recommended minimum level based on 10 different items, i.e. costs in different areas, referred to as a ’gross benefit standard’. The legal status of this instrument, however, was unclear, and in the years following, many municipalities chose to ignore the recommended standard.
In order to stop a race to the bottom and to counteract municipal variation in benefit levels, the national government introduced a national benefit standard (NBS) in 1998. In contrast to the previous recommended benefit standard this was defined as a compulsory minimum level. The centralizing nature of this step was, though, diluted by the fact that the new standard specified minimum amounts for a reduced number of items, leaving it to local authorities to in detail assess existing needs in the items that were lifted out. In a follow-up of how the NBS has been utilized the National Board of Health and Welfare (NBHW, 2007) found that an overwhelming majority of the municipalities refrained from assessing the items lifted out: thereby applying a more restrictive definition of ’reasonable level of living’. This interpretation of the NBS has in most cases been adapted without leaving any traces in local political decisions or in how local guidelines are introduced (ibid.).
In order to understand how actual policy develops over time, decisions made at the local level are pivotal, since they largely define formal eligibility standards and benefit levels in practice. A problem here is that local guidelines mainly communicate the figures of the formal benefit levels, but rarely inform about the praxis around the possibilities to deviate from them.
Although the NBS outlines some minimum levels, local authorities and caseworkers in charge of the assessment process enjoy a substantial degree of discretion. Further, there is no evidence that the scope for the latter group has changed in any substantial manner over the period covered in this article. Decisions that deviate from recommended or legally imposed benefits standards have remained frequent and no further regulations that significantly control the prerequisites for the assessments have been introduced (Stranz et al., Reference Stranz, Karlsson and Wiklund2017).
Development of the Swedish SA model
In an early attempt to classify SA schemes, Lødemel and Schulte (Reference Lødemel and Schulte1992) labeled Sweden as a residual poverty regime characterized by low levels of receipt combined with comparatively generous benefit levels. Eardley et al. (Reference Eardley, Bradshaw, Ditch and Gough1996) ended up with a similar categorization, but also emphasized the thorough means-test which stood out as harsh in an international comparison. In the following period Swedish SA did follow the international trend with an increased emphasis on inclusion through labour market activation, where access to benefits became conditional on participation in activation programs and other job search activities (Moreira, Reference Moreira2008; Hemerijck, Reference Hemerijck, Morel, Palier and Palme2012). Moreover, the anti-poverty effects of Nordic SA provision decreased markedly after the mid-1990s, whereas it in many other countries actually increased in the same period (Kuivalainen and Nelson, Reference Kuivalainen, Nelson, Kvist, Fritzell, Hvinden and Kangas2012).
Overall, the institutional design of minimum income and SA schemes stand out as generally differentiated amongst European states. From being mainly residual programs providing minimum income support and preventing poverty, they have now to a varying degree widened their scope – including activation measures and other reintegrative instruments (Marchal and Van Mechelen, Reference Marchal and Van Mechelen2017). The emphasis here may either be on the enabling aspects of these programs or on more rigorous conditionality in terms of job-search behavior (Natili, Reference Natili2020). To fully understand the institutional features and function of any SA scheme, it is further necessary to understand its interaction with other welfare state structures, especially the generosity and coverage of first-tier income maintenance benefits. The more inclusive and universal these benefits are, the less significant are SA arrangements, while steps making first-tier benefits less comprehensive and less generous tend to increase need of support, making SA policies more central for overall welfare outcomes (Schulte, Reference Schulte, Marmor and De Jong2018).
So, what can then be concluded regarding the development of generosity and coverage of Swedish SA? In order to answer that question, we do need to pay respect to both the scale of provision (including the level of receipt as well as the proportion of needs covered) and the conditions for eligibility assessments, i.e. the ‘how much’ and the ‘how’ of welfare provision (Bonoli, Reference Bonoli1997). In terms of expenditure, Swedish SA display a quite stable development over the last decades, while take-up shows a downturn and long-term receipt a sizeable growth.Footnote 2 At the ‘how’ side, the overall characterization above of the classifications essentially remains adequate with respect to the residual position of SA. Benefit levels, in terms of SA adequacy, on the other side, do not stand out as generous anymore. Comparative studies have shown that the gap between the nationally recommended level of benefits and general disposable income in the general population widened more in Sweden than in the other Nordics, and also more than in several other European countries, during the period 1990–2007 (Nelson, Reference Nelson2010). Swedish SA benefit levels have actually been labelled as ‘low’ in more recent comparative studies (Hansen and Schultz-Nielsen, Reference Hansen and Schultz-Nielsen2015).
Available data do not provide any definite answers with respect to generosity or coverage. Expenditure as well as take-up statistics are, beside other pointed-out deficits, overall less relevant unless they are systematically related to development of need (Gilbert, Reference Gilbert2009). Reliable data of need of or demand for SA are not available in Sweden, but there are good reasons to assume that need has increased substantially over the last decades, given decreased generosity in relevant first-tier benefits, increased unemployment and an increased poverty level among individuals with loose or nonexistent connections to the labour market. A feasible conclusion is, then, that stable levels of costs and decreased receipt in a period of increased need should be taken as a sign of decreased generosity and welfare effort, capturing lowered payments and/or a less achievable benefit (Alm et al., Reference Alm, Nelson and Nieuwenhuis2020).
Policy-making in practice: Discretionary power on the local level
With a general characterization one may argue that policy formation in the area of SA is neither uniform nor located at a specific territorial level. The Swedish structure of governance in this area has been referred to as ‘local autonomy centrally framed’ (Kazepov, Reference Kazepov2010), which implies that local autonomy exists within a national regulatory context, aiming to keep local variation under control and policy outcomes in accordance with national goals. National control is to some extent maintained, but detailed steering is replaced by general goals and non-compulsory guidelines (Johansson and Borell, Reference Johansson and Borell1999).
The vertical dispersion of policy formation and front-line decision-making scattered across 290 Swedish municipalities makes outcomes of individual decisions on SA hard to predict. Such indeterminacy may be regarded as inconsistent with the universalistic features normally associated with comprehensive welfare arrangements, as it enables variations regarding entitlement as well as benefit levels. Local discretion creates leeway for municipal decision-makers to exert political and administrative influence through the enactment of local regulations that add interpretations and supplementary directives to national regulations. Professional discretion gives scope for the values and beliefs held by front-line staff to impact both the manner in which applications are assessed and the outcome of decisions (Evetts, Reference Evetts2002).
Previous empirical studies focusing on outcomes of Swedish SA assessments show that these outcomes vary significantly not only between municipalities, but also between caseworkers in the very same organizations. In the former case, variation is related to, on the one hand, aspects such as size of population and political majority in the municipalities and, on the other hand, factors such as organizational structure and overall workload among staff. With regard to variation between individual caseworkers, this can be related to such factors as gender, personal opinions on SA and work experience (e.g., Hussénius, Reference Hussénius2021; Hydén et al., Reference Hydén, Kyhle Westermark and Stenberg1995; Stranz, Reference Stranz2007).
Thus, far-reaching discretion in the application of the national benefit standard contributes to extending or limiting eligibility to SA, depending on where in Sweden you live or which caseworker is handling your application. Benefit levels may vary for the same reasons, and, consequently, local procedures of eligibility assessment play a decisive role in how policy is materialized, both with regard to which needs are met and with regard to the level of the benefit. Although Sweden has been described as having one of the strictest means-testing policies for SA programs within the OECD (Saraceno, Reference Saraceno2002), means-testing also includes making a number of flexible judgements concerning acceptable modes of need and appraisals of work morale (Nybom, Reference Nybom2012). The conditionality following this is far from transparent, but rather characterized by opacity and uncertainty and subject to the discretion of the street-level bureaucrats.
Street-level discretion is advanced by vague legislation and the absence of coherent administrative control (Hasenfeld et al., Reference Hasenfeld, Rafferty and Zald1987; Lipsky, Reference Lipsky2010). However, discretion is far from a discrete variable; it varies in range due to contextual conditions and the scope for professional authority.
This dispersion of policy is apt to create uncertainty, unequal criteria and arbitrariness following from the values and concerns embraced by front-line decision makers. The reasons why, in spite of these disadvantages, a discretion-based system is maintained are threefold. First, the nature of SA applications, and the needs that underlie them, are such that they encompass many diverse and highly individual conditions which specific regulations can never fully cover or predict. Second, non-precise national regulations provide local authorities with possibilities to take local conditions into consideration (De Vries, Reference De Vries2000; Mosley, Reference Mosley, Larsen and van Berkel2009); the notions of nation-based universalism are challenged by concerns of what is believed to be locally appropriate (Cox, Reference Cox2004). Third, attempts to regulate assessments by detailed steering may backfire, since caseworkers may choose to disregard the rules when facing applicants with complex needs. This may eventually result in increased discretion and a situation that is more difficult to overview (Stranz, Reference Stranz2007).
Methods
The present article utilizes cross-sectional data collected via three independent projects. The first study was carried out in 1994 (Hydén et al., Reference Hydén, Kyhle Westermark and Stenberg1995), the second in 2003/2004 (Stranz, Reference Stranz2007) and the third in 2018. In all three studies, the main portion of the data was collected via vignette-based surveys directed to SA caseworkers (see below). In table 1 we present some basic details from the three studies.
Number of respondents, response rate, number of welfare offices/municipalities and number of vignettes presented in the three projects
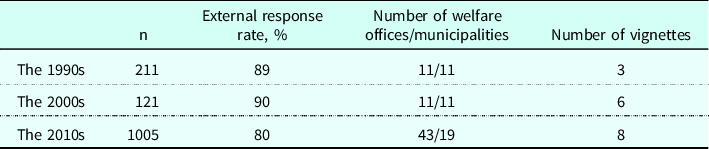
The data from 1994 were collected in a total of 11 municipalities scattered across the country, whereas data in 2003/2004 were collected in 11 municipalities in the northern parts of the Stockholm area. The latest study gathers most of the municipalities included in the previous studies plus all city districts in Sweden’s three major cities (Stockholm, Gothenburg and Malmö).
The SA caseworkers have been identified based on complete lists of staff in each municipality, covering all employees who assessed SA applications on a regular basis. The samples consist of four respondent categories: social workers (i.e., members of staff with a bachelor’s in social work or a corresponding qualification), administrative caseworkers (i.e., staff members who may not have a higher education degree, but still, to some extent, assess SA applications), managers/deputy managers and, finally, others (e.g., debt counselors, benefit controllers, etc.).
After defining the sample, data have been collected via on-site visits at each welfare office, following the same procedure in all studies. The visits follow a pre-specified scheme, where a member of the research team gathers all the respondents in order to provide basic information about the project and the questionnaire to be filled out. The last version of the questionnaires includes eight vignettes (this article presents results from six of those)Footnote 3 , but additional items concerning, for example, the respondents’ background (age, gender, basic education, etc.), work experience and attitudes towards SA uptake and eligibility are covered as well.
The vignettes
Both the vignettes from which we present results in this article and the remaining items in the questionnaire were utilized in the prior studies referred to above: in the study by Stranz (Reference Stranz2007) all six vignettes were used, while Hydén et al. (Reference Hydén, Kyhle Westermark and Stenberg1995) only used vignettes 1-3. In order to enable comparisons between measurements, all figures concerning incomes and expenditures have been adjusted to 2018 prices. The vignettes are summarized below. All figures for income and expenditures are per month.
-
Vignette 1 presents a 27-year-old single mother of two children, 4 years old and 9 months old respectively. The applicant has full custody of both children and receives no alimony from their father. The applicant is still caring for the younger child in the home, while the older child attends public childcare. The applicant has income in the form of a parental benefit, a housing allowance and a child allowance (SEK 10,570 in total). She is applying for (complementary) SA to cover basic expenditures according to the national benefit standard (NBS), costs for rent (SEK 6,040) and public childcare fee (SEK 210).
-
In Vignette 2 the same applicant as in the first vignette returns after 7 months, once again applying for (complementary) SA to cover basic expenditures according to the NBS, rent (SEK 6,040), public childcare fee (SEK 540) and costs for public transportation (SEK 580). Both of her children are now attending public childcare and the applicant is working. However, she has chosen to work just part-time. Her salary amounts to SEK 8,310 and is complemented by the housing and child allowances (SEK 5,800 in total). The father of the children is still not contributing to their support.
-
Vignette 3 presents a 22-year-old single man who has just returned from a six-month-long vacation. Before leaving Sweden, the applicant was working, but as his employer would not grant him such a long leave, he chose to quit his job. He returned to Sweden 10 days ago and is registered at the local unemployment office, but is in total lack of funds. He applies for SA to cover basic expenditures according to the NBS, and costs for rent (SEK 4,530).
-
In Vignette 4, the applicant is a 35-year-old single male who is a foreign citizen, but has resided in Sweden for 10 years. He is the father of two children, whom he sees sporadically, and has studied Swedish for immigrants, but due to health problems, has not been able to work for the past year. His last sick note expired a couple of weeks ago and he is waiting to see his doctor again. The applicant is in total lack of funds and is applying for SA to cover basic expenditures according to the NBS, costs for rent (SEK 4,300), public transportation (SEK 580), and non-specified costs for a total of four days of visitation with his children.
-
Vignette 5 presents yet another 22-year-old single man who is out of work and funds; he has been granted SA for a couple of months prior to this application. He is registered at the local unemployment office, but has not applied for any jobs. In addition, owing to suspicions of substance abuse, he has been referred to the local substance abuse treatment unit for further investigation. He is applying for SA to cover basic expenditures according to the NBS, costs for rent (SEK 2,900) and public transportation (SEK 580).
-
The final case, Vignette 6, presents a young woman, 18 years old, who has dropped out of school and lives with her single mother. She is unemployed, but is registered at the local unemployment office. The applicant also states that she is applying for jobs in different stores. She has no income at all and is applying for SA to cover basic expenditures according to the NBS, costs for rent (SEK 2,320; about 50% of total rent), public transportation (SEK 580), and funds for clothing (SEK 810), which she states that she needs when attending job interviews.
Analyses
Data were processed using SPSS version 26, and our focus was directed towards time-related differences in assessments with regard to (a) granting of applications as well as (b) levels of granted benefits. In order to make possible comparisons of the latter, granted benefits figures in prior studies were adjusted to the Consumer Price Index (CPI).
Data were analyzed on both bivariate and multiple levels. On the bivariate level, differences between the years of measurement with regard to (a) were statistically tested using Pearson’s χ2-test, whereas differences in (b) were statistically tested using a one-way ANOVA (vignettes 1–3) and an independent samples t-test (vignettes 4–6), respectively. Before analyzing (b), data were cleared from a handful (n=20) of outliers; the variable was tested for, and showed no signs of, skewness.
The bivariate analyses were supplemented with, for (a), multiple logistic regression analyses, and, for (b), multiple linear regression analyses. In both of these analyses, our main interest was still directed towards time-related differences and, hence, only results with regard to this aspect are presented, but we also controlled for the potential significance of yet another set of (basic) factors that may affect the assessments:
-
MunicipalityFootnote 4
-
Gender (female [87%] = 0/male [13%] = 1)
-
Age (continuous, mean 38.5)
-
Basic education (BSW [77%] = 0/other university degree [12%]/upper secondary school [9%]/other [3%] = 1)
-
Work position (social worker [78%] = 0/manager/deputy manager [10%]/ administrative caseworker [10%]/other [3%] = 1)
Methodological reservations
Vignettes never entirely capture actual situations. Compared to real-world circumstances, they will always be more static and limited with respect to the amount of available information (Hughes and Ruby, Reference Hughes and Ruby2004). What we present here are a selection of cases assessed under specific conditions, where tendencies over time might be over- or underrated due to the design of the study and content of the vignettes. Further, our analyses are based on three different sets of cross-sectional data, and, as previously noted, the material is not entirely collected from the same municipalities. Consequently, the composition of respondents also varies between the points of measurement. We cannot rule out that unobserved heterogeneity has had an effect on the outcomes of our comparisons and, thus, this is a factor that ought to be taken under consideration when evaluating and externally generalizing the results. However, the differences between the points of measurement in the following section are too prominent to be dismissed as a result of methodological bias. As will be shown, when controlling for factors that may exert an influence over assessments, most differences in overall generosity between the points of measurement are still evident.
Results
The presentation of results proceeds in three stages. First, we display the extent to which the applications were granted throughout the period, covered by data from all three points of measurement – 1990s, 2000s and 2010s. Second, we focus on shifts in the amounts granted. Third, and finally, we look at both of these aspects while controlling for potential co-variates in the data sets respectively.
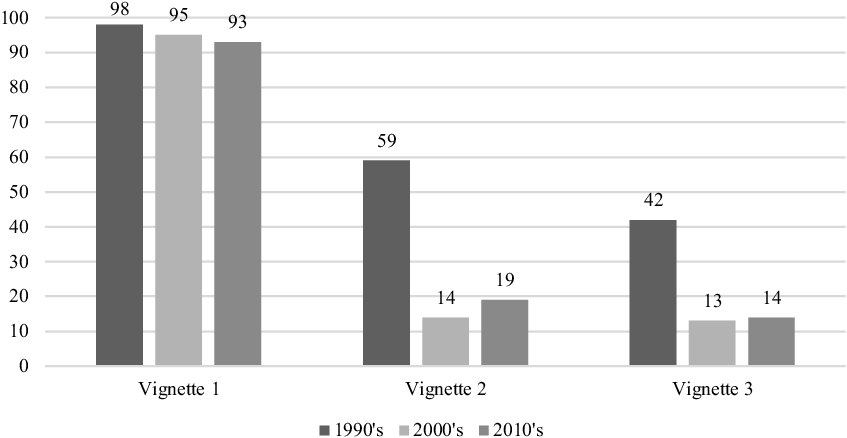
An overall observation about the patterns in Figure 1 and 2 is that the propensity to grant applications has decreased over time. Using the results from the 1990s as a baseline, which is doable for vignettes 1–3, this stands out as an inference with few objections. The most noteworthy decrease applies to vignettes 2 and 3, where the inclination to grant SA drops by 29–45 percentage points between the 1990s and the two subsequent decades. Comparing the 2000s with the 2010s, patterns appear less uniform and without any clear-cut tendency in terms of approval levels. In only two of the cases, vignettes 4 and 5, do we see an inclination that may be construed as a continued reduction in granting applications. For the remaining vignettes, changes appear to be quite modest or even, as in vignette 2, to shift towards an increased tendency to grant.
Vignette applications granted in the 1990s, 2000s and 2010s. Percent.
Vignette 1: χ2=7.47 (p=.024); n=209 (1990’s)/121 (2000’s)/999 (2010’s).
Vignette 2: χ2=161.23 (p=.000); n=207/121/1000.
Vignette 3: χ2=90.50 (p=.000); n=208/120/1000.
Vignette applications granted in the 2000s and 2010s. Percent.
Vignette 4: χ2=8.53 (p=.003); n=118 (2000’s)/986 (2010’s).
Vignette 5: χ2=2.07 (p=.150); n=121/992.
Vignette 6: χ2=.037 (p=.847); n=118/989.

Further, beside the observable changes over time with regard to levels of granted applications – which tells us how accessible the benefit is at a particular point in time, given specific conditions – the results presented in the figures provide information about the level of uniformity in caseworker decisions. Here, vignette 1, which presents a single mother of two young children, exemplifies a case where respondents over three decades tended to make the same decision, finding the applicant eligible for SA. The fact that the assessments of vignette 1 are congruent and in favor of the client over time does not stand out as particularly surprising. Because they have lower incomes and are more likely to work part-time, women, especially single parents, depend more on state-administered benefits than men. Consequently, as the majority of Swedish welfare benefits are income-related, single mothers have been highly dependent on SA for temporary and/or complementary financial support ever since women entered the labor market at large. The reduced propensity from the 1990s to the later points of measurement to grant the application in vignette 2 indicates, however, that the overall appreciation of the situation of, and possibly benevolence towards, single mothers has shifted over time. Vignette 2 portrays the same applicant from vignette 1 a few months later, when she has chosen to work part-time, and thus requires complementary SA. In the wake of the 1990s economic recession in Sweden, workfare has been increasingly emphasized for those applying for SA, and consequently, so too has the individual responsibility for self-support. Apparently, single parents have not been able to stay under the radar with regards to this general development.
Vignette 5, and to some extent vignette 6, demonstrate diverging assessments, where levels are closer to 50%, dividing respondents in two main groups who reached different decisions. Vignette 3, like vignette 2, shows a similar split in the 1990s, but with a reduced propensity to grant the applications in the latter studies, thus assessments seem to have become more uniform over time.
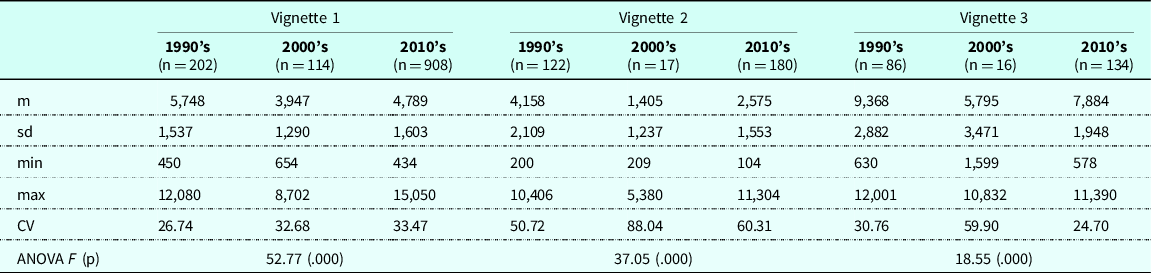
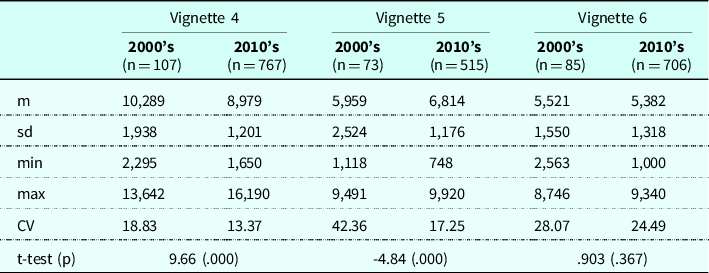
Tables 2a and 2b show the monetary amounts granted in those vignettes assessed as eligible. The pattern here is similar to the development that can be observed in Figure 1 and 2. Changes over time for vignettes 1, 2 and 3 display decreased generosity when the starting (1990s) and end points (2010s) are compared. In relative terms, this represents a decline between 16 and 38 percent. The overall lowest amounts granted are displayed in the assessments from the 2000s, which over the entire period produce a sort of U-shaped development. For vignettes 4, 5 and 6, however, an increase in the 2010s is only present in vignette 5, while vignette 4 instead displays a quite substantial downturn.
Amounts (SEK, adjusted for inflation) granted in the 1990s, 2000s and 2010s. Means (m), standard deviations (sd), minimums (min), maximums (max) and coefficients of variation (CV)
Amounts (SEK, adjusted for inflation) granted in the 2000s and 2010s. Means (m), standard deviations (sd), minimums (min), maximums (max) and coefficients of variation (CV)
Further, the results reveal markedly increased disparities in benefit levels between the 1990s and the 2000s, followed by a general reversed development between the 2000s and the 2010s. Although the former is particularly conspicuous – it captures conditions before and after the enactment of the national benefit standard in 1998 – we should not overlook the coefficients of variation from the 2010s. The enduring disparities in assessments bear witness of remaining low impact of national policy measures even in the long run.
Comparability between the points of measurement may be limited due to the fact that data were not always collected from all of the same municipalities. Further, as shown, the composition of the respondent group varies from one time to another. Hence, multiple regression analyses were carried out with regard to both the granting of the applications in the vignettes and the level of benefits granted. The results are presented in Tables 3a and 3b.
Multiple logistic regression analyses on granting of vignette applications Odds ratios (0=declined, 1=granted)
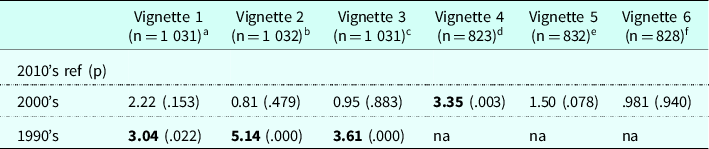
Note: all models are controlled for municipality, age, gender, basic education and work position.
a declined=62, granted=969; bdeclined=760, granted=272; cdeclined=833, granted=198; ddeclined=158, granted=665; edeclined=379, granted=453; fdeclined=220, granted=608.
Multiple linear regression analyses on levels of benefits. Beta coefficients
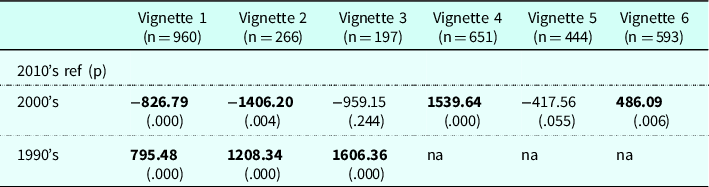
Note: all models are controlled for municipality, age, gender, basic education and work position.
Overall, the multiple regression analyses confirm the bivariate findings. In terms of generosity, the assessments from the 1990s stand out with a substantially higher degree of granted applications in all comparable vignettes and higher subsidy levels as well. Comparisons between the 2000s and the 2010s show, in accordance with Figure 1, not only a significant higher propensity to grant applications but also, in congruity with Table 2b, a larger degree of generosity in vignette 4 in the measurement from the 2000s, when controlling for other variables as well. While there are several possible explanations for this increased overall restraint towards vignette 4, which features a man in his mid-30s who is a foreign citizen, one cannot rule out the possibility that these very basic client characteristics, in combination with the year of measurement, play a significant part. In 2015, owing to a considerable influx of refugees flows over several years, Sweden was facing a so-called ‘refugee crisis’, which was followed by increased border controls and general restrictions towards immigrants. Consequently, since individual assessments are influenced by caseworkers’ attitudes, assessments of vignette 4 may have been affected by an increased austerity towards immigrants that emerged not only in Swedish policy but also in public opinion (e.g., Esaiasson et al., Reference Esaiasson, Martinsson and Sohlberg2016). With regard to granting propensity in the remaining vignettes, as shown in Table 3a, no other differences between the measurements from 2000s and 2010s stand out as significant when controlling for municipality and background caseworker variables.
The multiple linear regression analyses presented in Table 3b confirm the bivariate pattern of a larger degree of generosity vis-à-vis vignettes 1 and 2 in the 2010s, but a lower degree in vignette 6. It is noteworthy that the latter coefficient stands out as significant, which was not the case at the bivariate level, when controlling for other factors.
Conclusion
Our data indicate that Swedish SA, over a period of 25 years, has decreased substantially in generosity overall, and consequently offers less protection for those experiencing financial strain. Not only is it far more common for applications to be declined today than it was in the mid-1990s, but also, when applications are granted, the size of subsidies today is meagre compared to those of 25 years ago. However, this process is seemingly not driven or accompanied by deliberate or transparent policy decisions, but rather by a development that has followed as a result of stepwise alterations in eligibility assessments and interpretations of national regulations on the municipal level.
The most striking result in our comparisons of the three decades studied is the substantial drop in approved applications and benefit levels between the 1990s and the two subsequent points of measurement. There are a number of possible explanations for why this is the case. First, the 1990s stands out as a decade largely characterized by economic recession and, by Swedish standards, excessive unemployment levels. In 1994, the same year the first set of vignette data was collected, the unemployment rate reached just over ten percent (e.g., Dahlberg et al., Reference Dahlberg, Edmark, Hansen and Mörk2009). Hence, structural reasons for being unemployed and, if not qualified for unemployment insurance, in need of SA were manifest, making notions of deservingness less pivotal. This may have fostered a more generous stance towards applicants who were partially or fully unemployed, as in the scenarios presented in vignettes 2 and 3. The combination of an overall economic improvement and an increased focus on workfare after the recession may, in its turn, be an explanation for the reduced generosity shown in the measurements from the 2000s and 2010s. In this period we do, however, have a less uniform overall pattern in general, where we see tendencies of increased as well as decreased generosity in terms of eligibility and benefit levels.
Second, as a consequence of boosting unemployment, the workload for respondents participating in the 1990s study was substantially higher than in the studies following, leaving less room for a detailed scrutiny of applications and – possibly – an approach to assessments that may be less restrictive. This interpretation is, to some extent, also supported by separate analyses of the data from the 2000s (Stranz, Reference Stranz2007), which show that respondents in municipalities with large caseloads per caseworker tend to make more generous decisions.
A third, and maybe the most substantial, conceivable explanation for both the lower propensity to grant applications and the considerably less generous subsidies shown in the data from the 2000s and 2010s, compared to those from the 1990s, is the enactment of the national benefit standard (NBS) in 1998. The aim of this standard was, as noted above, not only to define a minimum benefit level but also to decrease municipal variability in decision-making. However, in relation to previous recommended and frequently applied standards, the NBS actually encompassed fewer mandatory household budget items, leaving decisions on the omitted items to the discretion of the municipalities. Most municipalities implemented the national standard in a manner that assessments where made according to the minimum level permitted, with no attempt to assess possible needs linked to the omitted budget items. Thus, quite at odds with the legislators’ intentions of not only establishing a minimum level but also enabling a more flexible, and generous, approach towards individual applicants, the practical outcome of the NBS seems rather to have been the establishment of a fixed, and comparatively less generous, ceiling for SA (cf. Bergmark, Reference Bergmark2013). In the period between 2003/04 and 2018, some tendencies towards increased generosity are visible, breaking the downward trend noticed between the first and the second point of measurement. For vignettes 2 and 3 the share of granted applications increased and for vignettes 1, 2 and 3 the amounts went up. This development cannot be explained by contextual factors such as unemployment or caseloads, since the levels here are more or less the same at the time for the two studies. There are further no explicit signs of change in local regulations in a more generous direction.
Further, not only are the decisions from the measurements from the 2000s and 2010s more restrictive overall than those made in the 1990s, but our analyses also show that the individual variations in some of the assessments made by caseworkers have increased between measurements. Considering first that the NBS aimed to reduce such differences, and second that there had been – and still is – an ongoing expansion of complementary national as well as local regulations in the area of SA since the mid-1990s, this may appear somewhat unexpected. The reduction of mandatory budget items in the NBS may be one explanation, leaving it up to municipalities and caseworkers to define benefit rights connected to the omitted items. Further, as regulations are modelled upon typical conditions and predictable behaviors, to some extent they may be viewed as running in direct conflict with the intentions of the Social Services Act. However, this process is seemingly not driven or accompanied by deliberate or transparent policy decisions, but rather by a development that has followed as a result of stepwise alterations in eligibility assessments and interpretations of national regulations on the municipal level. The ’local autonomy centrally framed’ structure of governance does not only provide a prerequisite for variation, but also a diffusion of formal responsibility where actual policy formation is very difficult to identify. This vertical dispersion is, if not driving, at least enabling increasing variation between the case workers.
The development presented in our data serves as an example of incremental policy change (Streeck and Thelen, Reference Streeck and Thelen2005) that over time may amount to a more transformative shift. New components introduced over time may facilitate such shift, although with mainly unintended and unforeseen consequences. Thelen (Reference Thelen, Mahoney and Rueschmeyer2003) has identified two such mechanisms of change: layering and conversion. Layering refers to the introduction of new elements within an otherwise stable institutional setting. In the Swedish SA context, the introduction of the NBS in 1998 may be regarded as such an element here: enacted in order to provide a floor for the benefit and counteract variation, but in practice making leeway for reduced generosity. Conversion, on the other hand, relates to the introduction of new goals or specific tasks that may alter the function of an institution. Here, the increased emphasis on labour market activation may serve as an example of conversion, since it is closely linked with a focus on work incentives and, most likely, a following propensity towards restraining generosity in cases where work morale could be questioned. The very nature of the regulatory framework of SA in Sweden tends to reduce the degree of calculability of the benefit, and the level of social security it provides. This makes a leeway for creeping retrenchment (Marchal et al., Reference Marchal, Marx and Van Mechelen2014), where political responsibility is veiled and evaded. Hence, the driving forces of this process are not easy to single out, but likely to some extent to be following a shift towards neoliberal values in national and local politics and a constant low public trust in SA schemes (Gonthier, Reference Gonthier2019).
Our findings may be interpreted as an expression of how the Swedish welfare regime is transforming. The parallel drop in SA adequacy and the substantially decreased generosity in SA assessments shown in our data represents a step towards reduced solidarity with the worst-off members of society. Our results describe a development where the capacity of the system to uphold a reasonable standard of living when financial hardship is a fact has decreased, both in terms of coverage and adequacy. Hence, it is possible to argue that the policy alterations have led to a state where social citizenship has been eroded, especially for long-term benefits recipients (cf. Edmiston, Reference Edmiston2017). The increased proportion of applications being denied points in the same direction. Since SA represents a final safety net in Swedish welfare, systematic patterns of dropouts here indicate a development in which applicants in certain situations are left without any financial safety net at all. In essence, this is an indication of altered normative foundations of the Swedish model, where poverty alleviation has been considered a pivotal attribute.
Acknowledgements
The work was funded by FORTE, Grant 2016-00438.
The research complies with ethical guidelines of Good Research Practice and has been reviewed and approved by the Swedish Research Council for Health Working Life and Welfare.
Conflict of interest
The authors declare no conflicts of interest.


 Open access