


Introduction
The first 1000 days of an infant’s life is a critical period of development, during which key regulatory and homeostatic systems are established. Thus, insults to development during this period have the potential to programme infant development and growth in later life, contributing to future risk of many non-communicable diseases. Reference Arima and Fukuoka1 This is theorised in the Developmental Origins of Health and Disease (DOHaD) hypothesis. Reference Barker2
A key concept in this area is the relationship between early growth and future disease risk. Research suggests that low birthweight (LBW) and inadequate postnatal growth, as well as high birthweight (HBW) and excessive postnatal growth, are associated with increased risks of diseases such as cardiovascular disease, obesity and Type 2 diabetes mellitus in later life. Reference Arima and Fukuoka1,Reference Eriksson, Sandboge, Salonen, Kajantie and Osmond3-Reference Pehkonen, Viinikainen and Kari5 Periods of postnatal ‘catch-up’ growth following fetal growth restriction present the strongest associations with future non-communicable diseases. Reference Woo4,Reference Singhal6 According to the thrifty phenotype hypothesis, this ‘catch-up’ growth reflects fetal shifts in metabolic development in response to undernourished in-utero environments, which then predisposes infants to excessive growth in a nutrient-rich postnatal environment. Reference Hales and Barker7
The influence of in-utero exposures on early infant growth is becoming increasingly apparent. Gestation involves the first interactions with environmental stressors, and rapidity of development and high developmental plasticity during this time make the fetus highly sensitive to environmental factors. Reference Napoli8,Reference Gluckman, Hanson, Phil, Cooper and Thornburg9 This may trigger adaptation through permanent fetal metabolic, physiological and epigenetic changes. Reference Goyal, Limesand and Goyal10,Reference Agarwal, Morriseau, Kereliuk, Doucette, Wicklow and Dolinsky11 However, many uncertainties remain surrounding the ongoing implications of such changes for postnatal life.
The link between maternal cardiometabolic health and infant outcomes have been clearly demonstrated. Reference Maffeis and Morandi12-Reference OReilly and Reynolds15 Increased maternal pre-pregnancy body mass index (BMI) and gestational weight gain (GWG) increase the risk of both HBW and LBW infants in a U-shaped pattern, also acting as predictors for accelerated infant growth postnatally. Reference Montazeri, Vrijheid and Martinez16,Reference Fraser, Tilling and Macdonald-Wallis17 Additionally, increased maternal BMI is associated with an up to six-fold increased risk of future non-communicable disease for infants. Reference Eriksson, Sandboge, Salonen, Kajantie and Osmond3 Pregnancy complications such as preeclampsia, gestational diabetes mellitus (GDM) and gestational hypertension also contribute to maternal cardiometabolic dysfunction, and have been associated with extremes of birthweight and accelerated postnatal growth. Reference Yan, Lyu, Liu, Zhou, Ji and Wang18,Reference Kim, Sharma, Sappenfield, Wilson and Salihu19
Similarly, maternal lifestyle factors such as nutrition and physical activity have demonstrated associations with fetal growth and development. Severe maternal undernutrition is associated with LBW, prematurity and small-for-gestational age infants, also increasing the risk of neurodevelopmental complications. Reference Wrottesley, Lamper and Pisa20,Reference Christian, Mullany, Hurley, Katz and Black21 The impacts of maternal overnutrition and physical activity on infant growth are less understood. In animal models, maternal high fat diet has been linked to adverse cardiometabolic changes in infants, while increased maternal activity is associated with improved infant glucose regulation and placental vascularity. Reference Chavatte-Palmer, Tarrade and Rousseau-Ralliard22-Reference Carter, Lewis and Wilkerson25 However, the results of human studies are mixed, with variability in outcomes measured and postnatal followup. Reference Morales-Suárez-Varela, Clemente-Bosch and Peraita-Costa23,Reference Hayes, McParlin and Azevedo26,Reference Raab, Michel, Günther, Hoffmann, Stecher and Hauner27
The importance of the maternal environment during pregnancy is increasingly recognised, however, there are limited studies which can draw on multiple prenatal measurements to examine associations with postnatal infant growth. Thus, this study aimed to investigate the associations between maternal antenatal lifestyle factors, diet and physical activity, and cardiometabolic health and infant growth during the first year of life. Our primary exposures of interest were overall maternal diet quality, percentage energy intake of core foods, total maternal physical activity and meeting recommended physical activity guidelines, with maternal cardiometabolic parameters assessed as secondary exposures. In particular, this study hypothesised that indicators of poorer maternal diet and physical activity behaviours would be associated with accelerated weight gain in infancy, aligning with the thrifty phenotype hypothesis.
Methods
Study design
This study was a sub-study within the Microbiome Understanding in Maternity Study (MUMS), a prospective longitudinal cohort study which primarily aimed to investigate the maternal and infant microbiome throughout pregnancy and the postnatal period. Reference Susic, Davis and O Sullivan28 This sub-study followed MUMS participants and their infants from early gestation to 12 months postpartum.
Population
The MUMS cohort recruited 117 women receiving pregnancy care at St George Hospital, Sydney, an area of high sociodemographic diversity, during 2018 and 2019. Inclusion criteria for MUMS were pregnant women ≥18 years, ≤13 weeks pregnant with sufficient English to answer questionnaires. Participants were excluded if they were pregnant with multiple fetuses, planning home birth or unable to give informed consent. Participants were excluded post-enrolment in the event of late miscarriage, stillbirth or fetus with abnormalities not compatible with life. Mother-infant dyads were followed to 12 months postpartum.
This sub-study included participants of the MUMS study with sufficient infant data to assess growth trajectories, defined as infant weight measurements taken at two or more distinct timepoints. Infants born preterm (GA<37 weeks), were excluded from this sub-study due to known differences in postnatal growth trajectories.
Data collection
Data was collected at regular intervals from enrolment until 12 months post-partum, including Trimester 1, Trimester 2, Trimester 3, birth, 6 weeks, 6 months and 12 months postpartum.
Infant outcomes
Primary outcomes measured were infant anthropometrics, including weight, length, and head circumference, measured according to standard procedures at 6 weeks, 6 months and 12 months postpartum. Birth weight, length, and head circumference were obtained from maternal eMaternity records. Infant weight-for-age, length-for-age, BMI-for-age, and weight-for-length z-scores were calculated at each timepoint, using the World Health Organisation Child Growth Standards for term infants. 29 Weight z-scores were used to determine infants who were large or small for gestational age (LGA or SGA), defined as birthweight z-score above 1.28 or below −1.28 respectively. 32 Changes in weight, weight-for-age z-score and length-for-age z-score were calculated from birth to 6 weeks, birth to 6 months, birth to 12 months, 6 weeks to 6 months and 6 to 12 months. Rapid weight gain (RWG) was also calculated, defined as an increase in weight-for-age z-score of >0.67 between timepoints, corresponding to the crossing of two centiles on growth charts. Reference Ong and Loos33 Conditional weight gain (CWG) was assessed to account for natural regression of infant growth to the mean. CWG was calculated using the standardised residuals of change in weight-for-age z-score between each timepoint, controlling for birthweight z-score, infant sex and infant age at time of measurement. Reference Cole34 Infant feeding method was collected using a questionnaire adapted from the Infant Feeding Questionnaire from the Growing Healthy Trial, categorised as breastfeeding, formula feeing and solids feeding. Reference Laws, Denney-Wilson and Taki35
Maternal outcomes
Maternal demographic and pregnancy information was collected at each study visit, including age, ethnicity, parity, gravidity, past medical, and obstetric history, results of the fasting and 2-h T2 glucose tolerance test and the presence of pregnancy complications such as GDM, gestational hypertension and preeclampsia. Pregnancy outcomes, including gestational age at delivery, mode of birth and infant sex were obtained from eMaternity records. Maternal weight, height and blood pressure were recorded at each visit. Body composition was assessed using the Tanita BC587 bioelectrical impedance scales (Tanita Corp., Tokyo, Japan). BMI was calculated at the trimester (T)1 visit (BMI = weight (kg) / height2 (m2)). GWG was calculated from T1 and T3 weight, and excessive GWG was assessed based on Institute of Medicine recommendations for each T1 BMI category. 36
Diet quality was assessed using the Australian Eating Survey (AES) at T1 and T3, a validated, self-administered food frequency questionnaire assessing diet quality over the past six months. Reference Collins, Boggess and Watson37 Results of this survey were compiled to calculate the Australian Recommended Food Score (ARFS), an overall summary of dietary quality. Reference Collins, Burrows and Rollo38 This ARFS was then used to classify dietary quality as either ‘Needs Work’, ‘Getting There’, ‘Excellent’ or ‘Outstanding’. Reference Collins, Burrows and Rollo38 Energy intake from core foods, which are components of a balanced diet according to the Australian Healthy Eating guide, was calculated from AES results at T1 and T3. 39 This was used to calculate percentage intake of energy from core foods through comparison with total energy intake.
Maternal physical activity was assessed at T1, T2 and T3 using the International Physical Activity Questionnaire – Long Form (IPAQ), a validated, self-administered survey assessing everyday physical activity, both incidental and planned, over the past seven days. Reference Craig, Marshall and Sjöström40 The IPAQ categorises physical activity as either vigorous, moderate or walking. Participants recorded both the number of days and duration on an average day of each level of physical activity, additionally recording the average hours spent sitting per day. Reference Craig, Marshall and Sjöström40 Each level of physical activity was assigned a MET weighting based on the 2000 Compendium of Physical Activities, representing the relative intensity of the activity compared to resting energy expenditure. Reference Ainsworth, Haskell and Whitt41 MET weighting, frequency and duration of physical activity were synthesised to calculate average MET-minutes per week, a validated score to summarise IPAQ results. Reference Craig, Marshall and Sjöström40 MET-minutes and IPAQ answers were then used to categorise each participant as either ‘Inactive’, ‘Minimally active’ or ‘Highly active’ according to IPAQ criteria. Additionally, participants’ physical activity was assessed according to whether they met the Centre for Disease Control and Prevention(CDC) and American College of Sports Medicine(ACSM) guidelines of greater than 150 min of moderate–vigorous activity per week. Reference Craig, Marshall and Sjöström40
Statistical analysis
Statistical analysis was conducted using IBM SPSS Statistics version 26.0 (Chicago, IL). Participant characteristics were summarised using descriptive statistics. To control for IPAQ completion errors, survey outliers were identified using the statistical interquartile range method (outliers defined as total MET minutes/week score > quartile 3 + 1.5x IQR, or score < quartile 1 + 1.5x IQR) and removed. 42 Primary maternal exposures studied were maternal overall diet quality, percentage energy intake from core foods, maternal total physical activity and meeting recommended physical activity guidelines. Maternal cardiometabolic exposures were assessed as secondary exposures. Multiple linear regression modelling was used to investigate associations between maternal factors and infant outcomes of weight gain, change in weight-for-age z-score, change in length-for-age z-score, RWG and CWG between each timepoint, controlling for key potential confounders. Confounders adjusted for were maternal parity, T1 BMI, GWG, infant sex and gestational age, and breastfeeding at time of outcome measurement. Binary logistic regression was used to test associations between maternal outcomes and RWG for adjusted models. Multicollinearity between confounders and outcomes tested, as well as between outcomes within each survey, was assessed using variance inflation factor in regression analysis, and controlled for through removal of variables with a variance inflation factor greater than 5. Reference James, Witten, Hastie and Tibshirani43 Statistical significance for all tests was taken at p < 0.05.
Results
Cohort characteristics
Of the 117 recruited MUMS participants, 87 were included in this study (Fig. 1). The median [IQR] age of included infants at each visit was 6.3 weeks [0.7 weeks] at the 6-week visit, 6.2 months [0.4 months] at 6 months, and 12.5 months [0.7 months] at 12 months.
Flow of participants through the MUMS study.

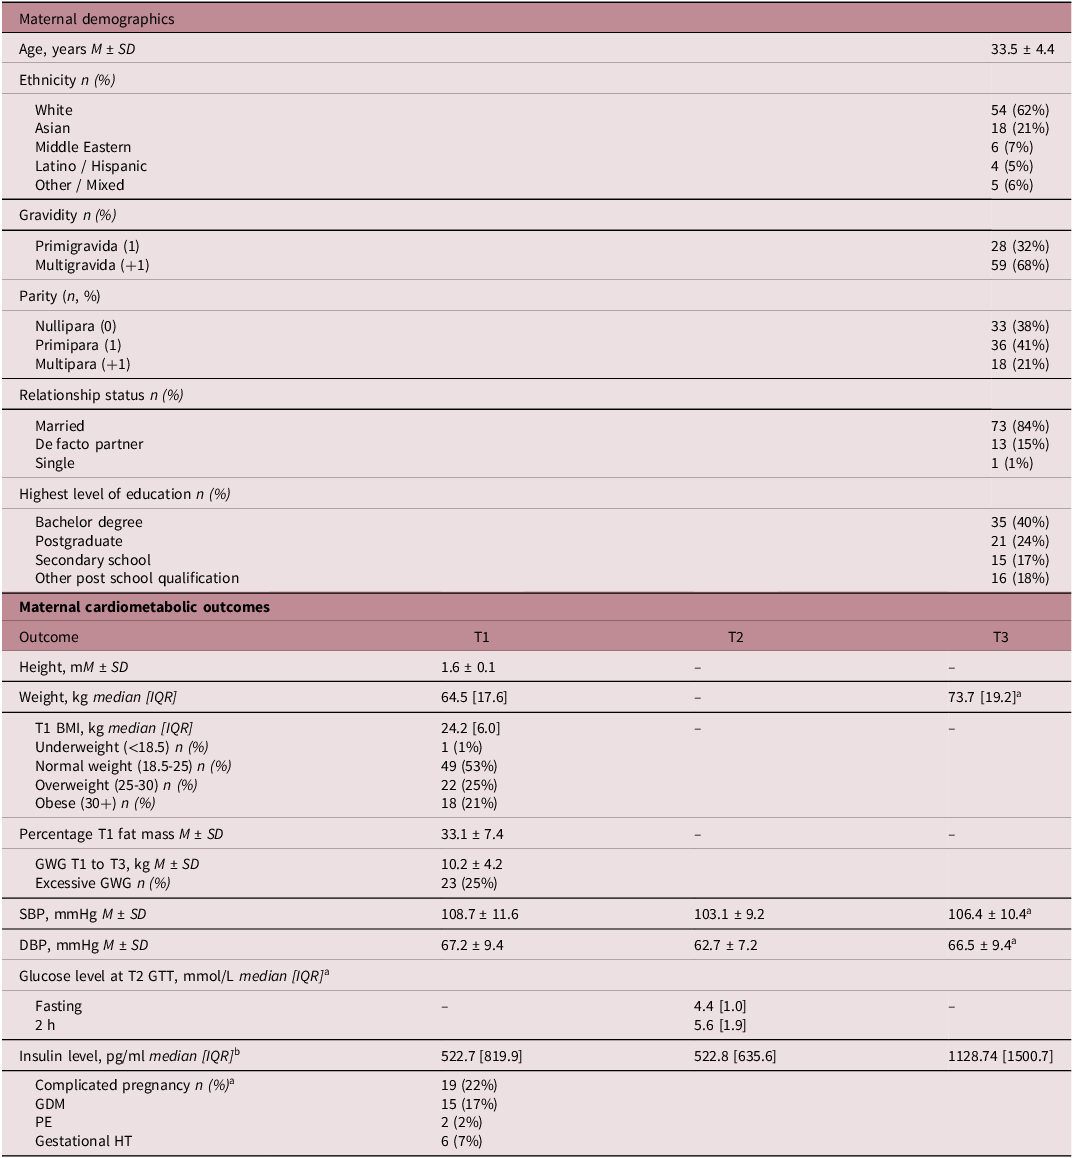
Maternal characteristics are summarised in Table A1. On average (mean ± standard deviation), mothers included in this study were 34 years old (33.4 ± 4.4), of white ethnicity (62%) and having their second or subsequent child (68%). Median [IQR] BMI at T1 was 24.2 [6.0] and women gained 10.2 ± kilograms from T1 to T3. Excessive GWG was identified in 25% of participants. Complications were present in 22% of pregnancies, including GDM (n = 15, 17%), gestational hypertension (n = 6, 7%) and pre-eclampsia (n = 2, 2%).
Maternal diet and physical activity outcomes are summarised in Supplementary tables 2 and 3. The most common diet category was ‘needs work’ (T1: 39%, T3: 38%), however substantive proportions were in the ‘excellent’ or ‘outstanding’ categories (T1: excellent 21%, outstanding 17%, T3: excellent 28%, outstanding 21%). The average participant received 69% of total energy intake from core foods in T1, and 67% in T3. In all three trimesters, most women fell into the ‘minimally active’ physical activity category (T1: 53%, T2: 60%, T3: 57%), with 26-37% of women meeting recommended guidelines of 150 min of moderate–vigorous activity per week (T1: 367, T2: 26%, T3: 28%).
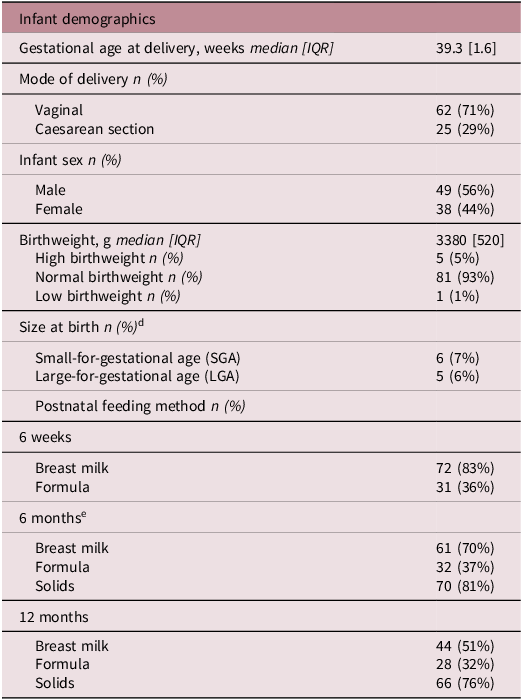
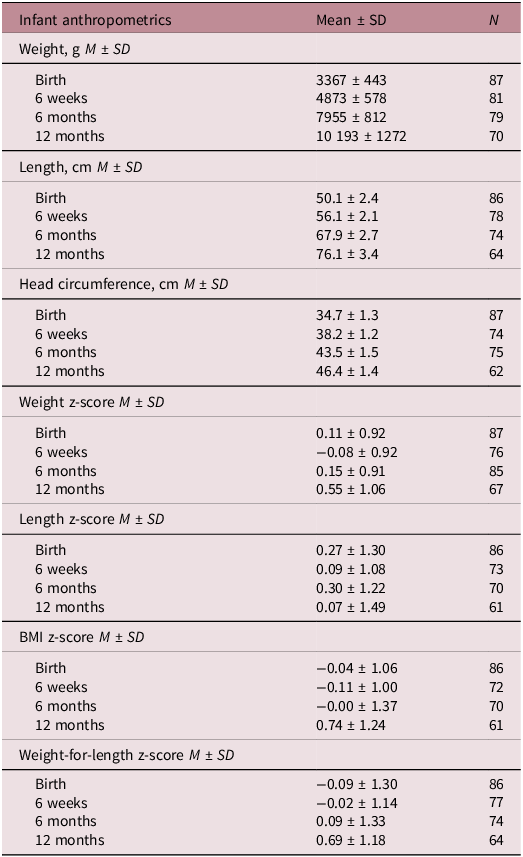
Most infants were born through vaginal delivery (71%) at term (gestational age median [IQR]: 39.3 weeks [1.6] (Table A2). Fifty-six percent of infants were male. Most infants were born at a normal weight for gestational age, with 6 born SGA (7%) and 5 LGA (6%). Infant anthropometrics and z-scores are presented in Table A2 and change in anthropometrics presented in Supplementary table 3. Additionally, infant feeding method is presented in Table A2, with the majority of infants being breastfed at each timepoint (6 weeks: 83%, 6 months: 70%, 12 months: 51%).
Associations between maternal cardiometabolic health and infant growth
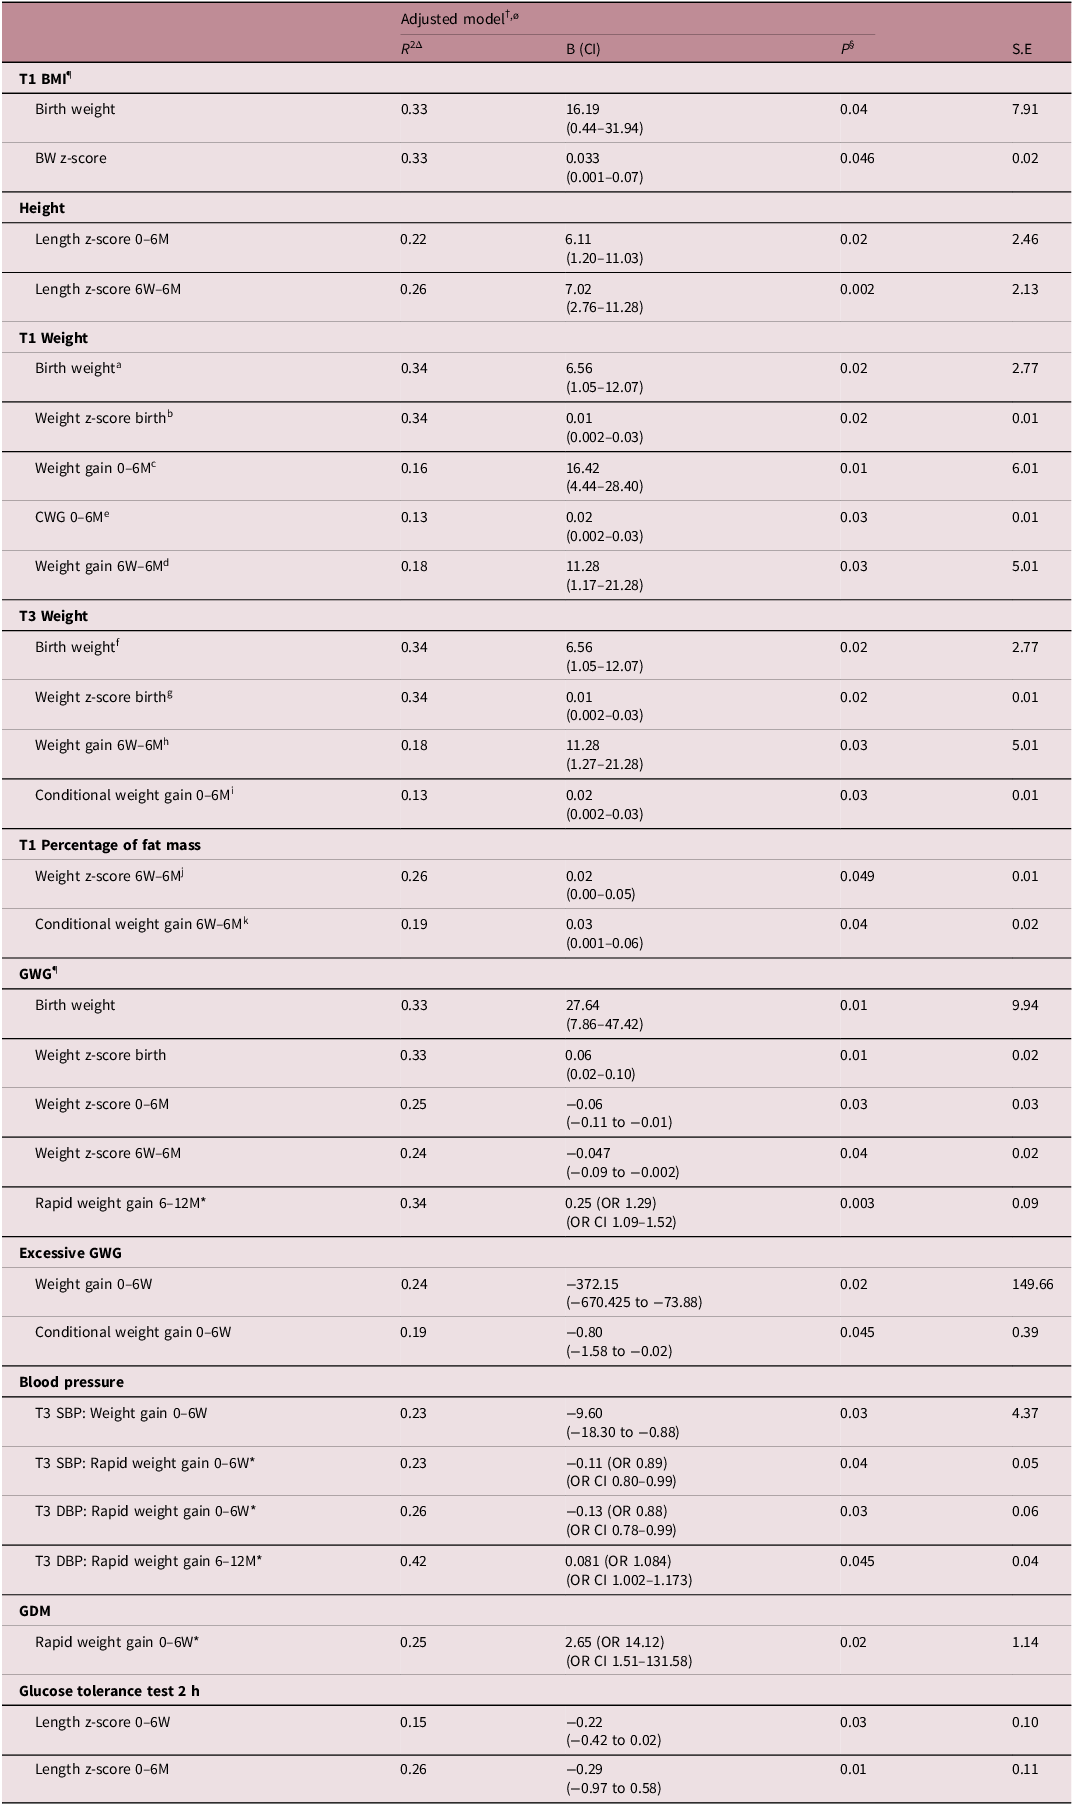
In adjusted models (Table A3), greater maternal T1 and T3 weight, BMI and GWG were significantly associated with increased infant birthweight and increased infant birthweight z-score. Maternal height was positively associated with infant length z-score gain from 0 to 6 months and 6 weeks to 6 months. Increased maternal weight in T1 was associated with increased infant weight gain and CWG from 0 to 6 months, as well as increased weight gain from 6 weeks to 6 months. Similarly, increased maternal weight in T3 was associated with increased CWG from 0 to 6 months and weight gain from 6 weeks to 6 months. Increased maternal fat mass in T1 corresponded to increased infant weight z-score change and CWG between 6 weeks and 6 months. When assessed continuously, greater maternal GWG was also significantly associated with increased infant weight z-score change from 0 to 6 months and 6 weeks-6 months, as well as more likely to experience RWG from 6 to 12 months. However, GWG categorised as excessive was associated with increased weight gain and CWG from 0 to 6 weeks.
Associations between maternal blood pressure and infant growth were mixed, however T3 systolic and diastolic blood pressure were negatively associated with RWG from 0 to 6 weeks. GDM exposed infants were more likely to experience RWG from 0 to 6 weeks. Finally, higher 2-h maternal glucose level during the T2 glucose tolerance test was associated with decreased change in length z-score at 0–6 weeks and 0–6 months. Maternal pre-eclampsia or gestational hypertension were not significantly associated with infant growth outcomes.
Associations between maternal lifestyle and infant growth
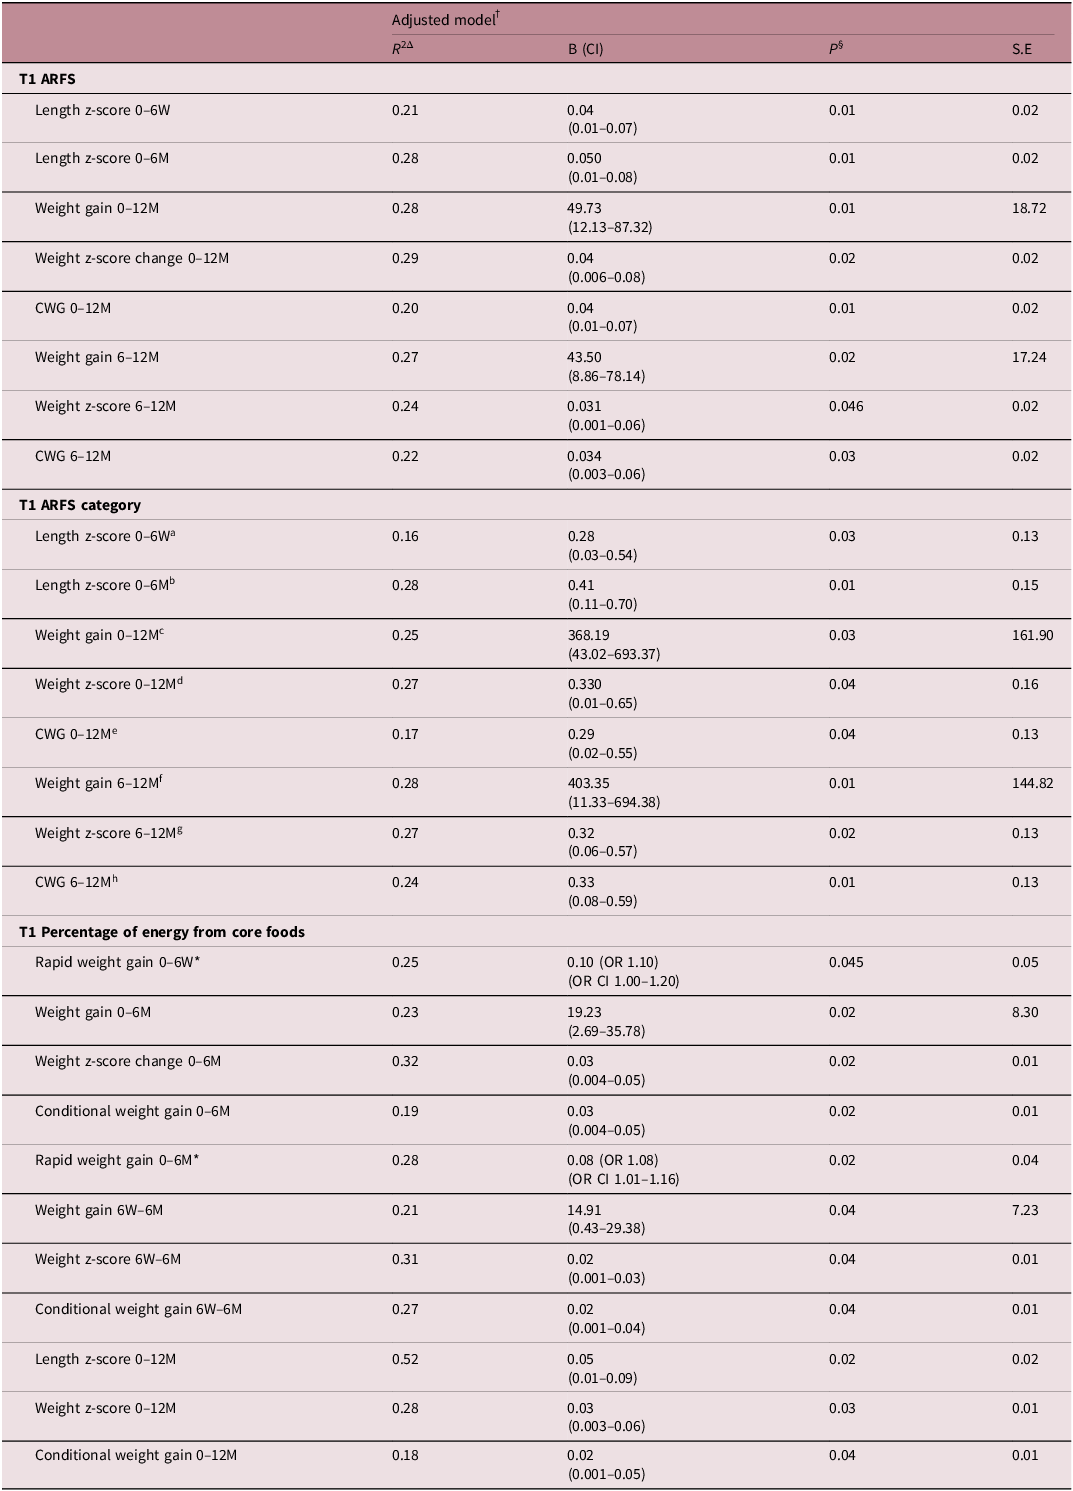
In adjusted models (Table A5), higher overall diet quality in T1 was significantly associated with increased infant weight gain, weight z-score change and CWG from 0 to 12 months, and 6 to 12 months. Additionally, higher overall diet quality was associated with increased change in infant length z-score from 0 to 6 weeks and 0 to 6 months. Similar associations were observed when looking at diet quality by category, however these exposures demonstrated significant multicollinearity (VIF > 5) (Table A5). Greater percentage of energy from core foods versus non-core foods in T1 was positively associated with RWG from 0 to 6 weeks, as well as increased weight accumulation from 0 to 6 months (weight gain, change in weight z-score, RWG and CWG) and 6 weeks to 6 months (weight gain, change in weight z-score and CWG). Greater percentage intake of core foods in T1 was also associated with increased infant growth from 0 to 12 months (change in weight z-score, CWG and change in length z-score). Maternal diet in T3 was not significantly associated with infant growth in adjusted models.
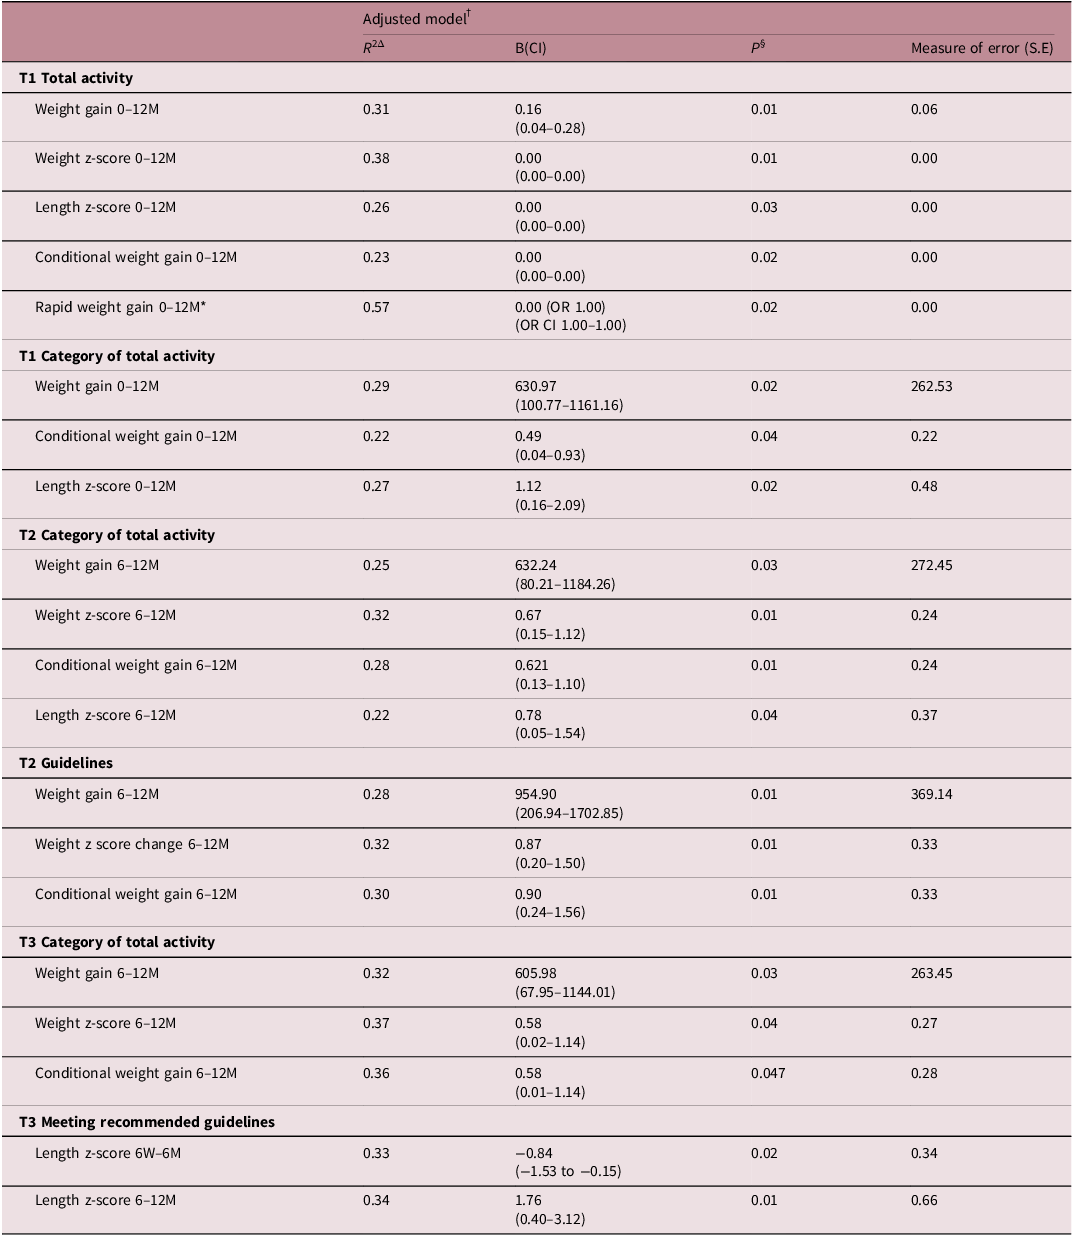
Increased maternal total activity in T1 was associated with increased infant weight gain, change in weight z-score, CWG, and RWG, as well as, change in length z-score from 0 to 12 months (Table A6). Similarly, higher category of maternal activity in T1 was associated with increased infant weight gain, CWG and change in length z-score from 0 to 12 months. Whilst total T2 activity was not significantly associated with infant growth when assessed continuously, a higher category of maternal activity in T2 was linked to increased weight gain, change in weight z-score, CWG and change in length z-score from 6 to 12 months. Additionally, meeting the recommended activity guidelines was associated with increased weight accumulation from 6 to 12 months (weight gain, weight z-score change and CWG). Finally, in T3, a higher category of maternal physical activity was associated with increased weight gain, change in weight z-score and CWG from 6 to 12 months. Meeting recommended activity guidelines in T3 was associated with greater change in length z-score from 6 weeks to 6 months and 6 to 12 months.
Discussion
Main findings
Overall, our study demonstrates that the maternal antenatal environment is associated with infant growth in the first year of life, consistent with the DOHaD hypothesis. However, different trends were observed in cardiometabolic compared with lifestyle outcomes, which may reflect different mechanisms by which infant growth is influenced. Interestingly, maternal cardiometabolic parameters were predominately associated with infant growth from 0 to 6 months whereas maternal diet and activity parameters were associated with infant growth over the first year of life, particularly from the 6 to 12 month period.
In our study, indicators of cardiometabolic health risks were associated with increased infant growth from birth to 12 months, particularly within the first 6 months of life. Maternal weight, fat mass and GWG were associated with increased infant weight accumulation, primarily from 0 to 6 months, demonstrating associations with weight gain, weight z-score change and CWG. GWG categorised as excessive was only significantly associated with increased weight accumulation from 0 to 6 weeks, which could be consistent with initial accelerated growth in response to adverse in-utero environments. Interestingly, markers of adverse cardiometabolic risk, such as increased GWG and GDM were also associated with RWG, findings which align with the thrifty phenotype hypothesis of accelerated growth in response to adverse in-utero environments.
In contrast, indicators of a healthier maternal lifestyle were associated with increased infant growth. Higher maternal diet quality and greater percentage intake of core foods in T1 were associated with infant growth from birth to 12 months. Core foods are those considered to be components of a healthy, balanced diet according to the Australian Healthy Eating guide, and thus their significance supports the importance of overall diet quality. 39 T3 diet was not associated with infant growth, potentially indicating the importance of the early gestational period. Maternal total physical activity was also associated with increased growth in each trimester, mostly from 6 to 12 months. This was reflected in associations between greater activity across each trimester and infant length, as well as weight parameters.
Interpretation of findings
Our findings are consistent with the thrifty phenotype hypothesis, in which higher risk maternal cardiometabolic environments prime infant metabolic development to maximise growth, predisposing infants to excessive growth trajectories in the post-natal environment. This is supported by numerous previous studies. Retnakaran et al. (2017) demonstrated increased birthweight in infants of mothers with greater pre-pregnancy BMI and GWG. Reference Retnakaran, Wen and Tan13 Maternal GWG and pre-pregnancy weight have also been associated with excessive postnatal growth, as Fraser et al. (2010) demonstrated associations with infant BMI which persisted to 9 years of age. Reference Fraser, Tilling and Macdonald-Wallis17 Montazeri et al. (2018) synthesised both prenatal and postnatal outcomes, demonstrating that maternal obesity was associated with accelerated weight gain in both HBW and LBW infants, whilst GWG was associated with increased HBW and accelerated postnatal growth. Reference Montazeri, Vrijheid and Martinez16 These relationships have also been investigated in animal studies, identifying shifts in gene expression in infants of mothers with obesity, as well as the reversal of infant impacts through maternal weight loss. Reference Nathanielsz, Ford and Long14,Reference Panchenko, Voisin and Jouin44,Reference Panchenko, Lacroix and Jouin45 Thus, our results support existing evidence that increased maternal weight and greater GWG may lead to accelerated postnatal growth in infants.
Conversely, our observed associations between improved maternal lifestyle and increased growth are not in line with the thrifty phenotype hypothesis, which would expect increased growth velocities to be evident in association with poorer maternal lifestyle. This is consistent with previous research, as most studies have not detected evidence to support the thrifty phenotype hypothesis in nutritional or activity exposures. Reference Hayes, McParlin and Azevedo26,Reference Raab, Michel, Günther, Hoffmann, Stecher and Hauner27 In the LIMIT trial (2014), Dodd et al. reported that maternal dietary interventions reduced the risk of HBW infants, but follow-up at 6 and 18 months of age failed to detect a significant impact on the number of infants with BMI above the 90th centile. Reference Dodd, McPhee and Deussen46-Reference Dodd, Louise and Deussen48 Similarly, Rauh et al. (2015) described decreased infant weight at 12 months as a result of maternal dietary intervention, however this did not reach statistical significance. Reference Rauh, Gunther, Kunath, Stecher and Hauner49
While most recent studies have failed to demonstrate any significant associations, our study unexpectedly found associations between healthy lifestyle indicators, and increased infant growth velocities. This is potentially due to differences in study design and outcomes, as previous studies have focused on assessing the influence of lifestyle interventions, rather than existing lifestyle behaviours. Reference Hayes, McParlin and Azevedo26,Reference Raab, Michel, Günther, Hoffmann, Stecher and Hauner27 Previous studies have specifically recruited participants from high cardiometabolic risk groups, such as maternal obesity, excessive GWG and GDM, and measured infant adiposity outcomes of BMI, abdominal circumference and skinfold thickness. Reference Raab, Michel, Günther, Hoffmann, Stecher and Hauner27 Alternatively, while interventions to reduce undernutrition have demonstrated positive associations between improved nutrition and growth, these were only significant in the prevention of infant LBW, SGA and fetal growth restriction. Reference Gresham, Byles, Bisquera and Hure50,Reference Krebs, Hambidge and Westcott51 Thus, previous studies have centred around the role of extremes of lifestyle behaviours in modulating established cardiometabolic risk, and are therefore targeted to test the presence of ‘catch up’ growth trajectories in conditions known to create adverse prenatal environments. In contrast, this study investigates lifestyle behaviours in a general obstetric population. Indeed, our recruitment led to a sample with a high proportion of pregnancy complications and cardiometabolic risk factors, consistent with recent population trends. Such recent trends demonstrate the increasing importance of understanding the impact of maternal health and lifestyle on infants.
Our findings may also demonstrate the influence of healthy maternal lifestyle behaviours in promoting age-appropriate postnatal infant growth. This is reinforced by associations with infant length as well as weight, supporting the possibility that the increased growth observed reflects age-appropriate growth rather than increased growth trajectories. While this trend is not commonly presented in the literature, other studies have demonstrated positive relationships between healthier lifestyle behaviours and increased infant birthweight. Reference Chia, Chen and Lai52-Reference Clapp, Kim, Burciu and Lopez54 Clapp et al. (2000) demonstrated that maternal physical activity intervention before 16 weeks’ gestation was associated with increased infant birth weight and length, supporting the increased importance of early gestational influences observed in this study. Reference Clapp, Kim, Burciu and Lopez54 In disagreement with this though is our finding that greater intake of core foods in T1 was associated with RGW in infants from 0 to 6 months which conflicts the picture of healthy, age-appropriate growth. However, few studies have assessed associations between maternal lifestyle and infant growth beyond the neo-natal period. Thus, the lack of research surrounding the influence of healthy maternal lifestyles on infant growth into the first year of life may explain our unexpected findings.
Strengths and limitations
Strengths of this study include the broad scope of maternal outcomes measured, allowing for a detailed exploration of maternal influences on postnatal growth. Growth was analysed using appropriate growth standards, and using change in anthropometry rather than isolated measurements. Reference Woo4,Reference Villar, Giuliani and Bhutta30 This increases the study’s ability to assess changes in ongoing growth trajectories more accurately. Additionally, RWG and CWG were included, which can better detect weight changes independent of natural fluctuations in infant growth and regression to the mean. Reference Woo4,Reference Cole34 This is especially important for the 6-week timepoint, as the first 6 weeks of life is known to be a tumultuous period as the infant adapts to early postnatal life. However, it should be noted that RWG was assessed through use of odds ratios, which may overestimate associations with timepoints where RWG was common. Assessment of growth through this period was additionally strengthened using multiple regression to control for common prenatal and postnatal confounders.
However, this study has several limitations. Self-reported lifestyle surveys have been shown to overreport quality of maternal diet and physical activity, relying on participants to both accurately recall and report behaviours. Reference Bauman, Ainsworth and Bull55 While the AES considers diet over the past six months, the IPAQ assesses activity over the past week only, capturing a limited snapshot of behaviours which may not reflect fluctuations in activity throughout pregnancy. The IPAQ long form is vulnerable to completion errors and tends to overestimate activity. This was controlled for through statistical removal of outliers, however this method was unable to eliminate all overreported activity, especially overreporting of low activity. Activity level was additionally compared within the cohort, rather than solely categorised as high, moderate or low, to reduce confounding by overreporting of the entire cohort. Additionally, neither the AES or IPAQ is specifically designed for pregnant populations, and thus may fail to capture unique influences of the pregnancy period on lifestyle behaviours. Despite these limitations, both the AES and IPAQ are validated tools for assessing lifestyle behaviours in an Australian cohort, which have been previously utilised in pregnant populations, and were therefore appropriate for use in this study. Reference Collins, Boggess and Watson37,Reference Craig, Marshall and Sjöström40 However, this study is an Australian-based, single centre study, with predominately participants from White and Asian ethnicities and relatively highly education levels, and thus generalisability may be limited beyond this demographic.
Additionally, due to the large number of included variables included, some observed associations were likely the result of type 1 error, and thus our results should be interpreted with caution. Associations due to chance were controlled for through multiple regression analysis, testing for the presence of associations independent of common confounders. However, whilst key confounders known to influence infant growth were selected, the number of exposures controlled for was limited by the sample size of the study, and thus additional factors may still confound our results, including diagnosis of gestational diabetes. Similarly, the power of this study to detect associations was limited by sample size. For example, low rates of pregnancy complications such as pre-eclampsia, gestational hypertension and excessive GWG may have limited the ability of the study to demonstrate significant associations between high-risk pregnancy environments and infant growth. Another limitation was the multicollinearity between outcomes. Although impossible to fully eliminate, variance inflation factors were assessed, and variables with the highest multicollinearity removed.
Clinical significance and conclusion
Maternal health and lifestyle are associated with infant growth in early life, which has implications for ongoing infant health and non-communicable disease risk. Given the increasing prevalence of non-communicable disease throughout the course of life, greater understanding of the influence of the prenatal environment is required to direct future interventions to maximise infant health. Pregnancy presents a unique opportunity for optimising maternal health and lifestyle behaviours to ensure healthy infant growth and reduce the risk of future disease.
Overall, this study reinforces the importance of optimising maternal cardiometabolic health in preventing excessive infant growth, providing additional support for the DOHaD hypothesis. Additionally, this study found positive associations between maternal lifestyle and infant growth, potentially demonstrating that infant growth is programmed through healthy maternal lifestyles as well as through the unhealthy lifestyles which have formed the basis of previous research. Future research is required to confirm findings, and test associations in broader cohorts with larger sample sizes and greater complication rates. Longer follow-up throughout childhood is required to confirm existing trends, as well as investigate associations between growth trajectories and future health sequelae.
Supplementary material
The supplementary material for this article can be found at https://doi.org/10.1017/S2040174425100378.
Acknowledgements
We acknowledge the team who contributed to data collection and previous research within the MUMS study, including midwives on the labour and post-natal wards, antenatal clinical staff, previous researchers and students based at St George Hospital. We would also like to thank the participants involved in the MUMS study.
Financial support
Funding for the MUMS study was provided by the St George and Sutherland Medical Research Foundation, and Royal Australian and New Zealand College of Obstetricians and Gynaecologists (Grant number: UNSW RG 188959).
Competing interests
No authors involved have a conflict of interest to disclose.
Ethical standards
The MUMS study received ethics approval from the South Eastern Sydney Local Health District Research Ethics Committee (17/293 (HREC/17/POWH/605)). Registration number ACTRN12618000471280. All participants gave written informed consent for themselves and their infant.
Appendix
Maternal demographic and cardiometabolic outcomes

Abbreviations: BMI, body mass index; DBP, diastolic blood pressure; g, grams; GDM, gestational diabetes mellitus; GTT, glucose tolerance test; GWG, gestational weight gain; HT, hypertension; IQR, interquartile range; kg, kilograms; M, mean; m, metres; mmHg, millimetres of mercury; mmol/L, millimoles per litre; n, number of participants; SBP, systolic blood pressure; SD, standard deviation; T1, trimester 1; T2, trimester 2; T3, trimester 3.
Missing data: a n = 5. cT1 n = 3, T2 n = 1, T3 n = 2.
Infant demographics

Abbreviations: g, grams; IQR, interquartile range; LGA, large for gestational age; n, number of participants; SGA, small for gestational age.
Infant anthropometrics

Abbreviations: cm, centimetres; g, grams; M, mean; n, number of participants; SD, standard deviation; 6W, 6 weeks; 6M, 6 months; 12M, 12 months.
Associations between maternal cardiometabolic health outcomes and infant growth in multiple regression analysis

Note: Please note in the interest of clarity of data only significant findings are included in this table.
Abbreviations: B, beta coefficient; BMI, body-mass index; CI, confidence interval; DBP, diastolic blood pressure; GDM, gestational diabetes mellitus; GWG, gestational weight gain; M, months; OR, odds ratio; R 2, R squared (coefficient of determination); SBP, systolic blood pressure; S.E, standard error; SGA, small for gestational age; T1, trimester 1; T2, trimester 2; T3, trimester 3; W, weeks.
†Adjusted model controlled for maternal parity, T1 BMI, GWG, infant gestational age, infant sex and breastfeeding at time of outcome measurement.
øAdjusted model for birth outcomes controlled for maternal parity, T1 BMI, GWG, infant gestational age, infant sex.
ΔCoefficient of determination (R 2) presented for multiple regression analyses refers to adjusted model as a whole, rather than individual outcome assessed.
§Significance taken at p < 0.05.
¶Outcome was not assessed as a confounder in adjusted models due to being the variable tested.
*Analysed using binary logistic regression. R 2 value is Nagelkerke R Square approximation, and odds ratio presented with confidence intervals for odds ratio.
Multicollinearity: T1 BMI removed from adjusted model due to significant multicollinearity. a Variance inflation factor (VIF) 7.46, bVIF, cVIF 7.68, dVIF 8.07, eVIF 8.06, fVIF 7.95, gVIF 7.95, hVIF 8.21, iVIF 8.44, jVIF 5.37, kVIF 5.37.
Associations between maternal diet and infant growth in multiple regression analysis

Abbreviations: R 2, R squared (coefficient of determination); B, beta coefficient; CI, confidence interval; ARFS, Australian recommended food score; M, months; OR, odds ratio; S.E, standard error; T, trimester; W, weeks.
§Significance taken at p < 0.05.
*Analysed using binary logistic regression. R 2 value is Nagelkerke R Square approximation. Odds ratio presented with confidence interval for odds ratio.
Multicollinearity: Significant multicollinearity of T1 ARFS category with T1 ARFS. aVariance inflaction factor (VIF) aVIF = 9.05, bVIF = 9.53, cVIF = 8.63, dVIF = 8.63, eVIF = 8.63, fVIF = 8.67, gVIF = 8.67, hVIF = 8.67.
Associations between maternal physical activity and infant growth in multiple regression analysis

Note: Please note in the interest of clarity of data only significant findings from adjusted models are included in this table.
Abbreviations: R 2, R squared (coefficient of determination); B, beta coefficient; CI, confidence interval; M, months; OR, odds ratio; S.E, standard error; T, trimester; W, weeks.
§Significance taken at p < 0.05.
*Analysed using binary logistic regression. R 2 value is Nagelkerke R Square approximation. Odds ratio presented with confidence interval for odds ratio.


 Open access