


1 Introduction
Many individuals experience problems understanding and preparing for low-probability/ high-impact risk, like natural disasters and pandemics (Reference Camerer and KunreutherCamerer & Kunreuther, 1989). This could be explained by a lack of direct experience of these events, which gives little opportunity for learning about their consequences. In addition, heuristics, i.e., mental shortcuts or rules of thumb used to evaluate decisions in daily life, may lead to systematic biases (Reference KahnemanKahneman, 2003) when applied to more complex decision-making, including the evaluation of low-probability/high-impact risks. Individuals tend to treat the probability of experiencing a rare event as zero, which has been called the “It won’t happen to me” effect (Reference Ert, Erev and BierErt & Erev, 2018). The under-weighting of low-probability disaster risks can have devastating consequences, when individuals are unwilling to insure or prepare for such events because they perceive the probability of the risk to be below a subjective level of concern (Reference Slovic, Fischhoff, Lichtenstein, Corrigan and CombsSlovic et al., 1977; Reference Robinson and BotzenRobinson & Botzen, 2018). The challenge for policy makers is thus to stimulate preparedness before an event has happened, and inform citizens about the probability and possible consequences of these potentially devastating events.
A relatively new technology that can be used for risk communication is immersive virtual reality. In a high-immersive virtual reality (VR) environment, users can interact with a computer simulated three-dimensional environment by using special equipment, such as a head mounted display with stereoscopic view (Reference InnocentiInnocenti, 2017). VR experiments offer unique advantages, such as the combination of experimental control and increased naturalistic context, as well as the option to test situations that would not be possible or ethical in the real world, which is of particular importance in disaster risk communication (Reference Mol, Botzen and BlaschMol, 2019). The current paper uses virtual reality technology to examine whether a simulated disaster can stimulate people to invest in risk reducing measures.
The focus of this paper is on flooding, which is one of the most deadly and most damaging natural disasters in the world (UNISDR, 2017). Nevertheless, people generally under-insure (Reference GallagherGallagher, 2014) and under-prepare (Reference Meyer and KunreutherMeyerKunreuther, 2017) for flooding. An important cognitive bias for the evaluation of flood risks is the availability heuristic, which implies that the perceived probability of an event is related to the ease of recall. Direct experience or salient media footage (Reference Hong, Kim and XiongHong et al., 2019) may therefore inflate subjective probabilities of certain events. This bias can be particularly powerful in combination with strong affective feelings toward risk, such as worry (Reference Loewenstein, Hsee, Weber and WelchLoewenstein et al., 2001). Here, we aim to take advantage of the availability heuristic and investigate the possibility to boost risk perception, coping appraisal, negative emotions and damage-reducing behavior through a flooding experience in a high-immersive VR environment.
A large body of literature has revealed that individuals who have experienced a disaster invest significantly more in preventive measures than those who live in analogous areas but lack direct disaster experience (Reference Grothmann and ReusswigGrothmann & Reusswig, 2006; GuoLi, 2016; Reference OsberghausOsberghaus, 2017). For example, (Reference O’Neill, Brereton, Shahumyan and ClinchO’Neill et al., 2016) found a positive relationship between previous flood experience and perceived flood risk, using 305 face-to-face interviews of the Irish population on the banks of the river Dargle, in the vicinity of Dublin. Similarly, (Reference McGee, McFarlane and VargheseMcGee et al., 2009) examined the influence of wildfire hazard experience on the adoption of mitigation measures among homeowners in Canada and found that participants who had stayed in their houses during the fire were more likely to adopt mitigation measures post-fire. The relationship between past experience of a disaster and disaster preparedness seems to be driven by strong negative emotions associated with the experienced event, while effectiveness and cost considerations also play a role (Reference Siegrist and GutscherSiegrist & Gutscher, 2008).
For many empirical studies on flood preparedness, it is difficult to draw causal conclusions due to the cross-sectional nature of these studies. One solution is to use longitudinal surveys which follow respondents over a longer period of time, for example during and several months after a major event (Reference Kellens, Terpstra and De MaeyerKellens et al., 2013; Reference SiegristSiegrist, 2012), despite the challenges of such a method (Reference Hudson, Thieken and BubeckHudson et al., 2020). A second solution is to carefully mimic risks and consequences in games, by using controlled lab experiments, which can be incentivized to mimic the large monetary consequences of a natural disaster (Reference Mol, Botzen and BlaschMol et al., 2020a; Reference Mol, Botzen and BlaschMol et al., 2020b). One drawback of lab experiments is that damage consists solely of a monetary component, which does not resemble the full experience of real-world flood damage, which may include a strong emotional component.
VR allows experimenters to safely expose participants to various virtual risks and to investigate the responses. For example, (Reference Fiore, Harrison, Hughes and RutströmFiore et al., 2009) showed that low immersive VR scenarios can help people to evaluate risks of natural disasters more accurately. (Reference Bakker, Kerstholt, van Bommel and GiebelsBakker et al., 2019) exposed participants to a virtual reality environment with a truck accident, in which two victims were visible. Participants were confronted with either statistical information or narrative information about the risk of moving victims. The authors found that in this crisis communication scenario, narrative information was much more powerful than statistical information. (Reference Chittaro, Sioni, Crescentini and FabbroChittaro et al., 2017) compared risk attitudes of participants in two different high immersive virtual reality environments: one with mortality cues (a cemetery) and a control environment without these cues (a public park). They found that participants in the virtual cemetery had higher attitudes towards risk, as well as higher arousal. (Reference NowakNowak et al., 2020) used an immersive VR intervention to increase understanding for influenza immunization concepts in US adults. The authors showed that the VR intervention increased concern about transmitting influenza to others and flu vaccination intentions, compared to alternative risk communication methods (i.e., video and electronic story board shown on a tablet). In the domain of flood risk, VR has been used to examine interventions for effective flash flood evacuation (Reference Fujimi and FujimuraFujimi & Fujimura, 2020).
Another computer-assisted method to stimulate disaster preparedness is serious gaming (Reference Feng, González, Amor, Lovreglio and Cabrera-GuerreroFeng et al., 2018,Reference Ritterfeld, Cody and VordererRitterfeld et al., 2009), that is, games intended and presented as educational interventions. In such a serious computer game, participants are confronted with a series of tasks in varying levels of difficulty to learn the appropriate behavior, such as fire evacuation behavior (Reference Ooi, Tanimoto and SanoOoi et al., 2019), earthquake response behavior (Reference Li, Liang, Quigley, Zhao and YuLi et al., 2017), awareness of landslides (Reference FelicioFelicio et al., 2014) and flood prevention knowledge (Reference Tsai, Chang, Shiau and WangTsai et al., 2019). (Reference Fox, McKnight, Sun, Maung and CrawfisFox et al., 2020) used a serious game to communicate about the risks of environmental pollution. They found that an interactive version of the game, in which pollution of a river was contingent on clean-up efforts by participants, increased self-efficacy of pro-environmental behavior as well as support for environmental policy after the experiment. So far, most serious gaming studies have used monitors to display all video, although immersive VR serious gaming is on the rise, and might prove even more effective (Reference PerreaultPerreault, 2017). The current experiment can be classified as a serious game, as it educates people while also including game-like tasks.
2 Hypotheses
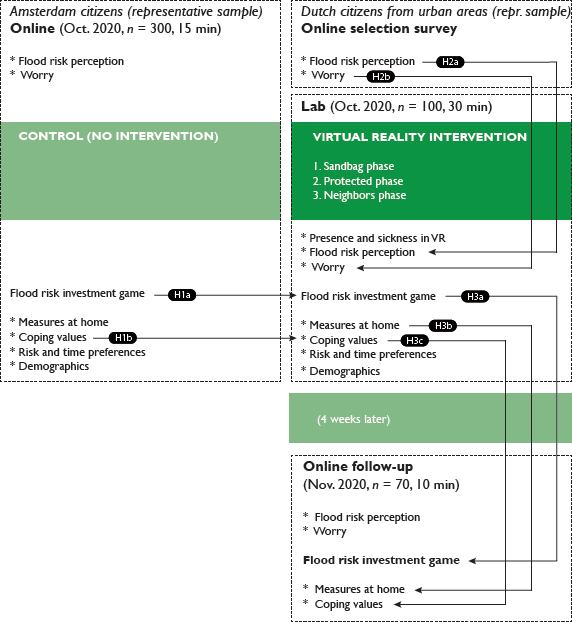
In the current study we use a high-immersive VR environment to have participants experience the impact of a flood to a typical Dutch home. An important novelty of the current set-up is that we study the persistence of the effects by carrying out a follow-up survey 4 weeks after the VR intervention. This follow-up survey includes not only survey questions on psychological determinants, but repeats the flood risk investment game, an existing economic game to measure flood preparedness behavior (Reference Mol, Botzen and BlaschMol et al., 2020b). We use a panel company to recruit citizens from the Amsterdam area to participate in a VR experiment in the lab (henceforth: VR intervention sample). We compare our results to an online experiment including the flood risk investment game (henceforth: Control sample). We aimed to collect data of the Control sample from the same population of the VR intervention sample (citizens from the Amsterdam area), but when the sample was saturated the panel company invited respondents from other urban areas in the Netherlands under similar objective flood risk. We used the same set of survey questions and the same parameters of the flood risk investment game, to facilitate comparison across the samples.
Figure 1 gives an overview of our design and the seven pre-registered hypotheses. First, based on the findings reported in (Reference Chittaro, Sioni, Crescentini and FabbroChittaro et al., 2017) and (Reference Bakker, Kerstholt, van Bommel and GiebelsBakker et al., 2019), we predict that participants who experienced the VR intervention will invest more in the subsequent flood risk investment game.
Overview of design and hypotheses.
Hypothesis 1a:
Participants in the VR intervention sample invest more in damage-reducing measures in the flood risk investment game than the control sample.
The VR intervention shows several ways to prepare a home against flood damage (methodological details below). One way through which virtual reality could be particularly effective in stimulating disaster preparedness is through self-efficacy and response efficacy. These coping values seem to be among the most important determinants of disaster preparedness (Reference Botzen, Kunreuther, Czajkowski and MoelBotzen et al., 2019; Reference Bubeck, Botzen and AertsBubeck et al., 2012; Reference Grothmann and ReusswigGrothmann & Reusswig, 2006) but it remains unclear how they can be enhanced. When subjects experience a risk in VR, as well as the appropriate response, this might help them to realize that they are able to implement these measures (self-efficacy) and that the measures are indeed effective (response efficacy).
Hypothesis 1b:
Participants report higher coping values in the VR intervention sample than in the control sample.
A second set of hypotheses tests the direct effect of the VR intervention on risk perceptions and emotions, by comparing answers from the pre- and post-intervention surveys. Previous research has shown that short VR interventions can have meaningful effects on attitudes and knowledge right after the intervention (Reference Midden and HamMidden & Ham, 2018). For example, (Reference Fonseca and KrausFonseca & Kraus, 2016) exposed participants to some short 360∘ clips with emotional content, to show the consequences of meat-eating. The results demonstrated that the immersion and emotional impact of the VR clips enhanced pro-environmental attitudes and decreased post-experimental meat-eating. (Reference Markowitz, Laha, Perone, Pea and BailensonMarkowitz et al., 2018) used virtual reality as an education medium to explain about the consequences of climate change and ocean acidification in particular. The results showed large knowledge gains and some more positive attitudes towards the environment after the VR experience. We predict an increase in risk perceptions and worry towards flooding directly after the VR intervention.
Hypothesis 2a:
Participants report higher risk perceptions after the VR intervention than in the pre-intervention survey.
Hypothesis 2b:
Participants report higher worry after the VR intervention than in the pre-intervention survey.
The third group of hypotheses concerns the persistence of the effects. The main outcome variable is investment in the flood risk investment game. We predict that respondents invest similarly in the game in the follow-up survey as right after the VR intervention.
Hypothesis 3a:
Participants invest similarly in damage-reducing measures in the flood risk investment game in the follow-up survey as right after the VR intervention.
In addition to behavior in the flood risk investment game, we examine prevention behavior in real life, by analyzing the number of flood risk mitigation measures respondents report to have installed (or intend to install) at home. A recent related study used a high-immersive virtual reality experience of a kitchen fire to stimulate people’s fire prevention behavior and contrasted this with text-based fire prevention instructions (Reference Jansen, Snijders and WillemsenJansen et al., 2020). The authors measured several psychological determinants of prevention behavior, such as knowledge, perceived risk (vulnerability) and self-efficacy, as well as actual prevention behavior in the form of investing the show-up fee in a fire blanket and taking home flyers about fire safety. The authors found a direct positive effect of the VR experience on actual prevention behavior, and strongly recommend to study the actual target behavior as well as psychological determinants of preventive behavior. The current study measures implemented mitigation at home, both in the pre-intervention survey as well as in the follow-up survey several weeks after the VR intervention. This design allows us to test whether the VR experience translates into the actual target behavior (i.e., increased flood preparedness).
Hypothesis 3b:
Participants report more flood risk mitigation measures installed (or intended) in the follow-up survey as before the VR intervention.
Recent research finds that information provided through a VR experience leads to more knowledge retention than information provided through static communication methods (Reference Jansen, Snijders and WillemsenJansen et al., 2020). Building on this research, we expect that participants will remember the VR experience at the time of the follow-up survey, and that coping values do not decline over time.
Hypothesis 3c:
Participants report similar coping values in the follow-up survey as right after the VR intervention.
3 Method
The preregistration for this study is available on open science framework (OSF): https://osf.io/5snem/. The study materials and data are available here: https://osf.io/9e8vu/. The experiment was conducted in October 2020, while the corona pandemic was still ongoing. Research in the Network Institute Tech Labs of Vrije Universiteit Amsterdam took place according to a thorough corona-protocol to ensure safety of all participants and the experimenter. This protocol includes detailed instructions about the use of gloves, hair nets, cling film, mouth masks, washing hands, keeping distance and disinfecting all materials. The protocol can be found on the website of the Network Institute: https://bit.ly/3akpcxa.
Participants
Consistent with the preregistration, we aimed to recruit 100 participants in the lab experiment, of which we expected about 70 participants to participate in the follow-up survey. We over-sampled 130 participants (the maximum allowed by our budget and lab time) to account for drop-outs and no-shows. Participants were recruited by survey company Panelinzicht through a pre-intervention online survey, which was used for the selection of participants for the VR intervention. This selection restricted participation to respondents who live on the ground floor. Moreover, the survey included an informed consent form and excluded respondents wearing glasses and respondents with a high risk for simulator sickness, including migraine and epileptic patients from the experiment (see Appendix A for the complete pre-intervention survey).
Data collection in the lab started on 5 October 2020 and ended on 26 October 2020. We collected a total of 108 responses in the lab. Invitations for the follow-up survey were sent exactly 4 weeks after each lab visit. We sent a reminder 2 working days after this invitation, as well as at the end of the follow-up survey data collection, on 25 November 2020. In total, 78 participants completed the follow-up survey (72% of all participants of the VR lab experiment). For the control sample, 300 responses were collected between 7 October and 13 October. Consistent with the preregistration, we removed 24 responses who finished in less than 4 minutes, leaving 276 responses for analysis.
Procedure
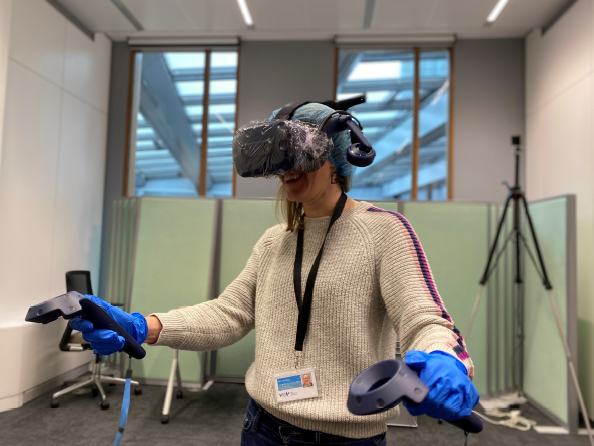
All surveys with all measures and items appear in the Supplementary Methods. The lab experiment was conducted in the lab of the Network Institute at Vrije Universiteit Amsterdam. The task was programmed in C Sharp via Unity 3D by the development team of the Network Institute. The VR equipment consisted of an HTC Vive Pro head mounted display (HMD) with a resolution of 1080 × 1200 per eye, a 110∘ field of view and internal headphones (see Figure 2). The software was implemented on a desktop machine with an Intel i-7 processor, with 32GB of RAM and a GetForce GTX 1080 graphics card.
VR equipment (HTC Vive) which was used in the experiment.
In the lab, participants were instructed on the use of the VR equipment. The VR intervention started with an Introduction phase to familiarize participants with the controllers and the size of the lab. Instructions were given through a voice-over (see Appendix C for the full script). In the instruction phase, participants found themselves in a neutral home, where they were instructed to move an object and to walk freely through the room. A large orange arrow indicated where participants should walk to start the next phase (see Figure 3b).
Three phases of the VR intervention.
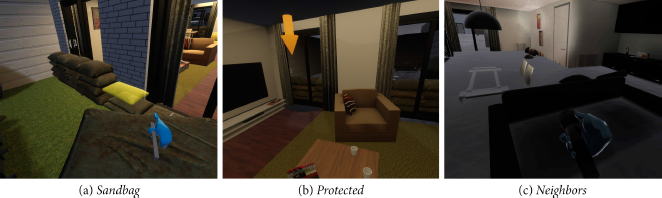
After the Introduction phase, participants found themselves in the backyard of a home for the Sandbag phase. The task in this phase was to protect the home by stacking sixteen sandbags in front of the window. When a participant grasped a sandbag, the target location was indicated in yellow (see Figure 3a). After finishing the sandbag task, an orange arrow transported participants to the inside of the home to experience the Protected phase. In this phase, participants could freely walk around ‘their’ living room. They could watch the water outside through the windows, including several garbage bins floating past through the street. At the end of this phase, the voice-over asked participants to get a flashlight from the table, to have a look at the neighbors. In the Neighbors phase, participants experienced a flood in the unprotected home of the neighbors. This home has a power shortage due to the flood. Therefore, participants could use the flashlight to check out the water level and several floating elements in the living room of the neighbors (see Figure 3c). After one minute in this final phase, the voice-over announced the end of the VR intervention. A screen capture of the full experiment can be found at https://vimeo.com/482506190.
The flood risk investment game presents participants with a scenario in which they are a homeowner for 25 years of a house under flood risk, with an annual flood probability of 1%. In addition to the hypothetical house, participants receive a savings balance that can be used to make payments in the game, such as investments in flood damage reduction. A one-shot decision between five discrete investments with accompanying benefits in terms of reduced damage from flooding can be made at the start of the game. Damage-reducing measures are effective for the full 25-year period of the game. The results page shows a grid of 100 houses of which the software randomly selects a number of houses to be flooded in the 25 years of the game, based on the annual 1% probability. In case the house of the respondent is flooded, damage is subtracted from the savings balance. The investment game includes extensive and visual instructions, a test scenario and a set of comprehension questions. Detailed instructions of the flood risk investment game can be found in Appendix D.
After finishing the VR intervention, participants were seated behind a desktop computer to fill in the final survey, which included questions on presence, simulator sickness, coping values, worry and the flood risk investment game. Note that the flood risk investment game is incentive compatible through a random lottery selection mechanism: i.e., one month after the end of the experiment, one randomly selected participant received 1% of their bank balance (15,000–65,000 ECU) from the flood risk investment game. Thus, the final payment could range from 150–650, based on decisions and the state of nature in the game. At the start of the final survey, participants were asked to reflect on the flood experience in VR and how it compared to their expectations (What did you think of the VR flood experience? with answer options “Less severe than expected”, “Confirmed my expectations”, “More severe than expected”). We used a the general item from the iGroup Presence Questionnaire (Reference Schubert, Friedmann and RegenbrechtSchubert et al., 2001) as a single item measure of presence (To what extent did you feel present within the virtual environment? from 1 = not at all; to 7 = very much). We constructed another single item measure to measure simulator sickness (To what extent did you experience discomfort or nausea in the virtual environment? from 1 = all fine; to 7 = so bad the experiment had to be terminated early), based on the verbal fast motion sickness (FMS) method (Reference Keshavarz and HechtKeshavarz & Hecht, 2011). A full list of survey questions and answer options can be found in Appendix B.
4 Results
We invited a representative sample of citizens from Amsterdam and beyond to visit the lab. The youngest participant was 18 years old and the oldest participant was 88 years old. In both samples, a small majority (59%) of participants is female. Approximately half of the sample has at least a Bachelor degree. Table 1 presents descriptive statistics of the control sample, the treatment (VR) sample and the VR follow-up sample.
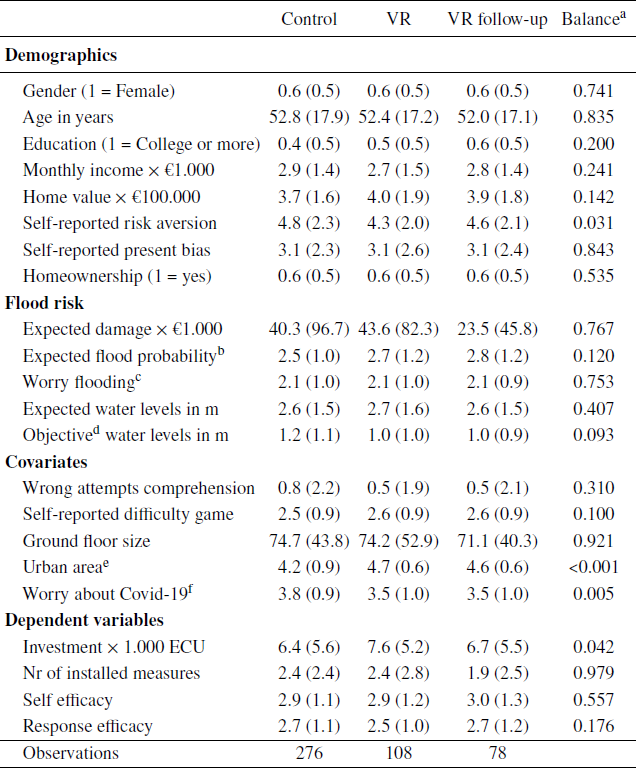
Notes: Table displays means and SD in parentheses.
a Column reports p-values of two-sided balance tests between Control and VR sample.
b Response to the statement What is the likelihood that your house will be flooded in the next 25 years?, ranging from 1 (zero) to 6 (very high).
c Response to the statement I am worried about the danger of flooding at my current residence, ranging from 1 (strongly disagree) to 5 (strongly agree).
d Based on maximum waterdepth maps provided by the Dutch government (https://basisinformatie-overstromingen.nl/liwo/#/viewer/1).
e Based on Dutch Statline (CBS) data of urbanization by municipality, ranging from 1 (= very rural) to 5 (= very urban).
f Response to the statement I am worried about becoming infected by the coronavirus, ranging from 1 (strongly disagree) to 5 (strongly agree).
The invitation for the control sample was initially sent to the same subject pool as the VR invitation, as preregistered. However, when the sample ran out, we asked the survey company to sample further in urban areas around Utrecht (the third largest city in the Netherlands, after Amsterdam and Rotterdam, with a similar flood risk to Amsterdam). We decided against sampling from Rotterdam because of its higher objective flood risk (and therefore possibly perceived flood risk) compared to the Amsterdam area.
Throughout this paper, we report the p-values of two-sided tests, unless indicated otherwise (e.g. for the directional hypothesis tests). Gender, age, education level, income, home value and homeownership are not significantly different across samples. Respondents in the Control group are slightly more risk averse (p = 0.03) and more worried (p = 0.01) about becoming infected by the Coronavirus. This points to a small selection effect due to the fact that it is less risky (with regard to coronavirus infection probability) to participate in the Control group at home than in the VR group in the lab. Objective flood risk is slightly higher in the Control sample (p = 0.09), but most importantly perceived flood risk (both worry about flooding and expected water levels in case of a flood) are identical across samples.
Based on their postcode and Dutch Statline (CBS) data, each observation was assigned an urbanization score. Considering that the lab is located in Amsterdam, which has the highest possible urbanization score (5 = very urban), it is not surprising that respondents in the VR sample live on average in a more urbanized area (p < 0.001). Nevertheless, the majority of both samples lives in urban areas.
For robustness, we examine possible interactions between the three significantly different variables (i.e., p < 0.05: worry about Covid-19, risk aversion and urbanization score) and the sample on the hypothesized relationships in Appendix E. We find no significant interaction effects for any of these variables with regard to the main treatment effect (H1a).
In the lab experiment, we encountered few technical issues, mostly related to the battery level of the controllers and fogged glasses due to the cling film hygienic measures following the corona protocol. In these cases, controllers or cling film were replaced by the experimenter, and the VR experience was restarted. We had no instances of severe simulator sickness, and all participants could complete the VR experience. The average self-reported sickness score was 1.4 (median = 1) on a scale from 1 to 7, where the answers ranged from 1 to 5 (i.e., the two most extreme options were never selected). The average self-reported presence level was 6.1 (median = 6) on a scale from 1 to 7. This indicates that most participants perceived the VR experience as highly realistic. Participants spent 15 minutes on average on instructions, set-up of the equipment and the VR experience. They completed the post-experimental survey, including the flood risk investment game in 11 minutes on average (median = 10 minutes). Participants in the control treatment completed the survey and flood risk investment game in approximately 12 minutes (median = 10 minutes).
Pre-registered analysis
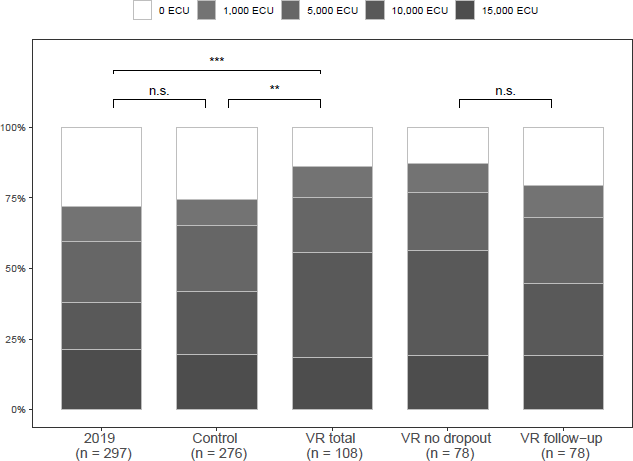
Following the analysis plan, we compare the investment decisions in the Control sample and the VR sample with a Mann-Whitney Wilcoxon (MWW) test. We find a significant difference: in the VR sample investments are higher than in the control sample (p = 0.021, one-sided). Figure 4 illustrates the percentage of investments in each investment option (0 ECU to 15,000 ECU). The figure clearly shows that in the Control sample (column 2), more people (25%) did not invest at all (0 ECU) compared to the VR sample (column 3: 14%). In the VR sample, the largest share of participants in the VR treatment (37%) invested the second highest amount: 10,000 ECU. To examine the robustness of this result, we further compare investments in the VR sample with an additional control sample from an earlier application of the flood game in 2019 (Mol et al., 2021). Investments are significantly higher in the VR sample than in the 2019 control sample (MWW-test, p = 0.004, one-sided). The final two columns of Figure 4 are discussed below.
Investments by treatment and follow-up.
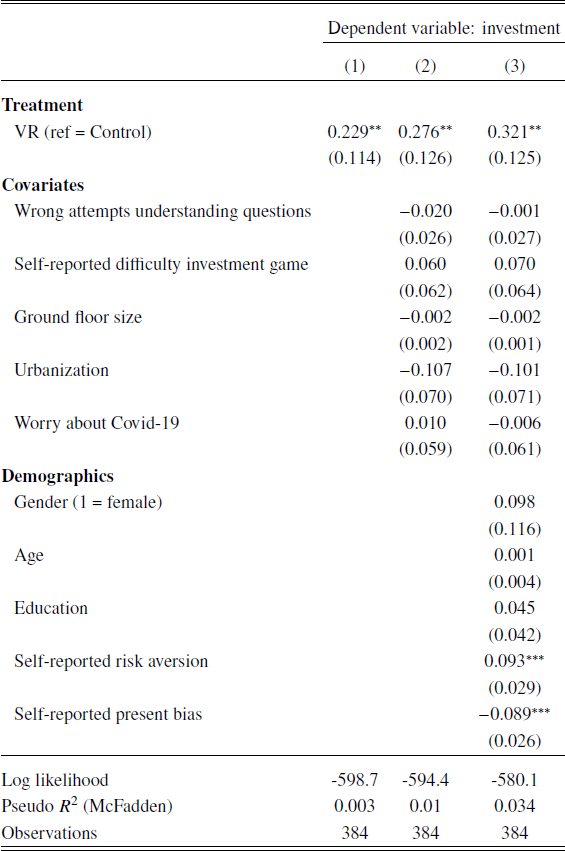
Furthermore, we performed parametric analyses to study how robust these results are against several control variables, in line with the analysis plan. We conducted a regression analysis with an ordered probit specification, to account for the categorical answer structure of the investment decision. Table 2 presents presents the results. In the ordered probit regression on investment with robust standard errors, we find a significantly positive estimate for the VR treatment dummy (column 1; β=0.229; p=0.04), which confirms the non-parametric findings. These regression results are robust (column 2; β=0.276; p=0.03) to adding the following control variables: comprehension questions, self-reported difficulty, ground floor size, urban area and worry about Covid-19. The results are also robust (column 3; β=0.321; p=0.01) to adding demographic variables and personal characteristics: age, education, gender, qualitative risk aversion and present bias.
Notes: Robust standard errors in parentheses
* (p<0.1;
** p<0.05;
*** p<0.01).
We reached out again to the respondents in the VR group exactly 4 weeks after their lab visit. In total, 78 respondents completed the follow-up survey (72% of the 108 lab visitors). These respondents played the flood risk investment game again. Investments in the follow-up survey seem to be lower, as indicated by the final column in Figure 4. We compare the results of investments in the VR lab and in the follow-up survey with a Wilcoxon signed-rank test: a non-parametric test for within-subject comparisons. We find no significant difference between investments right after the VR experience and investments four weeks later (p = 0.112). This suggests that the effect of the VR intervention does not immediately disappear after four weeks. However, the data presented in Figure 4 seem to show that investments in the VR follow-up group going down (approximately ‘between’ investments in VR and the Control group). Comparing investments in the VR follow-up and the Control group with a MWW-test (not pre-registered) yields no significant difference (p = 0.297). Whether the effect is really persistent after these four weeks remains unclear.
Table 3 reports the results of fixed effects panel regressions of the H3 variables (investments, measures at home and coping values) with two time points: directly after the VR intervention and the follow-up. The coefficient of the time dummy in Model 1 is not significantly different from zero (β =0.019, p=0.72). This indicates that investments have not changed four weeks after the VR experience under our set of covariates and subject fixed effects, which confirms the non-parametric findings. These results support Hypothesis 3a (investments within VR sample over time).
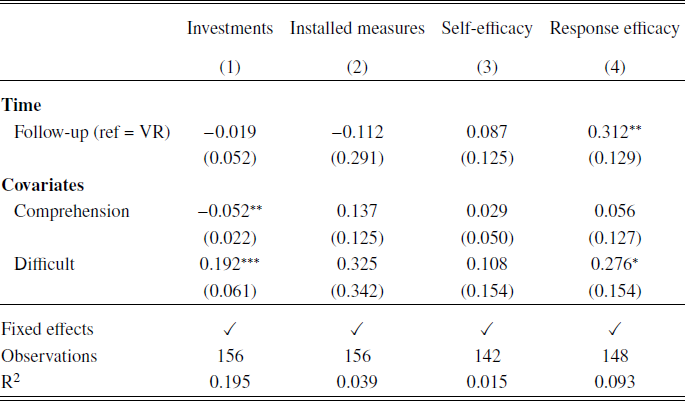
Notes: Dependent variable Model 1: Investment in game (binary); Model 2: Number of installed measures (self-reported); Model 3: Self-efficacy; Model 4: Response efficacy. Models 3 and 4 have some missing observations due to Don’t know answers. For robustness, we ran all models excluding all subjects with any missing data; the results do not change except for the coefficient of time on response efficacy, which becomes insignificant. Standard errors in parentheses
* (p<0.1;
** p<0.05;
* p<0.01).
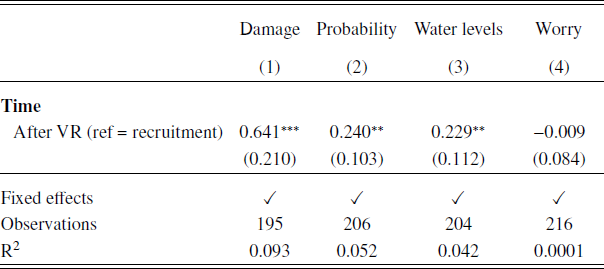
Hypothesis 2 concerns risk perception and worry before and after the VR experience. We hypothesized that both would increase directly after the VR experience. Figure 5 shows that this is the case for risk perception (expected damage, perceived flood probability and expected water levels) but not for worry. Wilcoxon signed-rank tests confirm these findings: expected damage increases after the VR experience (p = 0.004), perceived flood probability increases after VR (p = 0.03) and expected water levels increase slightly (p = 0.05). To check whether these differences remain after controlling for subject fixed effects, we conducted a FE panel regression with two time points: from the recruitment survey and directly after the VR treatment, in Table 4. We find an increase in expected damage (β = 0.641; p < 0.001), perceived probability of flooding (β = 0.240; p = 0.02) and expected water levels (β = 0.229; p = 0.04). In sum, we confirm Hypothesis 2a: risk perception essentially increases after the VR intervention.
Notes: Dependent variable Model 1: Expected flood damage; Model 2: Perceived flood probability; Model 3: Expected water levels; Model 4: Worry about flooding. Observations differ across models because Don’t know answers were treated as missing. For robustness, we ran all models excluding all subjects with any missing data; the results do not change. Standard errors in parentheses
* (p<0.1;
** p<0.05;
*** p<0.01).
Density plots of risk perception and worry before and after VR experience.
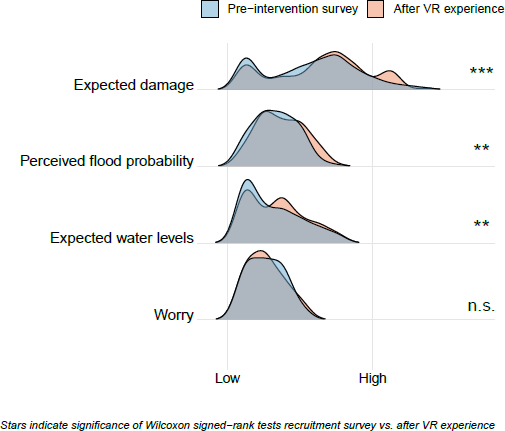
The lowest panel of Figure 5 shows that worry did not change over time. We find no change in worry about flooding with a MWW-test (p = 0.75), nor in Model 4 of the fixed effects panel regression in Table 4 (β = -0.009; p = 0.91) directly after the VR experience. Therefore, we cannot confirm Hypothesis 2b: the VR intervention does not increase worry about flooding.
Hypothesis 1b and Hypothesis 3c make predictions about coping values (self-efficacy and response efficacy). Figure 6 shows that we cannot confirm hypothesis H1b: no change is found between the Control and VR sample with a MWW test (response efficacy p = 0.16; self-efficacy p = 0.60) nor with an ordered probit regression including control variables (response efficacy β = -0.102, p = 0.43; self-efficacy β = -0.163, p = 0.20, see Table E2 ). As predicted by Hypothesis 3c, we find no differences after the VR intervention in coping values, which can also be seen from the figure. Wilcoxon signed-rank tests confirm these findings (response efficacy p = 0.12; self-efficacy p = 0.47).
Coping values by treatment and follow-up.
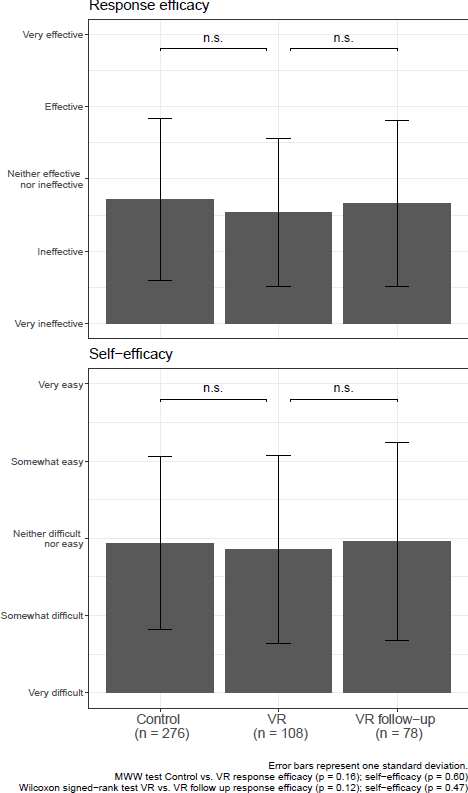
When controlling for fixed effects in Table 3, we find a small increase in response efficacy (Model 4; p = 0.02) and self-efficacy does not change from the VR lab survey to the follow-up survey (Model 3, p = 0.49). Furthermore, when we exclude all subjects who answered Don’t know at least once, we get a fully balanced panel. The results of Table 3 do not change qualitatively, except for the coefficient of time in Model 4, which remains still positive but becomes insignificant. At any rate, our results show that coping values do not decline over time, partly confirming Hypothesis 3c.
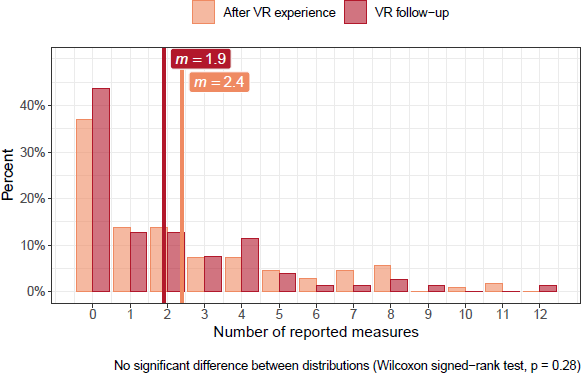
Finally, Hypothesis 3b concerned the self-reported flood damage mitigation measures. We predicted an increase in the number of measures in the follow-up survey, compared to the number reported right after the VR intervention. This hypothesis is not confirmed by the data. Figure 7 shows a histogram of both samples. The average number of reported measures is indicated with a bold line. In the follow-up survey, respondents indicate even less (m = 1.9) measures than right after the VR experience (m = 2.4) but this difference is not significant (Wilcoxon signed-rank test, p = 0.28; fixed effects panel estimation with covariates in Table 3, β = −0.112; p = 0.70).
Histogram of number of flood risk mitigation measures installed at home, comparing VR and VR follow-up.
Exploratory analysis
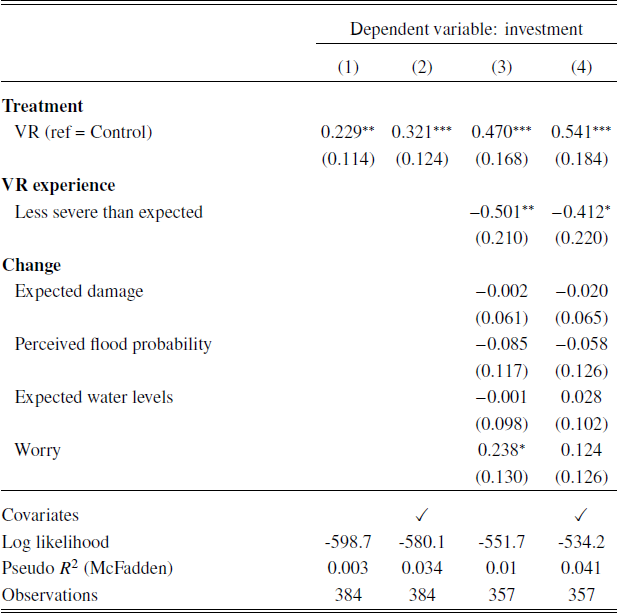
In addition to the preregistered analyses presented above, we present an exploratory analysis of the mechanism that could be driving the main treatment effect. Table 5 presents ordered probit regressions of investments in the flood risk investment game. Model 1 repeats the finding from Table 2: the main effect of the VR intervention is positive and significant (β = 0.229, p = 0.04). In Model 2, we control for the set of covariates: wrong attempts understanding questions, self-reported difficulty of investment game, ground floor size, urbanization, worry about Covid-19, gender, age, education, self-reported risk aversion and self-reported present bias. The coefficient of the VR intervention is again positive and significant (β = 0.321, p = 0.01). In Model 3, we add several variables that may explain the mechanism of the VR intervention. We add a dummy for the 47 participants (44%) who indicated that the flood experience in VR was less severe than they expected. Furthermore, we calculated the change in risk perception (expected damage, perceived flood probability and expected water levels) and worry from the pre-intervention survey to the survey in the lab, after the VR experience. For example, if a respondent answers Agree (4/5 on the scale) on the Worry about flooding question in the pre-intervention survey, and Strongly agree (5/5 on the scale) to the same question right after the VR experience, the change in worry variable takes on a 5 - 4 = 1. Positive (negative) numbers in the change variables thus indicate an increase (decrease) in risk perception or worry. Since we have only one data point on risk perception and worry for the Control group, the change variables are set to 0 for these respondents.
Notes: Robust standard errors in parentheses
* (p<0.1;
** p<0.05;
*** p<0.01). Covariates: wrong attempts understanding questions, self-reported difficulty of investment game, ground floor size, urbanization, worry about Covid-19, gender, age, education, self-reported risk aversion, self-reported present bias. Model 3 and 4 exclude 27 subjects because of Don’t know answers to risk perception questions. For robustness, we ran Model 1 and 2 without these subjects; the results do not change.
Model 3 shows that participants who indicated that the severity of the VR flood was below expectations, invest significantly less in the flood risk investment game (β = -0.501, p = 0.02). Moreover, participants who were more worried about flooding after the VR experience than in the pre-intervention survey, invest significantly more (β = 0.238, p= 0.06). Both effects decrease in magnitude when the set of covariates is added in model 4. The effect of worry is now no longer significant (β = 0.124, p = 0.31) and the effect of expectation is less strong (β = -0.412, p = 0.05). We find no effect of a change in risk perceptions (expected damage, perceived flood probability or expected water levels) on investments in the game. We do not wish to put too much emphasis on these coefficients: they give an indication of the mechanism behind the VR intervention effect, but our data is not suited to draw solid conclusions about the mechanism. Nevertheless, the exploratory analysis suggests that the VR intervention may be effective in increasing investments through an increase in worry. We further conjecture that the effectiveness of a VR intervention may be hampered by the expectations of the respondent. If the simulation turns out to be less severe than expected, participants are not motivated to invest more, and worse, they may invest less than in the baseline situation. Nevertheless, the main conclusion is that in the aggregate the VR simulation increased investments in flood damage mitigation measures.
5 Discussion
Many individuals experience problems understanding and preparing for low-probability/ high-impact risk, like floods. People generally under-prepare for floods (Reference Meyer and KunreutherMeyer & Kunreuther, 2017), possibly because years of experience without floods lead to under-weighting of the probability. We investigated a VR simulation of a flood as a risk communication strategy that may overcome probability under-weighting and make people understand the risk. An important novelty of the current set-up is that we studied the persistence of the effects by carrying out a follow-up survey several weeks after the VR intervention. This follow-up survey included not only survey questions on psychological determinants, but repeated the flood risk investment game, an existing economic game to measure flood preparedness behavior (Reference Mol, Botzen and BlaschMol et al., 2020b). This is an important contribution of the current paper, because most VR intervention studies to date solely measure the effect on self-reported psychological determinants, which does not aim to capture impacts on actual decision making (Reference Jansen, Snijders and WillemsenJansen et al., 2020).
We find that participants who experienced the virtual flood invest significantly more in the flood risk investment game than those in the control group. It is plausible that this difference is causally related to the VR treatment, but given the limitations discussed below, one cannot safely exclude other reasons. The investments in the VR treatment tended to be decreased after four weeks but not significantly so. The difference between treatment and control, however, reduced to non significant. Our findings are consistent with threshold models predicting that individuals should have a sufficient degree of concern for a risk before they pay attention to it (Reference Slovic, Fischhoff, Lichtenstein, Corrigan and CombsSlovic et al., 1977; Reference Robinson and BotzenRobinson & Botzen, 2020). According to the availability heuristic, the perceived probability of an event is related to the ease of recall. The availability heuristic seems to be particularly powerful in combination with strong affective feelings, such as worry (Reference Loewenstein, Hsee, Weber and WelchLoewenstein et al., 2001). The threshold level of concern may thus be triggered by a disaster experience, which can evoke such strong emotions toward risk. Here we show that such a disaster experience can be effectively simulated in a VR lab. Our exploratory analysis suggests that the VR intervention may be effective in increasing investments through an increase in worry.
Another contribution of the paper is that we investigated the effects of a flooding experience in a high-immersive VR environment on coping appraisal. Coping values include response efficacy (perceived effectiveness of the measures), self-efficacy (the subjective feeling of being able to install the measures) and response cost (Reference Bubeck, Botzen, Kreibich and AertsBubeck et al., 2013). Extensive evidence has shown that coping values are to be among the most important determinants of disaster preparedness (Reference Botzen, Kunreuther, Czajkowski and MoelBotzen et al., 2019; Reference Bubeck, Botzen and AertsBubeck et al., 2012; Reference Grothmann and ReusswigGrothmann & Reusswig, 2006), but this paper is one of the first to study whether they can be enhanced. However, our data do not show a difference in coping values between the VR intervention group and the control group.
We investigated a virtual reality intervention with a between-subject approach, as well as a within-subject approach. This design could be improved by adding a follow-up survey for the Control group, which would allow for a difference-in-differences analysis of the results. Given the cost and complexity of carrying out a VR experiment in the lab, the approach taken for this study is to have the control group not experience a VR environment. This approach is consistent with recent VR studies on VR interventions (Reference Markowitz, Laha, Perone, Pea and BailensonMarkowitz et al., 2018; Reference NowakNowak et al., 2020; Reference Jansen, Snijders and WillemsenJansen et al., 2020) and overcomes a common limitation of VR experiments: low sample size (see e.g. Mol, 2019, for an overview of VR experiments and accompanying sample sizes). Yet, the experimental design could be further improved by adding a control group in which participants are confronted with the same VR procedure, but without the flooding event. In such a setting, potential influences on the decision in the flood game could be controlled for, such as the VR experience itself (see e.g. Reference Chittaro, Sioni, Crescentini and FabbroChittaro et al., 2017, who compared behavior in a VR cemetary and a VR park environment). Furthermore, the experience of being in the lab versus completing the survey and flood game online could be accounted for if another control group was invited to the lab without going through the VR experience. Many recent VR studies have examined presence levels and effectiveness of VR interventions in comparison to video materials or printed materials (see Reference Buttussi and ChittaroButtussi & Chittaro, 2021, for a recent review). To our knowledge, no study has yet combined a VR intervention, a VR control condition and a non-VR or printed materials condition. Such a study could yield important information for the development of effective VR interventions. We recommend future VR studies to include a VR control group.
We find a small but significant positive effect of the virtual reality intervention between subjects on investments in the flood risk investment game. The effect is robust to controlling for several control variables and did not decrease significantly 4 weeks after the intervention. Nevertheless, for future studies it would be interesting to test the same subjects after a longer time period, especially since investment levels seem to decline over time. The VR intervention was not effective in enhancing coping values and did not lead to more measures installed at home. The latter is not surprising, given that we did not present any information on possible measures to implement at home to our respondents. It should also be noted that flood risk reduction measures often require making substantial adjustments to one’s home, in contrast to other disaster risk reduction measures such as buying a fire blanket. The current experiment intended to measure only the effect of the VR intervention. Extensions of this experiment could introduce information in both samples, for example in the form of flyers (see e.g. Reference Jansen, Snijders and WillemsenJansen et al., 2020).
This study found that one potential way to increase risk perception is to use virtual reality simulations of floods. Future research could examine whether lower tech approaches, such as VR set-ups that rely on a smartphone, can be equally effective as expensive head-mounted displays. Such a lower tech approach would also allow for larger sample sizes, which is particularly useful when examining the mechanism behind the intervention effect. Our exploratory analysis shows that high expectations could hamper the effectiveness of a VR intervention. It therefore could be particularly interesting to target homeowners in high-risk areas. Another potential avenue for future research is to use augmented reality technology (see Mol, 2019, for a discussion on the different technologies) instead of virtual reality technology, to project expected water levels into a participant’s own home. Such a method could target misperceptions of expected damage and water levels more precisely than the current VR approach.


 Open access