

INTRODUCTION
Pertussis (whooping cough) is a highly contagious respiratory disease caused by the bacterium Bordetella pertussis and constitutes a global public health problem [1]. Pertussis is endemic throughout the world [1–Reference Tejpratap, Murphy and Moran3] and the WHO estimates that 50 million cases and 300 000 deaths occur annually [4]. Although vaccination reduces infection risk, pertussis remains a key cause of morbidity and mortality, with case-fatality rates in developing countries reported to be up to 4% [4]. In recent years, an increase in number of pertussis cases in adolescents and adults has been reported globally [1, Reference Wood and McIntyre5, Reference Schellekens, von König and Gardner6]. Australia has had a pertussis vaccination programme in place for decades, with high national coverage. Despite this, pertussis is still common in Australia, with an average of 17 676 cases annually over the past 10 years. Furthermore, significant increases in pertussis incidence have been observed over the last decade, particularly in adolescents and the elderly [Reference Senanayake2, Reference Wood and McIntyre5, Reference Cagney7, Reference Jackson and Rohani8], culminating in a large, nationwide outbreak that commenced in 2009 [Reference Lam9]. Previous research indicates that waning immunity, transition from whole-cell pertussis vaccines to acellular pertussis vaccines, increasing use of a more sensitive diagnostic test in PCR, and evolution of B. pertussis might be the causes for increase in the outbreaks of pertussis in Australia [Reference Spokes, Quinn and McAnulty10–Reference Sheridan13].
Previous studies have mainly focused on the effects of vaccination, herd immunity, pertussis toxin, and evolution of the bacterium on the epidemiology of pertussis [Reference Broutin14–Reference Campbell17]. Pertussis epidemics have previously been associated with population structure, social and biological factors and herd immunity [Reference Jackson and Rohani8]. However, epidemics have shown substantial heterogeneity between countries with similar socioeconomic conditions and vaccination programmes [Reference Jackson and Rohani8]. Some studies have suggested that while current vaccination strategies may decrease clinical pertussis cases, they are not able to fully control the circulation of pertussis [Reference Schellekens, von König and Gardner6, Reference Jackson and Rohani8].
The epidemiology of pertussis is complex and remains to be fully elucidated. Understanding the social and environmental drivers of pertussis outbreaks is integral to predicting future outbreaks and developing effective intervention measures (including vaccination strategies). Typically, pertussis is spread via airborne transmission; infection occurs when susceptible individuals are exposed to aerosolized droplets from pertussis-infected patients [Reference Tejpratap, Murphy and Moran3]. Pertussis epidemics have previously been reported to exhibit seasonality [Reference Mooi16, Reference Fine and Clarkson18, Reference Skowronski19]. The effectiveness of airborne transmission is influenced by droplet size and environmental conditions, such as air flows, temperature and evaporation [Reference Tang20, Reference Xie21]. Understanding the social and environmental predictors of pertussis outbreaks could be useful for predicting future outbreaks and for developing and implementing effective intervention measures to minimize the impact of these outbreaks.
Current understanding of the role of socio-environmental factors on pertussis transmission is limited. This study aims to investigate the relationship between pertussis risk and socio-environmental factors on the spatio-temporal variation underlying pertussis in Queensland, Australia.
MATERIALS AND METHODS
Study site and data collection
The state of Queensland is located in the northeast of Australia. It is Australia's second largest state by land mass, spanning ~1·9 million km2. Climate conditions vary markedly across the state. For example, low minimum temperatures are typically observed in the inland southeast; dry and hot weather conditions occurs in the inland west; a hot humid summer presents in the tropical far north of Queensland; and warm temperate conditions occur on the coastal regions [22].
Australia provides free pertussis vaccines to children aged 0–15 years and to pregnant women. People receive a pertussis immunization through visiting their local doctor or immunization provider. Most of these immunization encounters occur without payment of a consultation fee [23].
Data on the number of confirmed pertussis cases for each postal area between 1 January 2006 and 31 December 2012 were provided by Queensland Health (the Queensland State government health authority). Postal areas are approximations of Australia's postcodes, produced by the Australian Bureau of Statistics (ABS). Postal areas are widely used by researchers in Australia because they are readily available in many datasets [Reference Chou, Clements and Thomson24–Reference Goltsman26]. Data on population size and socioeconomic index for area (SEIFA) for each postal area were obtained from the ABS [27]. The population size at each postal area was based on the 2011 Census data in Australia [28]. A continuous value of SEIFA is used to describe the average socioeconomic characteristics at different locations, including education, occupation and wealth [29]. Data on daily minimum temperature by month (MIT; °C) and monthly daily vapour pressure (VAP) (hPa) for each postcode area were obtained from the National Computational Infrastructure between 1 January 2006 and 31 December 2012 [30].
Descriptive analysis
To better understand pertussis epidemics in Queensland, this study provided the statistical summary of the pertussis data and the temporal patterns of monthly pertussis incidences by the three age groups (0–14, 15–64, ⩾65 years).
Statistical modelling
A Bayesian spatio-temporal model was developed to examine the effects of socio-environmental factors on the pertussis incidence and the spatio-temporal variability of pertussis epidemics. We denote y ij as the observed monthly pertussis cases at location i and month j (i = 1, … , 424; j = 1, … , 84) between January 2006 and December 2012. y ij was assumed to have a Poisson distribution:
 $$y_{ij} \,{\sim}\, {\rm Poisson} \left( {\rho_{ij} E_i} \right),$$
where ρ ij represents the relative risk of the monthly pertussis counts at location i and time j. E i is the age-adjusted expected number of pertussis cases at location i. E i was calculated as:
 $$E_i = \sum\limits_{g = 1}^{g = 3} {P_{ig}} R{}_{qg};\,R_{qg} = \displaystyle{{O_{qg}} \over {P_{qg}}}. $$
where P qg and P ig represent the age-specific populations in the whole of Queensland and at postal area i for the g age group, respectively; O qg and R qg are the observed numbers of pertussis cases and the mean incidence rate of pertussis for the g age group in the whole of Queensland during 2006–2012, respectively. Age-adjusted expected numbers of pertussis cases were used in the method because the different age structure in different postal areas might affect the likelihood of pertussis infection [Reference Waller and Gotway31].
The log relative risk for the spatio-temporal model was thus given by:
 $$\eqalign{\log (\rho _{ij} ) & = \beta _0 + \beta _1 \times {\rm MIT} + \beta_{2} \times {\rm VAP} + \beta _3 \cr & \quad \times {\rm SEIFA} + \beta _4 \times {\rm SCP} + t_j + u_i + v_i \cr & \quad + \varphi _{ij}}, $$
Here β 0 is the intercept; β 1, β 2, β 3 and β 4 are the coefficients for MIT, VAP, SEIFA, and Queensland school calendar pattern (SCP), respectively; t j captures the time trend over the study period; u i is spatially structured heterogeneity to capture residual spatial autocorrelation in the data; ν i represents unstructured heterogeneity (no spatial correlation) to capture measure error or micro-scale variation at location i, where v i has a normal distribution with mean zero and precision τ v ~ gamma (0·5,0·0005); ϕ ij describes the spatio-temporal variation and is assumed to be a normal distribution with mean zero and precision τ ϕ , τϕ ~ gamma (0·001,0·001).
In the study we assumed that the variable SCP was a categorical variable with two categories: SCP = 1 representing the months during the school term, and SCP = 0 representing the months during school holidays. The conditional autoregressive (CAR) model was used to describe the random effect u i as a function of the first-order neighbours u −i at site i. The conditional distribution of u i |u −i is given by:
 $$u_i \left \vert {u_{ - i}} \right. \,{\sim}\, N \left( {\displaystyle{{\sum\limits_{s = 1}^m {w_{is}} u_s} \over {w_{i +}}}, \displaystyle{{\tau _u^2} \over {w_{i +}}}} \right),$$
where u
i
has a normal distribution with precision τ
u
, a gamma distributions τ
u
~gamma (0·5,0·0005), and conditional weighted mean given by the average of the first-order neighbours u
−i
without u
i
. Let u
−i
= [u
1, u
2, … , u
i−1, ui+
1, … , u
m
]. A symmetric n × n matrix W of spatial weights with elements w
is
and $w_{i +} = \sum\nolimits_{s = 1}^m {w_{is}} $
is used to describe the local neighbourhood relationship, where w
is
= 1 if sites i and s are neighbours, and w
is
= 0 otherwise [Reference Besag, York and Mollie32]. Moreover, the above CAR model was also used to perform the temporally correlated random effect t
j
with a one-dimensional random walk prior and a neighbourhood structure of the immediately previous month and subsequent month. Thus, t
j
is assumed to be a normal distribution with precision τ
t
; let τ
t
be a gamma distribution τ
t
~ gamma (0·01,0·01).
$w_{i +} = \sum\nolimits_{s = 1}^m {w_{is}} $
is used to describe the local neighbourhood relationship, where w
is
= 1 if sites i and s are neighbours, and w
is
= 0 otherwise [Reference Besag, York and Mollie32]. Moreover, the above CAR model was also used to perform the temporally correlated random effect t
j
with a one-dimensional random walk prior and a neighbourhood structure of the immediately previous month and subsequent month. Thus, t
j
is assumed to be a normal distribution with precision τ
t
; let τ
t
be a gamma distribution τ
t
~ gamma (0·01,0·01).
To ensure the spatio-temporal model [i.e. equation (1)] is appropriate for describing the pertussis data in the study, six reduced models underlying risk factors were developed to detect whether model goodness of fit can be improved when including different random effects of u i , vi, ti and φ ij . All models were compared using the deviance information criterion (DIC). The model was run 150 000 Markov Chain Monte Carlo iterations with the first 30 000 iterations discarded as burn-in using WinBUGS software v. 1.4 (http://www.mrc-bsu.cam.ac.uk/software/bugs/the-bugs-project-winbugs/).
RESULTS
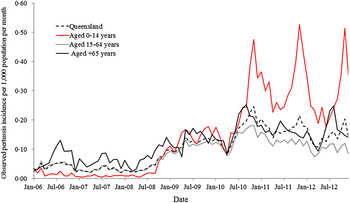
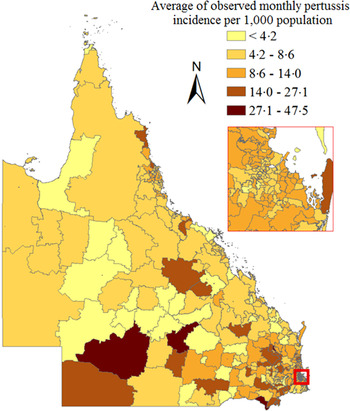
The average of the monthly incidence of pertussis was 0·1/1000 population (range 0·02–0·25/1000) in Queensland during the 2006–2012 study period. The observed age-specific monthly incidences in Table 1 indicate that children aged 0–14 years had the highest monthly incidence with an average of 0·15/1000 (range 0·01–0·53/1000) per month. Of the reported pertussis cases, 29·2% (age-specific incidence rates 171/100 000 per year), 55·5% (age-specific incidence rates 100/100 000 per year) and 15·3% (age-specific incidence rates 143/100 000 per year) were aged 0–14 years, 15–64 years and ⩾65 years, respectively. The largest number of annual cases was observed in 2011 and the smallest number in 2007. Monthly case numbers peaked in winter in 2006 and 2007, in summer in 2008, in autumn in 2009 and in spring during 2010–2012. Figure 1 shows an increasing trend in observed monthly incidence of pertussis in Queensland from 2008 to 2010. The trends in the observed age-specific monthly incidences were different between the three age groups (Fig. 1). A notable increase in incidence occurred in the 0–14 years age group from 2008 onwards. An increasing trend was also observed in people aged ⩾65 years, while a slight decreasing trend seen in the 15–64 years age group from 2010 to 2012. The average of the observed monthly incidence of pertussis cases for each postal area (range 0–47·5/1000 local people) also exhibited heterogeneity across Queensland (Fig. 2). The spatial clustering of high observed incidences mostly occurred in the southwest and the southeast of Queensland (Fig. 2).
The temporal patterns of the monthly incidence of confirmed pertussis cases in the three age groups and Queensland (January 2006 to December 2012).
Average of observed monthly pertussis incidence by Queensland postal area.
The monthly pertussis incidences (per 1000 population) and variables for Queensland (January 2006–December 2012).

The full model, including the four random effects (u, v, t, ϕ), exhibited the best fit for the pertussis data due to the lowest DIC value compared to the six reduced models (Table 2). The full model showed an average decrease in monthly pertussis cases of 3·1% [95% credible interval (CrI) 1·3–4·8] for each 1 °C increase in monthly MIT, while average increases in monthly pertussis cases were 6·2% (95% CrI 0·4–12·4) and 2% (95% CrI 1–3) for school term (SCP = 1) and for each 10-unit increase in SEIFA, respectively (Table 3). No significant relationship was found between pertussis risk and VAP.
Model comparison for relative risk of monthly pertussis counts underlying socio-environmental factors and different random effects over the six models

Bayesian Poisson regression models of pertussis, Queensland, Australia, 2006–2012

The temporally correlated effect [exp(t)] showed an increase in pertussis risk from 2006 to 2010 and a slight decrease from 2011 to 2012 (Fig. 3). Strong spatial variation in relative risk was observed across Queensland (Fig. 4). The spatially correlated random effect showed that the posterior mean of spatial variation [exp(u)] in relative risk ranged from 0·6 to 3·2 across the postal areas. The spatially correlated effect also identified the regions with the spatial clustering of pertussis risk unexplained by the full model. The four random effects might explain the effects of unobserved risk factors.
Time trend in posterior mean relative risk of pertussis (solid line) with 95% credible intervals (dashed lines) from the spatio-temporal model during the study period in Queensland.

The spatial distribution of structured and unstructured heterogeneities in posterior mean relative risk across Queensland.

For simplicity, the estimated monthly relative risks (ρ ij ) were aggregated by each year to illustrate the spatio-temporal patterns in pertussis epidemics over time across Queensland. There was strong evidence of spatial and temporal variability of relative risk after adjustment for socio-environmental factors (Fig. 5). Local relative risks were low and homogeneous across Queensland between 2006 and 2008. However, from 2009 onwards, relative risk and heterogeneity across Queensland increased (Fig. 5).
The spatio-temporal distributions of posterior mean relative risk over time across Queensland.

DISCUSSION
This study found a significant negative association between the pertussis incidence and MIT in Queensland. Although pertussis is spread by aerosol droplets, the effect of environmental factors on the survival of B. pertussis is still not fully understood [Reference Mielcarek33]. Pertussis cases have previously been reported to increase in winter [Reference Mooi16]. A New Zealand study also found a negative relationship between minimum temperature and pertussis [Reference Gosai, Salinger and Dirks34]. This is biologically plausible as temperature variation might influence host susceptibility and the survival of the pathogen in the environment [Reference Grassly and Fraser35, Reference Dowell36]. Our study demonstrates that a decrease in temperature might lead to increase in pertussis transmission.
SCP and SEFIA were also demonstrated to influence transmission of pertussis in this study. It is not surprising that periods of school attendance were associated with increased pertussis cases as it leads to crowding of susceptible individuals, increasing the risk of pertussis spread between school children and subsequently to their families [Reference Mooi16, Reference Earn37, Reference Brennan38]. A high score of local SEIFA is typically correlated with a lower unemployment rate and greater access to economic and social resources [27]. While the increased risk in pertussis associated with a single unit increase in SEIFA was modest, it may indicate that as SEIFA increases, opportunity for exposure to others, and therefore, risk of pertussis exposure, through work and social events increases.
A significantly increased trend in pertussis incidence was shown from 2008. Pertussis vaccination plays a significant role in reduction of pertussis infections [Reference Jackson and Rohani8]. Pertussis vaccine coverage in Queensland is very high with an average of 92% for children having received the primary course by their first birthday and 94·5% by the second birthday [39]. The national immunization programme provides publically funded vaccines to children aged 0–15 years in Australia [40]. However, a significant increase in pertussis incidence was observed in children aged 0–14 years and people aged ⩾65 years. Our result suggests that future studies need to investigate the effect of risk factors in pertussis transmission between different age groups. This is particularly relevant in light of recent publications that suggest differences over time in vaccine effectiveness between the diphtheria-tetanus-whole-cell pertussis vaccine and the diphtheria-tetanus-acellular pertussis vaccine that replaced the whole-cell vaccine as part of the publically funded schedule in Queensland in 1999 [Reference Sheridan13, Reference Sheridan41].
The maps of the spatio-temporal patterns in the posterior mean relative risks depict strong heterogeneity after adjusting for socio-environmental factors and random effects. Although there is the same immunization programme and high vaccine coverage across Queensland, there was substantial spatial variation in incidence during pertussis epidemics (Fig. 4). Pertussis transmission dynamics is complex and is driven by a combined effect of population immunity, population structure, socio-environmental, and biological factors [Reference Jackson and Rohani8]. Hence, it is possible that different locations might experience different epidemiological characteristics of pertussis [Reference Choisy and Rohani42]. The derived maps may support a better understanding of evolutionary dynamics of pertussis. Moreover, the areas with high relative risk also presented large uncertainty, which might provide clues for further investigating pertussis transmission.
Our study is the first attempt to develop a predictive model based on socio-ecological factors for the control and prevention of pertussis in Queensland, Australia. From this work we plan to develop an ongoing and comprehensive database to facilitate prevention of pertussis based on an ensemble of socio-ecological and disease surveillance data. The results of this study will inform future research into the social determinants of pertussis and control in high-risk areas.
Some limitations of the study should be acknowledged. First, the potential confounding factors such as vaccination coverage and uptake, population immunity and travel-to-work patterns were not available in the current study. However, high pertussis vaccination coverage across Queensland could reduce estimated bias. Second, the data might not include all pertussis cases, particularly those with mild clinical symptoms or those who are asymptomatic. Moreover, data on weather at postcode area level were not available after December 2012 at National Computational Infrastructure, Australia. Therefore, we could not include data after 2012 in this study, which may affect interpretation of our results. Finally, this study was not able to take into account the effect that changes in general practitioner testing behaviour (increased testing) [Reference Kaczmarek12] or changes in diagnostic approaches for pertussis (PCR vs. serology) may have had on the observed epidemiology of pertussis in Queensland [Reference Kaczmarek, Ware and Lambert11]. Moreover, further analysis needs to add detailed personal information to improve our understanding of pertussis epidemics.
CONCLUSIONS
This study demonstrates that pertussis transmission is significantly associated with MIT, SEIFA and SCP. The spatio-temporal analysis provided evidence of substantial variation in the spatio-temporal distribution of pertussis risk in different postal areas. The results also reveal that the pertussis epidemics are heterogeneous under the same national immunization programme across Queensland. The derived maps highlight the potential areas for future investigation and interventions.
ACKNOWLEDGEMENTS
We thank the Queensland Department of Health, Australian National Computational Infrastructure, and the Australian Bureau of Statistics for providing the data on laboratory-confirmed pertussis cases, climate, and population growth, respectively. This research was supported by a QCMRI_QUT collaborative seeding grant. W.H. is supported by an ARC future fellowship (FT140101216).
DECLARATION OF INTEREST
None.


