


The pulvinar nucleus is considered one of the most enigmatic thalamic regions. Factors that contribute to its mystery are the vast array of anatomical connections that involve the pulvinar nucleus, its reduced activity in anesthetized or restrained animals, and the resulting difficulties in determining the circuits and stimuli that contribute to its receptive field properties. Additionally, although the pulvinar is commonly considered a single thalamic nucleus, it contains a number of distinct subregions which may be differentially involved in various functions ascribed to the pulvinar (e.g., visual attention, decision making, motor planning, perceptual suppression, synchronization of cortical activity, detection of faces, or fearful stimuli; Wilke et al., Reference Wilke, Mueller and Leopold2009, Reference Wilke, Turchi, Smith, Mishkin and Leopold2010, Reference Wilke, Kagan and Andersen2013; Van Le et al., Reference Van Le, Isbell, Matsumoto, Le, Hori, Tran, Maior, Tomaz, Ono and Nishijo2014; Le et al., Reference Le, Isbell, Matsumoto, Le, Hori, Tran, Maior, Tomaz, Ono and Nishijo2014, Reference Le, Isbell, Matsumoto, Le, Nishimaru, Hori, Maior, Tomaz, Ono and Nishijo2016; Grimaldi et al., Reference Grimaldi, Saleem and Tsao2016; Zhou et al., Reference Zhou, Schafer and Desimone2016b ; Dominguez-Vargas et al., Reference Dominguez-Vargas, Schneider, Wilke and Kagan2017; McFadyen et al., Reference McFadyen, Mermillod, Mattingley, Halász and Garrido2017; Soares et al., Reference Soares, Maior, Isbell, Tomaz and Nishijo2017). In order to understand how the pulvinar contributes to these various tasks, the synaptic circuits within each subregion must first be defined.
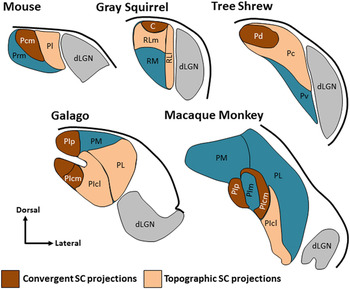
This review focuses on circuits of the mouse lateral posterior nucleus (LPN), a region considered to be the homologue of the primate pulvinar nucleus (Harting et al., Reference Harting, Hall and Diamond1972). As schematically illustrated in Fig. 1, this homology is based to a large extent on commonalities in the projections of the superficial (visual) layers of the superior colliculus (SC), or optic tectum, to the primate pulvinar nucleus, rodent/carnivore LPN, and avian nucleus rotundus (Harting et al., Reference Harting, Glendenning, Diamond and Hall1973; Robson and Hall, Reference Robson and Hall1977; Berson and Graybiel, Reference Berson and Graybiel1978; Mooney et al., Reference Mooney, Fish and Rhoades1984; Takahashi, Reference Takahashi1985; Abramson and Chalupa, Reference Abramson and Chalupa1988; Luppino et al., Reference Luppino, Matelli, Carey, Fitzpatrick and Diamond1988; Hutsler and Chalupa, Reference Hutsler and Chalupa1991; Kelly et al., Reference Kelly, Li, Carden and Bickford2003; Marín et al., Reference Marín, Letelier, Henny, Sentis, Farfán, Fredes, Pohl, Karten and Mpodozis2003; Chomsung et al., Reference Chomsung, Petry and Bickford2008; Masterson et al., Reference Masterson, Li and Bickford2009, Reference Masterson, Li and Bickford2010; Baldwin et al., Reference Baldwin, Wong, Reed and Kaas2011, Reference Baldwin, Balaram and Kaas2013; Fredes et al., Reference Fredes, Vega-Zuniga, Karten and Mpodozis2012; Wei et al., Reference Wei, Bonjean, Petry, Sejnowski and Bickford2011a ). Because of these similarities, we will refer to this region of the mouse thalamus as the pulvinar nucleus. We hope that this nomenclature will assist in comparative studies that may contribute to our understanding of the organization and function of the pulvinar nucleus across species, including that of humans. In order to most explicitly relate the organization of the mouse pulvinar to that of other species, this review emphasizes the regions that receive input from the SC. Although the size of the tectorecipient zones relative to the entire extent of the pulvinar nucleus varies across species, there are a number of similarities in the organization of these zones as discussed below.
The pulvinar nucleus contains two tectorecipient zones. Schematic illustrations indicate regions of the pulvinar nucleus in the mouse, squirrel, tree shrew, galago and macaque monkey that have been shown to receive dense convergent input (brown) or less dense topographic projections (peach) from the SC. The non-tectorecipient zones of the pulvinar are indicated in blue, and the location of the dorsal lateral geniculate nucleus (dLGN, gray) is indicated for reference. Illustrations are not to scale (adapted from Stepniewska et al., Reference Stepniewska, Ql and Kaas2000; Chomsung et al., Reference Chomsung, Petry and Bickford2008; Baldwin et al., Reference Baldwin, Wong, Reed and Kaas2011, Reference Baldwin, Balaram and Kaas2013; Day-Brown et al., Reference Day-Brown, Slusarczyk, Zhou, Quiggins, Petry and Bickford2017). Subdivisions for mouse: Pcm, caudal medial pulvinar, Pl, lateral pulvinar, Prm, rostral medial pulvinar, squirrel: C, caudal pulvinar, RL, rostral lateral pulvinar, RLm, medial rostral lateral pulvinar, RLl, lateral rostral lateral pulvinar, RM, rostral medial pulvinar, tree shrew: Pc, central pulvinar, Pd, dorsal pulvinar, Pv, ventral pulvinar, galago and macaque: PIcm, central medial inferior pulvinar, PIcl, central lateral inferior pulvinar, PIp, posterior inferior pulvinar, PIpl, posterior lateral inferior pulvinar, PL, lateral pulvinar, PM, medial pulvinar, macaque: PIm, medial inferior pulvinar.
Tectopulvinar cells
The SC projections to the pulvinar nucleus originate from a unique class of cells, termed widefield vertical (WFV) cells (Fig. 2). WFV cells have been identified in a variety of species (chicken, pigeon, mouse, rat, ground squirrel, gray squirrel, tree shrew; Mooney et al., Reference Mooney, Nikoletseas, Ruiz and Rhoades1988; Karten et al., Reference Karten, Cox and Mpodozis1997; Luksch et al., Reference Luksch, Cox and Karten1998, Reference Luksch, Karten, Kleinfeld and Wessel2001; Major et al., Reference Major, Luksch and Karten2000; Marín et al., Reference Marín, Letelier, Henny, Sentis, Farfán, Fredes, Pohl, Karten and Mpodozis2003; May, Reference May2006; Chomsung et al., Reference Chomsung, Petry and Bickford2008; Endo et al., Reference Endo, Tarusawa, Notomi, Kaneda, Hirabayashi, Shigemoto and Isa2008; Isa and Hall, Reference Isa and Hall2009; Fredes et al., Reference Fredes, Vega-Zuniga, Karten and Mpodozis2012; Kaneda et al., Reference Kaneda, Kasahara, Matsui, Katoh, Mizukami, Ozawa, Watanabe and Isa2011; Gale and Murphy, Reference Gale and Murphy2014); in each case these cells display very large dendritic fields that cover significant regions of the SC or optic tectum. Based on the configuration of their dendritic arbors, and interaction with retinotectal inputs in vitro (Luksch et al., Reference Luksch, Karten, Kleinfeld and Wessel2001; Endo et al., Reference Endo, Tarusawa, Notomi, Kaneda, Hirabayashi, Shigemoto and Isa2008), WFV cells have been referred to as motion detectors (Major et al., Reference Major, Luksch and Karten2000). This concept has been corroborated in vivo in the mouse, where it has been demonstrated that WFV cells respond best to a small visual stimulus moving in any direction within a large visual field (Gale and Murphy, Reference Gale and Murphy2014, Reference Gale and Murphy2016).
WFV cells project to the ipsilateral and contralateral pulvinar. Panel A illustrates an injection of a retrogradely transported virus (MIT viral vector core: hEF1α-EYFP-IRES-cre) in the pulvinar (PUL) of a wild type mouse that induced the expression of yellow fluorescent protein (YFP, green) in WFV cells of the SC. Cells labeled by this injection are illustrated in panel B in a contralateral SC section that was stained with an antibody against calretinin (purple), which delineates the stratum griseum superficiale (SGS). The WFV tectopulvinar cells are located in the stratum opticum (SO) and lower SGS and extend dendrites to the surface of the SC, where they end in complex dendritic tufts (panel C). Panels D and E illustrate WFV cells labeled by injections of retrogradely transported cre-dependent viruses (MIT-viral vector core: hEF1α-LS1L-mCherry and hEF1α-LS1L-EYFP) in the left and right pulvinar of a substance P-cre mouse (Jackson Labs stock number 021877) to induce the expression of either YFP (green, left pulvinar injection) or mCherry (purple, right pulvinar injection) in cre-expressing neurons. Many WFV cells expressed both YFP and mCherry (white), demonstrating that a subpopulation of WFV cells bilaterally innervate the pulvinar, and that WFV cells express substance P. Scale bars: A and B = 100 µm, C = 10 µm, D = 50 µm and also applies to E. dLGN, dorsal lateral geniculate nucleus, PT, pretectum, OT, optic tract. Virus injection methods as in Bickford et al. (Reference Bickford, Zhou, Krahe, Govindaiah and Guido2015).

In the ground squirrel, two types of WFV cells have been identified. Type I WFV cells extend their dendrites to the most superficial extent of the SC (within the most dorsal regions of the stratum griseum superficiale, or SGS), while type II WFV cell dendrites end in the middle of the SGS (Major et al., Reference Major, Luksch and Karten2000). These two cell types have been found to project to different regions of the pulvinar nucleus (Fredes et al., Reference Fredes, Vega-Zuniga, Karten and Mpodozis2012; described in more detail below). Similar to type I and type II WFV cells, the dendrites of type I and type II tectorotundal cells end in different lamina of the chick optic tectum (Luksch et al., Reference Luksch, Cox and Karten1998), and each type responds differentially to electrical stimulation of retinal input (Luksch et al., Reference Luksch, Karten, Kleinfeld and Wessel2001).
In the mouse, WFV cells have not been subdivided. However, the availability of transgenic mouse lines (e.g., Gale and Murphy, Reference Gale and Murphy2014, Reference Gale and Murphy2016; Byun et al., Reference Byun, Kwon, Ahn, Liu, Forrest, Demb and Kim2016) may help to facilitate the categorization of these cells. If subclasses of WFV cells exist in the mouse, those that extend dendrites most superficially within the SC (Fig. 2C) could potentially be innervated by populations of retinal axons that are restricted to the most superficial regions of the SGS (e.g., those that originate from direction-selective ganglion cells; Rivlin-Etzion et al., Reference Rivlin-Etzion, Zhou, Wei, Elstrott, Nguyen, Barres, Huberman and Feller2011). Future studies in mice may take advantage of ganglion cell-specific transgenic lines to determine whether WFV cells are innervated by single ganglion cell subtypes (to form dedicated parallel channels of information flow to the pulvinar) or whether they receive convergent input from multiple classes of ganglion cells.
Tectopulvinar projection patterns
The projections of WFV cells target specific subregions of the pulvinar. In the mouse, the caudal medial pulvinar (Pcm) receives bilateral input from WFV cells and the lateral pulvinar (Pl) receives input from ipsilateral WFV cells (Fig. 3). Similar projection patterns have previously been identified in the rat (Takahashi, Reference Takahashi1985), and these two subdivisions can be distinguished with a variety of immunocytochemical markers (Nakamura et al., Reference Nakamura, Hioki, Furuta and Kaneko2015). In the mouse, the Pcm contains a dense population of terminals that contain substance P (Fig. 4). Similarly, the primate posterior (PIp) and central medial (PIcm) subdivisions of the inferior pulvinar (Fig. 1) also contain a dense population of terminals that stain for substance P (Stepniewska et al., Reference Stepniewska, Ql and Kaas2000). The mouse Pcm can also be defined based on cells that contain both the calcium-binding protein calretinin and express the substance P receptor neurokinin 1 (NK1, Fig. 3); in contrast, the Pl does not stain with antibodies against substance P, NK1, or calretinin (Figs. 3 and 4).
Caudal medial pulvinar (Pcm) cells express calretinin (CR) and neurokinin 1 (NK1) and align with bilateral SC projections. Confocal images illustrate ipsilateral (A, C, green) and contralateral (D, F, green) projections to the pulvinar that were labeled by a unilateral virus injection in the SC. These sections were also stained with antibodies against CR (B, E, purple) to define the Pcm (which contains CR) and the lateral pulvinar (Pl, which does not contain CR). Adjacent sections (C, F) stained for CR (purple) and NK1 (green) illustrate that CR-positive Pcm cells express NK1. This expression pattern is shown at higher magnification in half micron optical sections in panels G (CR, purple), H (NK1, green) and I (CR, purple, and NK1, green, asterisks indicate cells labeled with both antibodies). Scale in A = 50 µm and applies to A–F. Scale in G = 10 µm and applies to G–I. dLGN, dorsal lateral geniculate nucleus, OT, optic tract, PT, pretectum. Methods as in Masterson et al. (Reference Masterson, Li and Bickford2010) and Bickford et al. (Reference Bickford, Zhou, Krahe, Govindaiah and Guido2015).

The Pcm contains a dense population of terminals that contain substance P. (A–C) Caudal to rostral sections stained with an antibody against substance P (visualized with a diaminobenzidine reaction). Staining is densest in the caudal and medial pulvinar (Pcm). Little staining is observed in the lateral pulvinar (Pl). Scale = 100 µm and applies to all panels. dLGN, dorsal lateral geniculate nucleus, MGN, medial geniculate nucleus, OT, optic tract, PT, pretectum. Methods as in Masterson et al. (Reference Masterson, Li and Bickford2010).

The organization of tectorecipient zones in the mouse pulvinar is very similar to that identified in the ground squirrel, where the caudal pulvinar receives bilateral, nontopographic SC projections that originate from type I WFV cells, while the rostral pulvinar receives topographic, ipsilateral SC projections that originate from type II WFV cells (Fredes et al., Reference Fredes, Vega-Zuniga, Karten and Mpodozis2012). As illustrated in Fig. 1, two types of tectopulvinar projections, nontopographic or “diffuse” projections and topographic “specific” projections, have also been identified in gray squirrels (Baldwin et al., Reference Baldwin, Wong, Reed and Kaas2011), tree shrews (Luppino et al., Reference Luppino, Matelli, Carey, Fitzpatrick and Diamond1988; Chomsung et al., Reference Chomsung, Petry and Bickford2008), and galagos (Baldwin et al., Reference Baldwin, Balaram and Kaas2013). In the tree shrew, the nontopographic tectal projections are highly convergent. These tectopulvinar terminals form dense clusters that surround and synapse on single pulvinar dendrites. In contrast, the topographic projections are less convergent and form smaller, more discrete, synaptic clusters (Chomsung et al., Reference Chomsung, Petry and Bickford2008; Wei et al., Reference Wei, Masterson, Petry and Bickford2011b ). These two tectopulvinar innervation patterns have been revealed across species using antibodies against the type 2 vesicular glutamate transporter (vGLUT2, contained in tectopulvinar terminals; Wei et al., Reference Wei, Masterson, Petry and Bickford2011b ); vGLUT2 staining is very dense in regions of the pulvinar that receive convergent tectal input, and lighter in regions that receive topographic tectal projections (Chomsung et al., Reference Chomsung, Petry and Bickford2008; Baldwin et al., Reference Baldwin, Wong, Reed and Kaas2011, Reference Baldwin, Balaram and Kaas2013). Multiple tectopulvinar pathways that originate from separate SC cell types have also been identified in the cat (Abramson and Chalupa, Reference Abramson and Chalupa1988; Kelly et al., Reference Kelly, Li, Carden and Bickford2003), and in the pigeon, a unique interdigitated pattern of tectorotundal projections originate from separate optic tectum cell types (Marín et al., Reference Marín, Letelier, Henny, Sentis, Farfán, Fredes, Pohl, Karten and Mpodozis2003).
The precise organization of tectopulvinar projections has not been studied in mice. Tracing the axonal projections of single WFV cells would facilitate our understanding of the organization and potential topography of this pathway. Monosynaptic circuit tracing (Wickersham et al., Reference Wickersham, Finke, Conzelmann and Callaway2007) in transgenic mice (e.g., calretinin-cre mice), could also help to determine whether subclasses of WFV cells target distinct pulvinar subdivisions. In many species, the pulvinar has been subdivided using histochemical staining for the enzyme acetylcholinesterase and/or immunohistochemical staining for the neuromodulator substance P (Graybiel and Berson, Reference Graybiel and Berson1980; Abramson and Chalupa, Reference Abramson and Chalupa1988; Luppino et al., Reference Luppino, Matelli, Carey, Fitzpatrick and Diamond1988; Hutsler and Chalupa, Reference Hutsler and Chalupa1991; Stepniewska et al., Reference Stepniewska, Qi and Kaas1999; Kelly et al., Reference Kelly, Li, Carden and Bickford2003; Chomsung et al., Reference Chomsung, Petry and Bickford2008; Baldwin et al., Reference Baldwin, Wong, Reed and Kaas2011, Reference Baldwin, Balaram and Kaas2013; Fredes et al., Reference Fredes, Vega-Zuniga, Karten and Mpodozis2012). Where examined, these two stains overlap to a great extent, perhaps due to involvement of acetylcholinesterase in the hydrolysis of substance P (Goebel and Pourcho, 1992a, 1992b). Studies in the cat and rat suggest that the expression of substance P in tectopulvinar pathways is developmentally regulated, and influenced by visual input (Miguel-Hidalgo et al., Reference Miguel-Hidalgo, Senba, Takatsuji and Tohyama1990, Reference Miguel-Hidalgo, Senba, Takatsuji and Tohyama1991; Behan et al., Reference Behan, Appell and Kime1993). The mouse is an ideal model to further define the role of substance P in tectopulvinar pathways by using transgenic lines, optogenetics, and/or designer receptors exclusively activated by designer drugs (DREADD) to manipulate substance P pathways and characterize any resulting behavioral effects.
Synaptic properties of tectopulvinar terminals
Tectopulvinar terminals have consistently been found to form clusters of relatively large terminals that surround and synapse on the proximal dendrites of pulvinar neurons (Partlow et al., Reference Partlow, Colonnier and Szabo1977; Robson and Hall, Reference Robson and Hall1977; Crain and Hall, 1980a; Kelly et al., Reference Kelly, Li, Carden and Bickford2003; Chomsung et al., Reference Chomsung, Petry and Bickford2008; Masterson et al., Reference Masterson, Li and Bickford2009; Wei et al., Reference Wei, Masterson, Petry and Bickford2011b ; Bickford, Reference Bickford2016); tectopulvinar terminals in the mouse exhibit similar characteristics (Fig. 5B). In vitro slice studies in the rat and tree shrew have demonstrated that multiple tectopulvinar axons can converge on single cells (Masterson et al., Reference Masterson, Li and Bickford2010; Wei et al., Reference Wei, Masterson, Petry and Bickford2011b ), presumably contributing to the large receptive fields of pulvinar neurons (Chalupa et al., Reference Chalupa, Williams and Hughes1983; Mooney et al., Reference Mooney, Fish and Rhoades1984; Chalupa and Abramson, Reference Chalupa and Abramson1988; Casanova et al., Reference Casanova, Merabet, Desautels and Minville2001; Dumbrava et al., Reference Dumbrava, Faubert and Casanova2001; Berman and Wurtz, Reference Berman and Wurtz2011; Roth et al., Reference Roth, Dahmen, Muir, Imhof, Martini and Hofer2016).
Ultrastructure of cortical and tectal terminals in the mouse pulvinar. Terminals labeled by the anterograde transport of biotinylated dextran amine injected in V1 (A), superior colliculus (B) or the posterior/postrhinal cortex (C) contact (white arrows) the proximal (A, B) and distal (C) dendrites of pulvinar neurons (green overlay). Sections were additionally stained with gold particles to reveal the distribution of GABA. This identifies two types of GABAergic terminals (purple overlay) in the mouse pulvinar: F2 profiles (B) contain a low density of vesicles and F1 profiles (C) contain a high density of vesicles. Scale = 600 nm and applies to all panels. Methods as in Li et al. (Reference Li, Bickford and Guido2003a ).

Tectopulvinar terminals release glutamate to activate ionotropic glutamate receptors on postsynaptic neurons (Masterson et al., Reference Masterson, Li and Bickford2010; Wei et al., Reference Wei, Masterson, Petry and Bickford2011b ). Stimulation of tectopulvinar terminals at frequencies of up to 20 Hz elicits postsynaptic responses that maintain relatively stable amplitudes (unlike the frequency-dependent amplitude changes demonstrated in other thalamic pathways; for review see Bickford, Reference Bickford2016). This frequency-independence may be due to the synaptic arrangements of these terminals and/or the presynaptic proteins contained within them (synapsin I and synapsin II; Wei et al., Reference Wei, Masterson, Petry and Bickford2011b ). Another unique feature of tectopulvinar terminals is that stimulation at 100 Hz can elicit their release of substance P which, through activation of neurokinin 1 receptors, can boost tectopulvinar responses (Masterson et al., Reference Masterson, Li and Bickford2010).
Again, the mouse is an ideal model to study further details of the synaptic properties of tectopulvinar terminals. These terminals can be specifically activated using optogenetic techniques (Maire et al., Reference Maire, Masterson and Zhou2015) and transgenic lines (e.g., mice that lack synapsins; Kielland et al., Reference Kielland, Erisir, Walaas and Heggelund2006; Song and Augustine, Reference Song and Augustine2015) can potentially be used to determine the mechanisms that underlie their unique frequency-independence. Studies in mice may also reveal whether substance P is contained in all tectopulvinar projections, or confined to those originating from specific WFV subclasses. Our previous in vitro studies in the rat suggested that all tectopulvinar projections contain substance P (Masterson et al., Reference Masterson, Li and Bickford2010). However, our investigation was limited to the caudal most regions of the pulvinar (likely corresponding to the mouse Pcm; Fig. 4).
Retinal innervation and plasticity of pulvinar pathways
Tecto-pulvinar pathways have often been cited as the substrate mediating “blindsight”: the ability, in the absence of visual perception, to navigate using visual cues and respond to negative or fearful facial expressions (Leopold, Reference Leopold2012; Schmid and Maier, Reference Schmid and Maier2015). However, it has recently been demonstrated that during development, the pulvinar transiently receives substantial direct input from the retina, which diminishes to sparser levels in adults. This pathway shows considerable plasticity: in situations where V1 is lost at an early age, this retinopulvinar pathway does not regress, and may account for the preservation of vision when lesions to V1 occur during infancy (Warner et al., Reference Warner, Kwan and Bourne2012; Kaas, Reference Kaas2015; Bridge et al., Reference Bridge, Leopold and Bourne2016).
In the mouse, it has been demonstrated that at least some of the retinopulvinar projections arise from intrinsically photosensitive (melanopsin-containing) ganglion cells, and a portion of pulvinar neurons are functionally influenced by melanopsin-derived signals (Allen et al., Reference Allen, Procyk, Howarth, Walmsley and Brown2016). A melanopsin-dependent light aversion response in neonatal mice activates pulvinar cells, as well as cells in the amygdala (which as discussed below, receives input from the pulvinar; Delwig et al., Reference Delwig, Logan, Copenhagen and Ahn2012). Perhaps, as in primates, direct retinopulvinar projections in the mouse are also more robust during development and function to initiate basic movements in response to light. However, it is still unknown how direct retinopulvinar versus indirect retino-tecto-pulvinar pathways contribute to melanopsin-dependent pulvinar responses, and motor behaviors.
Lesion studies in the hamster demonstrated that terminals originating from the retina, SC and cortex all compete for territory in the developing pulvinar nucleus; retinopulvinar terminations expand after SC lesions and/or combined SC and cortex lesions (Crain and Hall, Reference Crain and Hall1980b , Reference Crain and Hall1980c , Reference Crain and Hall1981). Further investigations in mice may help to define mechanisms underlying the developmental competition between retinopulvinar, tectopulvinar, and corticopulvinar projections, and how this might correlate with transitions from the simple light-aversive movements of neonates to the more complex visually-guided escape, freezing or prey capture behaviors of adult mice (Yilmaz and Meister, Reference Yilmaz and Meister2013; De Franceschi et al., Reference De Franceschi, Vivattanasarn, Saleem and Solomon2016; Hoy et al., Reference Hoy, Yavorska, Wehr and Niell2016).
The striate-recipient zones of the pulvinar
Across mammalian species, the pulvinar also contains zones that are innervated by the striate cortex (cat; Berson and Graybiel, Reference Berson and Graybiel1983; Guillery et al., Reference Guillery, Feig and Van Lieshout2001; Huppé-Gourgues et al., Reference Huppé-Gourgues, Bickford, Boire, Ptito and Casanova2006; rat; Li et al., Reference Li, Wang and Bickford2003c ; macaque; Ogren and Hendrickson, Reference Ogren and Hendrickson1979a ). In rodents, terminals that originate from V1 innervate the Pl, as well as more rostral thalamic regions (the rostral medial pulvinar, Prm, and lateral dorsal nucleus, LD; Bourassa and Deschênes Reference Bourassa and Deschênes1995). These more rostral regions are well segregated from the tectorecipient zones. However, the mouse Pl shows considerable overlap in the distribution of terminals originating from the SC and V1 (Figs. 6L and 7B). The striate- and tectorecipient zones of the pulvinar are also well segregated in other species, but may contain some zones of overlap (e.g. the cat LPl-2; Abramson and Chalupa, Reference Abramson and Chalupa1988; Chalupa and Abramson, Reference Chalupa and Abramson1989; Kelly et al., Reference Kelly, Li, Carden and Bickford2003; Huppé-Gourgues et al., Reference Huppé-Gourgues, Bickford, Boire, Ptito and Casanova2006).
Tectopulvinar and corticopulvinar terminals overlap in the caudal medial (Pcm) and lateral (Pl) subdivisions of the mouse pulvinar. This overlap is demonstrated via dual virus injections in the SC and lateral extrastriate cortex (LES, first 2 columns, A–D and E–H), or SC and V1 (last column, I–L). The Pcm and Pl subdivisions are defined using immunocytochemical staining for calretinin (CR, blue, first row, A, E, I). Virus injections were placed in the SC to induce the expression of yellow fluorescent protein (green, panels B, F, J), and in the cortex (V1 or LES) to induce the expression of TdTomato (red, panels C, G, K), overlap of the CR and virus labeling patterns (panels D, H, L) show that the Pcm is innervated by the SC and LES, while the Pl is innervated by the SC, V1 and LES (panels D, H, L). Scale bar in D = 100 µm and applies to all panels. dLGN, dorsal lateral geniculate nucleus, PT, pretectum. Methods as in Jurgens et al. (Reference Jurgens, Bell, McQuiston and Guido2012) and Bickford et al. (Reference Bickford, Zhou, Krahe, Govindaiah and Guido2015).

Potential input integration in the mouse pulvinar. Terminals labeled by a virus injection in V1 (green, A, B) and the ipsilateral SC (purple, B) overlap in the Pl. (C) Two biocytin-filled pulvinar neurons (green) and surrounding tectopulvinar terminals (purple, labeled by a virus injection in the ipsilateral SC). The dendrites of the pulvinar neurons extend across subdivisions. (D) Biocytin-filled pulvinar interneurons (purple) identified in a mouse line (Jackson Laboratories stock number 007677) that expresses green fluorescent protein in GABAergic neurons (green) extend dendrites across subdivisions. Scale bars = 20 µm. Methods as in Bickford et al., (Reference Bickford, Zhou, Krahe, Govindaiah and Guido2015).

The striate-recipient zones of the mouse pulvinar form reciprocal connections with V1, with pulvinocortical projections to V1 ending primarily in layers I and V (Fig. 8B; Herkenham, Reference Herkenham1980; Roth et al., Reference Roth, Dahmen, Muir, Imhof, Martini and Hofer2016; Rubio-Garrido et al., Reference Rubio-Garrido, Pérez-de-Manzo, Porrero, Galazo and Clascá2009). Retrograde tracing studies in the mouse indicate that the pulvinocortical projections to V1 are organized in a roughly topographic manner, but this organization is clearly different from the precise topography of connections between V1 and the dorsal lateral geniculate nucleus (dLGN; Roth et al., Reference Roth, Dahmen, Muir, Imhof, Martini and Hofer2016). In addition, tracing of single axons in the rat indicates that individual pulvinar cells that project to V1 also send projections to various areas of the extrastriate cortex, as well as the striatum (Nakamura et al., Reference Nakamura, Hioki, Furuta and Kaneko2015).
The mouse pulvinar projects to the cortex, striatum and amygdala. Injections of biotinylated dextran amine in the mouse pulvinar (A) label terminals in V1 (B) and extrastriate cortex regions including the posterior medial area (PM, panel B) and the lateral medial area (LM, panel D). Cells in the superior colliculus (C) and LM (D) are also labeled by retrograde transport. (E) The pulvinar also projects to the caudate and putamen (CPu) and lateral amygdala (LA). Scale = 200 µm and applies to all panels. Methods as in Chomsung et al. (Reference Chomsung, Wei, Day-Brown, Petry and Bickford2010).

V1 projections to the pulvinar have been shown to arise from cells in layer V, as well as cells in lower layer VI (cat; Abramson and Chalupa, Reference Abramson and Chalupa1985; rat; Bourassa and Deschênes, Reference Bourassa and Deschênes1995; galago; Conley and Raczkowski, Reference Conley and Raczkowski1990; macaque; Lund et al., Reference Lund, Lund, Hendrickson, Bunt and Fuchs1975; mouse; Roth et al., Reference Roth, Dahmen, Muir, Imhof, Martini and Hofer2016). The terminals that arise from layer V cells are significantly larger than corticogeniculate terminals or tectopulvinar terminals (rat; Bourassa and Deschênes, Reference Bourassa and Deschênes1995; tree shrew; Chomsung et al., Reference Chomsung, Petry and Bickford2008; Day-Brown et al., Reference Day-Brown, Slusarczyk, Zhou, Quiggins, Petry and Bickford2017; cat; Guillery et al., Reference Guillery, Feig and Van Lieshout2001; Huppé-Gourgues et al., Reference Huppé-Gourgues, Bickford, Boire, Ptito and Casanova2006; Kelly et al., Reference Kelly, Li, Carden and Bickford2003; rat; Li et al., Reference Li, Wang and Bickford2003c ; Masterson et al., Reference Masterson, Li and Bickford2009), and similar large V1 corticopulvinar terminals are found in the mouse (Figs. 5A and 7A).
Extrastriate connections of the mouse pulvinar nucleus
Visual areas of the mouse cortex have been defined on the basis of corticocortical connections with V1 (Wang and Burkhalter, Reference Wang and Burkhalter2007). In this way nine distinct visual areas that surround V1 have been identified: posterior (P), postrhinal (POR), lateromedial (LM), laterointermediate (LI), anterolateral (AL), rostrolateral (RL), anterior (A) anteromedial (AM), and posterormedial (PM). All of these extrastriate visual areas are reciprocally connected to the mouse pulvinar nucleus (Tohmi et al., Reference Tohmi, Meguro, Tsukano, Hishida and Shibuki2014), and also innervate the SC (Wang and Burkhalter, Reference Wang and Burkhalter2013). The tectorecipient zones of the pulvinar are primarily connected with the lateral extrastriate cortex (LES, Fig. 6C and 6G; primarily areas P, POR, LM, and LI). These connections are roughly topographic, with the Pcm forming reciprocal connections primarily with more ventral regions (P and POR) and the Pl primarily forming connections with more dorsal regions adjacent to V1 (LM and LI; Figs. 8 and 9; Tohmi et al., Reference Tohmi, Meguro, Tsukano, Hishida and Shibuki2014). However, given the widespread projections of single pulvinocortical axons identified in the rat (Nakamura et al., Reference Nakamura, Hioki, Furuta and Kaneko2015), the exact organizational scheme of pulvinocortical projections remains an open question.
The tectorecipient mouse pulvinar forms interconnected loops with the cortex, striatum and amygdala. The schematic diagrams illustrate the main connections of the tectorecipient subdivisions of the mouse pulvinar. The caudal medial pulvinar (Pcm, red) receives bilateral input from WFV cells of the SC, and is reciprocally connected to the posterior (P) and postrhinal (POR) regions of the cortex, where it innervates layers I and IV–VI. Both the Pcm and P/POR project to the caudal caudate/putamen (CPu) and lateral amygdala (LA). The lateral pulvinar (Pl, blue) receives ipsilateral input from WFV cells, and is reciprocally connected to V1 and the lateral medial (LM) and lateral intermediate (LI) regions of the cortex. Within V1, the Pl projects to layers I and Va. Within LM and LI, the Pl projects to layer I and IV. The Pl, LM and LI project to the middle regions of the CPu.

Within the extrastriate cortical areas connected with the tectorecipient pulvinar, pulvinocortical terminals are concentrated in layer IV, and corticopulvinar cells are concentrated in layer VI (Fig. 8D; Herkenham, Reference Herkenham1980; Abramson and Chalupa, Reference Abramson and Chalupa1985; Masterson et al., Reference Masterson, Li and Bickford2009; Chomsung et al., Reference Chomsung, Wei, Day-Brown, Petry and Bickford2010; Nakamura et al., Reference Nakamura, Hioki, Furuta and Kaneko2015; Roth et al., Reference Roth, Dahmen, Muir, Imhof, Martini and Hofer2016). Cortical terminals that innervate the tectorecipient zones of the pulvinar nucleus primarily form smaller terminals that innervate smaller, distal dendrites (Fig. 5C; Robson and Hall, Reference Robson and Hall1977; Masterson et al., Reference Masterson, Li and Bickford2009; Chomsung et al., Reference Chomsung, Wei, Day-Brown, Petry and Bickford2010). Electrical stimulation of corticopulvinar terminals in tectorecipient zones of the rat initially elicits small amplitude glutamatergic excitatory postsynaptic potentials (EPSPs), but repetitive stimulation rapidly increases EPSP amplitudes in a frequency-dependent manner (Masterson et al., Reference Masterson, Li and Bickford2010). This contrasts with electrical activation of corticopulvinar terminals in more rostral regions of the rat pulvinar nucleus, where a second type of large amplitude EPSP can also be elicited, which exhibits a frequency-dependent decrease in amplitude (Li et al., 2003b). These two types of EPSPs, which presumably result from the activation of terminals that originate from layer V or layer VI corticopulvinar cells, also differ in the degree of convergence onto single pulvinar neurons. Electrical stimulation of layer VI corticopulvinar axons with increasing current levels results in a graded increase in the amplitude of postsynaptic responses, demonstrating that many terminals converge on postsynaptic neurons. In contrast, electrical stimulation of layer V corticopulvinar axons with increasing current levels results in “all or none” changes in the amplitude of postsynaptic responses, demonstrating that each postsynaptic neuron receives input from only a few of these axons (Li et al., Reference Li, Guido and Bickford2003b ; Masterson et al., Reference Masterson, Li and Bickford2010).
The function of layer V versus layer VI corticopulvinar projections is still unclear. It has been proposed that layer V corticopulvinar projections function to transfer signals from one cortical area to another (Guillery and Sherman, Reference Guillery and Sherman2002). It has also been suggested that layer V corticothalamic projections could function to detect the relative timing of sensory events and ongoing cortical activity (Groh et al., Reference Groh, de Kock, Wimmer, Sakmann and Kuner2008). Experiments in mice could be designed to specifically manipulate the activity of layer V versus layer VI corticopulvinar projections to determine the effects on pulvinar activity, cortical activity and/or behavior. Such experiments would be particularly important for testing the hypothesis that layer V corticopulvinar projections are the primary determinant (“drivers”) of pulvinar neuron receptive field properties (Sherman and Guillery, Reference Sherman and Guillery1998).
Pulvinar projections to the striatum and amygdala
The tectorecipient zones of the pulvinar also project to the striatum and lateral amygdala (Takahashi, Reference Takahashi1985; Harting et al., Reference Harting, Updyke and Lieshout2001a ,Reference Harting, Updyke and Lieshout b ; McHaffie et al., Reference McHaffie, Stanford, Stein, Coizet and Redgrave2005; Day-Brown et al., Reference Day-Brown, Wei, Chomsung, Petry and Bickford2010; Nakamura et al., Reference Nakamura, Hioki, Furuta and Kaneko2015; Roth et al., Reference Roth, Dahmen, Muir, Imhof, Martini and Hofer2016), suggesting pulvinar involvement in the visual guidance of movement. Recently, activation of the mouse SC-pulvinar-amygdala pathway has been shown to elicit freezing responses, while inactivation of this pathway inhibits the innate freezing response to overhead looming stimuli (Wei et al., Reference Wei, Liu, Zhang, Liu, Tang, He, Wu, Zhou, Liu, Li, Zhang, Zhou, Xu, Chen, Bi, Hu, Xu and Wang2015). Similar pathways have been implicated in visually-triggered fear responses across species (Carr, Reference Carr2015).
In the tree shew, pulvinar-amygdala cells are concentrated in the regions of the pulvinar that receive the nontopographic projections from the SC (Pd, Fig. 1, Day-Brown et al., Reference Day-Brown, Wei, Chomsung, Petry and Bickford2010). Likewise, mouse pulvinar-amygdala cells appear to be concentrated in the Pcm (Wei et al., Reference Wei, Liu, Zhang, Liu, Tang, He, Wu, Zhou, Liu, Li, Zhang, Zhou, Xu, Chen, Bi, Hu, Xu and Wang2015). In the rat, SC contacts on pulvinar-amygdala cells have been identified (Linke et al., Reference Linke, De Lima, Schwegler and Pape1999), and cells in regions corresponding to the Pcm branch to innervate the ventral temporal cortex and amygdala (Doron and Ledoux, Reference Doron and Ledoux2000), or caudal striatum (Nakamura et al., Reference Nakamura, Hioki, Furuta and Kaneko2015). Thus, the bilateral SC-pulvinar-amygdala pathway (Fig. 9A) may primarily function to activate freezing or escape responses. Mice could be used for future studies to determine whether the unilateral SC-pulvinar-striatum projections (Fig. 9B) trigger distinct motor responses, such as prey capture (Hoy et al., Reference Hoy, Yavorska, Wehr and Niell2016).
Cell types within the pulvinar nucleus
Our understanding of the organization of the dLGN was greatly advanced by the identification of morphological cells types that correlate with functional cell classes (e.g. Friedlander et al., Reference Friedlander, Lin, Stanford and Sherman1981); identification of structure/function correlations for pulvinar neurons is expected to similarly advance our understanding of this nucleus. The pulvinar contains projection cells (Fig. 7C; Nakamura et al., Reference Nakamura, Hioki, Furuta and Kaneko2015), GABAergic interneurons (Fig. 7D; Carden and Bickford, Reference Carden and Bickford2002; Chomsung et al., Reference Chomsung, Petry and Bickford2008; Li et al., Reference Li, Wang and Bickford2003c ), and a dense population of glial cells (glial to neuron ratio of approximately 3:1 in the tree shrew pulvinar; Wei et al., Reference Wei, Bonjean, Petry, Sejnowski and Bickford2011a ). In the rat, the axons of individual projection cells have been shown to innervate multiple cortical areas, multiple cortical lamina, as well as the striatum and amygdala (Nakamura et al., Reference Nakamura, Hioki, Furuta and Kaneko2015). Evidence in the cat and primate also suggests that pulvinar axons innervate widespread cortical areas (Kaufman et al., Reference Kaufman, Rosenquist and Raczkowski1984; Baleydier and Mauguière, Reference Baleydier and Mauguière1987; Rockland, Reference Rockland2002). Therefore, the subdivision of pulvinar neurons based on projection targets is not straightforward.
In addition, the dendrites of pulvinar neurons are not restricted to specific input zones (Fig. 7C and 7D; Ogren and Hendrickson, Reference Ogren and Hendrickson1979b ; Imura and Rockland, Reference Imura and Rockland2006; Nakamura et al., Reference Nakamura, Hioki, Furuta and Kaneko2015). The widespread distribution of pulvinar dendritic arbors may explain why SC cells are transynaptically labeled after pseudorabies virus injections in the middle temporal cortical area (Lyon et al., Reference Lyon, Nassi and Callaway2010), even though tectopulvinar terminals do no overlap the distribution of pulvinar somata labeled by retrograde tracer injections in the same cortical regions (Stepniewska et al., Reference Stepniewska, Qi and Kaas1999). The distribution of pulvinar neuron dendritic arbors suggests that a substantial integration of inputs may occur even when the distributions of pulvinar afferents are largely segregated. For example, the dendritic fields of individual mouse pulvinar neurons can extend across both the Pcm and Pl (Fig. 7C and 7D), potentially receiving input from bilateral and ipsilateral tectopulvinar projections (Fig. 3A and 3D), V1 (Figs. 6K and 7A), as well as extrastriate cortical areas (Fig. 6C and 6G). Therefore, it may be challenging to identify subclasses of pulvinar neurons based on presynaptic inputs.
Comparison of neurons recorded within tectorecipient and striate-recipient zones of the cat pulvinar complex have revealed differences in receptive field sizes, direction- and orientation selectivity (Chalupa et al., Reference Chalupa, Williams and Hughes1983; Abramson and Chalupa, Reference Abramson and Chalupa1988; Chalupa and Abramson, Reference Chalupa and Abramson1988, Reference Chalupa and Abramson1989). However, analysis of spatiotemporal receptive field properties in these two zones using white noise and reverse correlation analysis suggests a significant integration of V1 and SC inputs across subdivisions (Piché et al., Reference Piché, Thomas and Casanova2015). Furthermore, as discussed above, retrograde tracing techniques demonstrated that mouse pulvinocortical projections to V1 are coarsely topographic (Roth et al., Reference Roth, Dahmen, Muir, Imhof, Martini and Hofer2016). However, this same study revealed that individual pulvinocortical boutons are activated by widely dispersed locations across the visual field, suggesting that while pulvinocortical axon projections may be aligned with the retinotopic organization of V1, they can contribute a surround modulation of cortical neurons that extends well beyond what their anatomical topography might imply.
Again, the mouse may be a useful model to dissect potential structure/function relationships within the pulvinar. Transgenic mouse lines (e.g., calretinin-cre) may provide a starting point for subdividing neuron groups, and whole cell recordings may identify differences in membrane properties (Monckton and McCormick, Reference Monckton and McCormick2002; Li et al., Reference Li, Bickford and Guido2003a ; Ramcharan et al., Reference Ramcharan, Gnadt and Sherman2005; Wei et al., Reference Wei, Bonjean, Petry, Sejnowski and Bickford2011a ). However, perhaps the most important step in this process is the characterization of pulvinar receptive field properties in moving animals, as discussed below.
Pulvinar activity and visual context
In the anesthetized mouse, spontaneous activity in the pulvinar is significantly lower than that recorded in the dLGN (Roth et al., Reference Roth, Dahmen, Muir, Imhof, Martini and Hofer2016), and even in awake but inactive primates, the spontaneous activity of pulvinar neurons is less than half that of dLGN neurons (Ramcharan et al., Reference Ramcharan, Gnadt and Sherman2005). In addition, in anesthetized mice the proportion of pulvinar neurons that respond to simple visual stimuli is approximately half that of dLGN neurons (Allen et al., Reference Allen, Procyk, Howarth, Walmsley and Brown2016). These differences in activity levels/visual responsiveness likely reflect functional distinctions between these two visual pathways. Recently, imaging studies in actively-moving mice have demonstrated that pulvinocortical projections to V1 signal discrepancies between optic flow and running speed (Roth et al., Reference Roth, Dahmen, Muir, Imhof, Martini and Hofer2016). A similar role for the pulvinar in visuomotor coupling is supported by primate studies, where inactivation of the pulvinar nucleus disrupts the planning of visually-guided eye and hand movements (Wilke et al., Reference Wilke, Turchi, Smith, Mishkin and Leopold2010). Thus, the activity of the pulvinar nucleus reflects vision in the context of movement, and this activity appears to be critical for the subsequent planning and execution of appropriate visually-guided action.
Given this evidence, it appears to be essential to characterize pulvinar receptive field properties in the context of movement. To accomplish this, experiments must be carried out in awake behaving animals. While across-species comparative studies are needed, mice can be used to efficiently address a number of initial open questions. For example, what is the source of the motor signals in the pulvinar nucleus? It has been established that premotor cells in the deep SC provide corollary discharge signals to the mediodorsal nucleus to signal impending movements (Bickford and Hall, Reference Bickford and Hall1989; Sommer and Wurtz, Reference Sommer and Wurtz2002; Wurtz et al., Reference Wurtz, McAlonan, Cavanaugh and Berman2011). In vitro slice studies have shown premotor cells in the deep layers of the SC can affect the activity of tectothalamic cells in the superficial layers (Phongphanphanee et al., Reference Phongphanphanee, Mizuno, Lee, Yanagawa, Isa and Hall2011); in this way WFV cells could potentially provide contextual signals to the pulvinar nucleus. Recordings from WFV cells in awake behaving mice could determine whether internally-generated movement commands modify their responses to moving visual stimuli.
The pulvinar projects directly to the striatum and amygdala (discussed above), and preliminary studies indicate that pulvinocortical terminals target corticostriatal and corticoamygdala cells (Zhou et al., Reference Zhou, Masterson, Damron and Guido2016a ). Thus, the pulvinar is at the center of a hub connecting the cortex, striatum, and amygdala (Fig. 9). The interconnected nature of these circuits (as well as their potential influence on SC circuits via the substantia nigra and/or zona incerta; Bickford and Hall, Reference Bickford and Hall1992; Kim et al., Reference Kim, Gregory and Hall1992; McHaffie et al., Reference McHaffie, Stanford, Stein, Coizet and Redgrave2005), suggests that the pulvinar actively participates in the dynamic coordination of body movements with the perception of visual signals. However, it is still unclear how activity levels in the striatum and amygdala might affect pulvinar activity. Recording visual receptive field properties of pulvinar neurons during optogenetic manipulation of the amygdala (Tye et al., Reference Tye, Prakash, Kim, Fenno, Grosenick, Zarabi, Thompson, Gradinaru, Ramakrishnan and Deisseroth2011; Wei et al., Reference Wei, Liu, Zhang, Liu, Tang, He, Wu, Zhou, Liu, Li, Zhang, Zhou, Xu, Chen, Bi, Hu, Xu and Wang2015), or subpopulations of striatal projection cells (Kravitz et al., Reference Kravitz, Tye and Kreitzer2012), may help to reveal mechanisms that impart context to pulvinar signals.
Summary
Many similarities have been identified in the organization of the pulvinar nucleus across species, and the mouse provides a very useful model to continue to unravel the function of this puzzling structure. The tectorecipient pulvinar forms interconnected loops with the cortex, striatum and amygdala, and emerging evidence suggests that these circuits may be designed to code visual signals in the context of ongoing movement. Thus, the pulvinar nucleus may play a key role in the planning and execution of appropriate visually-guided movements, which require the precise coordination of perception and action. Future studies designed to manipulate circuits may shed light on the repertoire or behaviors mediated by the pulvinar nucleus, and mechanisms underlying their selection. In this way, the mouse model may be a particularly useful tool to inform and guide our understanding of the human pulvinar nucleus.
Acknowledgments
The authors thank Arkadiusz Slusarczyk for his excellent technical assistance. This work was supported by the National Eye Institute (R01EY024173) and the Kentucky Science and Engineering Foundation.



