The Dawes Reviews are substantial reviews of topical areas in astronomy, published by authors of international standing at the invitation of the PASA Editorial Board. The reviews recognise William Dawes (1762–1836), second lieutenant in the Royal Marines and the astronomer on the First Fleet. Dawes was not only an accomplished astronomer, but spoke five languages, had a keen interest in botany, mineralogy, engineering, cartography and music, compiled the first Aboriginal-English dictionary, and was an outspoken opponent of slavery.
1 INTRODUCTION
Spirals galaxies represent some of the most beautiful, and fascinating objects in the Universe. According to the Galaxy Zoo project, spiral galaxies make up about two thirds of all massive galaxies, whilst around one third are ellipticals, and a few per cent merging galaxies (Lintott et al. Reference Lintott, Schawinski and Bamford2011; Willett et al. Reference Willett, Lintott and Bamford2013). Star formation overwhelmingly occurs in spiral galaxies, and in particular is associated with spiral arms. Thus understanding the nature of spiral arms is essential both for understanding star formation, and galaxy evolution.
Spiral galaxies are generally classified into different types according to the presence of a bar (S and SB for unbarred and barred galaxies, and sometimes SAB for weakly barred galaxies) and the degree of winding (or pitch angle) of the spiral arms (Hubble Reference Hubble1926b; Reynolds Reference Reynolds1927; de Vaucouleurs Reference de Vaucouleurs1959). The latter is scaled from Sa-Sd or SBa to SBd with the ‘d’ classification representing the most open arms, and the ‘a’ classification the most tightly wound. The sequence also represents a decrease in the size and luminosity of the bulge from Sa (or SBa) galaxies to Sd (or SBd), and an increase in gas content from Sa to Sd galaxies.
A second classification scheme was proposed by Elmegreen & Elmegreen (Reference Elmegreen and Elmegreen1982) and Elmegreen & Elmegreen (Reference Elmegreen and Elmegreen1987) to classify spiral galaxies into 12 types according to the number and length of spiral arms. Thus galaxies with many fragmented short arms are different types to those with two long arms. Galaxies could also be denoted as having two inner arms, and multiple outer arms. A simpler, but similar division of spiral galaxies (see e.g. Elmegreen Reference Elmegreen1990) is into 3 types: flocculent spiral galaxies (with many short arms, such as NGC2841), multi-armed spirals (e.g. M33) and grand design galaxies (with two main spiral arms, e.g. M51). All of these types may or may not exhibit bars. Around 60 %, of galaxies exhibit some grand design structure, either in the inner or entire part of the disc (Elmegreen & Elmegreen Reference Elmegreen and Elmegreen1982; Grosbøl, Patsis, & Pompei Reference Grosbøl, Patsis and Pompei2004).
The Hubble classifications are usually associated with the long-term evolution of galaxies, whereas the classification by Elmegreen is instead associated with their current properties and environment. Historically, Sa galaxies, and ellipticals were termed early type galaxies, whilst Sc and Sd galaxies were termed late type galaxies, though this is opposite to the evolutionary sequence which has since been established. Instead trends in star formation rate, bulge-to-disc ratio, and age of disc stars now indicate an evolutionary sequence from Sc to Sa types (Sandage Reference Sandage1986; Kennicutt Reference Kennicutt1998). Sa type galaxies are thought to have already used up much of their gas and exhibit lower star formation rates compared to Sc and Sd types, although mergers and galaxy interactions will also influence the properties of the galaxies (e.g. Elmegreen Reference Elmegreen1990. We also note correlations with Hubble type are only a general trend – Kennicutt (Reference Kennicutt1981) indicates that the pitch angle correlates only in an average sense with galaxy type, and there is quite substantial spread.
The flocculent, or grand design nature of spiral galaxies, is directly linked to the mechanism which generates the spiral arms. There are three main mechanisms hypothesised to produce spiral arms, (i) (quasi-stationary) density wave theory, (ii) local instabilities, perturbations, or noise which are swing amplified into spiral arms, and (iii) tidal interactions. Bars may also play a role in inducing spiral arms. Note that these mechanisms are not necessarily mutually exclusive, for example a tidal interaction could theoretically induce a wave which obeys density wave theory. Typically though, local instabilities are associated with flocculent or multi-armed galaxies, whereas grand design galaxies are presumed to have undergone a tidal interaction, have a bar driving arms, and/or obey steady state density wave theory. In addition to the various classifications of spiral galaxies, and spiral arm formation mechanisms, there are also three kinematic types of spiral arm (i) material arms, which obey the kinematics of the disc, (ii) kinematic spiral arms, which rotate slower than the angular velocity of the disc, and (iii) stationary spiral arms, which rotate rigidly and do not wind up. In the following sections we discuss these (and a few other) supposed mechanisms, and which type of spiral arms, and spiral galaxies are produced.
There are also several simple properties of spiral arms that we can observe that can give insight on the nature of spiral arms (we go into much more depth on observational tests for spiral arms in Section 4), (i) the number of spiral arms, (ii) the pitch angle, (iii) amplitude, (iv) arm shape and (v) lifetime. How many spiral arms a galaxy exhibits is one of the most fundamental questions regarding the theory of spiral arms. In the absence of a bar, or perturber, this will most simply depend on the relative disc and halo masses, and their dimensions. A galaxy will only form spiral arms at all if the disc is sufficiently gravitationally dominated. To a rough approximation (the susceptibility of the disc to asymmetric perturbations) this is governed by the Toomre parameter Q for stars and/or gas (see Section 2.1.1). If the disc is unstable, an estimate of the expected number of spiral arms can be made by considering the stability of different wavenumbers in the appropriate dispersion relation (i.e. the value of k, the wavenumber, such that e −iω(k)t grows fastest). Alternatively, and more appropriately for perturbations growing from local instabilities or noise, the number of arms can be estimated by swing amplification theory, as described in Section 2.2.1, where again the number of spiral arms corresponds to the value which produces the greatest amplification. Tidally interacting galaxies naturally produce two-armed spiral galaxies.
Other observable properties of spiral arms were investigated by Kennicutt Reference Kennicutt1981, and many other works since (e.g. Considere & Athanassoula Reference Considere and Athanassoula1988; Block et al. Reference Block, Bertin, Stockton, Grosbol, Moorwood and Peletier1994; Puerari & Dottori Reference Puerari and Dottori1992; Seigar & James Reference Seigar and James1998; Ma Reference Ma2002; Seigar et al. Reference Seigar, Bullock, Barth and Ho2006; Elmegreen et al. Reference Elmegreen, Elmegreen and Yau2011; Kendall, Kennicutt, & Clarke Reference Kendall, Kennicutt and Clarke2011). Although the pitch angle is historically used to classify galaxies according to the Hubble sequence, the differences in spiral arm shape, i.e. the pitch angle of the spiral arms appears to be most dependent on the maximum rotation velocity, and thus the local shear in the disc, rather than the global mass distribution (Kennicutt Reference Kennicutt1981; Kennicutt & Hodge Reference Kennicutt and Hodge1982; Garcia Gomez & Athanassoula Reference Garcia Gomez and Athanassoula1993; Seigar & James Reference Seigar and James1998; Seigar et al. Reference Seigar, Bullock, Barth and Ho2006). For example Figures 8 and 10 of Kennicutt (Reference Kennicutt1981) show that the pitch angle correlates much better with the maximum rotational velocity than the properties of the bulge. However there is still considerable scatter (see Figure 7 of Kennicutt Reference Kennicutt1981) in the correlation with rotation velocity that there is scope for tidal interactions, or density wave theory to introduce some spread (see also Grand, Kawata, & Cropper Reference Grand, Kawata and Cropper2013). There is also no correlation with pitch angle and arm class, i.e. the Elmegreen classification scheme of whether the galaxy is flocculent or grand design (Puerari & Dottori Reference Puerari and Dottori1992). Kennicutt (Reference Kennicutt1981) also examined the shapes of spiral arms, finding that they did not fit exactly into the category of either density wave theory (logarithmic) or tidally induced (hyperbolic spirals). The lifetimes of spiral arms are obviously much more difficult to test observationally (see Sellwood Reference Sellwood2011). Here we have relied more on computer simulations, and theory to predict the lifetimes of spiral arms for different scenarios. Generally though, arms in flocculent galaxies are expected to be fairly short lived (few 100 Myrs) and arms in grand design spirals somewhat longer lived ( ~ 1 Gyr).
Although so far we have discussed spiral galaxies as either flocculent or grand design, observations in the 1990s showed that galaxies could exhibit characteristics of both flocculent and grand design structure, typically with grand design arms seen in the infrared (old stars) and a more flocculent structure seen in the optical (gas and young stars) (Block & Wainscoat Reference Block and Wainscoat1991; Thornley Reference Thornley1996; Thornley & Mundy Reference Thornley and Mundy1997). Some galaxies also appear to exhibit a 3 armed structure in the optical and 2 armed in the IR (Block et al. Reference Block, Bertin, Stockton, Grosbol, Moorwood and Peletier1994). The existence of such galaxies poses a further challenge for theories of spiral structure.
The main previous review on spiral structure is Toomre (Reference Toomre1977), though there have also been a couple of shorter reviews by Sellwood in recent years (Sellwood Reference Sellwood2010b, Reference Sellwood2011). A historical review of spiral arm theory in the 1960s and 70s is also given by Pasha (Reference Pasha2004a Reference Pasha2004b). A review specific to the Milky Way is currently being written by Benjamin (Benjamin 2014, in preparation). In this review, we aim to bring together the different aspects of studies of spiral structure including simulations and observational tests, as well as the theory. The outline of this review is as follows. In Section 1.1, we discuss the historical context of spiral galaxies, and the origin of different theories for spiral structure. In Section 2 we go into much more detail on the possible mechanisms for generating spiral structure, including density wave theory, swing amplification, bars, tidal interactions, stochastic star formation and dark matter halos. We also include discussion of computer simulations to test these theories. In Section 3 we examine the gas response to spiral arms, including again density wave theory, local instabilities and tidal perturbations. In Section 4 we discuss possible observational tests to distinguish between the various scenarios of spiral structure. Finally in Section 5, we present our conclusions.
1.1 Historical overview
For a comprehensive review of the history of spiral structure, we recommend Pasha (Reference Pasha2004a Reference Pasha2004b), who gives a very detailed, and personal description of the developments in spiral structure, particularly in the 1960s. Here we given a brief overview up to about the time of the Toomre (Reference Toomre1977) review, although much of the background theory is also considered in much more detail in Section 2.
Spiral galaxies have been observed for over 150 years, although until the 1920s, they were classed as ‘spiral nebulae’, and assumed to lie within our own Galaxy. The spiral structure of M51 was identified by Lord Rosse in Reference Rosse1850 (Rosse Reference Rosse1850) as the first spiral nebulae (Figure 1). Rosse also identified point sources within these nebulae, hence establishing that they were not simply clouds of gas. The Curtis-Shapley ‘Great Debate’ then later ensued about whether these nebulae were extragalactic. This matter was clarified by Hubble, who confirmed that the spiral nebulae were indeed external to the Milky Way, and thus spiral galaxies, by determining the distance first to M33, and then M31, using Cepheid variables (Hubble Reference Hubble1926a, Reference Hubble1929). The distances to M31 and M33 demonstrated that these objects were far too distant to lie within the Milky Way.
A sketch of M51 by Lord Rosse (Rosse Reference Rosse1850).

Following the establishment of the nature of spiral nebulae, astronomers considered the nature of the spiral arms themselves. The first main proponent of this work was Lindblad, who first considered spiral arms in terms of Maclaurin ellipsoids (flattened spheroids rotating in an equilibrium state) (Lindblad Reference Lindblad1927), following previous work by Jeans and Poincare. He considered an instability occurring at the edge of an ellipsoid, which induces high eccentricity in the orbits at the outer edges, pertaining to circular orbits nearer the centre. Lindblad (Reference Lindblad1935) later derived a condition for gravitational instability, and thereby spiral arms, in a series of rotating spheroids. Lindblad wrote that spiral arms are analogous to a harmonic wave in an unstable Maclaurin spheroid (Lindblad Reference Lindblad1927, Reference Lindblad1940). He considered spiral arms in terms of individual stellar orbits (and indeed, Kalnajs Reference Kalnajs1973 later showed that a spiral perturbation can be represented by a series of unaligned elliptical orbits) rather than a collective process. The idea of spiral arms as a wave was not actively considered until the 1960s.
The 1960s in fact saw the next major development in spiral arm theory, when indeed spiral arms started to be considered as collective processes governed by the gravity of the galactic disc. The pioneering work of Toomre (Reference Toomre1964) and Lin & Shu (Reference Lin and Shu1964) (following also the stability analysis of Safronov Reference Safronov1960 for discs) studied gravitational instabilities in the context of an infinitesimally thin, rotating, stellar disc. Both papers started with the linearised equations of motion, and Poisson’s equation for a stellar disc, and established solutions which have the Fourier decomposition (Shu Reference Shu1992; Binney & Tremaine Reference Binney, Tremaine, Binney and Tremaine2008):
 \begin{eqnarray}
{\psi (R,\phi ,t) = {\rm Re} [A(R) e^{i(\omega t - m\phi )}], }
\end{eqnarray}
\begin{eqnarray}
{\psi (R,\phi ,t) = {\rm Re} [A(R) e^{i(\omega t - m\phi )}], }
\end{eqnarray}
where Ωp = ω/m and Ωp is the angular velocity of the perturbation, or pattern speed. Equation 1 assumes that the complex function A(R), which determines the amplitude and radial phase of the perturbations, varies slowly with R (the tight winding approximation, see Section 2.1.1). Thus these solutions represent waves with crests at periodic displacements. In addition to the form of the wave, these results also established the dispersion relations for fluid and stellar discs (with Lin & Shu Reference Lin and Shu1966, and Kalnajs Reference Kalnajs1965), and the stability criteria for discs subject to axisymmetric perturbations (see Section 2). At this point however, there is complete flexibility regarding the value of m (the number of arms), the superposition of waves of different m, what range of R or ϕ the solution covers, the sign of Ωp, and thus whether the arms are leading or trailing, or the length of time the perturbation exists.
Lin & Shu (Reference Lin and Shu1964) proposed that in fact there is a preference for lower values of m, and that such waves are relatively stable with time. Lin & Shu (Reference Lin and Shu1964, Reference Lin and Shu1966) also proposed a global solution for the disc, rather than the local perturbations assumed by Toomre (Reference Toomre1964). Such global stable waves would be standing waves in the disc, and hence they were called ‘quasi-stationary’, a term first introduced by Lindblad (Reference Lindblad1963). The motivation for supposing the stability of these waves, in particular for m = 2 was largely observational. Most galaxies were observed to be spirals at that time (Hubble Reference Hubble1943), so either the spiral arms are long lived, or they are continually replenished. Furthermore, fixed spiral arms would remove the so called ‘winding problem’. In addition, disproportionately many galaxies have 2 spiral arms, so a tendency for systems to exhibit m = 2 would explain this predominance.
Goldreich & Lynden-Bell (Reference Goldreich and Lynden-Bell1965a), consider the action of gravitational instabilities, first in a uniformly rotating gas disc, then under differential rotation (Goldreich & Lynden-Bell Reference Goldreich and Lynden-Bell1965b). They supposed that spiral arms are a superposition of many unstable wavelengths in the gas. In their picture, it is the instabilities in the gas which form gaseous spiral arms, which in turn form stars and lead to stellar spiral arms. This is somewhat different from the picture of a stellar dominated disc, where instabilities are thought to arise in the stars, leading to a gravitational potential well for the gas to fall into, shock and form molecular clouds (see Section 3.7). Unlike the simpler analysis of discs subject to axisymmetric perturbations (see Section 2), these studies investigate asymmetric perturbations in a shearing disc. Goldreich & Lynden-Bell (Reference Goldreich and Lynden-Bell1965b), and Julian & Toomre (Reference Julian and Toomre1966), demonstrated the significance of a differentially rotating disc. Gravity is enhanced as a region undergoes shear. Hence it is easier for perturbations to grow via the disc self gravity. This effect was later coined swing amplification, discussed further in Sections 2.1.3 and 2.2.
Meanwhile there were some important observational developments following the theoretical work of Lindblad. One was the finding that spiral arms tended to be trailing in character (Hubble Reference Hubble1943). A second was that, rather than uniform rotation, galaxies were indeed observed to rotate differentially (e.g. Burbidge & Burbidge Reference Burbidge and Burbidge1964; Rubin & Ford Reference Rubin and Ford1970).
In the late 60s, and 70s, authors started to consider the response of gas to the stellar disc. Assuming a static spiral potential of the form proposed by Lin & Shu (Reference Lin and Shu1964), the solution for the gas response can be obtained (Fujimoto Reference Fujimoto1968; Roberts Reference Roberts1969). In particular the gas is found to undergo a shock caused by the stellar spiral spiral arms. The detection of dark dust lanes alongside spiral arms (Sandage Reference Sandage1961; Lynds Reference Lynds, Becker and Kontopoulos1970) gave strong observational evidence that the gas undergoes a spiral shock, the dense shock being seen as dark clouds in the dust lanes that go on to form stars (Roberts Reference Roberts1969). In fact it is now evident that regardless of how spiral arms are generated, spiral structure is only very weak in the old stars, whereas the spiral structure we see by eye is dominated by the gas and young stars (e.g. Elmegreen et al. Reference Elmegreen, Elmegreen and Yau2011).
At the same time however, results were starting to query whether steady spiral modes could be sustained in galaxies. Lynden-Bell & Ostriker (Reference Lynden-Bell and Ostriker1967) showed, in the ‘anti-spiral theorem’ that stable spiral modes do not exist in a steady state, although it is possible to obtain a solution with asymmetric spirals, i.e. one trailing and oneToomre (Reference Toomre1969) also showed that the waves will not remain in a fixed position within the disc, rather the pattern will propagate inwards to outwards with the group velocity on a timescale of a few galactic rotations – suggesting that density waves need to be constantly replenished. Consequently, a mechanism to maintain density waves was required. Mark (Reference Mark1974, Reference Mark1976) suggested that it could be possible to maintain spiral density waves by means of reflection between two radii of the disc – setting up a standing wave. Toomre (Reference Toomre1969) instead proposed tidally interacting galaxies were the primary means of generating m = 2 spiral structure.
Since the 1970s, the debate about stationary versus transient spirals has continued. In addition to theoretical arguments, numerical simulations have become much more widespread to test theories of spiral structure. Observations are also starting to provide some information on the dynamics of spiral galaxies.
2 GENERATION OF SPIRAL STRUCTURE
In this section we describe the different mechanisms for generating spiral structure, namely quasi-stationary density wave theory (Section 2.1), recurrent transient spiral instabilities (Section 2.2), bars (Section 2.3), tidal interactions (Section 2.4), stochastic star formation (Section 2.5), and exotic mechanisms such as perturbations from dark matter halos (Section 2.6).
2.1 Quasi-stationary density wave theory
In this section we present the theory that global spiral arms are slowly evolving patterns that rotate with fixed pattern speeds in the disc, quasi-stationary density wave theory. Much of this material is theoretical, as we discuss in Section 2.1.5, this theory has not yet been demonstrated in the context of numerical simulations.
Inspired by the idea of kinematic density waves suggested by Lindblad (Reference Lindblad1960, Reference Lindblad1963), Lin & Shu (Reference Lin and Shu1964) proposed a self-consistent density wave theory. Unlike Lindblad’s approach (Toomre Reference Toomre1977; Pasha Reference Pasha2004a, Reference Pasha2004b, for reviews), Lin & Shu treated the galactic disc as a ‘continuum’ consisting of either stars or gas, and derived the dispersion relation of the density waves for a rotating disc. Qualitatively, they assumed that the spiral arms are not material in nature, but instead made up of areas of greater density, with the stars and gas moving through the spiral arms. The difference in the dynamics is often compared to cars moving along a traffic jam. Material arms are analogous to a queue of cars moving at a speed v 0 identical to all other vehicles on the road. For density waves, instead suppose a queue of cars moving at v 1 < v 0, whereas other cars on the road will slow down to v 1 as they enter the queue and speed up as they leave.
After the derivation of the dispersion relation for a fluid disc by Lin & Shu (Reference Lin and Shu1964), the dispersion relation for a stellar disc was derived by Lin & Shu (Reference Lin and Shu1966) and Kalnajs (Reference Kalnajs1965). The dispersion relations for fluid and stellar discs are called the Lin-Shu dispersion relation and Lin-Shu-Kalnajs dispersion relation, respectively. We first outline the physical meaning of the dispersion relations based on the linear tight-winding density wave theory of fluid and stellar discs (Section 2.1.1). Then, we explain the global mode theory of galactic discs (Section 2.1.4). The behaviour of gas in quasi-stationary density waves will be described in Section 3.5.
2.1.1 Dispersion relations of tight-winding density waves
Lin and Shu derived dispersion relations of fluid and stellar discs under the following approximations and assumptions:
-
1. Linear perturbations: They linearized the equation of continuity, the equations of motion (Euler equation), the equation of state, and Poisson equation, and then studied the behaviour of the linear perturbations. In this case, it is assumed that the unperturbed disc is axisymmetric and has no radial motions.
-
2. Tight-winding approximation (short wavelength or WKBFootnote 1 approximation): Deriving the dispersion relation for a general spiral wave is extremely complicated because of the long-range force nature of gravity (see Section 2.1.4). They assumed the spiral arm has a small pitch angle in order that distant density perturbations can be neglected. In other words, the response of the matter to the gravity perturbations becomes local. In this approximation, the dispersion relation of density waves can be written down in terms of local quantities. If we write the radial dependence of any perturbation quantity (Equation 1) in terms of an amplitude and phase as
(2)the tight-winding approximation corresponds to the assumption that the phase f(R) varies rapidly in comparison with amplitude Φ(R), i.e., \begin{equation}
A(R) = \Phi (R) e^{if(R)},
\end{equation}
(3)
\begin{equation}
\left| \frac{df}{dR}\right| \gg \left| \frac{1}{\Phi }\frac{d\Phi }{dR}\right|.
\end{equation}
\begin{equation}
A(R) = \Phi (R) e^{if(R)},
\end{equation}
(3)
\begin{equation}
\left| \frac{df}{dR}\right| \gg \left| \frac{1}{\Phi }\frac{d\Phi }{dR}\right|.
\end{equation}
-
3. Quasi-stationary spiral structure hypothesis (QSSS hypothesis): They hypothesized that ‘global’ spiral arms hardly change their shape during many galaxy rotational periods (‘quasi-stationarity’) based on empirical grounds (Lin & Shu Reference Lin and Shu1964; Bertin & Lin Reference Bertin, Lin, Bertin and Lin1996; Bertin Reference Bertin and Bertin2000). This is equivalent to assuming that the rotation of global spiral arms is rigid-body rotation with a specific angular velocity and pitch angle. This fixed angular speed is called the pattern speed. In the inner parts of galaxies, stars and gas rotate faster than the pattern speed, and overtake the spiral arm. In the outer parts of galaxies, stars and gas rotate slower than the pattern speed, and the spiral arms overtake the stars and gas.
Taking into account these approximations and assumptions, the Lin-Shu theory is often called a linear tight-winding, or quasi-stationary density-wave theory.
Since the stars occupy most of the mass of the galactic disc, the dispersion relation of the density wave of a stellar disc is important in understanding the spiral arms. However, the dispersion relation for a fluid disc is simpler, so we introduce this first, before discussing the dispersion relation for a stellar disc. We refer the reader to Binney & Tremaine (Reference Binney, Tremaine, Binney and Tremaine2008) and Shu (Reference Shu1992) for the mathematical details on derivation of dispersion relations, as well as Bertin & Lin (Reference Bertin, Lin, Bertin and Lin1996) and Bertin (Reference Bertin and Bertin2000) for further discussion on the concept of quasi-stationary density wave theory.
The dispersion relation for linear tight-winding perturbations in the razor-thin fluid disc (Lin-Shu dispersion relation; LS dispersion relation) is given by
 \begin{eqnarray}
(\omega - m\Omega )^2 = c_s^2k^2 + \kappa ^2 - 2\pi {\rm G} \Sigma _{\rm 0} |k|,
\end{eqnarray}
\begin{eqnarray}
(\omega - m\Omega )^2 = c_s^2k^2 + \kappa ^2 - 2\pi {\rm G} \Sigma _{\rm 0} |k|,
\end{eqnarray}
(Lin & Shu Reference Lin and Shu1964). Here Ω, Σ0, cs and κ are the angular frequency, surface density, sound speed and epicyclic frequency
 \begin{equation}
\kappa =\sqrt{R \frac{\partial \Omega ^2}{\partial R}+4\Omega ^2}
\end{equation}
\begin{equation}
\kappa =\sqrt{R \frac{\partial \Omega ^2}{\partial R}+4\Omega ^2}
\end{equation}
of the fluid disc, respectively. These quantities depend on the galacto-centric radius R and define the axisymmetric basis state. ω, k, and m are the angular frequency, radial wave-number, and the number of spiral arms, respectively. The radial wave-number k is related to the phase of the radial dependence of the perturbations f(R) (Equation 2) via
 \begin{equation}
k(R) \equiv \frac{df(R)}{dR}.
\end{equation}
\begin{equation}
k(R) \equiv \frac{df(R)}{dR}.
\end{equation}
We define k > 0 for a trailing spiral arm and k < 0 for a leading spiral arm. Note that the so-called pattern speed Ωp is defined as ω/m.
In the inertial frame, ω on the left hand side of Equation (4) is the angular frequency of the density wave. In the rotating frame at some radius R in the disc, (ω − mΩ) is the angular frequency of the density wave experienced by a star at R. A perturbation to the disc will be of the form exp [− i(ω − mΩ)t]. Positive (ω − mΩ)2 means that the perturbations to the disc will be stable. However negative (ω − mΩ)2 means that the perturbations will be of the form exp [± |ω − mΩ|t] and there is a perturbation whose amplitude grows exponentially, thus the disc is unstable. Therefore, the right-hand side of equation (4) indicates the stability of the density waves. Here, we can introduce a dimensionless parameter
 \begin{equation}
Q \equiv \frac{\kappa c_s}{\pi G \Sigma _0},
\end{equation}
\begin{equation}
Q \equiv \frac{\kappa c_s}{\pi G \Sigma _0},
\end{equation}
known as the Toomre Q parameter, such that if Q > 1, (ω − mΩ)2 > 0 for all radial wave-numbers k, while if Q < 1, (ω − mΩ)2 becomes negative for a range of radial wave-numbers. Therefore Q gives us a criterion whether the disc is unstable or not to tight-winding perturbationsFootnote 2 . We can also define a critical unstable wavelength λcrit = 2π/k crit, where (ω − mΩ)2 = 0 for a cold fluid disc (i.e., cs = 0). In this case, all perturbations with wavenumber |k| < k crit or wavelength λ > λcrit are unstable, where k crit = κ2/(2πGΣ0) or λcrit = 4π2 GΣ0/κ2. Note k crit = k min/2, where k min is defined such that (ω(k min) − mΩ)2 = 0 for a neutrally stable fluid disc (Q = 1).
Figure 2 a shows the Lin-Shu dispersion relations for different Q values. Figure 2 a shows that high Q values (stability) occur for density waves with large wavelengths and angular frequencies. The physical meaning of each term of the right-hand side of equation (4) is as follows. The first term, c 2 s k 2, expresses the effect of pressure, which being positive stabilizes the fluid against perturbations. This is the same as the dispersion relation of sound waves. The second term, κ2 represents rotation, which again stabilizes the disc. The third term, which incorporates the self gravity of the disc, promotes the growth of instabilities. When the effect of self-gravity exceeds the limit where (ω − mΩ)2 is non-negative, a real root does not exist and it is impossible for a stable density wave to exist. Thus, the LS dispersion relation shows that the (gaseous) spiral density wave can be considered to be a sort of acoustic wave taking into account the effects of rotation and self-gravity.
Dispersion relations for tight-winding density waves in a fluid disc (left) and stellar disc (right). Waves of a wavenumber smaller than that at the minimum frequency (|k| ≪ k crit) are called long waves, while those with |k| ≫ k crit are called short waves. The critical wavenumber k crit is defined as κ2/(2πGΣ0).

Consider now a stellar disc. The dispersion relation for linear tight-winding perturbations a in razor-thin stellar disc with a modified Schwarzschild distribution (Lin-Shu-Kalnajs dispersion relation; LSK dispersion relation) is given by
 \begin{equation}
(\omega - m\Omega )^2 \eqcellsep =\eqcellsep \kappa ^2 - 2\pi G \Sigma _0 |k| \mathcal {F}\left(\frac{\omega -m\Omega }{\kappa },\frac{\sigma _{\rm R}^2k^2}{\kappa ^2}\right)\\
\end{equation}
\begin{equation}
(\omega - m\Omega )^2 \eqcellsep =\eqcellsep \kappa ^2 - 2\pi G \Sigma _0 |k| \mathcal {F}\left(\frac{\omega -m\Omega }{\kappa },\frac{\sigma _{\rm R}^2k^2}{\kappa ^2}\right)\\
\end{equation}
 \begin{equation}
\mathcal {F}(s,\chi ) \eqcellsep\equiv\eqcellsep \frac{2}{\chi }(1-s^2)e^{-\chi }\sum _{n=1}^{\infty }\frac{I_{\rm n}(\chi )}{1-s^2/n^2},
\end{equation}
\begin{equation}
\mathcal {F}(s,\chi ) \eqcellsep\equiv\eqcellsep \frac{2}{\chi }(1-s^2)e^{-\chi }\sum _{n=1}^{\infty }\frac{I_{\rm n}(\chi )}{1-s^2/n^2},
\end{equation}
 \begin{equation}
Q \equiv \frac{\kappa \sigma _R}{3.36 G \Sigma _0}.
\end{equation}
\begin{equation}
Q \equiv \frac{\kappa \sigma _R}{3.36 G \Sigma _0}.
\end{equation}
The behaviour of the dispersion relation is similar to the LS relation for smaller radial wave-number (larger wavelength), but in the the larger radial wave-number (shorter wavelength) regime, the behaviour of the two is decidedly different. For the short-wave regime, the LSK dispersion relation approaches (ω − mΩ)2/κ2 = 1 asymptotically, but the LS dispersion relation extends to (ω − mΩ)2/κ2 > 1. This difference originates in the essential difference between the pressure for a fluid disc, and the velocity dispersion for a stellar disc: In the case of fluid discs, pressure will become large at small wavelengths. In contrast, since the stellar disc is collisionless, there is no such repelling force. Instead the frequencies of perturbations cannot become larger than the epicyclic frequency κ.
2.1.2 Propagation of tight-winding density waves
Although we have discussed waves as being quasi-stationary in the previous section, in reality if a wave is induced in the disc, it will propagate radially with some group velocity, rather than being stationary. In this and the next sections, we will discuss the group velocity and describe the further developments in density wave theory (the setting up of suitable boundary conditions) which allow the possibility, at least theoretically, of setting up a standing wave. The propagation of the tight-winding density waves is reviewed throughly in Grosbøl (Reference Grosbøl, Contopoulos, Spyrou and Vlahos1994) and Binney & Tremaine (Reference Binney, Tremaine, Binney and Tremaine2008).
The original density wave theory (Lin & Shu Reference Lin and Shu1964) is based on the QSSS hypothesis which assumes that the amplitude and shape of the spiral arm are independent of time. However, since the angular frequency ω depends on radial wave-number k via the LS or LSK dispersion relations (eqs. 4 and 8), the energy and angular momentum of the density waves propagate radially as wave packets (Toomre Reference Toomre1969). This propagation velocity is the group velocity, given by vg = ∂ω(k, R)/∂k. If we consider propagation of density waves in a fluid disc, following the LS dispersion relation (Equation 4), the group velocity of a wave packet is
 \begin{eqnarray}
v_g &&= \frac{\partial \omega (k,R)}{\partial k} = \pm \frac{|k|c_s^2 - \pi G \Sigma _0}{\omega -m\Omega },
\end{eqnarray}
\begin{eqnarray}
v_g &&= \frac{\partial \omega (k,R)}{\partial k} = \pm \frac{|k|c_s^2 - \pi G \Sigma _0}{\omega -m\Omega },
\end{eqnarray}
where positive and negative signs indicate trailing (k > 0) and leading (k < 0) spiral waves, respectively.
The sign of the numerator of this equation is negative for short waves and positive for long waves, and the sign of the denominator is negative and positive for R < R CR and R > R CR, respectively. Thus, short trailing and long leading spiral waves will propagate away from the coronation (CR) radius, while the short leading and long trailing spiral waves will approach the CR radius (propagation directions are indicated by arrows in Figure 3). Note that if the disc has a large Q, a forbidden region emerges in the vicinity of the CR, where due to the pressure or random motions the density waves diminish.
Propagation diagram for tight-winding stellar density waves following the LSK dispersion relation (Equation 8). The disc is assumed to have a flat rotation curve and constant Toomre’s Q = 1.2. The horizontal dashed lines are the OLR radius (upper), CR radius (middle), and ILR radius (lower), respectively. The arrows indicate the directions of group velocities. Long waves (|k/k crit| ≪ 1) are reflected at the Lindblad resonances, while short waves (|k/k crit| ≫ 1) are absorbed there due to Landau damping.

The behavior is essentially same for stellar density waves except for regions around the inner and outer Lindblad resonances (ILR and OLR). The difference around the ILR/OLR originates in the difference in dynamical behavior between stars and fluid (Section 2.1.1). The propagation digram for stellar density waves following the LSK dispersion relation (Equation 8) is shown in Figure 3. Long stellar density waves (|k/k crit| ≪ 1) are reflected at the Lindblad resonances (Goldreich & Tremaine Reference Goldreich and Tremaine1978, Reference Goldreich and Tremaine1979) while short waves (|k/k crit| ≫ 1) are absorbed there due to Landau damping (Lynden-Bell & Kalnajs Reference Lynden-Bell and Kalnajs1972). Thus, both long and short stellar density waves cannot pass through the Lindblad resonances. Therefore, the permitted region for stellar density waves is restricted between the ILR and OLR radii (with the exception again of the forbidden region). However, this does not necessarily imply that stationary density waves will exist here.
If we apply the group velocity formula to the solar neighborhood, v g ~ 12 km s− 1 the stellar density wave takes ~ 400 Myr to propagate 5 kpc radially. This timescale is comparable to the rotation period of the Galaxy. Therefore, the stellar density waves will have a short lifetime of order < 1 Gyr (Toomre Reference Toomre1969).
This problem can be solved if the density waves are reflected in the central region before reaching the ILR, and amplified by some mechanism. An absorption of the short stellar density waves at the ILR can be avoided if the Toomre’s Q parameter increases significantly (forming a so-called Q-barrier) refracting the density wave outside the ILR. Short trailing stellar density waves can be excited near the CR from long trailing stellar density waves by ‘the wave amplification by stimulated emission of radiation’ (WASER) in lighter discs (Mark Reference Mark1974, Reference Mark1976), or from short leading density waves by the swing amplification mechanism in heavier discs (Goldreich & Lynden-Bell Reference Goldreich and Lynden-Bell1965b; Julian & Toomre Reference Julian and Toomre1966; Goldreich & Tremaine Reference Goldreich and Tremaine1978; Toomre Reference Toomre, Fall and Lynden-Bell1981). With these assumptions, ‘standing-wave’ patterns Footnote 3 can exist between a reflecting radius in the inner part of the galaxy and CR radius, where the waves can be amplified (Bertin et al. Reference Bertin, Lin, Lowe and Thurstans1989a, Reference Bertin, Lin, Lowe and Thurstans1989b). The spiral density waves should be located between, but not reaching the ILR and OLR.
2.1.3 Swing amplification
The quasi-stationarity of spiral arms requires wave amplification mechanisms such as WASER (Mark Reference Mark1974, Reference Mark1976) or swing amplification (Goldreich & Lynden-Bell Reference Goldreich and Lynden-Bell1965b; Julian & Toomre Reference Julian and Toomre1966; Goldreich & Tremaine Reference Goldreich and Tremaine1978; Toomre Reference Toomre, Fall and Lynden-Bell1981). In the WASER (swing amplification) mechanism, a trailing (leading) wave is turned into a trailing wave when crossing CR and is greatly amplified in the process. It is noted that there is no conflict between the swing amplification and WASER (Lin & Thurstans Reference Lin, Thurstans, Guyenne and Hunt1984; Bertin, Lin, & Lowe Reference Bertin, Lin, Lowe, Guyenne and Hunt1984; Bertin et al.Reference Bertin, Lin, Lowe and Thurstans1989b). The reason they have been considered differently is largely historical, reflecting opposing views at the time. However, if discs have non-negligible self-gravity at CR, the swing amplification mechanism can greatly dominate amplification by the WASER mechanism. On the other hand, in a system where the disc mass is only a small fraction that supports the rotation curve, the WASER mechanism can underline the growth of the most important spiral mode, as long as Q ≃ 1 at CR (Shu Reference Shu1992; Bertin & Lin Reference Bertin, Lin, Bertin and Lin1996; Bertin Reference Bertin and Bertin2000).
We focus on the swing amplification mechanism as a wave amplification mechanism for sustaining quasi-stationary density waves between the ILR and OLR. The so-called swing amplification works when short leading waves are reflected to short trailing waves at the CR radius, or when a density enhancement formed by self-gravity is stretched out by differential rotation. The dynamical response takes the form of wavelets in the surrounding medium, each amplified by its own self-gravity through the swinging of leading features into trailing ones due to shear.
The swing amplification operates through a combination of three ingredients: the shearing flow, epicyclic motions, and the disc self-gravity. Toomre (Reference Toomre, Fall and Lynden-Bell1981) interpreted the swing amplification mechanism in terms of the wave-particle interaction between spiral arms and stars. Since the direction of epicyclic motion of a star is the same as the direction which the spiral arm is sheared by differential rotation, stabilisation by rotation is reduced, and the perturbation can grow via the usual Jeans instability (Goldreich & Lynden-Bell Reference Goldreich and Lynden-Bell1965b; Julian & Toomre Reference Julian and Toomre1966; Goldreich & Tremaine Reference Goldreich and Tremaine1978). The timescale of epicyclic motion (κ− 1) is comparable to the timescale of involvement with the spiral arm (A − 1 where A is Oort’s constant), and unless Q ≫ 1, the structure can grow in a short time comparable to κ− 1. The resulting spiral structure from this process is generally expected to be chaotic (Sellwood Reference Sellwood2011) rather than lead to a symmetric spiral pattern.
Consider a local region of a galactic disc away from the galaxy center. Since the galactic rotation is parallel to this local region (curvature can be ignored), we set an x and y-axis aligned with the radial and rotational directions of the galaxy respectively. In this case, the equations of motion of the stars are given by
 \begin{equation}
\ddot{x} - 2\Omega _{\rm 0} \dot{y} - 4\Omega _{\rm 0}A_{\rm 0} x \eqcellsep =\eqcellsep f_{\perp }\sin \gamma ,\\
\end{equation}
\begin{equation}
\ddot{x} - 2\Omega _{\rm 0} \dot{y} - 4\Omega _{\rm 0}A_{\rm 0} x \eqcellsep =\eqcellsep f_{\perp }\sin \gamma ,\\
\end{equation}
 \begin{equation}
\ddot{y} + 2\Omega _{\rm 0} \dot{x} \eqcellsep =\eqcellsep f_{\perp } \cos \gamma ,
\end{equation}
\begin{equation}
\ddot{y} + 2\Omega _{\rm 0} \dot{x} \eqcellsep =\eqcellsep f_{\perp } \cos \gamma ,
\end{equation} $A_{\rm 0} \equiv -\frac{1}{2} R_{\rm 0}(d\Omega /dR)_{\rm 0}$
are the angular velocity and Oort’s constant at R
0, respectively. f
⊥ indicates the gravitational force perpendicular to the spiral arm. γ is an angle between the spiral arm and radial direction of the galaxy: γ = 90°, γ < 0, and γ > 0 correspond to a ring, leading, and trailing structures, respectively.
$A_{\rm 0} \equiv -\frac{1}{2} R_{\rm 0}(d\Omega /dR)_{\rm 0}$
are the angular velocity and Oort’s constant at R
0, respectively. f
⊥ indicates the gravitational force perpendicular to the spiral arm. γ is an angle between the spiral arm and radial direction of the galaxy: γ = 90°, γ < 0, and γ > 0 correspond to a ring, leading, and trailing structures, respectively.
Defining the normal displacement of the star perpendicular to the spiral arm,
 \begin{eqnarray}
\xi = x \sin \gamma + y\cos \gamma ,
\end{eqnarray}
\begin{eqnarray}
\xi = x \sin \gamma + y\cos \gamma ,
\end{eqnarray}
as a new variable, the equations of motion reduce to an equation
 \begin{eqnarray}
\ddot{\xi } + S(\gamma )\xi = 0,
\end{eqnarray}
\begin{eqnarray}
\ddot{\xi } + S(\gamma )\xi = 0,
\end{eqnarray}
where the squared spring rate is given by
 \begin{equation}
S(\gamma ) \eqcellsep =\eqcellsep \kappa ^2 - 8\Omega _{\rm 0} A_{\rm 0} \cos ^2\gamma + 12 A_{\rm 0}^2\cos ^4\gamma - 2\pi G \Sigma _{\rm 0} k \mathcal {F} \\
\end{equation}
\begin{equation}
S(\gamma ) \eqcellsep =\eqcellsep \kappa ^2 - 8\Omega _{\rm 0} A_{\rm 0} \cos ^2\gamma + 12 A_{\rm 0}^2\cos ^4\gamma - 2\pi G \Sigma _{\rm 0} k \mathcal {F} \\
\end{equation}
 \begin{equation}
\eqcellsep =\eqcellsep \left( 1 - \frac{2\Gamma }{2-\Gamma }\cos ^2\gamma + \frac{3}{2}\frac{\Gamma ^2}{2-\Gamma }\cos ^4\gamma -\frac{\mathcal {F}}{X}\sec \gamma \right) \kappa ^2, \nonumber\\
\end{equation}
\begin{equation}
\eqcellsep =\eqcellsep \left( 1 - \frac{2\Gamma }{2-\Gamma }\cos ^2\gamma + \frac{3}{2}\frac{\Gamma ^2}{2-\Gamma }\cos ^4\gamma -\frac{\mathcal {F}}{X}\sec \gamma \right) \kappa ^2, \nonumber\\
\end{equation}
 \begin{equation}
\Gamma \eqcellsep =\eqcellsep -\frac{d\ln \Omega }{d\ln R}, \\
\end{equation}
\begin{equation}
\Gamma \eqcellsep =\eqcellsep -\frac{d\ln \Omega }{d\ln R}, \\
\end{equation}
 \begin{equation}
X \eqcellsep =\eqcellsep \frac{k_{\rm crit} R}{m} = \frac{\kappa ^2 R}{2\pi G \Sigma _0 m} .
\end{equation}
\begin{equation}
X \eqcellsep =\eqcellsep \frac{k_{\rm crit} R}{m} = \frac{\kappa ^2 R}{2\pi G \Sigma _0 m} .
\end{equation}
Squared spring rate S(γ) as a function of the angle γ between the spiral arm and radial direction of the galaxy for Γ = 0.0 (rigid rotation) and Γ = 1.0 (flat rotation). Different lines indicate Q = 1.0 (black), 1.2 (red), and 1.5 (green), respectively. Spring rates are calculated based on the equations of motion in Toomre (Reference Toomre, Fall and Lynden-Bell1981) and Athanassoula (Reference Athanassoula1984). The squared spring rate is always positive in the case of Γ = 0.0, but it can be negative in the case of Γ = 1.0. Thus, the normal displacement of the stars around the spiral arm ξ can grow exponentially as the spiral arm is sheared by differential rotation.

By the transformation of variables to γ, instead of time t, Equation 17 becomes
 \begin{eqnarray}
\frac{d^2\xi }{d\tan \gamma ^2} + \frac{2(2-\Gamma )}{\Gamma ^2}\frac{S(\gamma )}{\kappa ^2}\xi = 0.
\end{eqnarray}
\begin{eqnarray}
\frac{d^2\xi }{d\tan \gamma ^2} + \frac{2(2-\Gamma )}{\Gamma ^2}\frac{S(\gamma )}{\kappa ^2}\xi = 0.
\end{eqnarray}
Numerical integration of this differential equation gives the dependence of the swing amplification factor on the galaxy parameters (Γ, Q, X) shown in Figure 5. The effect of self-gravity and the winding of the spiral arm work in synergy, so that a star comes to stay at the spiral arm for a long time, and spiral arms are amplified temporarily. Note that the above argument is based on the linear analysis by Toomre (Reference Toomre, Fall and Lynden-Bell1981) and Athanassoula (Reference Athanassoula1984). Fuchs (Reference Fuchs2001) solved linearised collisionless Boltzmann and Poisson equations self-consistently and showed that the result is essentially the same. Further, non-linear effects are studied in N-body simulations of local regions of stellar discs (Toomre Reference Toomre and Wielen1990; Toomre & Kalnajs Reference Toomre, Kalnajs and Sundelius1991; Fuchs, Dettbarn, & Tsuchiya Reference Fuchs, Dettbarn and Tsuchiya2005), as well as N-body simulations of global stellar discs (Sellwood & Carlberg Reference Sellwood and Carlberg1984; Carlberg & Freedman Reference Carlberg and Freedman1985; Bottema Reference Bottema2003; Fujii et al. Reference Fujii, Baba, Saitoh, Makino, Kokubo and Wada2011; Baba, Saitoh, & Wada Reference Baba, Saitoh and Wada2013; D’Onghia, Vogelsberger, & Hernquist Reference D’Onghia, Vogelsberger and Hernquist2013). D’Onghia et al. (Reference D’Onghia, Vogelsberger and Hernquist2013) carefully demonstrated the growth of spiral arm features by swing-amplification and found a nonlinear evolution that is not fully consistent with the classic swing-amplification picture of Julian & Toomre (Reference Julian and Toomre1966) and lasted longer than predicted by swing amplification (Toomre & Kalnajs Reference Toomre, Kalnajs and Sundelius1991) (see also Section 2.1.5).
The maximum amplification factor is shown as a function of the X, Γ and Q parameters. The amplification factor is calculated based on the equations of motion given in Toomre (Reference Toomre, Fall and Lynden-Bell1981) and Athanassoula (Reference Athanassoula1984).

In order for the swing amplification mechanism to work continuously (Toomre & Kalnajs Reference Toomre, Kalnajs and Sundelius1991), we need to understand how leading waves are generated. One possibility is the case where there is no ILR. A trailing wave does not suffer from Landau damping at the ILR, instead the wave turns into a leading wave as it crosses the galaxy center. This is the so-called feedback loop proposed by Toomre (Reference Toomre, Fall and Lynden-Bell1981).
2.1.4 Global mode theory
Although linear density wave theory was successful in demonstrating the existence of a tight-winding spiral wave, the tight-winding density wave theory has room for improvement. Firstly, since they utilized the WKB approximation, this theory cannot be applied to very long waves (or open spiral arms) strictly. Secondly, the presence of neutral spiral density waves itself is theoretically questionable. It is critically problematic that a density wave propagates through a galactic disc radially in a few galactic rotations, and eventually disappears by absorption at the inner/outer Lindblad resonances (ILR/OLR). Thus, the ‘quasi-stationarity’ hypothesis is not ensured (Toomre Reference Toomre1969, Section 2.1.2). Finally, the tight-winding theory cannot predict the number of spiral arms m and sign of the wave-number k (i.e., trailing or leading). In other words, the theory cannot explain why actual spiral galaxies prefer to have trailing two-armed spirals (k > 0 and m = 2) and what determines the angular frequency of the spiral density wave. In response to these criticisms, the tight-winding density wave theory developed into a global mode theory (e.g., Lau, Lin, & Mark Reference Lau, Lin and Mark1976; Bertin et al. Reference Bertin, Lau, Lin, Mark and Sugiyama1977; Aoki, Noguchi, & Iye Reference Aoki, Noguchi and Iye1979; Iye Reference Iye1978; Bertin Reference Bertin1983; Bertin et al. Reference Bertin, Lin, Lowe, Guyenne and Hunt1984, Reference Bertin, Lin, Lowe and Thurstans1989a, Reference Bertin, Lin, Lowe and Thurstansb; Bertin & Lin Reference Bertin, Lin, Bertin and Lin1996).
A key nontrivial step at the basis of the derivation of the dispersion relation is the reduction of the long-range gravity law to a WKB dispersion relation between the perturbed potential and the perturbed density. Numerical integration of the basic perturbed equations is required. Since the first global mode analysis was applied to rotating fluid discs by Hunter (Reference Hunter1965), there have been many studies, mainly in the 1970s-80s (e.g. Bardeen Reference Bardeen and Hayli1975; Aoki et al. Reference Aoki, Noguchi and Iye1979; Iye Reference Iye1978; Takahara Reference Takahara1978), as well as extending the analysis to rotating stellar discs (Kalnajs Reference Kalnajs1972). In order to analyse the eigen-value problem of a stellar system, it is necessary to solve the density perturbations and the responsive orbital perturbations in satisfying the linearized collisionless Boltzmann equation and the Poisson equation, self-consistently. Although Kalnajs (Reference Kalnajs1972) solved the eigenvalue problem of the Maclaurin disc using the so-called ‘matrix method’, numerical integration is required to solve the eigen-value problems of stellar discs (e.g. Athanassoula & Sellwood Reference Athanassoula and Sellwood1986; Sellwood & Athanassoula Reference Sellwood and Athanassoula1986; Sellwood Reference Sellwood and Sellwood1989; Earn & Sellwood Reference Earn and Sellwood1995; Vauterin & Dejonghe Reference Vauterin and Dejonghe1996; Pichon & Cannon Reference Pichon and Cannon1997; Polyachenko Reference Polyachenko2004, Reference Polyachenko2005; Jalali & Hunter Reference Jalali and Hunter2005). However, these studies are somewhat limited due to the mathematical complexity.
Global mode analysis is based on a point of view that the spiral arms are manifestations of the gravitationally ‘unstable’ global eigen-oscillations of disc galaxies Footnote 4 . This eigen-oscillation problem of the galactic disc resembles the problem of oscillating patterns of the skin when a drum is struck. Similar to the way oscillation patterns are controlled by how to stretch and how to strike the skin, oscillation of a galactic disc is controlled by the density and velocity-dispersion distributions of a galactic disc. However, there are two differences between eigen-oscillation problems of the drum and galactic disc. First, changes of the gravity from the oscillation should be taken into account to solve the eigen-oscillation problem of the galactic disc. This makes the problem very complicated. In the case of a drum, there is only a traverse wave, but for the oscillation of the galactic disc, there is also a longitudinal wave as well as a transverse wave. The transverse and longitudinal waves in the galactic disc are equivalent to the bending (warp) of a galactic disc and spiral arms, respectively.
Before explaining numerical results of the global mode analysis, let us consider the stability of fluid and stellar discs. Consider first the case of axisymmetric perturbations (Toomre Reference Toomre1964; Goldreich & Lynden-Bell Reference Goldreich and Lynden-Bell1965a). Qualitatively, we consider the case where an axisymmetric disc receives a perturbation illustrated by the small arrows shown in Figure 6(a). The fluid and stars in the disc move radially, and try to make a ring structure, but the pressure (or velocity dispersion), centrifugal, and Coriolis forces suppress growth of this ring perturbation. Left panel of Figure 7 shows the neutral stability curves for tight-winding spirals ((ω − mΩ)2 = 0) showing Q-values as a function of λ/λcrit. As Q for the disc is lowered, the disc moves from the stable to unstable regime. The wavelength which becomes unstable first is pλcrit, where p = 0.5 in the case of a fluid disc and p = 0.55 in a stellar disc.
Axisymmetric perturbations (a) and bar-like perturbations (b) on an axisymmetric disc. The disc rotates anti-clock wise. Directions of the perturbations are indicated by small arrows.

Left: Neutral stability curves for tigiht-winding spiral instabilities based on the LS dispersion relation (red; Equation 4) and LSK dispersion relation (black; Equation 8). The region below the curve is stable against tight-winding spiral instabilities. Right: Neutral stability curves for open spiral instabilities based on the BLL dispersion relation (Equation 21) with $\mathcal {J} = 0, 0.4, 0.6, 1.0$
, and 1.414.
$\mathcal {J} = 0, 0.4, 0.6, 1.0$
, and 1.414.

In the case of spiral perturbations with a finite pitch angle (i.e., open spiral perturbations), the effects of the gravitational perturbation parallel to the spiral arm, and shear originating from differential rotation need to be taken into account. Again, we consider the case where an axisymmetric disc receives a perturbation given by the small arrows shown in Figure 6(b). In contrast to the case of Figure 6(a), the fluid and stars move in the azimuthal direction, and centrifugal and Coriolis forces do not appear. Thus, growth is not suppressed. The effect of the excessive centrifugal and Coriolis forces stabilises the perturbation with a long wavelength (Section 2.1.1 and Figure 2), it is expected that the stabilization effect will become weak in a long wavelength regime and that open spiral arms will become unstable.
This qualitative expectation is checked quantitatively below. Lau & Bertin (Reference Lau and Bertin1978) derived the asymptotic dispersion relation of open spiral density waves in the fluid disc (Bertin-Lau-Lin dispersion relation; BLL dispersion relation):
 \begin{eqnarray}
(\omega - m\Omega )^2 \eqcellsep =\eqcellsep \kappa ^2 + k^2c_s^2\left[1 + \mathcal {J}^2\left(\frac{k_{\rm crit}}{k}\right)^2 \right] \nonumber \\
\eqcellsep\eqcellsep -\, 2\pi G \Sigma _0 |k| \left[1 + \mathcal {J}^2\left(\frac{k_{\rm crit}}{k}\right)^2 \right],
\end{eqnarray}
\begin{eqnarray}
(\omega - m\Omega )^2 \eqcellsep =\eqcellsep \kappa ^2 + k^2c_s^2\left[1 + \mathcal {J}^2\left(\frac{k_{\rm crit}}{k}\right)^2 \right] \nonumber \\
\eqcellsep\eqcellsep -\, 2\pi G \Sigma _0 |k| \left[1 + \mathcal {J}^2\left(\frac{k_{\rm crit}}{k}\right)^2 \right],
\end{eqnarray}
where $k = \sqrt{k_R^2 + k_\phi ^2}$
, kR
, and k
ϕ = m/R are the wave-number, radial wave-number, and azimuthal wave-number, respectively Footnote
5
. We define two quantities
$k = \sqrt{k_R^2 + k_\phi ^2}$
, kR
, and k
ϕ = m/R are the wave-number, radial wave-number, and azimuthal wave-number, respectively Footnote
5
. We define two quantities
 \begin{equation}
\mathcal {J} \eqcellsep\equiv\eqcellsep m \epsilon _{\rm 0} \left( \frac{4\Omega }{\kappa } \right) \left| \frac{d\ln \Omega }{d\ln R} \right|,\\
\end{equation}
\begin{equation}
\mathcal {J} \eqcellsep\equiv\eqcellsep m \epsilon _{\rm 0} \left( \frac{4\Omega }{\kappa } \right) \left| \frac{d\ln \Omega }{d\ln R} \right|,\\
\end{equation}
 \begin{equation}
\epsilon _{\rm 0} \eqcellsep\equiv\eqcellsep \frac{\pi G \Sigma _0}{R\kappa ^2}.
\end{equation}
\begin{equation}
\epsilon _{\rm 0} \eqcellsep\equiv\eqcellsep \frac{\pi G \Sigma _0}{R\kappa ^2}.
\end{equation} $\mathcal {J}$
indicates a stability parameter which depends on the disc mass relative to the total mass and a shear rate of the disc, and ε0 is a parameter which relates to the degree of the self-gravity. In the LS dispersion relation, as described in Section 2.1.1, the disc is stabilized by the rotational (κ2) and pressure effects (k
2
c
2
s) against self-gravity (2πGΣ0
k). In addition to these effects, the BLL dispersion relation includes within
$\mathcal {J}$
indicates a stability parameter which depends on the disc mass relative to the total mass and a shear rate of the disc, and ε0 is a parameter which relates to the degree of the self-gravity. In the LS dispersion relation, as described in Section 2.1.1, the disc is stabilized by the rotational (κ2) and pressure effects (k
2
c
2
s) against self-gravity (2πGΣ0
k). In addition to these effects, the BLL dispersion relation includes within $\mathcal {J}$
the rate of shear,
$\mathcal {J}$
the rate of shear, $\frac{d\ln \Omega }{d\ln R}$
, as well as the self-gravity term, ε0.
$\frac{d\ln \Omega }{d\ln R}$
, as well as the self-gravity term, ε0.
Based on the BLL dispersion relation, a neutral stability curve for spiral instabilities is given by
 \begin{eqnarray}
Q^2 \ge 4 \left[\frac{\lambda }{\lambda _{\rm crit}} - \frac{(\lambda /\lambda _{\rm crit})^2}{1+\mathcal {J}^2(\lambda /\lambda _{\rm crit})^2} \right],
\end{eqnarray}
\begin{eqnarray}
Q^2 \ge 4 \left[\frac{\lambda }{\lambda _{\rm crit}} - \frac{(\lambda /\lambda _{\rm crit})^2}{1+\mathcal {J}^2(\lambda /\lambda _{\rm crit})^2} \right],
\end{eqnarray}
where λ = 2π/k is a wavelength (right panel of Figure 7). If we set $\mathcal {J}=0$
, the neutral stability curve is equivalent to ones for the LS dispersion relation. From this neutral stability curve, a value of Q larger than unity is required for stability against spiral disturbances with a larger value of
$\mathcal {J}=0$
, the neutral stability curve is equivalent to ones for the LS dispersion relation. From this neutral stability curve, a value of Q larger than unity is required for stability against spiral disturbances with a larger value of $\mathcal {J}$
. This means that open spiral arms are difficult to stabilise and will, more often than not, result in growth.
$\mathcal {J}$
. This means that open spiral arms are difficult to stabilise and will, more often than not, result in growth.
Figure 8 shows the numerically integrated density contours of the global unstable modes with different $\mathcal {J}$
and Q values (Bertin et al. Reference Bertin, Lin, Lowe and Thurstans1989b). The pitch angle in the mode becomes smaller as the value of
$\mathcal {J}$
and Q values (Bertin et al. Reference Bertin, Lin, Lowe and Thurstans1989b). The pitch angle in the mode becomes smaller as the value of $\mathcal {J}$
decreases (panels (a), (b), and (c), respectively). For the case where
$\mathcal {J}$
decreases (panels (a), (b), and (c), respectively). For the case where $\mathcal {J}$
and Q are large (panel (a)), the bar mode becomes unstable. In the case of large
$\mathcal {J}$
and Q are large (panel (a)), the bar mode becomes unstable. In the case of large $\mathcal {J}$
but small Q (panel (d)), only the spiral mode is unstable. This behaviour is in agreement with that expected from the BLL dispersion relation (right panel in Figure 8). The right panel in Figure 8 shows curves of constant pitch angle α in the
$\mathcal {J}$
but small Q (panel (d)), only the spiral mode is unstable. This behaviour is in agreement with that expected from the BLL dispersion relation (right panel in Figure 8). The right panel in Figure 8 shows curves of constant pitch angle α in the $(\mathcal {J},Q)$
-plane. The pitch angle here (for the more general definition see Equation (27)) is given by
$(\mathcal {J},Q)$
-plane. The pitch angle here (for the more general definition see Equation (27)) is given by
 \begin{equation}
\alpha = \cot ^{-1} \frac{k_\phi }{k_R},
\end{equation}
\begin{equation}
\alpha = \cot ^{-1} \frac{k_\phi }{k_R},
\end{equation}
where kR
and k
ϕ are the radial wave-number and azimuthal wave-number, respectively. Thus, the unstable spiral mode is determined by two parameters, $\mathcal {J}$
and Q, given by the rotation curve of the galaxy disc.
$\mathcal {J}$
and Q, given by the rotation curve of the galaxy disc. $\mathcal {J}$
controls the shape and growth rate of the unstable mode. The spiral mode appears for smaller
$\mathcal {J}$
controls the shape and growth rate of the unstable mode. The spiral mode appears for smaller $\mathcal {J}$
, and the bar mode for larger
$\mathcal {J}$
, and the bar mode for larger $\mathcal {J}$
(Lau & Bertin Reference Lau and Bertin1978).
$\mathcal {J}$
(Lau & Bertin Reference Lau and Bertin1978).
Left: Density contours of global unstable modes for a rotating fluid disc where (a) $\mathcal {J} = 0.604$
and Q = 1.500, (b),
$\mathcal {J} = 0.604$
and Q = 1.500, (b), $\mathcal {J} = 0.538$
and Q = 1.096, (c),
$\mathcal {J} = 0.538$
and Q = 1.096, (c), $\mathcal {J} = 0.492$
and Q = 1.002, and (d)
$\mathcal {J} = 0.492$
and Q = 1.002, and (d) $\mathcal {J} = 0.858$
and Q = 1.004. Right: Curves of constant pitch angle
$\mathcal {J} = 0.858$
and Q = 1.004. Right: Curves of constant pitch angle $\alpha = \cot ^{-1} \frac{k_\phi }{k_R}$
in the
$\alpha = \cot ^{-1} \frac{k_\phi }{k_R}$
in the $(\mathcal {J},Q)$
-plane. These curves are derived from the BLL dispersion relation (Equation 21) for the neutral stability condition (Equation 24) with Γ = 0 (flat rotation curve). From Bertin et al. (Reference Bertin, Lin, Lowe and Thurstans1989b).
$(\mathcal {J},Q)$
-plane. These curves are derived from the BLL dispersion relation (Equation 21) for the neutral stability condition (Equation 24) with Γ = 0 (flat rotation curve). From Bertin et al. (Reference Bertin, Lin, Lowe and Thurstans1989b).

The number of spiral arms and their pattern speed cannot be determined in the framework of the tight-winding density-wave theory of Lin-Shu-Kalnajs (Section 2.1.1). On the other hand, for global mode theory, if the unstable mode with the highest growth rate (trailing spiral modes) is assumed to be the spiral arms actually observed, then the spiral arms can be uniquely predicted from the equilibrium state of a galactic disc. Therefore, it turns out that global unstable mode theory is a self-contained theory.
However, there are some limitations in the global mode theory. Firstly, it is assumed that the spiral mode rotates as a rigid body, without changing its shape in the global unstable mode analysis. Iye et al. (Reference Iye, Aoki, Ueda and Noguchi1983) studied the global unstable modes of the fluid disc without the rigid-body rotation of the spiral modes, and reported the appearance of a global leading mode as well as global trailing modes, which is a different result from the rigid-body case (Aoki et al. Reference Aoki, Noguchi and Iye1979). Recently, N-body simulations also show that spiral arms wind up over time by the shear of the galaxy disc (Wada, Baba, & Saitoh Reference Wada, Baba and Saitoh2011; Baba et al. Reference Baba, Saitoh and Wada2013; Grand et al. Reference Grand, Kawata and Cropper2013, see Sections 2.2.1 and 4.2 for details). Secondly, because global spiral modes grow up exponentially with time, the global mode theory requires self-regulated mechanisms such as damping effects in the stellar disc (e.g., Landau damping) and/or a gas component (Lin & Bertin Reference Lin, Bertin, van Woerden, Allen and Burton1985; Bertin & Romeo Reference Bertin and Romeo1988; Bertin et al. Reference Bertin, Lin, Lowe and Thurstans1989a, see also Section 3.1). Finally, it is unclear that the global modes really accomplish a neutrally stable state. The global mode theory hypotheses that the spiral arms are global neutral stability modes, which are accomplished by regulation mechanisms for the growth of density waves. However, Lynden-Bell & Kalnajs (Reference Lynden-Bell and Kalnajs1972) showed that spiral waves transport angular momentum by the gravitational torque which changes the distributions of angular momentum and mass (i.e., induces migration of stars and gas).
2.1.5 Simulations of long-lived spiral patterns
Various studies have tried to reproduce non-barred quasi-stationary density waves using numerical simulations, but so far, no convincing isolated, long-lived grand design spirals have been produced. The m = 2 case is of particular interest because low m modes are most likely to be stable (see Section 4.5), hence simulations have tended to focus on trying to model galaxies with a 2 armed spiral structure. As discussed in the previous sections, attaining a stable m = 2 perturbation involves modelling a disc which is sufficiently self gravitating to be unstable to the m = 2 mode, but stable to bar formation, and whereby density waves are able to be maintained by the presence of a Q barrier before the ILR, where waves can be reflected back towards corotation (Section 2.1.2). Two armed spirals associated with bars, or interactions, are of course common outputs from simulations, and we discuss these in Sections 2.3 and 2.4.
Early simulations of stellar discs all tended to form a bar (or oval distortion), and develop a strong m = 2 spiral mode (Miller, Prendergast, & Quirk Reference Miller, Prendergast and Quirk1970; Hohl Reference Hohl1971). The formation of a bar was also predicted analytically in the case of a uniformly rotating disc (Kalnajs Reference Kalnajs1972; Kalnajs & Athanassoula-Georgala Reference Kalnajs and Athanassoula-Georgala1974). However with the adoption of an extended, massive (comparable to or more massive than the disc) dark matter halo, the bar mode was both predicted, and found to be suppressed (Ostriker & Peebles Reference Ostriker and Peebles1973; Hohl Reference Hohl1976). Since then, simulations of isolated, non-barred galaxies have only produced multi-armed galaxies with transient spiral arms, as we discuss in Section 2.2. These types of galaxies can be produced readily with an N-body code. By contrast, trying to model an m = 2 spiral requires a long list of criteria to satisfy, and even then, m = 2 spirals still appear to be transient, evolving to m = 3 spirals and back again.
Thomasson et al. (Reference Thomasson, Elmegreen, Donner and Sundelius1990), and also Elmegreen & Thomasson (Reference Elmegreen and Thomasson1993), performed calculations of a galaxy, where in addition to the conditions above, they also enforced that the stellar velocity had to be maintained at a low value, and included a gas component. As will be mentioned in Section 3.2, and stated in Section 2.1.4, gas is likely required to allow energy from the spiral waves to dissipate. The galaxy tends to exhibit a pattern changing between 2 and 3 arms, and consequently has an asymmetric, rather than symmetric m = 2 pattern at many time frames. Without a Q barrier, the spirals are shorter lived, whilst without cooling or gas, higher m patterns become more prominent. Donner & Thomasson (Reference Donner and Thomasson1994) found similar results with a more consistent star formation scheme for the gas, and gas cooling and heating. Zhang (Reference Zhang1996) used the same setup as Donner & Thomasson (Reference Donner and Thomasson1994), and found similar spiral patterns, but without including a gas component. As well as changing to a 3 armed pattern, spirals which transition between an m ≥ 2 spiral and a barred spiral are likewise feasible to simulate by including gas accretion (Bournaud & Combes Reference Bournaud and Combes2002). But as yet no simulated galaxy retains a steady m = 2 spiral.
Sellwood (Reference Sellwood2011) tested some of the models claiming to find m = 2 spirals. He performed N-body simulations designed to test directly whether a galaxy model corresponding to panel (c) of Figure 8 can in fact survive to support the slowly growing mode they predict should dominate. He argued that this model evolves quickly due to multi-arm instabilities originating from swing-amplified noise (see Section 2.2.1) instead of producing quasi-stationary, two-armed spiral modes. This result suggests that dynamical evolution associated with shearing of spiral arms which is not considered in quasi-stationary density wave theories is important for generating the spiral arms in real galaxies. Sellwood (Reference Sellwood2011) also tested some of the above models, which have proposed to exhibit long-lived spirals (Donner & Thomasson Reference Donner and Thomasson1994; Zhang Reference Zhang1996). He showed that the bisymmetric spiral arm represented as a mode is not a single long-lived pattern, but the superpositions of three or more waves that each grow and decay.
Whilst simulations have been unsuccessful in reproducing a stationary spiral pattern, m = 2 or otherwise, recent work by D’Onghia et al. (Reference D’Onghia, Vogelsberger and Hernquist2013) and Sellwood & Carlberg (Reference Sellwood and Carlberg2014) do report the existence of longer-lived ‘modes’, which survive multiple rotations, and thus more resemble density wave theory. However these authors still state that their results are inconsistent with the idea that spirals are quasi-stationary density waves because the arms in their simulations still fluctuate in time. By contrast in global mode theory we would expect the arm shape to be unchanging for a number of rotations. For these long-lived spiral arms, the disc is required to be fairly gravitational dominated (Sellwood & Carlberg Reference Sellwood and Carlberg2014 adopt Q = 1) or include some perturbation(s) (D’Onghia et al. Reference D’Onghia, Vogelsberger and Hernquist2013, see also Salo & Laurikainen Reference Salo and Laurikainen2000b, Section 2.4.1).
2.2 Dynamic spirals
In this section we consider spiral arms which are transient, recurrent in nature. As we discussed in 2.2.1, the means of generating such arms is similar to that supposed in quasi-stationary density wave theory. However transient recurrent (or ‘dynamic’) spiral arms are much easier to form. For example dynamic arms occur readily in numerical simulations, where we can in relate predictions from swing amplification theory to the properties of the spiral arms generated, and in turn observations (see Section 4). Moreover stationary arms are in essence a small subset of arms resulting from gravitational instabilities requiring very specialised conditions in the disc to maintain the arms, whereas dynamic spiral arms can be generated with essentially any disc configuration that is not strongly bar unstable.
Pioneering N-body simulations of the stellar discs by Sellwood & Carlberg (Reference Sellwood and Carlberg1984) have shown that spiral arms are transient and recurrent structures (Carlberg & Freedman Reference Carlberg and Freedman1985; Bottema Reference Bottema2003; Sellwood Reference Sellwood2010b, Reference Sellwood2011; Fujii et al. Reference Fujii, Baba, Saitoh, Makino, Kokubo and Wada2011; Grand, Kawata, & Cropper Reference Grand, Kawata and Cropper2012a, Reference Grand, Kawata and Cropper2012b; Baba et al. Reference Baba, Saitoh and Wada2013; D’Onghia et al. Reference D’Onghia, Vogelsberger and Hernquist2013; Roca-Fàbrega et al. Reference Roca-Fàbrega, Valenzuela, Figueras, Romero-Gomez, Velazquez, Antoja and Pichardo2013). Sellwood & Carlberg (Reference Sellwood and Carlberg1984) argued that the spiral arms in N-body simulations generally fade out over time because the spiral arms heat the disc kinematically and cause the Q to rise. Thus, the disc becomes stable against non-axisymmetric structure (Section 2.1.1). They suggested that continuous addition of a kinematically cold population of stars is necessary to maintain the spiral arms. This suggests that the gas can effectively cool the system and thus play an important role (Section 3.1). Recently, Fujii et al. (Reference Fujii, Baba, Saitoh, Makino, Kokubo and Wada2011) performed high resolution three-dimensional N-body simulations of pure stellar discs, and suggested that the rapid disappearance of the spiral arms may result from a low number of particles in previous simulations. Instead, they revealed a self-regulating mechanism that maintains multi-arm spiral features for at least 10 Gyr in a pure stellar disc (Figure 11).
Spiral arms in these N-body simulations are transient and recurrently reform. This is also the case for an N-body disc with a central bar (Baba et al. Reference Baba, Asaki, Makino, Miyoshi, Saitoh and Wada2009; Grand et al. Reference Grand, Kawata and Cropper2012b). The dominant spiral modes are time-dependent, reflecting a highly nonlinear evolution of spiral density enhancements, and radial changes (bottom panels in Figure 11). The arms are found to undergo a cycle – breaking up into smaller segments with typical sizes of a few kpc, then reconnecting by differential rotation to reform large scale patterns (Fujii et al. Reference Fujii, Baba, Saitoh, Makino, Kokubo and Wada2011; Wada et al. Reference Wada, Baba and Saitoh2011). D’Onghia et al. (Reference D’Onghia, Vogelsberger and Hernquist2013) presented a similar argument that the evolution of the spiral arm is characterized by a balance between shear and self-gravity of the galactic disc: the shear tends to stretch and then break the spiral arms locally, whereas in regions where the self-gravity dominates, the spiral arm is over-dense and generates the segments making up the spiral arms. Baba et al. (Reference Baba, Saitoh and Wada2013) pointed out that radial migration of stars around spiral arms are essential for damping of spiral arms, because excessive Coriolis forces originating from the growth of a spiral arm result in radial migration of the stars involved during the spiral arm evolution (their Figure 8).
In summary, these recent simulations of isolated disc galaxies conclude that the global spiral arms can appear to be long-lived visually, but they are assemblies of segments which break and then later reconnect with other segments of spiral arms. In this sense, the spiral arms are in ‘dynamic equilibrium’ between shear (or Coriolis force) and self-gravity rather than neutral stable waves assumed in the quasi-stationary density wave theory (Lin & Shu Reference Lin and Shu1964; Bertin & Lin Reference Bertin, Lin, Bertin and Lin1996).
2.2.1 Swing amplified spirals
We introduced swing amplification in Section 2.1.3 as a means of sustaining quasi-stationary density waves between the ILR and OLR. Here we describe the generation of dynamic spirals by swing amplification, but unlike the quasi-stationary density waves described in Section 2.1, there is no need for the waves to be reflected and maintained.
Full N-body simulations of stellar discs can test the predictions from swing amplification theory (Sellwood & Carlberg Reference Sellwood and Carlberg1984; Carlberg & Freedman Reference Carlberg and Freedman1985; Bottema Reference Bottema2003; Fujii et al. Reference Fujii, Baba, Saitoh, Makino, Kokubo and Wada2011; D’Onghia et al. Reference D’Onghia, Vogelsberger and Hernquist2013; Baba et al. Reference Baba, Saitoh and Wada2013). We can estimate the dominating number of spiral arms, m, as
 \begin{equation}
m = \frac{\kappa ^2 R}{2\pi G \Sigma _0 X} \approx \frac{\kappa ^2 R}{4\pi G \Sigma _0},
\end{equation}
\begin{equation}
m = \frac{\kappa ^2 R}{2\pi G \Sigma _0 X} \approx \frac{\kappa ^2 R}{4\pi G \Sigma _0},
\end{equation}
where X ≈ 2 (Equation 19) is assumed, and find this is roughly consistent with the results of N-body simulations. As described above, spiral arms typically develop most effectively when 1 < X < 2, so taking X ≈ 2 is appropriate (Figure 5). More generally, for a galaxy with a flat rotation curve (Γ = 0.5) and a total mass within the disc of M
tot (mainly dark matter and stars), since κ2 = 2Ω2 ~ GM
tot/R
2, we also obtain the number of spiral arms as m ~ Σtot/Σ0 = 1/f
disc. Carlberg & Freedman (Reference Carlberg and Freedman1985) performed N-body simulations of galactic discs with various disc mass fractions and found that the number of spiral arms is strongly correlated with the disc mass fraction f
disc. A similar result is also obtained by N-body simulations with much higher resolution (Bottema Reference Bottema2003; Fujii et al. Reference Fujii, Baba, Saitoh, Makino, Kokubo and Wada2011; D’Onghia et al. Reference D’Onghia, Vogelsberger and Hernquist2013). Also since $\kappa = \sqrt{2} \Omega \propto 1/R$
for the galaxy with a flat rotation curve, m∝1/(RΣ0) and the number of spiral arms tends to increase with radius in outer regions of exponential-discs. This agrees qualitatively with observations. As a specific example, we show the radial distributions of the number of spiral arms obtained by N-body simulations (Bottema Reference Bottema2003) and observations of NGC1288 (Fuchs & Möllenhoff Reference Fuchs and Möllenhoff1999) in Figure 9.
$\kappa = \sqrt{2} \Omega \propto 1/R$
for the galaxy with a flat rotation curve, m∝1/(RΣ0) and the number of spiral arms tends to increase with radius in outer regions of exponential-discs. This agrees qualitatively with observations. As a specific example, we show the radial distributions of the number of spiral arms obtained by N-body simulations (Bottema Reference Bottema2003) and observations of NGC1288 (Fuchs & Möllenhoff Reference Fuchs and Möllenhoff1999) in Figure 9.
(top) Radial distribution of the number of spiral arms obtained by N-body simulations (Bottema Reference Bottema2003). (middle) Same as the top panel, but for observations of NGC 1288 (Fuchs & Möllenhoff Reference Fuchs and Möllenhoff1999). (bottom) I-band face-on view of NGC 1288 (Fuchs & Möllenhoff Reference Fuchs and Möllenhoff1999).
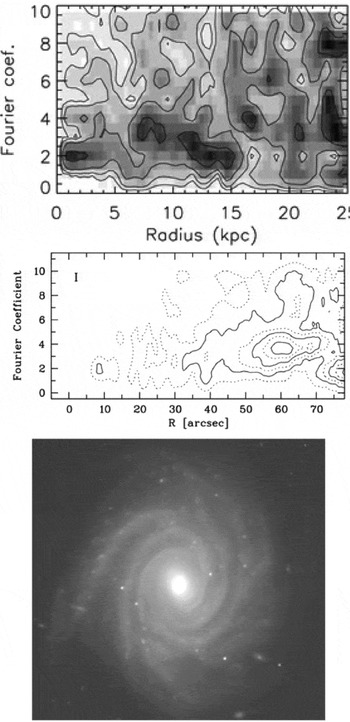
The pitch angle of the spiral arm is in reasonable agreement with the predictions of swing amplification theory. Figure 10 shows the evolution of a stellar spiral arm along the pitch-angle - density-contrast ( $\alpha -\bar{\delta }$
) plane. Due to differential rotation, one arm becomes more tightly wound as time goes by, and eventually disappears. In the meantime, new spiral arms with larger pitch angles start to grow. As the pitch angle of the spiral arm decreases from α ≈ 40° (T
rot = 12.0) to α ≈ 32° (T
rot = 12.20), the density contrast increases to a maximum, and the density contrast subsequently decreases with a decrease in the pitch angle. Thus, the spiral arm has a maximum amplitude when α ~ 32°. This value is consistent with the expectation from swing amplification theory (hatched region in Figure 10). This behavior is similar to that reported in Sellwood & Carlberg (Reference Sellwood and Carlberg1984). We compare the pitch angles of spiral arms produced by swing amplification theory with observations in Section 4.2.
$\alpha -\bar{\delta }$
) plane. Due to differential rotation, one arm becomes more tightly wound as time goes by, and eventually disappears. In the meantime, new spiral arms with larger pitch angles start to grow. As the pitch angle of the spiral arm decreases from α ≈ 40° (T
rot = 12.0) to α ≈ 32° (T
rot = 12.20), the density contrast increases to a maximum, and the density contrast subsequently decreases with a decrease in the pitch angle. Thus, the spiral arm has a maximum amplitude when α ~ 32°. This value is consistent with the expectation from swing amplification theory (hatched region in Figure 10). This behavior is similar to that reported in Sellwood & Carlberg (Reference Sellwood and Carlberg1984). We compare the pitch angles of spiral arms produced by swing amplification theory with observations in Section 4.2.
Evolution of spiral arm on $\alpha -\bar{\delta }$
plane for Trot
= 12.0 − 12.5. The hatched region corresponds to the predicted maximum pitch angle around the analysed region (Q ≈ 1.4 and Γ ≈ 0.8) due to swing amplification (refer to Equation (98) in Fuchs (Reference Fuchs2001)). From Baba et al. (Reference Baba, Saitoh and Wada2013).
$\alpha -\bar{\delta }$
plane for Trot
= 12.0 − 12.5. The hatched region corresponds to the predicted maximum pitch angle around the analysed region (Q ≈ 1.4 and Γ ≈ 0.8) due to swing amplification (refer to Equation (98) in Fuchs (Reference Fuchs2001)). From Baba et al. (Reference Baba, Saitoh and Wada2013).

Evolution of spiral arms with N = 30M. Top panels show the surface density, middle panels show the surface density normalized at each radius, and bottom panels show the Fourier amplitudes. From Fujii et al. (Reference Fujii, Baba, Saitoh, Makino, Kokubo and Wada2011).

In addition to the non-stationarity of stellar spiral arms, recent N-body simulations have shown that the pattern speed of the spiral arms decreases with radius in a similar manner to the angular rotation velocity of the disc (See also Section 4.1; Wada et al. Reference Wada, Baba and Saitoh2011; Grand et al. Reference Grand, Kawata and Cropper2012b, Reference Grand, Kawata and Croppera; Baba et al. Reference Baba, Saitoh and Wada2013; Roca-Fàbrega et al. Reference Roca-Fàbrega, Valenzuela, Figueras, Romero-Gomez, Velazquez, Antoja and Pichardo2013). Thus, the spiral arms are considered to be rotating with the rest of the disc at every radius, and are material arms. In the above models, the evolution of the spiral arms is governed by the winding of the arms, which leads to breaks and bifurcations of the spiral arms. Sellwood & Lin (Reference Sellwood and Lin1989) and Sellwood & Kahn (Reference Sellwood and Kahn1991) instead argued that the dynamics originate from multiple wave modes of different pattern speeds constructively and destructively interfering with one another (Sellwood Reference Sellwood2011; Quillen et al. Reference Quillen, Dougherty, Bagley, Minchev and Comparetta2011; Roškar et al. Reference Roškar, Debattista, Quinn and Wadsley2012; Sellwood Reference Sellwood2012).
Finally, Sellwood & Carlberg (Reference Sellwood and Carlberg1984) also investigated the amplitudes of swing amplified spiral arms. They found that the growth of perturbations is in reasonable quantitative agreement with the prediction of swing amplification theory, although the growth factor was slightly larger than a naive expectation from the level of particle shot noise (i.e., swing-amplified noise). This discrepancy between numerical simulations and theoretical expectations is also seen in local stellar discs (Toomre & Kalnajs Reference Toomre, Kalnajs and Sundelius1991). It may relate to non-linear effects of swing-amplified spiral instabilities. Toomre & Kalnajs (Reference Toomre, Kalnajs and Sundelius1991) attributed the discrepancy to additional correlations between the particles that developed over a long period, i.e., the polarized disc response to random density fluctuations. By contrast, Sellwood (Reference Sellwood and Sellwood1989) showed that the amplitudes of spiral arms in global simulations of stellar discs seem to be independent of the particle number, rather than declining as N − 1/2 as would be predicted from the swing-amplified noise (Toomre & Kalnajs Reference Toomre, Kalnajs and Sundelius1991). It should be noted that star clusters and GMCs in real galaxies can seed much larger fluctuations than shot noise from equal-mass particles (D’Onghia et al. Reference D’Onghia, Vogelsberger and Hernquist2013). Sellwood (Reference Sellwood2011) also argued that spiral arms originating from swing-amplified shot noise are too low compared to observed spiral amplitudes. Instead, Sellwood (Reference Sellwood2000) suggested that spiral arms are vigorous large-scale modes originating from groove mode instabilities (Sellwood & Lin Reference Sellwood and Lin1989; Sellwood & Kahn Reference Sellwood and Kahn1991) (see Section 2.2.3).
2.2.2 Corotation scattering and radial migration of stars
Since the dynamic spiral arms do not have a single pattern speed but roughly follow the galactic rotation, or multi-wave patterns with different pattern speeds exist, these arms scatter stars everywhere in the disc via the corotation resonance (Sellwood & Binney Reference Sellwood and Binney2002; Grand et al. Reference Grand, Kawata and Cropper2012b; Roškar et al. Reference Roškar, Debattista, Quinn and Wadsley2012; Baba et al. Reference Baba, Saitoh and Wada2013; Grand, Kawata, & Cropper Reference Grand, Kawata and Cropper2014). Figure 12 shows the evolution of stars along the ϕ − R plane and the azimuth angle (ϕ)-the angular momentum (Lz ) plane. The stars evolve in this plot due to changes in their angular momenta. When the stars are captured by the density enhancement (T rot ≃ 11.8 − 12.0), they radially migrate along the spiral arms. The stars approaching from behind the spiral arm (i.e., inner radius) tend to attain increased angular momenta via acceleration along the spiral arm, whereby they move to the disc’s outer radius. In contrast, the stars approaching ahead of the spiral arm (i.e., outer radius) tend to lose their angular momenta via deceleration along the spiral arm, and they move to the disc’s inner radius. Along the ϕ − Lz plane, the stars oscillate both horizontally as well as vertically. Moreover, the guiding centers of the oscillations do not remain constant at the same value of Lz . This is essentially different from the epicycle motion in which Lz is conserved.
Orbital evolution of stars in the spiral arm. The stars associate around the spiral arm within a distance of ± 0.5 kpc at T rot = 4.0. Left columns: orbits on ϕ − R plane. Middle columns: orbits on ϕ − Lz plane. Right columns: orbits on E − Lz plane. The colours denote the angular momentum at the time instants when the stars are associated with the spiral arm. From Baba et al. (Reference Baba, Saitoh and Wada2013).

The panels in the right column of Figure 12 show the so-called Lindblad diagram, where the angular momentum Lz of each star is plotted against its total energy E. The stars oscillate along the curve of circular motion by undergoing change in terms of both angular momentum and energy (Sellwood & Binney Reference Sellwood and Binney2002; Grand et al. Reference Grand, Kawata and Cropper2012a; Roškar et al. Reference Roškar, Debattista, Quinn and Wadsley2012; Baba et al. Reference Baba, Saitoh and Wada2013). This is because stars around the corotation point change their angular momenta without increasing their random energy (Lynden-Bell & Kalnajs Reference Lynden-Bell and Kalnajs1972).
Grand et al. (Reference Grand, Kawata and Cropper2012a) also noticed the slight heating of negative migrators and the slight cooling for positive migrators (their Figure 12). Roškar et al. (Reference Roškar, Debattista, Quinn and Wadsley2012), Minchev et al. (Reference Minchev, Famaey, Quillen, Di Matteo, Combes, Vlajic, Erwin and Bland-Hawthorn2012), and Baba et al. (Reference Baba, Saitoh and Wada2013) also reported a similar effect of the radial migration of stars around the spiral arms upon disc heating. Thus a non-negligible fraction of the particles that migrate outward have their orbits cooled by the spiral arm. This ‘dynamical cooling’ can be important for recurrent spiral instabilities.
2.2.3 Recurrent mechanisms for dynamic stellar spiral arms
The mechanism by which spiral arms recur is unclear. Sellwood & Kahn (Reference Sellwood and Kahn1991), and Sellwood & Lin (Reference Sellwood and Lin1989) proposed a feedback cycle whereby narrow features in the angular momentum density of stars drive large-scale dynamic spiral arms. The arms in turn lead to resonant scattering of stars, which serves as a seed for the next spiral arm formation. This large-scale spiral instability, which originates from the deficiency of stars over a narrow range of angular momenta (also corresponding to a change in the surface density for stars on a circular orbit), is called the ‘groove’ instability. This feedback cycle was observed in N-body simulations of a low-mass disc with a near Keplerian rotation curve (Sellwood & Lin Reference Sellwood and Lin1989). The phase space density is depopulated near the OLR of one wave, inducing a new large-scale spiral instability with a CR near the OLR of the first wave. Sellwood (Reference Sellwood2000) also reported that the distribution of the solar neighborhood stars on in angular momentum phase space has similar fine structures (Sellwood Reference Sellwood, Morrison and Gilmore1994, Reference Sellwood2010a), suggesting that this recurrent mechanism cycle may occur in real spiral galaxies. Scattering of stars by spiral arms at the ILR, in such a way to form a new spiral arm, is also observed in more massive discs with near flat rotation curves (Sellwood Reference Sellwood2012). However, Sellwood (Reference Sellwood2012) concluded that some other mechanism may be required for recurrent spiral instabilities, because he was not able to find evidence to support the groove-type cycle such as observed in less massive discs with a near Keplerian rotation (Sellwood & Lin Reference Sellwood and Lin1989).
Baba et al. (Reference Baba, Saitoh and Wada2013) showed that oscillating stars successively undergo aggregation and disaggregation in energy-Lz space, thereby leading to the formation of structures referred to as ‘swarms of stars’ along the ϕ − Lz and R − ϕ planes (the right column of Figure 12). The non-steady nature of the spiral arms originates in the dynamical interaction between these swarming stars with a nonlinear epicycle motion, and the high-density regions, i.e., the spiral arms moving with galactic rotation. This is entirely different from what is expected in stationary density waves, where these changes are limited to the CR and Lindblad resonances (Lynden-Bell & Kalnajs Reference Lynden-Bell and Kalnajs1972). Thus, the gravitational interaction between the stars in the spiral arm and the spiral density enhancement changes the angular momentum and random energy of the stars, and this process in turn changes the structure of the spirals. During this process, the random energy of individual stars in the system does not increase monotonically. In other words, local interactions between the non-steady arms and stars increase or decrease the total energy of individual stars locally; however, the energy remains around its value for circular motion with the occurrence of a small dispersion. This is because the interaction causes the migration of the guiding centers of the stars without increasing their eccentricity or random energy. This ‘dynamical cooling’ mechanism (Grand et al. Reference Grand, Kawata and Cropper2012a; Roškar et al. Reference Roškar, Debattista, Quinn and Wadsley2012; Minchev et al. Reference Minchev, Famaey, Quillen, Di Matteo, Combes, Vlajic, Erwin and Bland-Hawthorn2012; Baba et al. Reference Baba, Saitoh and Wada2013) is essential to preventing heating of the stellar disc and erasure of the spiral arms, and the mechanism produces ‘swarms’ of stars moving between non-steady spirals. The non-linear epicycle motion of the stars and their non-linear coupling with the density perturbation is the fundamental physics of the recurrently formed, non-steady spiral arms in a stellar disc.
2.3 Bar driven spirals
In many barred grand design spirals, the spiral arms start at the two ends of the bar. Two-armed spirals around strong bars are rather common, representing ≈ 70% of typical field spirals, unlike unbarred field spirals where only ≈ 30% are two-armed (Elmegreen & Elmegreen Reference Elmegreen and Elmegreen1982). Although this correlation suggests that the bar and spiral pattern have the same pattern speed and thus are related, the direct connection between bars and spirals is still unclear. There are three common interpretations (Mo, van den Bosch, & White Reference Mo, van den Bosch and White2010): (1) the bar and spiral arms have a common pattern speed, (2) the bar and spiral arms have different pattern speeds and are independent patterns from each other, and (3) the bar and spiral arms have different pattern speeds but are coupled via some non-linear interactions.
2.3.1 Spirals corotating with bars
The first interpretation, which the bar and spiral arms have a common pattern speed, is intuitive from observations that most spiral arms connect to the ends of the bar. Sanders & Huntley (Reference Sanders and Huntley1976) studied the response of gas to a steady bar perturbation using hydrodynamical simulations. They found that the gas eventually settled into a steady state with a prominent trailing spiral structure. Gaseous spiral arms driven by a bar have since been seen in many further simulations (e.g. Schwarz Reference Schwarz1981; Combes & Gerin Reference Combes and Gerin1985; Athanassoula Reference Athanassoula1992; Wada Reference Wada1994; Englmaier & Gerhard Reference Englmaier and Gerhard1999; Bissantz, Englmaier, & Gerhard Reference Bissantz, Englmaier and Gerhard2003; Rodriguez-Fernandez & Combes Reference Rodriguez-Fernandez and Combes2008). The gas arms are a direct response of the bar forcing. Figure 13 show the stellar closed orbits (left) and gaseous closed orbits (right) in a weak bar potential. Stellar orbits are always parallel or perpendicular to the bar, whilst the gas orbits change their orientation with radius, due to the effects of dissipation. The elliptical gaseous orbits are inclined to the bar potential in a trailing sense outside corotation. Thus, dissipation associated with the gas viscosity plays a critical role in driving gaseous spirals. Note that simulations in which a gas disc embedded in a ‘steady’ bar potential is replaced by a collisionless disc of test star particles also gives rise to a prominent trailing spiral structure but the stars never settle into a steady spiral structure. But stellar spiral arms can be excited by a ‘growing’ bar (Hohl Reference Hohl1971).
Stellar closed orbits (left) and gaseous closed orbits (right) in a weak barred potential. The radii of the inner ILR, outer ILR, CR, and OLR are at 0.8, 2.4, 4.6, and 6.0, respectively. The gaseous closed orbits are calculated based on the damped orbit model by Wada (Reference Wada1994) who added the damping term (emulating the collisional nature gas) to equations of stellar orbits in a weak bar from Section 3.3 of Binney & Tremaine (Reference Binney, Tremaine, Binney and Tremaine2008). Note that Wada (Reference Wada1994) only showed a solution for radial direction. See the appendix of Sakamoto et al. (Reference Sakamoto, Okumura, Ishizuki and Scoville1999) for a full set of the solutions. A similar introduction of a damping term was also made by Sanders & Huntley (Reference Sanders and Huntley1976) and Lindblad & Lindblad (Reference Lindblad and Lindblad1994). The stellar response to forcing by a steady bar cannot form spiral arms. In contrast, the phase delay of epicycle motion in terms of the bar perturbation naturally takes place as does in a damped oscillator affected by a periodic external force. This phase delay determines direction of spirals (i.e. trailing or leading) around the Lindblad resonance (Wada Reference Wada1994).

Manifold theory or manifold flux-tube theory is proposed as a way of determining the orbits of stars in spiral arms driven by a bar (Romero-Gómez et al. Reference Romero-Gómez, Masdemont, Athanassoula and García-Gómez2006, Reference Romero-Gómez, Athanassoula, Masdemont and García-Gómez2007; Athanassoula, Romero-Gómez, & Masdemont Reference Athanassoula, Romero-Gómez and Masdemont2009b; Athanassoula et al. Reference Athanassoula, Romero-Gómez, Bosma and Masdemont2009a, Reference Athanassoula, Romero-Gómez, Bosma and Masdemont2010; Athanassoula Reference Athanassoula2012; Voglis, Stavropoulos, & Kalapotharakos Reference Voglis, Stavropoulos and Kalapotharakos2006a; Voglis, Tsoutsis, & Efthymiopoulos Reference Voglis, Tsoutsis and Efthymiopoulos2006b; Tsoutsis, Efthymiopoulos, & Voglis Reference Tsoutsis, Efthymiopoulos and Voglis1980; Tsoutsis et al. Reference Tsoutsis, Kalapotharakos, Efthymiopoulos and Contopoulos2009). According to this theory, the backbone of barred spirals are bunches of untapped stars (so-called Lyapunov orbits) escaped from the unstable Lagrangian pointsFootnote 6 , which are located on the direction of the bar major axis, outside the bar but near its ends. This means that, contrary to the quasi-stationary density waves, the stars do not cross the barred spiral arms but they move along them or they are spatially well confined by the manifoldsFootnote 7 (Figures 1 and 4 of Athanassoula Reference Athanassoula2012). Athanassoula et al. (Reference Athanassoula, Romero-Gómez, Bosma and Masdemont2010) and Athanassoula (Reference Athanassoula2012) compared the properties of spiral arms predicted by manifold theory with N-body simulations. They found good agreement between the manifold theory and the simulations (see Figure 12 of Athanassoula et al. Reference Athanassoula, Romero-Gómez, Bosma and Masdemont2010), and in the simulations stars moved along the spiral arms as predicted (see Figure 4 of Athanassoula Reference Athanassoula2012). The manifold theory predicts that the relative strength of the non-axisymmetric forcing in the region around and beyond CR influences the winding of spiral arms, in the sense that in strongly barred galaxies the spirals will be more open than in less strongly barred ones (Athanassoula et al. Reference Athanassoula, Romero-Gómez, Bosma and Masdemont2010). This trend was corroborated in observed barred spiral galaxies (Martínez-García Reference Martínez-García2012).
One observational indication of the bar-driven spiral scenario is that grand-design spirals are more frequent in barred galaxies than in unbarred galaxies (Elmegreen & Elmegreen Reference Elmegreen and Elmegreen1982). However there are still many multi-armed (e.g. NGC 1232, NGC 3344, NGC 3953, NGC 6946, IC 342, Figure 14), and flocculent (e.g. NGC 1313, NGC 5068) spirals that exhibit barsFootnote 8 . Early type barred galaxies tend to have stronger bars and grand-design or multiple spiral arms, while late type barred galaxies have weaker bars and flocculent spiral arms (Figure 13 of Elmegreen et al. Reference Elmegreen, Elmegreen and Yau2011). Several studies have examined correlations between bar strengths and spiral arm strengths, with some finding clear evidence of bar driven spirals (Block et al. Reference Block, Buta, Knapen, Elmegreen, Elmegreen and Puerari2004; Salo et al. Reference Salo, Laurikainen, Buta and Knapen2010), and others finding little or no evidence (Seigar & James Reference Seigar and James1998; Durbala et al. Reference Durbala, Buta, Sulentic and Verdes-Montenegro2009; Kendall et al. Reference Kendall, Kennicutt and Clarke2011). Thus observations suggest that the bar-driven spiral scenario is not necessarily valid for all barred spiral galaxies.
B-band images of NGC 3953 (left), NGC 3124 (middle) and NGC 3450 (right). From The de Vaucouleurs Atlas of Galaxies (Buta et al. Reference Buta, Corwin and Odewahn2007).

2.3.2 Decoupling between spirals and bars
The second possibility is that bars and spiral arms can be independent patterns. In this case, spirals in barred galaxies are associated with a spiral density wave, but probably with a pattern speed different from that of the bar (Sellwood & Sparke Reference Sellwood and Sparke1988; Rautiainen & Salo Reference Rautiainen and Salo1999). Indeed, Sellwood & Sparke (Reference Sellwood and Sparke1988) have demonstrated N-body simulations of a stellar disc, and shown that multiple pattern speeds are quite common in disc galaxies, with the spiral structure typically having a much lower pattern speed than the bar. In other words, bars and spiral arms can be independent features. This implies a more or less random distribution of the phase difference between the bar and the start of the spiral arms, which seems to be in conflict with observations. However, as pointed out by Sellwood & Sparke (Reference Sellwood and Sparke1988), contour plots of the non-axisymmetric density in their simulations show that the spiral arms appear to the eye to be joined to the ends of the bar for most of the beat frequency. This suggests that the observed correlation between bars and spirals might simply be an illusion.
2.3.3 Non-linear coupling between spirals and bars
A third interpretation for the origin of spiral arms in barred galaxies is a non-linear coupling between bars and spiral density waves, where the bar and spiral arm have different pattern speeds (Tagger et al. Reference Tagger, Sygnet, Athanassoula and Pellat1987; Sygnet et al. Reference Sygnet, Tagger, Athanassoula and Pellat1988; Masset & Tagger Reference Masset and Tagger1997; Minchev et al. Reference Minchev, Famaey, Quillen, Di Matteo, Combes, Vlajic, Erwin and Bland-Hawthorn2012). This mechanism assumes some small overlap between the corotation (CR) of the bar and the inner Lindblad resonance (ILR) of the spiral density wave. Using the tight-winding and epicyclic approximations for density waves, Tagger et al. (Reference Tagger, Sygnet, Athanassoula and Pellat1987) and Sygnet et al. (Reference Sygnet, Tagger, Athanassoula and Pellat1988) showed that this overlap enables the transfer of energy and angular momentum between the bar, spiral density wave and beat (m = 0 and m = 4) waves. The bar is stabilized at a finite amplitude by transferring energy and angular momentum to the spiral density wave, and the non-linear coupling drives beat waves. This theoretical argument on the non-linear coupling was also studied by N-body simulations of stellar discs (Masset & Tagger Reference Masset and Tagger1997; Rautiainen & Salo Reference Rautiainen and Salo1999), where the predicted strong beat waves were observed. This scenario is similarly supported by more recent N-body/SPH simulations of galactic discs (Minchev et al. Reference Minchev, Famaey, Quillen, Di Matteo, Combes, Vlajic, Erwin and Bland-Hawthorn2012). Notably though, the derived beating waves exhibit chaotic behaviour rather than a stationary spiral pattern.
Sometimes the spiral arms do not start from the ends of the bar but exhibit a clear phase difference (e.g., NGC 1365). Similarly, some observed barred galaxies, such as NGC 3124 (Buta, Corwin, & Odewahn Reference Buta, Corwin and Odewahn2007; Efremov Reference Efremov2011) and NGC 3450 (Buta et al. Reference Buta, Corwin and Odewahn2007), show the curved, leading ends of the stellar bar (Figure 14). Similar morphology can be seen in N-body simulations of barred galaxies due to the oscillations between trailing and leading ends of the bar (e.g. Fux Reference Fux1997; Rautiainen & Salo Reference Rautiainen and Salo2000; Martinez-Valpuesta & Gerhard Reference Martinez-Valpuesta and Gerhard2011). Martinez-Valpuesta & Gerhard (Reference Martinez-Valpuesta and Gerhard2011) suggested that the oscillations could be related to the oscillations seen in the bar growth in N-body simulations (e.g. Dubinski, Berentzen, & Shlosman Reference Dubinski, Berentzen and Shlosman2009) through angular momentum transfer to disc stars (e.g. Sellwood Reference Sellwood1981) and to non-linear coupling modes between the bar and spiral density wave as mentioned above.
2.3.4 Non-stationary spiral arms in barred galaxies
Grand et al. (Reference Grand, Kawata and Cropper2012b) performed N-body/hydrodynamic simulations of a Milky Way-sized barred galaxy and analysed the spiral pattern speed. They found that the spiral arms are transient features and their pattern speeds decrease with radius in a similar manner to the angular velocity, but the pattern speed is slightly higher than the angular velocity of the disc. These results suggest that spiral arms in barred galaxies could be neither rigid-body rotating patterns predicted by the quasi-stationary density wave theory nor independent features, but transient features boosted by the bar. The non-stationarity of spiral arms in barred galaxies is also reported by other N-body/hydrodynamics simulations (Fux Reference Fux1997; Baba et al. Reference Baba, Asaki, Makino, Miyoshi, Saitoh and Wada2009). Baba et al. (Reference Baba, Asaki, Makino, Miyoshi, Saitoh and Wada2009) argued that non-stationary, winding spiral arms in a simulated barred spiral galaxy originate via swing amplification (Section 2.1.3). In contrast, Roca-Fàbrega et al. (Reference Roca-Fàbrega, Valenzuela, Figueras, Romero-Gomez, Velazquez, Antoja and Pichardo2013) reported that simulated spiral arms in strongly barred galaxies have a pattern speed almost constant in radius. More interestingly, they reported that the spiral pattern speed is close to disc rotation only when the bar is weak, as obtained by Grand et al. (Reference Grand, Kawata and Cropper2012b), but becomes almost constant when the bar has fully formed. These results suggest that the relation between bars and spiral arms can change during the evolutionary stages of bars, although there is no observational evidence to support, or contradict this picture.
2.4 Tidal interactions
2.4.1 Historical overview
Tidal encounters are frequent across all astronomy, with interacting galaxies providing some of the clearest examples. Early attempts to categorise interacting, and other more unusual galaxies, showed many examples of galaxies with tidal tails, bridges and clear spiral structure (Vorontsov-Velyaminov Reference Vorontsov-Velyaminov1959; Arp Reference Arp1966) prompting the morphology of galaxies to be associated with tidal effects (e.g. van den Bergh Reference van den Bergh1959; Lindblad Reference Lindblad1960; Hodge & Merchant Reference Hodge and Merchant1966; Toomre Reference Toomre1969). The idea that tidal interactions may be responsible for spiral arms was in fact first demonstrated 20 years earlier, by Holmberg (Reference Holmberg1941). In a now famous experiment, Holmberg (Reference Holmberg1941) modelled the interaction of two galaxies by representing the galaxies by a series of lightbulbs. The lightbulbs have initial velocities associated with them due to the initial velocities of each galaxy assumed for the interaction, and their rotation curves. A photocell is used to measure the total amount of light at any particular point in the galaxies. Since light obeys a inverse square law the same as gravity, the total light received by the photocell is equivalent to the total gravitational force at that point in the galaxy. This force, or rather acceleration, is then used to calculate how far to move the given lightbulb. This step is then repeated for all the lightbulbs used, and the whole process repeated for many steps. The results of this experiment showed clearly the development of tidal spiral arms.
From the 1960s, actual numerical calculations of interacting galaxies were able to be performed (Pfleiderer & Siedentopf Reference Pfleiderer and Siedentopf1961; Pfleiderer Reference Pfleiderer1963; Tashpulatov Reference Tashpulatov1970; Toomre & Toomre Reference Toomre and Toomre1972; Eneev, Kozlov, & Sunyaev Reference Eneev, Kozlov and Sunyaev1973), although they were still limited to test particle simulations using a restricted 3 body approach, which neglects stellar self gravity. These simulations focused mainly on the origin of tails and bridges in galaxies, rather than spiral arms themselves. Nevertheless, Toomre & Toomre (Reference Toomre and Toomre1972) still represents one of the most comprehensive studies of galaxy interactions, spanning over all possible alignments of the two galaxies in space, unequivocally showing that bridges and tails were indeed the result of tidal interactions. These simulations also reproduced a number of known systems remarkably well, including M51 and the Mice.
2.4.2 Tidally induced arms: stationary, kinematic or material arms?
Since the 1970s, full N body simulations, were able to model interactions with much higher resolution, and demonstrate that tidal interactions could account not only for tails and bridges at large galactic radii, but also spiral arms penetrating to the centre of a galaxy (Hernquist Reference Hernquist and Wielen1990; Sundelius et al. Reference Sundelius, Thomasson, Valtonen and Byrd1987; Donner & Thomasson Reference Donner and Thomasson1994; Salo & Laurikainen Reference Salo and Laurikainen2000b; Dobbs et al. Reference Dobbs, Theis, Pringle and Bate2010) (see Figure 15, left panel). Whilst these studies clearly demonstrate m = 2 spiral arms, a more critical question is whether the spiral arms are representative of the quasi-stationary spiral arm picture, are kinematic density waves, or material arms. For material arms there is no difference between the spiral arms and the underlying differential rotation of the stellar disc – the pattern speed of the arms is that of the disc, i.e. Ωp(R) = Ω(R). Whilst material arms may describe the outer arms, or tidal tails of galaxies (e.g. Toomre Reference Toomre1969; Meidt et al. Reference Meidt, Schinnerer and Garcia-Burillo2013) they are not found to characterise the arms over the main part of the stellar disc. Sundelius et al. (Reference Sundelius, Thomasson, Valtonen and Byrd1987) demonstrated using numerical simulations that tidally induced spiral arms are density waves rather than material arms, whilst observations have shown that the velocity fields of interacting galaxies do not correspond to material arms (e.g. Rots & Shane Reference Rots and Shane1975).
Simulation of M51 (left panel) showing the present day appearance of the galaxy, the orbit (dashed line) and the position of the perturber (white dot). The pattern speeds of the two spiral arms are shown on the right hand panel, with error bars (dotted lines). The angular velocity of the stars is also shown (red dashed line) and Ω ± κ/2 (blue dashed lines). From Dobbs et al. (Reference Dobbs, Theis, Pringle and Bate2010).

Secondly the arms may be kinematic density waves. Kinematic density waves are not actually waves, in the sense that they don’t propagate through the disc, and have zero group velocity. But gas and stars do flow through the arms, although unlike quasi-stationary density waves, the spiral pattern is not fixed. For purely kinematic density waves, self gravity of the stars can be ignored (kinematic density waves can be induced even when Q = ∞), the stars behaving simply as test particles. The influence of a perturber can be treated by the impulse approximation, and induces elliptical stellar orbits. Such orbits are not generally closed, but we can choose an angular speed such that the orbit is closed. For an m = 2 perturbation, we can choose a rotating frame such that the orbit is closed after half the epicylic frequency (or after each time an arm is encountered) i.e.
 \begin{equation}
\Omega _{\rm p}(R)= \Omega (R)-\frac{1}{2} \thinspace \thinspace \kappa (R),
\end{equation}
\begin{equation}
\Omega _{\rm p}(R)= \Omega (R)-\frac{1}{2} \thinspace \thinspace \kappa (R),
\end{equation}
to a first order approximation (see Binney & Tremaine Reference Binney, Tremaine, Binney and Tremaine2008). If the orbits are aligned along the same major axis, then the perturbation produces a bar. If however, the orbits are offset as a function of radius, then they naturally produce a spiral pattern (Kalnajs Reference Kalnajs1973). Increasing the offset makes the spirals more tightly wound. In the case of a moving (prograde) perturber, the orbits are not aligned, and a trailing spiral pattern develops with a pattern speed given by equation 24 (trailing since Comment 39: $\Omega (R)-\thinspace \thinspace \kappa (R)/2<\Omega$
). The aphelia of the ellipses corresponding to the densest parts (arms) in the disc. Calculations of a perturber passing a galaxy in the non self gravitating case by Oh et al. (Reference Oh, Kim, Lee and Kim2008) demonstrate that the induced arms do indeed exhibit this pattern speed. Thus the pattern speed decreases with radius, but less so than the material arms case. The locations of the spiral arms can also be determined analytically, by applying the impulse approximation to the stellar orbits, and computing the Jacobian matrix from the derivatives the resultant orbit equations (Struck-Marcell Reference Struck-Marcell1990; Donner, Engstrom, & Sundelius Reference Donner, Engstrom and Sundelius1991; Gerber & Lamb Reference Gerber and Lamb1994; Appleton & Struck-Marcell Reference Appleton and Struck-Marcell1996). The surface density of the response to a tidal perturbation is then
$\Omega (R)-\thinspace \thinspace \kappa (R)/2<\Omega$
). The aphelia of the ellipses corresponding to the densest parts (arms) in the disc. Calculations of a perturber passing a galaxy in the non self gravitating case by Oh et al. (Reference Oh, Kim, Lee and Kim2008) demonstrate that the induced arms do indeed exhibit this pattern speed. Thus the pattern speed decreases with radius, but less so than the material arms case. The locations of the spiral arms can also be determined analytically, by applying the impulse approximation to the stellar orbits, and computing the Jacobian matrix from the derivatives the resultant orbit equations (Struck-Marcell Reference Struck-Marcell1990; Donner, Engstrom, & Sundelius Reference Donner, Engstrom and Sundelius1991; Gerber & Lamb Reference Gerber and Lamb1994; Appleton & Struck-Marcell Reference Appleton and Struck-Marcell1996). The surface density of the response to a tidal perturbation is then
 \begin{equation}
\Sigma _0=\Sigma _0 \frac{R_0}{R} |J|^{-1}
\end{equation}
\begin{equation}
\Sigma _0=\Sigma _0 \frac{R_0}{R} |J|^{-1}
\end{equation}
(Gerber & Lamb Reference Gerber and Lamb1994) where R 0 is the original (unperturbed) radius of the (circular) orbit and J is the Jacobian. The points where J = 0 are caustics, and correspond to the locations of the induced arms.
Alternatively the spiral arms may be quasi-stationary density waves. In the self gravitating case, the effect of self gravity is to make the spiral pattern more rigid, increasing Ωp. Swing amplification may also act to enhance the density of the arms still further. However it is not established whether self gravity is sufficient to make the spiral pattern fully self gravitating, and develop into a quasi-stationary density wave. Both Oh et al. (Reference Oh, Kim, Lee and Kim2008), and Dobbs et al. (Reference Dobbs, Theis, Pringle and Bate2010) find that although the pattern speed is higher in their models than given by Equation 27, and decreases less with radius, the arms are not completely rigid and still wind up with time (see Figure 15, right panel). Sundelius et al. (Reference Sundelius, Thomasson, Valtonen and Byrd1987) also find the development of spiral density waves in the absence of swing amplification, whilst Oh et al. (Reference Oh, Kim, Lee and Kim2008), and Dobbs et al. (Reference Dobbs, Theis, Pringle and Bate2010) find swing amplification only has a minor effect. Salo et al. Reference Salo and Laurikainen2000b also find that the pattern speed is radially decreasing and again slightly higher than given by Equation 27, and again generally suppose that swing amplification has only a minor role in generating the arms. They do however find a more constant pattern in the centre kpc or so of their simulation of M51, and suppose that here Lin-Shu-Kalnajs (LSK) waves operate, the lack of an ILR in their simulation meaning waves can penetrate to the centre without being absorbed (in a number of their models, a bar forms in the centre, similar to the actual M51).
Overall the nature of spiral arms in tidally interacting galaxies likely represent the behaviour of the underlying disc. Galaxies with dynamic spiral arms likely do not exhibit fixed spiral patterns when tidally interacting as they are not gravitationally dominated. Galaxies with more massive discs, and likely bars, may well exhibit fixed patterns, at least in the central gravitationally dominated regions.
2.4.3 Prograde and retrograde encounters, and the orbit of the perturber
In addition to the nature of the spiral arms induced, we can also consider how the orbit of the perturber affects the tidal perturbation. The simulations of Toomre & Toomre (Reference Toomre and Toomre1972), and later Howard et al. (Reference Howard, Keel, Byrd and Burkey1993) demonstrated that retrograde encounters have a relatively small effect on a galactic disc, whereas prograde encounters are very effective at producing spiral arms, naturally of a trailing nature. Other analysis showed that tidal interactions could produce a leading spiral pattern, with one predominant leading arm (Kalnajs Reference Kalnajs1971; Athanassoula Reference Athanassoula1978; Thomasson et al. Reference Thomasson, Donner, Sundelius, Byrd, Huang and Valtonen1989). For the prograde case, as discussed earlier with respect to kinematic density waves, the angular speed of the perturber at closest approach during its orbit will likely be nearest to the Inner Lindblad resonance (Ω(R) − κ(R)/2), and hence particularly effective at inducing an m = 2 perturbation. For the retrograde case, the angular speed exhibits the opposite sign, has little correspondence to any resonance (Toomre Reference Toomre1969), but will likely be closest to an m = 1 perturbation (Ωp = Ω(R) − κ(R)) corresponding to one leading (generally κ(R) > Ω(R)) arm (Byrd et al. Reference Byrd, Thomasson, Donner, Sundelius, Huang and Valtonen1989). Leading spiral arms are found to be rare in simulations, requiring a strong perturbation, and a large halo mass (Thomasson et al. Reference Thomasson, Donner, Sundelius, Byrd, Huang and Valtonen1989). The latter is important to prevent swing amplification, which would convert any leading perturbation into a trailing one. Observationally, NGC 4622, a ring galaxy, is the only galaxy found to exhibit leading spiral arms (Buta, Crocker, & Byrd Reference Buta, Crocker and Byrd1992; Buta, Byrd, & Freeman Reference Buta, Byrd and Freeman2003).
Various simulations have also investigated the impact on the galaxy from perturbers of different masses (Byrd & Howard Reference Byrd and Howard1992; Oh et al. Reference Oh, Kim, Lee and Kim2008; Struck, Dobbs, & Hwang Reference Struck, Dobbs and Hwang2011). The simulations find that a perturber typically needs to be at least 0.01 times of the mass of the main galaxy to have an effect, ideally closer to 0.1 times the mass to produce a clear grand design pattern, although naturally there is a degeneracy with the pericenter of the orbit (Oh et al. Reference Oh, Kim, Lee and Kim2008). Toomre & Toomre (Reference Toomre and Toomre1972) showed that a perturbing galaxy has greatest impact when orbiting in the plane of the main galaxy, but changing the angle of inclination of the perturbing galaxy has little qualitative effect.
Another factor determining the dynamics of tidally induced spirals is the number of orbits of the perturber, and thus whether it is bound. For M51, the best matched orbit of M51 and NGC5195 currently involves two orbits of the NGC 5195 around M51, after which the two galaxies merge (Salo & Laurikainen Reference Salo and Laurikainen2000a; Theis & Spinneker Reference Theis and Spinneker2003). Consequently the dynamics are quite chaotic, whilst the orbit induces different sets of spiral arms resulting in noticeable kinks along the spiral arms as observed today (Salo & Laurikainen Reference Salo and Laurikainen2000b; Dobbs et al. Reference Dobbs, Theis, Pringle and Bate2010). The spiral arms consequently show clear departures from logarithmic spirals. Oh et al. (Reference Oh, Kim, Lee and Kim2008), and Struck et al. (Reference Struck, Dobbs and Hwang2011) present simulations where a perturber is on an unbound orbit, and passes the galaxy only once. In this case, the dynamics are less chaotic, and the arms smoother.
2.4.4 Longevity of tidally-induced spirals
If m = 2 spirals are difficult to produce except by tidal interactions or bars, as we conclude from Section 2.1.5, their lifetime is an important characteristic. Grand design m = 2 spirals are common, hence tidal interactions must induce relatively long-lived spiral arms if they are the main source of such galaxies.
Assuming their pattern speed is not fixed, tidal arms are expected to have a pattern that winds up slower than local transient arms discussed in the previous section, but to be shorter lived than quasi-stationary spiral arms. For tidally induced spiral arms, there are two main questions regarding how long they last. The first is how much they wind up over time, the second is how long the arms take to decay or damp. To think about the first issue, we can consider the pitch angle of the arms, defined as the angle between the tangent of the spiral arm and a circle, i.e.
 \begin{equation}
\tan \alpha = \frac{1}{R}\frac{dR}{d\phi },
\end{equation}
\begin{equation}
\tan \alpha = \frac{1}{R}\frac{dR}{d\phi },
\end{equation}
where the derivation is evaluated along the spiral arm. If we consider the change in ϕ at a later time as ϕ(R, t) = ϕ0 + Ωp(R)t then the pitch angle can be written as:
 \begin{equation}
\cot \alpha = \left| R\, t\, \frac{d\Omega _{\rm p}}{dR} \right|
\end{equation}
\begin{equation}
\cot \alpha = \left| R\, t\, \frac{d\Omega _{\rm p}}{dR} \right|
\end{equation}
(Binney & Tremaine Reference Binney, Tremaine, Binney and Tremaine2008). For material arms, Ωp = Ω and for a flat rotation curve of vc = 200 km s− 1, the pitch angle will be ~ 1° after about 1 Gyr. This is considerably lower than observed pitch angles. For material arms, the pattern winds up on a timescale of order t ~ |dR/(RdΩ)| = 1/|dΩ/dln R|, in the above example ≲ 100 Myr.
For kinematic tidal arms, in the absence of self gravity, Ωp(R) = Ω(R) − κ(R)/2 (Section 2.4.1), and so |dΩp/dln R| ≪ |dΩ/dln R|. Hence the spiral pattern is expected to last somewhat longer. In the presence of self gravity, Ωp versus R can become even shallower. For example, if we take Figure 15 (right panel), in 1 Gyr, the pattern winds up at a rate ~ 4 times slower than the above example for material arms, and is expected to have a pitch angle of 5 or 6° after 1 Gyr. These values are, as would be predicted, at the lower end of observed values (Seigar & James Reference Seigar and James1998; Seigar et al. Reference Seigar, Bullock, Barth and Ho2006).
Simulations of tidally induced spiral arms confirm this behaviour, with the pattern winding up and simultaneously decaying on a timescale of ~ 1 Gyr (Oh et al. Reference Oh, Kim, Lee and Kim2008; Struck et al. Reference Struck, Dobbs and Hwang2011). Similar to the case of dynamic spiral arms (Section 2.2), Struck et al. (Reference Struck, Dobbs and Hwang2011) also found that the arms persisted for longer with higher resolution simulations. Struck et al. (Reference Struck, Dobbs and Hwang2011) also supposed that galaxy encounters in groups and clusters are likely frequent, and with spiral arms persisting for ~ 1 Gyr, tidally induced spiral galaxies common.
2.5 Stochastic star formation
The idea of the generation of spiral arms by stochastic self-propagating star formation (SSPSF) was developed principally by Mueller & Arnett (Reference Mueller and Arnett1976), and Gerola & Seiden (Reference Gerola and Seiden1978). Each generation of star formation is presumed to trigger new star formation in neighbouring regions, by the production of shocks from supernovae winds. Then, due to differential rotation, the newly formed stars are sheared into material spiral arms. Like the picture of Goldreich & Lynden-Bell (Reference Goldreich and Lynden-Bell1965a), the spiral arms are new stars, but in their case the spiral arms were associated with gravitational instabilities in the gas, rather than supernovae. This mechanism is not supposed to account for grand design galaxies, but tends to produce flocculent spiral arms (Gerola & Seiden Reference Gerola and Seiden1978; Jungwiert & Palous Reference Jungwiert and Palous1994; Sleath & Alexander Reference Sleath and Alexander1995). Spiral arms are not long-lived in this model, rather they are continually created and destroyed.
The conclusion of these studies is that SSPSF is a secondary effect, rather than a primary means of generating spiral arms. In general, stellar discs in observed galaxies are not smooth, spiral structure is seen in the old stellar population, which is much amplified by the response of the gas. In fact, Mueller & Arnett (Reference Mueller and Arnett1976) concluded that stochastic star formation would not produce global spiral structure, but rather in conjunction with other mechanisms, such as density waves, would add an irregular structure to the galaxy. For example supernovae and triggered star formation are likely to help produce much wider spiral arms in tracers such as HI, CO and Hα than expected from the gas response to a spiral shock. In the absence of feedback, the width of spiral arms is too narrow compared to observations (Douglas et al. Reference Douglas, Acreman, Dobbs and Brunt2010).
Local regions of likely SSPSF have been observed mostly in the LMC (Westerlund & Mathewson Reference Westerlund and Mathewson1966; Feitzinger et al. Reference Feitzinger, Glassgold, Gerola and Seiden1981; Dopita, Mathewson, & Ford Reference Dopita, Mathewson and Ford1985; Kamaya Reference Kamaya1998). In particular SSPSF seems most successful in irregular galaxies (Hunter & Gallagher Reference Hunter and Gallagher, III1985; McCray & Kafatos Reference McCray and Kafatos1987; Nomura & Kamaya Reference Nomura and Kamaya2001), which are not dominated by rotation, or other mechanisms for producing spiral structure. Direct triggering of molecular cloud formation by supernovae has been suggested observationally, for higher latitude regions in the Milky Way (Dawson et al. Reference Dawson, McClure-Griffiths, Kawamura, Mizuno, Onishi, Mizuno and Fukui2011), and in the LMC (Dawson et al. Reference Dawson, McClure-Griffiths, Wong, Dickey, Hughes, Fukui and Kawamura2013). However there is little evidence that SSPSF is a global driver of spiral arms. After the 1980s interest in SSPSF appears to have waned. It is now feasible to perform hydrodynamical models of galaxies, including stellar feedback. These seem to indicate that instabilities and collisions dominate star formation in spiral galaxies, unless the level of feedback is unrealistically high (Dobbs, Burkert, & Pringle Reference Dobbs, Burkert and Pringle2011).
2.6 Exotic mechanisms
An alternative means of generating spiral arms, aside form gravitational instabilities in the stellar disc or tidal interactions with visible perturbers, is from asymmetries in the dark matter distribution. This may take the form of gravitational instabilities induced by asymmetries in the dark matter profiles of galaxies (Khoperskov et al. Reference Khoperskov, Khoperskov, Zasov, Bizyaev and Khrapov2013), or tidal perturbations from dark matter sub halos (Tutukov & Fedorova Reference Tutukov and Fedorova2006; Dubinski et al. Reference Dubinski, Gauthier, Widrow, Nickerson, Funes and Corsini2008; Kazantzidis et al. Reference Kazantzidis, Bullock, Zentner, Kravtsov and Moustakas2008; Chang & Chakrabarti Reference Chang and Chakrabarti2011). For the latter case, although the masses of the sub halos are assumed to be small ( ~ 106 M⊙), they are extremely close to, if not passing through the galactic disc during their orbits. Cosmological simulations predict a multitude of sub halos, albeit with a greater frequency than observed. The effect of dark matter sub halos is thus at present entirely speculative. Simulations predict that the impact of such halos should be detectable (Dubinski et al. Reference Dubinski, Gauthier, Widrow, Nickerson, Funes and Corsini2008; Chang & Chakrabarti Reference Chang and Chakrabarti2011), but whether such effects are distinguishable from other perturbations (e.g. non-dark matter perturbers, previous low mass mergers, bar instability, gravitational instabilities) is an open question.
3 BEHAVIOUR OF GAS IN SPIRAL GALAXIES
So far we have only considered the response of the stars in galactic discs, but the response of the gas is important for considering spiral structure. The velocity dispersion in the gas is less than that of the stars, so the gas response to any perturbations in the stellar disc is highly amplified. Thus even small overdensities in the stars can result in clear spiral arms in the gas (for example see the IR maps in Elmegreen (Reference Elmegreen2011) compared to optical images). And furthermore as the gas forms young stars, in the optical we are dominated by the spiral pattern in the gas not the stars. Therefore processes in the gas, and star formation, will have shaped the spiral patterns that we observe.
3.1 Stability of a star and gas disc
As described in Section 2.1, gas or stars in a disc are expected to undergo local axisymmetric gravitational instabilities according to the criteria in Equations 7 and 10. For a disc of stars and gas, local, transient instabilities in the stars are expected to be coupled by a similar response in the gas. Similar to the dispersion relations and stability criteria derived for gas and stars separately, we can also derive similar expressions for a disc of gas and stars. We note that, like in Section 2.1, the derivations here assume the tight winding approximation.
Jog & Solomon (Reference Jog and Solomon1984) first tackled the problem of a galactic disc of stars and gas, by treating the disc as a two-fluid system. They derived the following dispersion relation
 \begin{eqnarray}
\eqcellsep\eqcellsep (\omega ^2-\kappa ^2-k^2 c_s^2+2 \pi G k \Sigma _{s0}) \nonumber\\
\eqcellsep\eqcellsep\quad \times (\omega ^2-\kappa ^2-k^2 c_g^2+2 \pi G k \Sigma _{g0}) \nonumber\\
\eqcellsep\eqcellsep\quad -\,(2\pi Gk \Sigma _{s0})(2\pi Gk \Sigma _{g0})=0
\end{eqnarray}
\begin{eqnarray}
\eqcellsep\eqcellsep (\omega ^2-\kappa ^2-k^2 c_s^2+2 \pi G k \Sigma _{s0}) \nonumber\\
\eqcellsep\eqcellsep\quad \times (\omega ^2-\kappa ^2-k^2 c_g^2+2 \pi G k \Sigma _{g0}) \nonumber\\
\eqcellsep\eqcellsep\quad -\,(2\pi Gk \Sigma _{s0})(2\pi Gk \Sigma _{g0})=0
\end{eqnarray}
where cs and cg are the velocity dispersion of the stars and gas respectively, and Σ s0 and Σ g0 are the surface densities of the stars and gas respectively. Thus the stars and gas are treated as co-existing fluids with different surface densities and velocity dispersions. They also determined a local stability criterion.
Bertin & Romeo (Reference Bertin and Romeo1988) then determined a global stability criteria for a two-fluid disc. They defined a marginal stability curve given by
 \begin{eqnarray}
Q_H^2\eqcellsep =\eqcellsep\frac{2 \lambda }{\beta } [(\alpha +\beta )-\lambda (1+\beta )\nonumber\\
\eqcellsep\eqcellsep+ \sqrt{\lambda ^2(1-\beta )^2-2 \lambda (1-\beta )(\alpha -\beta )+(\alpha +\beta )^2}] \quad
\end{eqnarray}
\begin{eqnarray}
Q_H^2\eqcellsep =\eqcellsep\frac{2 \lambda }{\beta } [(\alpha +\beta )-\lambda (1+\beta )\nonumber\\
\eqcellsep\eqcellsep+ \sqrt{\lambda ^2(1-\beta )^2-2 \lambda (1-\beta )(\alpha -\beta )+(\alpha +\beta )^2}] \quad
\end{eqnarray}
where $\lambda =\frac{k_g}{|k|}$
, α = ρ
c
/ρ
h
and β = σ2
c
/σ
h
2, where ρ is density, σ is the radial dispersion, and subscripts c and h represent cold and hot components. Potentially, QH
can exhibit two peaks, one arising from instability in the gas (at smaller wavelengths), and one from the stars (see Figure 3 of Bertin & Romeo Reference Bertin and Romeo1988). Stability globally at all wavelengths then requires that Q
2, where Q corresponds to the standard criterion (Equation 7) for the hot component, is greater than the maximum of Q
2
H
.
$\lambda =\frac{k_g}{|k|}$
, α = ρ
c
/ρ
h
and β = σ2
c
/σ
h
2, where ρ is density, σ is the radial dispersion, and subscripts c and h represent cold and hot components. Potentially, QH
can exhibit two peaks, one arising from instability in the gas (at smaller wavelengths), and one from the stars (see Figure 3 of Bertin & Romeo Reference Bertin and Romeo1988). Stability globally at all wavelengths then requires that Q
2, where Q corresponds to the standard criterion (Equation 7) for the hot component, is greater than the maximum of Q
2
H
.
Rafikov (Reference Rafikov2001) derived the dispersion relation for a disc with a fluid, and a collisionless component (see also Romeo Reference Romeo1992):
 \begin{equation}
2\pi G k \frac{\Sigma _{g0}}{\kappa ^2+k^2c_g^2-\omega ^2}+2\pi G k \frac{\Sigma _{s0}\mathcal {F}}{\kappa ^2-\omega ^2}=1
\end{equation}
\begin{equation}
2\pi G k \frac{\Sigma _{g0}}{\kappa ^2+k^2c_g^2-\omega ^2}+2\pi G k \frac{\Sigma _{s0}\mathcal {F}}{\kappa ^2-\omega ^2}=1
\end{equation}
where $\mathcal {F}$
is defined as for Equation 9. Then, for the disc to be stable (requiring ω2(k) > 0 for all k), he derived the criterion
$\mathcal {F}$
is defined as for Equation 9. Then, for the disc to be stable (requiring ω2(k) > 0 for all k), he derived the criterion
 \begin{equation}
\frac{1}{Q_{sg}}=\frac{2}{Q_s}\frac{1}{q}\left[1-e^{-q^2}I_0(q^2))\right] + \frac{2}{Q_g}R\frac{q}{1+q^2R^2}>1
\end{equation}
\begin{equation}
\frac{1}{Q_{sg}}=\frac{2}{Q_s}\frac{1}{q}\left[1-e^{-q^2}I_0(q^2))\right] + \frac{2}{Q_g}R\frac{q}{1+q^2R^2}>1
\end{equation}
where
 \begin{eqnarray*}
Q_s\eqcellsep =\eqcellsep\frac{\kappa \sigma _s}{\pi G \Sigma _{s0}}, \qquad Q_g=\frac{\kappa c_g}{\pi G \Sigma _{g0}}, \\
q\eqcellsep =\eqcellsep k\sigma _s/\kappa , \quad \rm {and} \quad R=c_g/\sigma _s.
\end{eqnarray*}
\begin{eqnarray*}
Q_s\eqcellsep =\eqcellsep\frac{\kappa \sigma _s}{\pi G \Sigma _{s0}}, \qquad Q_g=\frac{\kappa c_g}{\pi G \Sigma _{g0}}, \\
q\eqcellsep =\eqcellsep k\sigma _s/\kappa , \quad \rm {and} \quad R=c_g/\sigma _s.
\end{eqnarray*}
Note that Qg is not the same as shown earlier for Equation 7, and this is again a criterion for local instabilities. Wang & Silk (Reference Wang and Silk1994) also present a simplified approximate stability criterion, (Q − 1 s + Qg − 1)− 1, with Qs and Qg defined as above.
These equations still do not represent a multiphase medium, and are for a thin disc. Some authors have tried to incorporate a more realistic ISM (Romeo, Burkert, & Agertz Reference Romeo, Burkert and Agertz2010; Romeo & Wiegert Reference Romeo and Wiegert2011; Romeo & Falstad Reference Romeo and Falstad2013), but we do not consider these further here. One of the main results arising from these criteria though is that small changes in the gas can change the stability of the disc significantly, compared to relatively large changes in the stellar component (Jog & Solomon Reference Jog and Solomon1984; Rafikov Reference Rafikov2001).
Following these derivations, Li, Mac Low, & Klessen (Reference Li, Mac Low and Klessen2005) investigated the stability criterion of Rafikov (Reference Rafikov2001) using numerical simulations of an isothermal disc. They found gravitational collapse when Qsg < 1.6, and vigorous star formation when Qsg < 1. With a multiphase medium, gravitational collapse will always occur in a disc of stars and gas with realistic surface densities. Many such simulations have shown the development of dynamic spiral arms simultaneously in the gas and stars, and the formation of molecular clouds and star formation within them (e.g. Robertson & Kravtsov Reference Robertson and Kravtsov2008; Hopkins, Quataert, & Murray Reference Hopkins, Quataert and Murray2011; Wada et al. Reference Wada, Baba and Saitoh2011).
3.2 Damping of spiral arms
Large-scale shocks (namely spiral shocks or galactic shocks) are predicted in the gas as the result of spiral density waves (see Section 3.5), or even generic turbulence in the spiral arms, so they are naturally expected to lead to energy dissipation.
By computing the energy change across the shock, and momentum conservation, Kalnajs (Reference Kalnajs1972) showed that the rate of change of energy density of tightly winding quasi-stationary spiral density waves is
 \begin{equation}
\dot{E_w}=\frac{\Omega _{\rm p}}{\Omega -\Omega _{\rm p}} \dot{E_s}
\end{equation}
\begin{equation}
\dot{E_w}=\frac{\Omega _{\rm p}}{\Omega -\Omega _{\rm p}} \dot{E_s}
\end{equation}
(see also Binney & Tremaine Reference Binney, Tremaine, Binney and Tremaine2008), where $\dot{E_s}$
is the energy dissipation in the shock and
$\dot{E_s}$
is the energy dissipation in the shock and $\dot{E_w}$
is the energy change in the density wave. The energy dissipation,
$\dot{E_w}$
is the energy change in the density wave. The energy dissipation, $\dot{E_s}$
is negative, hence Ew
increases when Ωp < Ω (i.e., R < R
CR) and decreases when Ωp > Ω (i.e., R > R
CR). By noting that Ew
is negative in the first case, and positive in the second case (Binney & Tremaine Reference Binney, Tremaine, Binney and Tremaine2008), it is evident that the induced shock always damps the density wave (Kalnajs Reference Kalnajs1972). The damping timescale,
$\dot{E_s}$
is negative, hence Ew
increases when Ωp < Ω (i.e., R < R
CR) and decreases when Ωp > Ω (i.e., R > R
CR). By noting that Ew
is negative in the first case, and positive in the second case (Binney & Tremaine Reference Binney, Tremaine, Binney and Tremaine2008), it is evident that the induced shock always damps the density wave (Kalnajs Reference Kalnajs1972). The damping timescale, $-E_w/\dot{E_w}$
, is estimated to be between ~ 108 − 109 yrs depending on the calculation of the energy terms, and the nature of the shock (Kalnajs Reference Kalnajs1972; Roberts & Shu Reference Roberts and Shu1972; Toomre Reference Toomre1977). Another basic consequence of damping is that in the case of quasi-stationary spiral density waves, the streamlines predicted to describe the gas trajectories (Roberts Reference Roberts1969, see Section 3.5) will not be closed (Kalnajs Reference Kalnajs1972).
$-E_w/\dot{E_w}$
, is estimated to be between ~ 108 − 109 yrs depending on the calculation of the energy terms, and the nature of the shock (Kalnajs Reference Kalnajs1972; Roberts & Shu Reference Roberts and Shu1972; Toomre Reference Toomre1977). Another basic consequence of damping is that in the case of quasi-stationary spiral density waves, the streamlines predicted to describe the gas trajectories (Roberts Reference Roberts1969, see Section 3.5) will not be closed (Kalnajs Reference Kalnajs1972).
Following this result, a model of self regulated spiral structure was put forward by Bertin & Romeo (Reference Bertin and Romeo1988), also following discussion in Roberts & Shu (Reference Roberts and Shu1972). Spiral perturbations in the disc are predicted to grow with time (see Section 2.1.4). Hence Bertin & Romeo (Reference Bertin and Romeo1988) proposed that gas damps the spiral perturbations, which are then regenerated on timescales comparable to the damping timescale. They point out that in the absence of gas, the stars would instead continue to heat until the disc becomes stable to spiral perturbations (Lin & Bertin Reference Lin, Bertin, van Woerden, Allen and Burton1985).
For dynamic spirals, damping was also thought to be important. As mentioned in Section 2.2, early simulations (e.g. Sellwood & Carlberg Reference Sellwood and Carlberg1984) found that stellar discs heated up with time, as supposed in the previous paragraph, and consequently the spiral arms disappear after several galactic rotations. Furthermore, galaxies which have little gas did not appear to have any spiral structure, suggesting that gas damping is always a requisite for spiral structure (Binney & Tremaine Reference Binney, Tremaine, Binney and Tremaine2008). However, Fujii et al. (Reference Fujii, Baba, Saitoh, Makino, Kokubo and Wada2011) and D’Onghia et al. (Reference D’Onghia, Vogelsberger and Hernquist2013) showed that spiral arms were able to survive much longer (see Section 2.2). Fujii et al. (Reference Fujii, Baba, Saitoh, Makino, Kokubo and Wada2011) demonstrated that stellar heating was too high in previous lower resolution calculations, partly due to two-body effectsFootnote 9 . Thus they showed that it was possible for galaxies to exhibit stellar spiral arms in the absence of gas. Indeed such galaxies, with spiral arms but no recent star formation or large gas reservoir, are now observed (Masters et al. Reference Masters, Mosleh and Romer2010).
3.3 Physical processes in the ISM
The gas in galaxies is subject to many processes other than spiral shocks, including cloud-cloud collisions, hydrodynamic instabilities (see also Section 3.5.2) and stellar feedback, as well as gas self gravity, thermodynamics and magnetic fields. Even in a purely smooth stellar disc, these processes still lead to a considerable degree of substructure in the gas, if not long spiral arms (e.g. Shetty & Ostriker Reference Shetty and Ostriker2006; Tasker & Tan Reference Tasker and Tan2009; Dobbs et al. Reference Dobbs, Burkert and Pringle2011). In the presence of spiral arms, these processes will still clearly occur, often preferentially in, or modified by the spiral arms.
The quasi-periodic spacing of gas structures along spiral arms observed in some galaxies has long been supposed associated with a gravitational origin of Giant Molecular Clouds (GMCs) or Associations (GMAs) (Shu et al. Reference Shu, Milione, Gebel, Yuan, Goldsmith and Roberts1972; Woodward Reference Woodward1976; Elmegreen Reference Elmegreen1979; Cowie Reference Cowie1981; Elmegreen & Elmegreen Reference Elmegreen and Elmegreen1983b; Balbus & Cowie Reference Balbus and Cowie1985; Kim, Ostriker, & Stone Reference Kim, Ostriker and Stone2002; Shetty & Ostriker Reference Shetty and Ostriker2006). The dispersion relation for a gas disc, Equation 4 is often used to derive expressions for the expected mass and spacing of GMCs along a spiral arm. If we consider the gas which collapses on the shortest timescale, this occurs when dω/dk = 0, at a wavenumber k = πGΣ g0/c 2 s . The corresponding wavelength is then
 \begin{equation}
\lambda _{\rm max}=\frac{2c_s^2}{G \Sigma _{g0}}.
\end{equation}
\begin{equation}
\lambda _{\rm max}=\frac{2c_s^2}{G \Sigma _{g0}}.
\end{equation}
This is the predicted separation of the clouds. The mass of the clouds is then
 \begin{equation}
M=\Sigma _{g0} \left(\frac{\lambda _{\rm max}}{2}\right)^2=\frac{c_s^4}{G^2\Sigma _{g0}}.
\end{equation}
\begin{equation}
M=\Sigma _{g0} \left(\frac{\lambda _{\rm max}}{2}\right)^2=\frac{c_s^4}{G^2\Sigma _{g0}}.
\end{equation}
The spiral arms provide a denser environment, which can make the gas susceptible to instabilities at wavelengths where it would not be unstable in the absence of spiral arms. Also, as Σ g0 increases, and cs likely decreases in the spiral arms, the properties of the GMCs change (though technically Equation 6, should be applied over large scales rather than localised to a spiral arm).
Whilst the dispersion relation adopts a number of caveats, e.g. a thin disc, these masses and spacings have been shown to approximately agree with simple numerical simulations of a gravitationally unstable isothermal medium (Kim et al. Reference Kim, Ostriker and Stone2002; Shetty & Ostriker Reference Shetty and Ostriker2006; Dobbs Reference Dobbs2008). These calculations ignored the multiphase nature of the ISM (though see Elmegreen Reference Elmegreen1989), which with the inclusion of thermal instability and turbulence, may lead the thermal term to actually promote rather than prevent instability (Elmegreen Reference Elmegreen2011). In a medium of clouds and diffuse gas, self gravity can also act to increase cloud collisions (Kwan & Valdes Reference Kwan and Valdes1987) which would not necessarily lead to the same masses and separations as Equations 36 and 37. Finally these estimates of the mass and separation generally require that the maximum cloud mass is reached before feedback disrupts the cloud, or the cloud moves out of the spiral arms (see also Elmegreen Reference Elmegreen1994, Reference Elmegreen, Ferrara, McKee, Heiles and Shapiro1995).
Cloud collisions occur regardless of spiral arms due to the random dispersion of the clouds, but are much more frequent in the spiral arms. As will be discussed in Section 3.5.2, dissipative collisions of either smaller molecular clouds or cold HI can lead to the formation of more massive GMCs. Structure is always present in the ISM, so gas entering the spiral arms will exhibit some structure (though the gas need not be molecular). Even for a homogenous warm medium, rapid cooling in the spiral shock quickly leads to thermal instabilities and the formation of structure (Dobbs et al. Reference Dobbs, Glover, Clark and Klessen2008; Bonnell, Dobbs, & Smith Reference Bonnell, Dobbs and Smith2013). Like gravitational instabilities, cloud collisions in the spiral arm induce a spacing between GMCs. In this case, the spacing predominantly depends on the strength of the shock the gas encounters, which in turn depends on the spiral forcing or amplitude and the sound speed. The separation of GMCs is proportional to the epicyclic radius, which represents the radii of the disc over which material can be brought together to a single point, or into a single cloud (Dobbs Reference Dobbs2008). Stronger shocks produce more massive, widely spaced clouds. In this sense the behaviour is opposite to gravitational instabilities.
Parker instabilities have also been proposed to form GMCs in spiral arms (Mouschovias, Shu, & Woodward Reference Mouschovias, Shu and Woodward1974; Mouschovias, Kunz, & Christie Reference Mouschovias, Kunz and Christie2009; Elmegreen Reference Elmegreen1982) and shown to produce density enhancements of factors of several, which may be sufficient to induce a phase change in the ISM. Density enhancements solely due to Parker instabilities are finite, and thus likely to be overwhelmed by gravitational instabilities (Elmegreen Reference Elmegreen1982; Kim, Ryu, & Jones Reference Kim, Ryu and Jones2001; Santillán et al. Reference Santillán, Kim, Franco, Seung and Ryu2000; Kim et al. Reference Kim, Ostriker and Stone2002). However there is some evidence of loops caused by Parker instabilities in the Galactic Centre, where magnetic fields are strong (Fukui et al. Reference Fukui, Yamamoto and Fujishita2006).
All these processes lead to considerable substructure in the gas on size scales up to the most massive GMCs. Either fragmentation (via gravitational instabilities) or agglomeration of clouds leads to a mass spectrum from masses of < 100 M⊙ up to giant molecular associations of 107 − 8 M⊙. In the case that Ωp < Ω (i.e., R < R CR), complexes formed by all these methods leave the arms and are sheared out into trailing spurs (see next section) by differential rotation.
As well as processes which lead to the accumulation of gas into clouds, stellar feedback also has a substantial effect on the gas. Although spiral shocks may account for the very narrow dust lanes in galaxies, the width of the shocked region, both from Shu et al. (Reference Shu, Milione, Gebel, Yuan, Goldsmith and Roberts1972) and simulations (e.g. Wada & Koda Reference Wada and Koda2004; Dobbs & Bonnell Reference Dobbs and Bonnell2006; Shetty & Ostriker Reference Shetty and Ostriker2006) is very narrow compared to the width of CO arms in nearby galaxies. Comparing with the Canadian Galactic Plane Survey (CGPS)), Douglas et al. (Reference Douglas, Acreman, Dobbs and Brunt2010) found that HI velocity longitude maps from simulations without feedback produced too narrow spiral arms compared to the Milky Way. Stellar feedback also produces bubbles and holes in the ISM. Dobbs et al. (Reference Dobbs, Burkert and Pringle2011), and also Shetty & Ostriker (Reference Shetty and Ostriker2008), showed that with large amounts of feedback, it is possible to largely erase the pattern of the original imposed stellar spiral potential. Thus the substructure associated with that of the stellar feedback becomes comparable to the imposed spiral pattern (similar to the stochastic star formation scenario, Section 2.5).
3.4 Substructure along spiral arms
Substructure reflects both giant molecular clouds, as well as branches, spurs and feathers which extend at clear angles away from the (typically) trailing side of the arm (see Figure 16). Branches, spurs and feathers are observed in many spiral galaxies, and occur in numerical simulations. As we will see, the formation of these features is different for the different spiral arm models.
A section along the southern spiral arm of M51, from the Hubble Heritage image. Gas flow is predominantly left to right in the figure. The spiral arm spans the figure, with 2 massive complexes along the dust lanes of the spiral arms, containing HII regions, suggesting that star formation occurs very quickly once clouds form. Below the spiral arm, are narrow lanes of gas and dust, also connected with HII regions. We term these features spurs in this paper. Some spurs extend to the next spiral arm. Bridges, which would be more associated with a bifurcation in the arms, are not particularly evident in M51. The figure is taken from Elmegreen (Reference Elmegreen2007) and is originally form a Hubble Heritage image, and is reproduced with permission from AAS ©.

There are no formal definitions of branches, spurs and feathers. Spurs and feathers in particular have multiple meanings in the literature. Branches generally describe long structures which may go from one arm to another, and/or where one arm bifurcates into two. Consequently it may not be clear in an observed galaxy whether a feature is actually a branch or a spiral arm (including the Local Arm, Carraro Reference Carraro2013). Spurs and feathers tend to be shorter features, and often describe quasi-periodic rather than isolated features. In their observational study, La Vigne, Vogel, & Ostriker (Reference La Vigne, Vogel and Ostriker2006) used feathers to refer to dust lanes which extend between spiral arms, and spurs to describe strings of star formation in the inter arm regions. However these ‘feathers’ typically harbour the regions of star formation or young stars, so theoretically there is no clear need to distinguish between these two types of feature. Chakrabarti, Laughlin, & Shu (Reference Chakrabarti, Laughlin and Shu2003) use an alternative notation, whereby spurs are leading features and feathers trailing. Although they found both in numerical simulations, it is not clear observationally whether such leading features are seen in actual spiral galaxies. Finally Dobbs & Bonnell (Reference Dobbs and Bonnell2006) referred to spurs as any relatively short (i.e. less than one inter arm passage), narrow trailing features seen in the gas, the definition we adopt here.
3.5 Quasi-stationary density waves
The response of gas to spiral arms has been considered most in the context of quasi-stationary spiral density waves, where, in the case of a simple sinusoidal stellar potential, an analytic solution for the response of the gas can be obtained. Motivated by the suggestion that narrow dust features seen in external galaxies might be due to shocks, Fujimoto (Reference Fujimoto1968) first examined the response of gas to a spiral potential. He confirmed that the gas would indeed be likely to undergo a shock. Roberts (Reference Roberts1969) extended this analysis and, with a small correction to the work of Fujimoto (Reference Fujimoto1968), obtained four equations which can be solved to obtain the velocities, spatial coordinates and density of a parcel of gas as it moves round the disc (i.e. along a streamline). These equations demonstrate that the properties of the shock, and indeed whether there is a shock, depend on the amplitude of the spiral potential (F), the sound speed and/or the turbulent velocity of the gas, σ g , the pitch angle and location in the disc. For example, for warm gas and moderate forcing, a narrow shock is expected ahead of the minimum of the potential (Figure 17). If the gas is cold however, a very narrow shock is expected after the minimum of the potential. Magnetic fields are not found to greatly affect the solution, the shock is merely weaker in the magnetic case (Roberts & Yuan Reference Roberts and Yuan1970).
Illustration of a typical shock solution for the gas response to a steady spiral density wave, from Roberts (Reference Roberts1969). Gas flows from left to right. The figure shows density (top), velocity perpendicular to the spiral arms (second), velocity parallel to the spiral arms (third), and the potential (last), versus the azimuthal angle around the galaxy. Figure reproduced with permission from AAS ©.

Another interpretation of spiral shocks was put forward by Kalnajs, and shown in Toomre (Reference Toomre1977). Here the spiral forcing is considered analogous to a series of pendulums. The pendulums are assumed to oscillate like harmonic oscillators and bunch up periodically at certain intervals. The bunching up of the pendulums is analogous to parcels or clouds of gas crowding together at the spiral arms. Toomre (Reference Toomre1977) supposed that gas clouds pile up at the locations of the spiral arms, a little like a traffic jam. A simple calculation of test particles in a spiral potential obeys this behaviour. In the case of spiral density waves with gas pressure, Shu, Milione, & Roberts (1973) found that for cs = 8 km s− 1, the forcing required to produce a shock is around a few %.
Shu et al. (Reference Shu, Milione, Gebel, Yuan, Goldsmith and Roberts1972) also investigated the dynamics of spiral shocks in the context of cloud collisions. They assumed a steady state solution and solved the jump conditions at the shock, in order to study the resultant shock structure for a two phase medium, consisting of cold clouds of a given filling fraction surrounded by warm intercloud medium. The different phases exhibit different density enhancements (of around 10 and 40), as expected, and they were able estimate a width of the shocked region of 50 pc, essentially the length scale after which the medium re-asserts an equilibrium state. Processes such as cloud collisions, and supposed gravitational fragmentation, led the authors to suppose a dynamic, rather than quasi-stationary shock scenario. Furthermore clouds will have dispersions relative to each other, and enter the spiral arms at different locations, and velocities.
Since the 1960s and 1970s, there have been many studies that have underlined the complex response of gas to spiral density waves, and departures from the Roberts (Reference Roberts1969) picture. The gas structure along the arms arises through (i) resonances, (ii) instability of the spiral shock, and, (iii) additional physical processes such as self gravity, cloud collisions etc. which were discussed in Section 3.3. Resonances are intrinsic to the underlying stellar potential, although they can be enhanced by self gravity in the gas. Processes included in (ii) and (iii) depend on the properties of the gas. But essentially all induce the formation of secondary, or substructure within the gaseous spiral arms.
3.5.1 Resonances
Resonances are one means to generate gaseous substructure along spiral arms, specifically for the case of quasi-stationary density waves. Resonances occur when the epicyclic frequency, κ of the stellar orbits are some integer multiple of the angular frequency in the rotating frame of the spiral potential, or vice versa, thus
 \begin{equation}
m(\Omega -\Omega _{\rm p})= \pm \frac{\kappa }{n}
\end{equation}
\begin{equation}
m(\Omega -\Omega _{\rm p})= \pm \frac{\kappa }{n}
\end{equation}
where Ωp is the pattern speed of the spiral, and m is the number of spiral arms in the stellar disc. In this case stars perform n radial oscillations every encounter with the m-armed spiral pattern. Determining the presence and location of resonances in the disc implicitly assumes that the pattern speed, Ωp, does not vary with radius or time. In the vicinity of resonances, the behaviour of stellar and or gas orbits are abruptly altered and become nonlinear (e.g. Contopoulos & Grosbol Reference Contopoulos and Grosbol1986, Reference Contopoulos and Grosbol1988). The primary resonances at the ILR and OLR (n = 1) are, as discussed in Section 2.1.2, associated with the boundary of where the spiral density waves exist. Thus we are predominantly interested in resonances within these radii. Shu et al. (Reference Shu, Milione and Roberts1973) supposed that the gas would be expected to experience perturbations due to resonances, and showed analytically that gas undergoes a secondary compression to a spiral potential at the ultraharmonic resonance (n = 2) Footnote 10 . Woodward (Reference Woodward1975) demonstrated the nonlinear response of gas at the location of the ultraharmonic resonance with 1D calculations, and there have since been many further 2D and 3D (Smoothed Particle Hydrodynamics (SPH) and grid code) calculations (Bertin Reference Bertin1993; Patsis et al. Reference Patsis, Hiotelis, Contopoulos and Grosbol1994; Patsis, Grosbol, & Hiotelis Reference Patsis, Grosbol and Hiotelis1997; Chakrabarti et al. Reference Chakrabarti, Laughlin and Shu2003). In particular Patsis et al. (Reference Patsis, Hiotelis, Contopoulos and Grosbol1994) showed the bifurcation of the spiral arms at the 4:1 resonance (as also predicted by Artymowicz & Lubow Reference Artymowicz and Lubow1992), provided there is a spiral forcing of F ≳ 5 %.
Chakrabarti et al. (Reference Chakrabarti, Laughlin and Shu2003) showed the development of more varied features, including branches (bifurcations) and shorter leading and trailing features (spurs / feathers), again occurring primarily near the 4:1 resonance, with the morphology of the feature dependent primarily on the level of forcing of the spiral potential. Chakrabarti et al. (Reference Chakrabarti, Laughlin and Shu2003) suppose that flocculence in spiral galaxies could be due largely to such resonant features, an idea recently followed up by Lee & Shu (Reference Lee and Shu2012), where they investigate the possibility that higher order resonances lead to the formation of multiple spurs along the arms. There is a notable difference between the work of Lee & Shu (Reference Lee and Shu2012), and GMC formation by gravitational instabilities in the gas or cloud-cloud collisions (which are subsequently sheared into spurs). For the former, the location of the spurs does not change over time, the GMCs always forming and dispersing in the same place in the spiral arms (seemingly less likely in a dynamic environment). For other GMC formation mechanisms there is no expectation that clouds form in the same place.
3.5.2 Stability and structure of the shock
Even in the non-magnetic, non self gravitating regime, several authors have questioned the stability of spiral shocks. From analytical work, Mishurov & Suchkov (Reference Mishurov and Suchkov1975) first proposed that the flow through a spiral shock could be unstable. In contrast Nelson & Matsuda (Reference Nelson and Matsuda1977) solved the fluid equations numerically in 1D, and predicted that the flow should be stable (see also Dwarkadas & Balbus Reference Dwarkadas and Balbus1996) although their solutions indicate some asymmetric features. Wada & Koda (Reference Wada and Koda2004) pointed out that the latter studies adopted a tightly wound pattern, and a flat rotation curve. They performed 2D numerical simulations with different pitch angles and rotation curves, and found the spiral arms to be Kelvin-Helmholz unstable when a more open spiral pattern was used. The instability is most readily seen as spurs along the spiral arms. Kim & Ostriker (Reference Kim and Ostriker2006) found that in 3D numerical models, Kelvin-Helmholtz instabilities were suppressed, although Kim, Kim, & Kim (Reference Kim, Kim and Kim2014) suggest an alternative ‘wiggle instability’ mechanism.
Dobbs & Bonnell (Reference Dobbs and Bonnell2006) (see also Dobbs Reference Dobbs2008) supposed a different mechanism for producing structure, and spurs in particular, along the shock in the purely hydrodynamical, non self-gravitating case. They supposed that any substructure in the gas gets amplified as it passes through a shock. Thus, like the cloud collisions in the Toomre (Reference Toomre1977) model, clouds, or structure in the gas, get forced together by orbit crowding in the spiral shock. A similar idea was shown in Roberts & Stewart (Reference Roberts and Stewart1987). Although they do not perform hydrodynamic calculations, clouds in their models undergo dissipative collisions. Like Toomre (Reference Toomre1977), clouds can be forced together and move apart after the shock, but unlike Toomre the presence of dissipation means some clouds are effectively compressed together and retain structure after the shock. Dobbs & Bonnell (Reference Dobbs and Bonnell2006) showed that this process was only valid in the presence of cold gas, when the ISM is subject to thermal instabilities (Dobbs et al. Reference Dobbs, Glover, Clark and Klessen2008) unless there is very large spiral forcing. For a warm medium, the spiral shock is relatively weaker and the pressure smoothes out any structure in the gas. The same process could have also plausibly operated (rather than Kelvin Helmholtz instabilities) in the calculations by Wada & Koda (Reference Wada and Koda2004) and Kim & Ostriker (Reference Kim and Ostriker2006).
In the presence of self gravity, Lubow, Cowie, & Balbus (Reference Lubow, Cowie and Balbus1986) showed using 2D calculations that the gas experiences a reduced shock from the stellar potential. In an extreme case, where all the gas is situated in self gravitating clouds, the behaviour of the clouds would resemble the zero pressure case, similar to billiard balls entering the potential. Wada (Reference Wada2008) performed full 3D hydrodynamical simulations with self gravity and a multi-phase medium, finding that the intermittency of dense gas entering the spiral potential leads to a non steady state, where the gas spiral arms are neither continuous, nor exhibit a constant offset from the arms (see Figure 18, and e.g. also Dobbs & Pringle Reference Dobbs and Pringle2013). Rather the arms switch back and forth with time. Consequently Wada (Reference Wada2008) does not call the response of the gas a shock in this context. The behaviour of the gas is quite different from the original Roberts (Reference Roberts1969) picture largely because the gas is far removed from a homogenous flow. Also, simulations with a multiphase medium typically do not exhibit a shock or peak in density before the spiral potential. Typically the gas density peaks after, or coincident with the minimum of the potential, because the cold gas (within a multi-phase medium) shocks later.
The response of gas to an m = 2 fixed spiral potential is shown, from Wada (Reference Wada2008). The minima of the spiral potential are indicated by the white lines. The simulation include a multiphase medium, and stellar feedback, so the response of the gas is highly complex. No clear continuous shock is found, and the density peak of the gas does not have a continuous offset from the minimum, although typically the density peak is after (on the trailing side of) the potential minimum.

Figures 16 and 18 illustrate a number of the points made in Section 3.5, for a section of spiral arm in M51 and a numerical simulation respectively. The various processes in the ISM, including instabilities, turbulence and feedback lead to a ‘shock’, or dust lanes that are very much more structured and broad than the simple analytic case. Nevertheless the response of the gas is still much sharper than the underlying potential or old stellar population. With gravity and cooling, trailing spurs are very easy to make from arm GMCs. As discussed in the next section, we would expected these features regardless of whether the arms are tidally induced and slowly winding up or truly stationary, the only difference for the dynamic arms being the absence of trailing spurs.
3.6 Tidally induced spiral arms
As discussed in section 2.4, the main difference for tidally induced spirals compared to the QSSS case is likely to be a radially dependent (Oh et al. Reference Oh, Kim, Lee and Kim2008; Dobbs et al. Reference Dobbs, Theis, Pringle and Bate2010), rather than constant pattern speedFootnote 11 . Consequently resonance related substructure is not likely to feature in tidally induced spirals.
At large radii, the spiral arms may well be material arms, with little gas flow through the arms (Meidt et al. Reference Meidt, Schinnerer and Garcia-Burillo2013). However at most radii, as mentioned in section 2.4, the arms are likely to be density waves, with a pattern speed lower than that of the rotation speed (unlike the local, transient arms). Similar to the quasi-stationary density wave picture, the gas will flow through the arms and experience a spiral shock. GMCs are expected to form in the arms by the means described in Sections 3.3 and 3.5, being sheared out into spurs as they leave the arms. The structure of galaxies such as M51 largely reflects this behaviour.
The simulations of Salo & Laurikainen (Reference Salo and Laurikainen2000b) and Dobbs et al. (Reference Dobbs, Theis, Pringle and Bate2010) did not achieve the resolution required to study GMC formation, or spur formation, in their models of interacting galaxies . The simulations do predict that unlike the quasi-steady state spiral galaxy, the gas and stars are not found to be offset from each other. In their model of M51, Dobbs et al. (Reference Dobbs, Theis, Pringle and Bate2010) also showed that the double, and relatively close passage of the perturbing galaxy introduced somewhat chaotic dynamics, inducing large radial inflow and outflow motions (see also Shetty et al. Reference Shetty, Vogel, Ostriker and Teuben2007). The chaotic dynamics also mean that the spiral arms may move with respect to the gas on relatively short ( ~ 10 Myr) timescales.
3.7 Gas flow in dynamic spiral arms
The main difference in the behaviour of gas in galaxies with dynamic spiral arms, compared to quasi-stationary or tidally induced arms, is again due to the pattern speed. Dynamic stellar spiral arms do not exhibit significantly different rotation from the rest of the galaxy. Rather the spiral arms exhibit corotation everywhere (e.g., Baba et al. Reference Baba, Saitoh and Wada2013, see Section 2.2.2). Thus the gas, stars and spiral arms will have the same angular velocities and there is no gas flow through the arms. Similar to the case of tidally induced spiral arms, the dynamics of the spiral arms means substructure due to resonances cannot occur.
In dynamic arms, the gas is still subject to the gravitational potential of the arms. As shown in Dobbs & Bonnell (Reference Dobbs and Bonnell2008) and Wada et al. (Reference Wada, Baba and Saitoh2011), gas effectively falls in to the minimum of the potential, from both sides of the spiral arm. In massive gas rich discs, the spiral arms may themselves be a manifestation of gravitational instabilities in the gas, so gas infall is coincident with arm formation. For dynamic arms, a systematic offset is not expected between the density peak of the gas, and the stellar minimum (Dobbs & Bonnell Reference Dobbs and Bonnell2008; Wada et al. Reference Wada, Baba and Saitoh2011). Because the gas does not flow through the spiral arm, the gaseous arm remains until the stellar arm disperses. Even then, since the velocity dispersion in the gas will be less than that of the arms, it will still be likely that a gaseous arm remains, even when the stellar arm has dispersed (Dobbs & Bonnell Reference Dobbs and Bonnell2008)
Gas can still clearly undergo shocks as it falls into the minimum of the potential, particularly if it has cooled. Shocks in nearby spiral arms were associated with the dynamic spiral arm picture, as well as the QSSS scenario in early observations (e.g. Quirk & Crutcher Reference Quirk and Crutcher1973). The presence of quasi-regular spurs however seems less likely in galaxies with dynamic spiral arms. As stated in Section 3.5.2, spurs are usually the result of GMCs in spiral arms being sheared out as they move into the inter arm regions. However if the gas does not pass out of the spiral arms, this mechanism is not feasible, and indeed spurs are not typically seen in simulations (Dobbs & Bonnell Reference Dobbs and Bonnell2008; Wada et al. Reference Wada, Baba and Saitoh2011). Larger features, such as branches, are possible though. As mentioned above, when the stellar spiral arm dissolves, the gaseous arm may remain intact for longer. The gaseous arm thus represents a feature without a stellar counterpart, can appear as a branch between spiral arms (Dobbs & Bonnell Reference Dobbs and Bonnell2008).
Again, GMC formation will occur as described in Section 3.3. So far, there is no noticeable difference between the properties of GMCs in simulations of galaxies with global spiral spiral arm versus local transient arms (Hopkins et al. Reference Hopkins, Quataert and Murray2011; Dobbs et al. Reference Dobbs, Burkert and Pringle2011), and likely not different to tidal arms. However there are differences in comparison to the clouds in a completely smooth stellar disc, where there are no stellar spiral arms, and processes such as cloud-cloud collisions are more limited. In the case without spiral arms, the maximum cloud mass is smaller (e.g. a few 105 M⊙ compared to a few 106 M⊙), whilst clouds tend to preferentially exhibit prograde rotation rather than randomly orientated rotation.
4 OBSERVATIONAL EVIDENCE FOR DIFFERENT MECHANISMS OF GENERATING SPIRAL STRUCTURE
Although not yet conclusive, there are a growing number of observational tests for whether galaxies display quasi-stationary density waves, tidally induced or bar driven spirals, or instability induced dynamic spiral arms. Most of the observational tests relate to the pattern speed of the spiral arms, and whether the distribution of gas and stars match the predictions for a fixed pattern speed or not. Only the quasi-stationary density wave picture adopts a constant pattern speed, whilst the other mechanisms induce arms with radially decreasing pattern speeds.
4.1 Pattern speeds
The pattern speed is difficult to measure directly, but there have been many attempts to estimate pattern speeds in galaxies. Most measurements have assumed that the pattern speed is constant, thereby immediately adopting the assumption that the spiral pattern is a quasi-stationary spiral density wave. The simplest means of determining the pattern speed is to estimate the location of corotation (e.g. assumed coincident with the outer extent of the arms, or a dip in HI or CO at a certain radius Shu, Stachnik, & Yost Reference Shu, Stachnik and Yost1971; Rots Reference Rots1975; Elmegreen, Seiden, & Elmegreen Reference Elmegreen, Seiden and Elmegreen1989; Sempere et al. Reference Sempere, Garcia-Burillo, Combes and Knapen1995). Supposed locations for the ILR (e.g. assumed coincident with the inner extent of the spiral arms, rings or inter arm features) and/ or the OLR can be similarly used to estimate the pattern speed (Lin & Shu Reference Lin, Shu and van Woerden1967; Gordon Reference Gordon1978; Elmegreen et al. Reference Elmegreen, Seiden and Elmegreen1989). These methods suffer from uncertainties, both observationally and theoretically about where spiral arms begin and end (see e.g. Contopoulos & Grosbol Reference Contopoulos and Grosbol1986; Elmegreen, Wilcots, & Pisano Reference Elmegreen, Wilcots and Pisano1998; Englmaier & Shlosman Reference Englmaier and Shlosman2000), and of course whether these really are resonance features.
Another indirect test of the pattern speed is the location of the spiral shock, and star formation relative to the minimum of the stellar potential. For a fixed spiral pattern, the spiral shock will lie one side of the minimum of the stellar potential within corotation, and the opposite side outside corotation. The width of this offset can be used to determine the pattern speed, if a constant sound speed is assumed. Gittins & Clarke (Reference Gittins and Clarke2004) demonstrated this method using numerical simulations, where they presumed the spiral shocks will correspond to dust lanes. Likewise, assuming a timescale for star formation to occur, the molecular clouds (CO) and Hα will have a predicted offset. Egusa, Sofue, & Nakanishi (Reference Egusa, Sofue and Nakanishi2004) used this prediction to derive a constant pattern speed for NGC 4254, following which they are able to derive pattern speeds for 5 out of a sample of 13 galaxies (Egusa et al. Reference Egusa, Kohno, Sofue, Nakanishi and Komugi2009). Difficulties in obtaining pattern speeds for many spirals, and the large scatter with this method, likely arise because the spirals are transient, and the offsets local and non-systematic. Tamburro et al. (Reference Tamburro, Rix, Walter, Brinks, deBlok, Kennicutt and MacLow2008) instead measured offsets between atomic hydrogen and recent star formation (24 μm maps) to simultaneously fit Ωp and the star formation timescale for M51, the latter found to be 1-4 Myr. Repeating their analysis however, Foyle et al. (Reference Foyle, Rix, Dobbs, Leroy and Walter2011) found no evidence for a systematic offset, and thus a constant pattern speed. One difference may be that Foyle et al. (Reference Foyle, Rix, Dobbs, Leroy and Walter2011) try to fit a pattern speed over the entire galaxy, whereas Tamburro et al. (Reference Tamburro, Rix, Walter, Brinks, deBlok, Kennicutt and MacLow2008) studied localised regions. Such differences indicate the large uncertainties in observationally determining the behaviour of spiral arms, and that the assumption of a constant pattern speed may be invalid.
As well as using morphological features of spiral galaxies to determine corotation, the kinematics can also be used, either from the residual velocity fields or changes in the directions of streaming motions (Canzian Reference Canzian1993; Sempere et al. Reference Sempere, Garcia-Burillo, Combes and Knapen1995; Elmegreen et al. Reference Elmegreen, Wilcots and Pisano1998). Canzian (Reference Canzian1993) showed that the spiral residual velocity field shows a single spiral feature inside corotation, and 3 spiral features outside corotation. Font et al. (Reference Font, Beckman, Epinat, Fathi, Gutierrez and Hernandez2011) also used the velocity field to determine the location of resonances from the locations where the residual velocities are zero, from high resolution Hα data. The kinematics of supernovae ejecta may also give information about the underlying spiral arm pattern (Struck & Smith 2009, Kretschmer et al. 2013).
So far all the methods described assume that the pattern speed is constant. The (Tremaine & Weinberg Reference Tremaine and Weinberg1984) method uses the continuity equation for gas flow across the spiral arms, which relative to the rest frame, and integrating over each direction, gives an expression of the form
 \begin{equation}
\Omega _{\rm p} \int \Sigma x dx = \int \Sigma v_y dx
\end{equation}
\begin{equation}
\Omega _{\rm p} \int \Sigma x dx = \int \Sigma v_y dx
\end{equation}
(Merrifield, Rand, & Meidt Reference Merrifield, Rand and Meidt2006). Here, Σ, vy and x are all observables (of the relevant tracer) which means Ωp can be determined. For the continuity equation to be valid, this method tends to use HI or CO to avoid problems with extinction, although a small fraction of the gas will be turned into stars. The Tremaine-Weinberg method also assumes a steady state, i.e. that the spiral arm is not changing over the timescale that gas passes through the arm, and assumes a thin disc, but is in principle not limited by the shape of the arm.
This technique has been used mainly for barred galaxies, due mainly to the simpler geometry, but also for a number of spiral galaxies (Sempere et al. Reference Sempere, Garcia-Burillo, Combes and Knapen1995; Zimmer, Rand, & McGraw Reference Zimmer, Rand and McGraw2004; Rand & Wallin Reference Rand and Wallin2004). The method can be extended to allow for a radial dependent pattern speed (Westpfahl Reference Westpfahl1998; Merrifield et al. Reference Merrifield, Rand and Meidt2006). In this case, the pattern speed can be determined by solving a matrix equation over different positions within a small (e.g. 0.5 kpc width) region along a spiral arm. The pattern speed is then computed for other regions at different radii. Using this method, a number of studies have found radially decreasing pattern speeds (Merrifield et al. Reference Merrifield, Rand and Meidt2006; Speights & Westpfahl Reference Speights and Westpfahl2011, Reference Speights and Westpfahl2012) including for M81 (Westpfahl Reference Westpfahl1998). Meidt et al. (Reference Meidt, Rand, Merrifield, Shetty and Vogel2008b); Meidt, Rand, & Merrifield (Reference Meidt, Rand and Merrifield2009) also found radial dependent pattern speeds in M51, M101 and a number of other galaxies, but attributed these to different patterns with different pattern speeds at different radii, rather than a continuously decreasing pattern speed. Differences in pattern speed are likely at the transition from a bar to spiral arms (e.g. Meidt et al. Reference Meidt, Rand, Merrifield, Shetty and Vogel2008b, see also Section 2.3), but this would not explain discrete changes in pattern speed at larger radii, or in the absence of a bar.
To date, no examples of galaxies with a constant pattern speed have been found with the radially varying Tremaine-Weinberg method. Most galaxies show a slowly decreasing pattern speed in the outer regions. The Tremaine-Weinberg method appears sufficient to establish that patterns speeds vary radially (i.e. the pattern speed varies much more than the error bars), but not whether the pattern speed varies continuously or consists of multiple segments each rotating at a constant pattern speed (Meidt et al. Reference Meidt, Rand, Merrifield, Debattista and Shen2008a, Reference Meidt, Rand, Merrifield, Shetty and Vogel2008b).
4.2 Pitch angles
We can also consider whether the pitch angles of spiral arms of observed galaxies match predictions from models and theory. Grand et al. (Reference Grand, Kawata and Cropper2013) analysed the pitch angles of transient stellar spiral arms in galaxy models with different shear rates (Γ), and showed that the higher shear rates produce more tightly wound spiral arms. It is also clear that the pitch angle of the spiral arms decreases with time. Figure 19 shows the pitch angles of simulated spiral arms plotted against the shear rate of model galaxies. The observed correlation of real spiral galaxies are also overlaid on this figure. This trend and scatter are both consistent with the observations (Seigar et al. Reference Seigar, Block, Puerari, Chorney and James2005, Reference Seigar, Bullock, Barth and Ho2006). Though spiral arms wind up by differential rotation, typical pitch angles depend on the shear rate of disc galaxies suggesting that swing amplification is important for generating spiral arms because swing-amplified spiral arms reach maximum amplitudes at a specific pitch angle depending on the shear rate (Section 2.1.3 and Figure 10).
The pitch angle is shown versus shear, from Grand et al. (Reference Grand, Kawata and Cropper2013). The coloured points represent simulated values taken from Grand et al. (Reference Grand, Kawata and Cropper2013), whilst the crosses are observed values, from Table 3 of Seigar et al. (Reference Seigar, Bullock, Barth and Ho2006).

The quasi-stationary density wave theory may also satisfy the pitch angle-shear rate correlation qualitatively (Lin & Shu Reference Lin and Shu1964; Roberts, Roberts, & Shu Reference Roberts, Roberts and Shu1975), since Lin & Shu (Reference Lin and Shu1964) demonstrated that the pitch angle of quasi-stationary density waves is lower for higher central mass concentration, i.e., a higher shear rate. Observations by Block et al. (Reference Block, Bertin, Stockton, Grosbol, Moorwood and Peletier1994) support the scenario that spiral arm properties are intrinsic to a galaxy dependent on galaxy morphology and gas content (see also Section 4.5).
4.3 Stellar cluster ages
The ages of stellar clusters can also be used as a test of the underlying dynamics in galaxies. This method was described in Dobbs & Pringle (Reference Dobbs and Pringle2010). The ages of clusters should clearly increase with distance away from the spiral arm (in the leading direction) for a constant pattern speed. Likewise a similar pattern is expected for a bar. However for the case of dynamic spiral arms due to local instabilities there is no flow of material through the spiral arms. Hence no age pattern is expected, rather stars of similar ages lie along a spiral arm (see Figure 20). The numerical models of Dobbs & Pringle (Reference Dobbs and Pringle2010) were relatively simple, and did not include for example stellar feedback. More complicated models have since been performed by Wada et al. (Reference Wada, Baba and Saitoh2011) and Grand et al. (Reference Grand, Kawata and Cropper2012b, Reference Grand, Kawata and Cropper2012a). They confirmed the case that for dynamic arms, there is no clear age pattern, testing multi-armed galaxies both with and without bars. Dobbs, Pringle, & Naylor (Reference Dobbs, Pringle and Naylor2014) extended this idea further by looking specifically at stellar age spreads in GMCs, and suggest again that different age distributions may reflect how the spiral arms are generated.
The spatial distribution of clusters of different ages is shown for different galaxy models: fixed spiral potential (top left), barred galaxy (top right), dynamic spiral arms (lower left) and a model of M51 (lower right). For the fixed potential and bar. there is a transition of stellar ages moving away from the spiral arms / bar. For the flocculent galaxy, star clusters of similar age tend to be located in a spiral arm, and the ages do not show clear transitions, rather they are more random. From Dobbs & Pringle (Reference Dobbs and Pringle2010).

Dobbs & Pringle (Reference Dobbs and Pringle2010) also tested a model of M51, where they found that although the spiral arms are kinematic density waves, and there is flow of material through them, the dynamics of the interaction were rather chaotic and produced a chaotic distribution of stellar ages. Observations of stellar ages in M51 have since confirmed a similar picture (Foyle et al. Reference Foyle, Rix, Dobbs, Leroy and Walter2011; Kaleida & Scowen Reference Kaleida and Scowen2010; Chandar et al. Reference Chandar, Whitmore, Calzetti, Di Nino, Kennicutt, Regan and Schinnerer2011). Studies of galaxies undergoing less violent interactions have not been tested.
From the numerical models, the patterns for the dynamic spirals appear most robust, because the peaks in the number of stars corresponding to the arms are significantly higher than the noise (e.g. a factor of ~ 10). For the case of the stationary density wave, the pattern is potentially more confusing, because the peaks in the number of young stars decrease and broaden away from the arm, so they are less distinct. Furthermore after a relatively short time (10s Myrs), the young stars will catch up with the next spiral arm.
Several observational studies have examined whether age patterns exist in a number of nearby galaxies (Sánchez-Gil et al. Reference Sánchez-Gil, Jones, Pérez, Bland-Hawthorn, Alfaro and O'Byrne2011; Foyle et al. Reference Foyle, Rix, Dobbs, Leroy and Walter2011; Ferreras et al. Reference Ferreras, Cropper, Kawata, Page and Hoversten2012). With the exception of one or two galaxies e.g. M74, the observations generally find little evidence of age patterns. As well as stellar clusters, a number of studies have also used colour gradients across the spiral arms as a measure of a transition in stellar ages (Efremov & Ivanov Reference Efremov and Ivanov1982; Regan & Wilson Reference Regan and Wilson1993; Beckman & Cepa Reference Beckman and Cepa1990; Gonzalez & Graham Reference Gonzalez and Graham1996; Martínez-García, González-Lópezlira, & Bruzual-A Reference Martínez-García, González-Lópezlira and Bruzual-A2009). However again, with the exception of one or two cases, there is rarely a clear trend in the colour gradients.
4.4 Resonances and interference patterns
As well as looking at the pattern speeds, or age spreads, it is also possible to look for specific features that result from the quasi-stationary density wave picture. Patterns of star formation along the spiral arms have been seen in some galaxies, and attributed to resonances, for example a dip in star formation at corotation (Cepa & Beckman Reference Cepa and Beckman1990; Knapen et al. Reference Knapen, Beckman, Cepa, van der Hulst and Rand1992). As already mentioned, features associated with resonances are expected at certain radii in a disc. In a few galaxies, symmetric spurs, or breaks in the spiral arms are relatively convincing, e.g. NGC 1566 (Elmegreen & Elmegreen Reference Elmegreen and Elmegreen1990). Features such as outer rings due to bars can also be seen (e.g. Buta & Crocker Reference Buta and Crocker1991). However in many cases subtle features associated with spiral arms may simply be due to the shearing of clouds, or bridges where spiral arms in the gas remain whilst corresponding features in the stars have dissipated (Section 3.7).
In the global model theory of spiral arms, see Section 2.1.4, the spiral pattern is thought to correspond to an interference pattern resulting from leading and trailing waves in the stellar disc. Elmegreen (Reference Elmegreen1989) found some signs of leading waves for M51, M81 and M100, but equally the patterns they found could be simply due to the underlying complex structure of the disc.
4.5 Observations of grand design and flocculent structure
Any theory(ies) of spiral structure also need to explain the observed frequency of grand design and flocculent spirals. One of the arguments for quasi-stationary density waves has been the large number of galaxies with m = 2 spiral structure. In density wave theory, density waves with m > 3 are less likely to be stable (Lin & Shu Reference Lin, Shu and van Woerden1967; Toomre Reference Toomre1977; Thomasson et al. Reference Thomasson, Elmegreen, Donner and Sundelius1990) compared with m = 2, explaining the preference for m = 2 spirals. An alternative explanation is that the m = 2 spirals are all tidally induced or bar driven. This hypothesis was made by Kormendy & Norman (Reference Kormendy and Norman1979), who found the majority of grand design galaxies had bars or companions. Some isolated galaxies exhibited arms which did not extend to the flat part of the rotation curve, which meant that they could potentially be longer lived spirals, as the winding problem is avoided. Other isolated grand design galaxies in their sample were thought to have undergone recent mergers.
Observations also show that the frequency of grand design galaxies doubles in clusters or groups compared to otherwise (Elmegreen & Elmegreen Reference Elmegreen and Elmegreen1983a). There are thus few isolated grand design galaxies, but even then, determining whether there are examples which could not be explained by tidal interactions is difficult, partly due to the difficulty of establishing truly isolated galaxies and those that have not undergone a recent merger (see e.g. Verley et al. Reference Verley, Leon and Verdes-Montenegro2007). It is also not established either theoretically, or using cosmological simulations, whether interactions are likely to be frequent enough to account for the observed number of grand design spirals. As discussed in Section 2.4.4, spiral galaxies can be expected to retain m = 2 structure for ~ 1 Gyr after an interaction.
One argument for the existence of long-lived spiral arms is the finding that some galaxies that appear flocculent or multi-armed in the optical exhibit an underlying grand design pattern in the old stellar population, i.e. as seen in the K band (Block & Wainscoat Reference Block and Wainscoat1991; Block et al. Reference Block, Bertin, Stockton, Grosbol, Moorwood and Peletier1994; Block, Elmegreen, & Wainscoat Reference Block, Elmegreen and Wainscoat1996; Thornley Reference Thornley1996; Thornley & Mundy Reference Thornley and Mundy1997; Grosbol & Patsis Reference Grosbol and Patsis1998; Seigar, Chorney, & James Reference Seigar, Chorney and James2003). Whilst these structures could be tidally induced, Block et al. (Reference Block, Bertin, Stockton, Grosbol, Moorwood and Peletier1994) suggested that in fact the stellar disc supports low m modes whereas the gas (and young stars) does not since low m modes are damped at the ILR. Thus in this scenario the two components of the disc are assumed to be decoupled. Given that theory, and simulations, show that gas shocks at the spiral arms, presumably there is still some relation of the gas to the stars, many of the examples in Block et al. (Reference Block, Bertin, Stockton, Grosbol, Moorwood and Peletier1994) simply show an extra optical arm. An alternative scenario, in the dynamic arm picture is that these galaxies, which are sufficiently massive to exhibit only a small number of spiral arms, are transitioning between 2 and 3 armed patterns, and the features in the optical are remainders of spiral arms where the stellar pattern has dispersed, but the gas arm (which is clearly denser and colder) still persists. Chakrabarti et al. (Reference Chakrabarti, Laughlin and Shu2003) provided an alternative picture whereby resonances may be responsible for generating substructure from an underlying stationary m = 2 pattern, particularly for highly flocculent galaxies, although other means of generating substructure (e.g. instabilities, stellar feedback) may be just as likely responsible (see reference to Elmegreen, Elmegreen, & Leitner Reference Elmegreen, Elmegreen and Leitner2003 below). The most recent observations found that most flocculent galaxies do not exhibit grand-design structure (Elmegreen et al. Reference Elmegreen, Elmegreen and Yau2011) and those that do have very weak spiral arms (Elmegreen et al. Reference Elmegreen, Chromey, Bissell and Corrado1999), but the co-existence of different patterns still needs to be explained.
Conversely all galaxies may be flocculent galaxies, which merely develop an overwhelming m = 2 mode during tidal perturbations, or with a bar (Sections 2.3 and 2.4). Colombo et al. (Reference Colombo, Hughes and Schinnerer2014) found evidence for an underlying flocculent spiral in the grand-design spiral M51, proposed for the old stars as well as the gas (CO). Elmegreen et al. (Reference Elmegreen, Elmegreen and Leitner2003) suggested that both grand design and flocculent spirals (as seen in the old stars) exhibit a similar structure in the gas and young stars (independent of the underlying old stellar population) which is driven by turbulence in the disc.
4.6 The Milky Way
The spiral structure of our Galaxy is reviewed thoroughly in Benjamin (2014), so we only briefly discuss the Milky Way here.
The number of spiral arms in our Galaxy is still debated somewhat (see e.g. Vallée Reference Vallée2005), but is most frequently considered to be either 2 or 4. There are 4 main spiral arms; the Perseus, Sagittarius, Scutum-Crux, and Norma spiral arms, and at least one bar. There is in addition the Outer Arm, which may be the outer part of one of the inner arms, and the Local or Orion arm, which is much shorter, and may be a bridge or spur rather than a real arm.
A large number (m > 2) of arms would support the view that the Galaxy better resembles a flocculent, rather than grand design spiral, with multiple dynamic arms induced by local gravitational instabilities. An alternative interpretation is that the Galaxy has two main spiral arms (the Perseus and Scutum-Centaurus arms), with the other two arms lesser features, perhaps only present in gas and young stars (Drimmel Reference Drimmel2000). Such a scenario could arise in the quasi-stationary density wave picture if the secondary arms are resonance related features (Martos et al. Reference Martos, Hernandez, Yáñez, Moreno and Pichardo2004). In the Churchwell et al. (Reference Churchwell, Babler and Meade2009) map of the Galaxy, the secondary arms appear to start at the ends of the bar, and/or be connected with the inner 3 kpc arms, and the main arms also start at the bar.
As well as gravitational instabilities induced locally by perturbations in the stellar distribution, or GMCs, the Galaxy is surrounded by low mass companions, and contains one or two bars. Hence there is no shortage of mechanisms to generate spiral arms. Purcell et al. (Reference Purcell, Bullock, Tollerud, Rocha and Chakrabarti2011) showed that a recent passage of the Sagittarius galaxy could have induced spiral arms, though their simulations did not show the detailed spiral structure. Either the bar(s) or interactions could lead to an m = 2 pattern. One of the most striking pieces of evidence that there is a symmetric m = 2 pattern, suggestive of Lin-Shu density wave theory is the recent discovery of an outer HI arm, which is found to match up exactly with the inner Sagittarius arm, assuming a continuous m = 2 logarithmic spiral pattern (Dame & Thaddeus Reference Dame and Thaddeus2011). Some other models of the Galaxy tend to show kinked arms, rather than continuous spiral arms (e.g. Taylor & Cordes Reference Taylor and Cordes1993).
Numerical simulations have also been performed to examine the structure of the Milky Way, by comparing l − v maps of simulations with those observed (Wada Reference Wada1994; Fux Reference Fux1999; Englmaier & Gerhard Reference Englmaier and Gerhard1999; Rodriguez-Fernandez & Combes Reference Rodriguez-Fernandez and Combes2008; Baba, Saitoh, & Wada Reference Baba, Saitoh and Wada2010; Dobbs & Burkert Reference Dobbs and Burkert2012; Pettitt et al. Reference Pettitt, Dobbs, Acreman and Price2014). Dobbs & Burkert (Reference Dobbs and Burkert2012) showed that the nearest spiral arm, in their instance from adopting a symmetric m = 2 spiral, likely corresponds to the ‘molecular ring’. However generally it is difficult to reproduce the outer Milky Way with logarithmic spirals (Englmaier & Gerhard Reference Englmaier and Gerhard1999; Pettitt et al. Reference Pettitt, Dobbs, Acreman and Price2014). Fitting the l − v map from a simulation of a bar and dynamic spiral arms appears more successful (Baba et al. Reference Baba, Saitoh and Wada2010). Baba et al. (Reference Baba, Asaki, Makino, Miyoshi, Saitoh and Wada2009) also analysed the velocities of gas and young stars from N-body + hydrodynamical simulations, and concluded that the high peculiar (non-circular) velocities they obtain, in general agreement with those observed in the Galaxy, arise from dynamic rather than stationary spiral arms.
Generally, the spiral pattern remains uncertain for the Milky Way, particularly as little is known about the spiral structure on the other side of the Galactic Center. There is also no conclusive observational evidence yet on the nature of the dynamics of the spiral arms. The Very Long Baseline Interferometer (VLBI) astrometry (e.g., VERA; Honma Reference Honma, Kawabe, Kuno and Yamamoto2013), as well as future space missions for infrared astrometry GAIA (Perryman et al. Reference Perryman, de Boer and Gilmore2001) and JASMINE (Gouda Reference Gouda, Aoki, Ishigaki, Suda, Tsujimoto and Arimoto2012), may well be able to provide a better indication of the nature of the spiral structure of our Galaxy.
4.7 Spiral arm triggering of star formation
A related question to the inducement of spiral arms in galaxies is whether the spiral arms induce star formation. This possibility has been considered in the quasi-stationary density wave picture, where the spiral arms induce a shock in the gas, thus raising the gas to the densities where it becomes molecular and self gravitating (Fujimoto Reference Fujimoto1968; Roberts Reference Roberts1969). In this scenario, the star formation is significantly higher with the presence of spiral shocks than it would be in a galaxy with no, or weak spiral arms. Some evidence in support of spiral arm triggering is observations by Seigar & James (Reference Seigar and James2002), that show a correlation between arm strength and star formation. However other work suggests there is no difference in the star formation rate between grand design and flocculent galaxies (Elmegreen & Elmegreen Reference Elmegreen and Elmegreen1986; Stark, Elmegreen, & Chance Reference Stark, Elmegreen and Chance1987; Foyle et al. Reference Foyle, Rix, Dobbs, Leroy and Walter2011; Eden et al. Reference Eden, Moore, Plume and Morgan2012). Instead, the spiral arms are supposed merely to gather gas which would anyway form stars, into the spiral arms (Vogel, Kulkarni, & Scoville Reference Vogel, Kulkarni and Scoville1988), with the increase in gas densities and star formation in the arms offset by lower values in the inter arm regions. Numerical simulations support this picture (Dobbs et al. Reference Dobbs, Burkert and Pringle2011), finding only a factor of ~ 2 increase with spiral arms compared to without. The act of the spiral arms simply gathering up gas is also consistent with the picture of shocks being highly dynamic, and intermittent, as described in Section 3.5.2. However there is a tendency to form more massive clouds, and more stable clouds in the spiral arms, which may well lead to higher star formation rates in stronger spiral arms (Dobbs et al. Reference Dobbs, Burkert and Pringle2011).
5 SUMMARY AND DISCUSSION
The origin of spiral arms in galaxies is a longstanding problem in astrophysics. Although, by no means solved, here we summarise the progress of different theories and observations.
5.1 Quasi-stationary density wave theory
In the late 1960s and 1970s the problems of maintaining quasi-stationary spiral density waves were emerging, and the WASER mechanism/ swing amplification proposed to maintain standing waves in the disc. This approach has been developed further, for example investigating damping and gas dissipation to maintain a steady state, as described in Sections 2.1 and 4.2. As also described in Section 2.1, solutions and stability criteria for non-uniformly rotating discs have also been investigated. However as yet there has not been any demonstration that the WASER mechanism works, and that standing waves can develop. N-body simulations of galaxies were just developing in the 1970s and 80s, but the picture has remained largely unchanged. Instead, as discussed in Section 2.1.5, spirals in simulations appear to be dynamic features, more associated with the swing amplification mechanism for generating spiral features. Some simulations find longer lasting modes than predicted by swing amplification alone, but the overall spiral pattern is still transient, recurrent in nature (D’Onghia et al. Reference D’Onghia, Vogelsberger and Hernquist2013; Sellwood & Carlberg Reference Sellwood and Carlberg2014). Others specifically designed to support a standing wave between the ILR and OLR, still find a pattern that changes from m = 2 to m = 3 and is ultimately transient recurrent (Sellwood Reference Sellwood2011). The simulations of Salo & Laurikainen (Reference Salo and Laurikainen2000b) also resemble the density waves proposed by density wave theory (Kalnajs Reference Kalnajs1965; Lin & Shu Reference Lin and Shu1966). In this case, self gravity of the disc is high, and the tidally induced features in their models may indeed be sufficiently self-gravitating to allow propagating waves. However it is still not clear that these waves are maintained, or indeed any clear necessity that the density waves need to be maintained.
We note that the success of these models in reproducing density wave theory depends to some extent on the interpretation of quasi-stationarity, and whether current simulations satisfy quasi-stationarity. However for those simulations with longer lived spirals, it has not been shown that that the spirals satisfy global mode theory (e.g. Bertin et al. Reference Bertin, Lin, Lowe and Thurstans1989a, Reference Bertin, Lin, Lowe and Thurstans1989b) and do not exhibit a steady shape over their lifetime. Observationally we do not readily distinguish between very transient spiral arms, and spiral arms which are ultimately still transient, but survive multiple rotation periods.
5.2 Dynamic spirals
Spiral arm formation from swing amplified instabilities was demonstrated nearly 30 years ago in simulations by Sellwood & Carlberg (Reference Sellwood and Carlberg1984), and still remains a clear mechanism for producing spiral arms. Typically the dynamic spiral arms produced resemble multi-armed or flocculent galaxies, but as discussed in the previous section, it also possible to produce low m patterns. In recent work, as described in Section 2.2, more details of this mechanism have emerged, for example non-linear evolution, radial migration of stars, the behaviour of the arms and how they corotate with the gas. The simulations have also demonstrated that the predictions of the number and properties of spiral arms are in agreement with the theory. The simulations have recently shed light on a long-standing conundrum with regards the longevity of spiral patterns generated in this way. High resolution calculations (Fujii et al. Reference Fujii, Baba, Saitoh, Makino, Kokubo and Wada2011; D’Onghia et al. Reference D’Onghia, Vogelsberger and Hernquist2013) demonstrate that in fact the heating of the spiral arms due to dissipation is much less than previously thought. Thus it possible for such spiral patterns to last for much longer, up to ~ 10 Gyr. Coupled to this, observations also demonstrate that spiral galaxies exist with little or no star formation (Masters et al. Reference Masters, Mosleh and Romer2010), so there is no longer a need for a gas component, or cold accretion onto the galaxy.
5.3 Tidal interactions
Tidal interactions were certainly recognised as a means of producing spiral arms by the 1980s, but it was not clear whether the induced arms would correspond to kinematic density waves or stationary waves, and whether tidal interactions could produce spiral structure extending to the centres of galaxies. It is now clear from simulations that tidal interactions can readily reproduce grand design structure, although are unlikely to account for multi-armed or flocculent patterns. The dynamics of the arms is dependent on the self gravity of the disc. In the absence of self gravity, the arms are kinematic waves. With increasing self gravity, the arms become more rigid, less susceptible to winding, and with a higher pattern speed. In particular, the central parts of galaxies which are most dense are most susceptible to developing a more rigid pattern, and in some cases a bar. Simulations have shown that tidally induced spirals can last around a Gyr, thus certainly in galaxy groups interactions may well be frequent enough to explain the presence of m = 2 spirals.
5.4 Bar driven spirals
As described in Section 2.3, there are now numerous means by which bars can induce spiral arms, and consequently different behaviour of the spiral arms in relation to the bar. As yet however, there is no clear indication which scenario, whether manifold theory, bar induced spirals, different patterns for the bar and arms, or nonlinear coupling prevails. And, as discussed in Section 2.3, the behaviour of the spiral arms. Whether they have near constant pattern speeds, or are trailing in nature more similar to the swing amplified model of arm formation, is different between different simulations, and in any case is likely to evolve with time. The range of morphology in observed barred galaxies suggests that spirals in barred galaxies have multiple origins.
5.5 Other mechanisms
As we have stated in Section 2.5, the stochastic star formation mechanism has fallen out of favour. Self propagating star formation likely leads to structure in the gas and new stars in galaxies, which produces a much more irregular and flocculent appearance than the underlying old stars. However, simulations that adopt a smooth (structureless) stellar disc and follow the gas and new star formation with hydrodynamics do not find very realistic spiral patterns. At least some structure is required in the stars, for example from swing-amplified noise or perturbations.
Dark matter halos are certainly a plausible means of generating spiral structure but at present we have no way of telling where they are or what effects they are having (if any) on the dynamics of stellar discs.
5.6 Observations
As discussed in Section 4, current observational tests do not yet rule out any of the proposed mechanisms for determining spiral structure. However we note that now the resolution of observational data is such that tests on determining the origin of spiral arms are becoming feasible, and results increasingly reported in the literature. We emphasised that in the past, observational results have often been limited by the assumption of a constant pattern speed. Applications of the radially dependent Tremaine-Weinberg method have shown that the arms in both grand-design and flocculent galaxies exhibit radially decreasing pattern speeds. Mapping the ages of stellar clusters appears to be a useful test of distinguishing galaxies where gas does not flow through the spiral arms, as is the case for local swing amplified instabilities. Distinguishing the nature of pattern speeds in clear grand design galaxies may be a good way of testing the rigidity of spiral arms. Examining clusters in galaxies that appear to be isolated grand design galaxies (or multi-arm galaxies with a prominent m = 2 pattern), may be a good test of whether the arms originate from swing amplified instabilities, or are density waves.
Interestingly, the gas response seems to first order independent of the nature of the spiral arms (whereas bars for example induce such large shear that star formation appears to be suppressed). Gas and young stars dominate the observed structure, but the spiral potential merely gathers the gas together in the arms than change the gas properties or star formation rate. Thus, other processes in the ISM, such as turbulence, gravity and cloud collisions may have a greater role on the gas dynamics and star formation than spiral arms.
ACKNOWLEDGEMENTS
We would like to thank the referee for a very helpful, and thorough report. CLD acknowledges funding from the European Research Council for the FP7 ERC starting grant project LOCALSTAR. JB would like to thank Keiichi Wada, Masafumi Noguchi, Shugo Michikoshi, Shunsuke Hozumi, and Kana Morokuma-Matsui for their valuable comments. JB was supported by the HPCI Strategic Program Field 5 “The Origin of Matter and the Universe.”