


1. Introduction
Barkema, Drabenstott, and Novack (Reference Barkema, Drabenstott and Novack2001) discuss the wave of consolidation that has been occurring in the meat sector from production and processing to retailing resulting in fewer and larger firms. The level of consolidation, however, differs between the poultry and livestock industries causing differences in the market structures among these industries. MacDonald and Burns (Reference MacDonald and Burns.2019) indicate approximately 90% of poultry are produced under a contractual arrangement (most of the remaining 10% are produced in facilities operated by processors) followed by hogs at over 60% and cattle at over 30%. Such contractual arrangements bypass traditional commodity markets. Poultry being such a highly integrated sector, multiple segments of the supply chain are controlled by individual companies with system shocks rippling through both the integrated and independent segments (Unveren and Luckstead, Reference Unveren and Luckstead2020). Goodwin, McKenzie, and Djunaidi (Reference Goodwin, McKenzie and Djunaidi2003) state the contractual nature of the poultry industry causes differences in the dynamics of price discovery from livestock markets with price discovery occurring primarily at the wholesale level.
Besides consolidation, today’s meat sector is the product of numerous innovations in production systems, products, and evolving consumer demands. The chicken sector is particularly a product of these innovations and changing demand. Broiler production is characterized by both big and small birds with production being tailored to the needs of grocery stores and food services (Maples et al., 2020). Broilers are young chickens produced for meat and make up the vast majority of chicken meat production with most of the remainder of chicken meat production coming from spent, or culled, hens. A very minor portion of chicken production is Cornish game hens and capons. Innovations over the years include integrated production and management where the grower does not own the birds, breaded chicken sandwiches and nuggets developed along with the microwave oven, and growth in consumer demand for breast meat and wings. Broiler meat is also characterized as white meat (breasts and wings) and dark meat (legs, and thighs). Dark meat cuts have been a major part of exports while white meat has largely been consumed in the domestic market. The market development of breasts and thighs, into various products including boneless wings and thighs and nuggets, along with demand for chicken wings suggests that price relationships and substitutability between cuts have evolved over time.
Given the continually evolving poultry production and consumer demand sectors, are the price relationships between cuts consistent? This study objective is to explore whether and how the pricing relationships among broiler cuts have evolved over time. Meat market analysts and integrated companies will benefit from this work through a better understanding of market dynamics between cuts. To achieve this objective, wholesale weekly data from January 1997 through August 2022 for breast, legs, thighs, and wings, are used to examine relationships among broiler cuts using a time-varying vector cointegration model. The contention is the different cuts are distinct products each having separate but related markets. Cointegration is used to determine if the prices of different cuts move together over time. If prices are cointegrated, it implies a long-run equilibrium relationship exists, suggesting that changes in the price of one cut will eventually be reflected in the prices of the others. Cointegration can be considered as the existence of an economic equilibrium that is driven by the balancing of supply and demand.
Impulse response functions (IRF) and forecast error variance decomposition (FEVD) are used to analyze price dynamics. As discussed in the next section, the hypothesis is the cointegrating vector is changing over time in response to changes in the chicken sector. IRFs provide not only the direction of the relationship but also can show the strength of the relationship over time. Changing long run equilibrium may impact the direction and strength of relationships which may not show up in methodologies that assume abrupt changes in long run relationships. FEVDs show the proportion of an endogenous variable is explained by a shock in a variable, which also provides an indication of the strength of the relationship between variables. IRF and FEVD account for both long and short run elasticities as these elasticities show up in the estimated coefficients (Cuddington and Dagher, Reference Cuddington and Dagher2015). Analyzing the price dynamics of chicken cuts can shed light on consumer preferences, dietary trends, and purchasing habits. This understanding can be valuable for integrated companies and other market participants, helping them refine their marketing strategies that align with consumer demand.
2. Background chicken industry
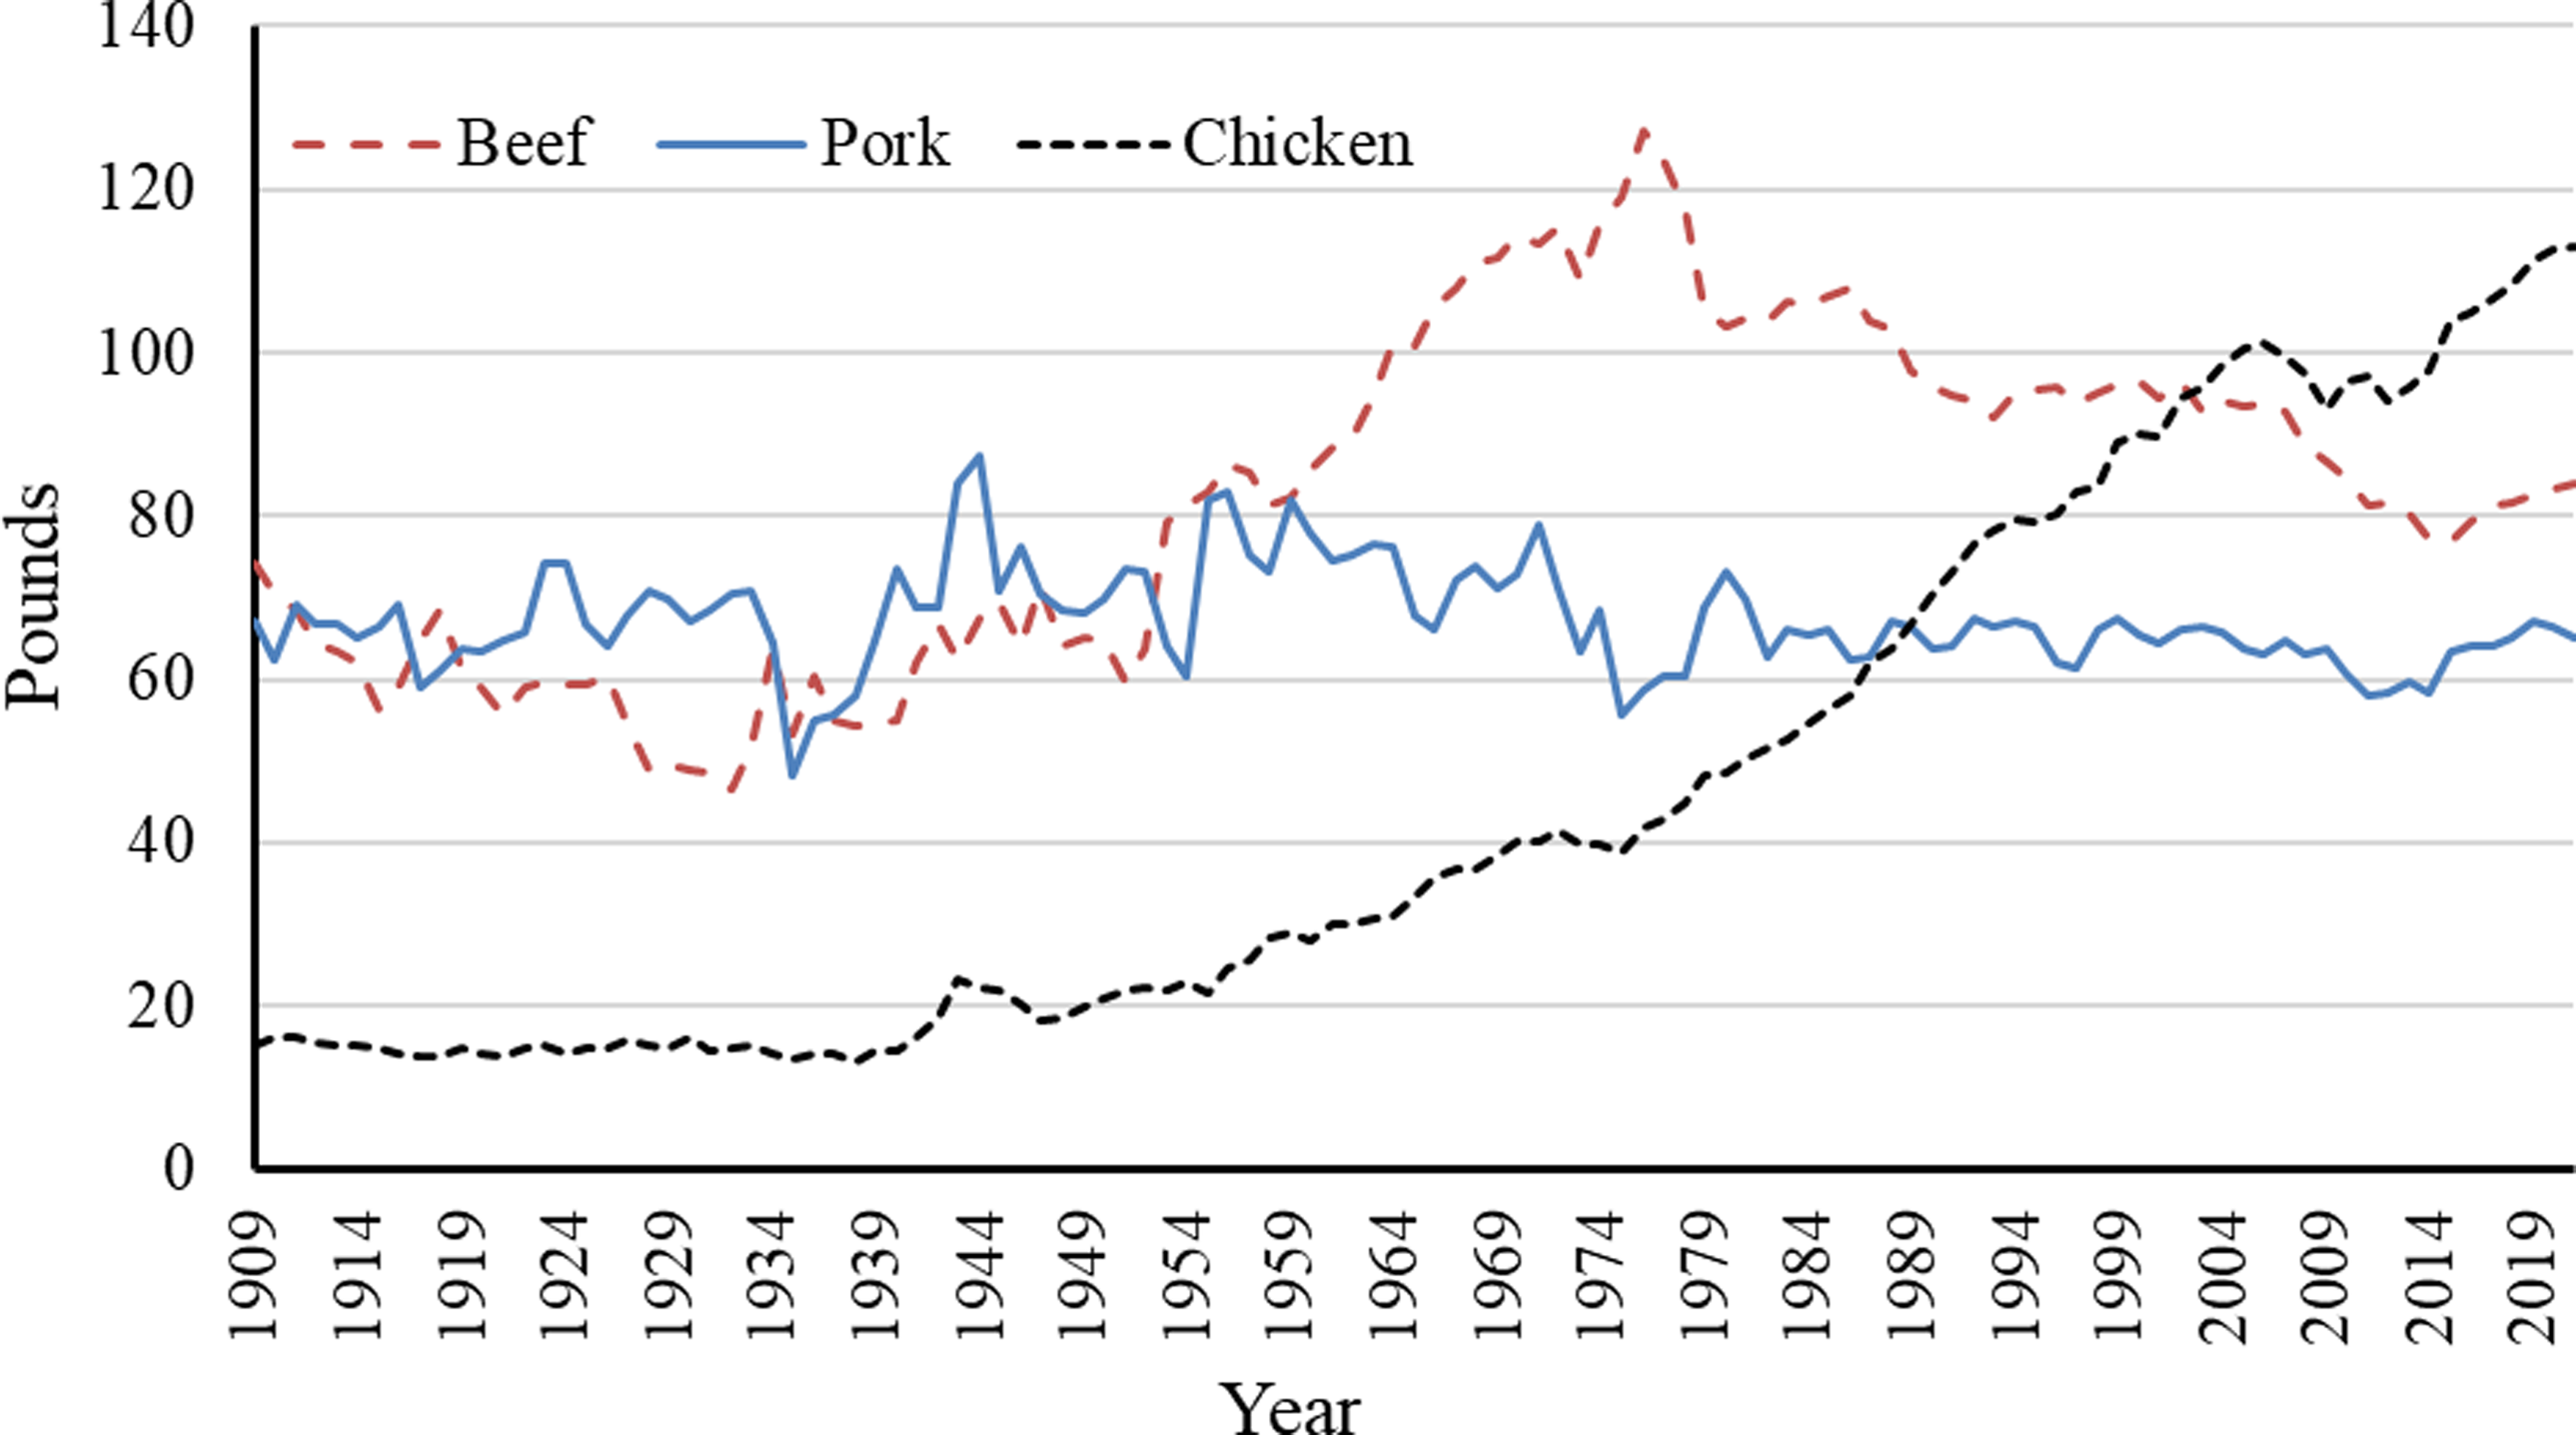
Like all food sectors, the chicken industry has experienced major changes. It used to be people bought whole chickens from the butcher then either the butcher or they themselves cut up the chicken. In the 1970s, consumers began to prefer cut-up chicken and parts and further-processed chicken to buying the whole intact bird. In response, the industry started providing value-added products. Today, for example, one can buy precooked, boneless chicken tenders. Further, changing consumers’ preferences for healthier and cheaper meats have help chicken overtake beef as the most consumed meat in the U.S. as measured by various measures, one such measure is per capita availability in boneless weight (Figure 1). Per capita availability of chicken started to increase in the 1940s and gradually surpassed that of pork and beef in 1996 and 2010. In 2021, chicken availability per person was 68.1 pounds, more than double that of the 1940s. This increase in chicken availability is partially due to the chicken industry meeting the demand of consumers and foodservice providers for value-added, branded, and convenience products along with a healthier alternative protein source. Chicken has lower total fat, saturated fat, and cholesterol per ounce compared to beef (Buzby and Farah, Reference Buzby and Farah2006) but it also lacks some nutrients present in beef. Restaurants and bars also helped fuel changes. McDonald’s Chicken McNuggets, for example, brought a significant change in the perception of chicken, serving as both a convenience product and a frozen food during the early 1980s (Buzby and Farah, Reference Buzby and Farah2006). Bars started serving inexpensive, at the time, chicken wings to increase beer sales. Restaurants such as Buffalo Wild Wings opened specializing in selling wings. Using wings changed wings from more of a byproduct to one of the most valuable cut parts of the chicken.
Per capita availability in boneless weight (pounds) of beef, pork, and chicken during 1909 to 2021 (USDA, ERS, 2024).
Increasing availability of chicken is also the result of advancements in breeding, large-scale production, contractual farming, vertical integration, and marketing making chicken more affordable. Broiler production in the U.S. expanded rapidly between 2013 and 2022, with a growth of 22 percent (USDA, Economic Research Service (ERS), 2023a). The U.S. is currently the world’s largest producer (USDA, ERS, n.d. a) and second largest exporter of the chicken (Ufer, Padilla, and Link, Reference Ufer, Padilla and Link2023). Although the size of chickens is tailored to the needs of the final product, the average size of slaughter broilers has increased from 3.93 in 1980 to 5.03 in 2000 to 6.54 pounds in 2023 (National Chicken Council, n.d. a). Average days to market have decreased from 53 in 1980 to 47 in 2023 (National Chicken Council, n.d. a). Mechanically separated chicken introduced in 1969, lowered processing costs and waste, but most of this chicken is used in frankfurters, lunch meat, and other processed meats (USDA, ERS, 2023b). Further decreasing production costs is illustrated in the pounds of feed per liveweight of a broiler meat has decreased from 2.05 in 1980 to 1.95 in 2000 to 1.75 pounds in 2023 (National Chicken Council, n.d. a).
Obviously, the number of cut parts per chicken has not changed; most of the increase in weight has occurred due to larger breasts. U.S. consumers prefer breast meat over the other parts including using breasts to form nuggets and boneless wings. Breasts also include the strip, or tender, that is separated from the rest of the breast and sold used as chicken tenders. Increasing demand for wings resulted in the development of boneless wings made from breast meat. Fortunately for U.S. producers, much of the world prefers dark meat to white meat, allowing exports to help balance the use of cut parts. Broiler meat exports have ranged from 15 percent of production to 20 percent of production in the last 21 years (Ufer, Padilla, and Link, Reference Ufer, Padilla and Link2023). In the U.S., only about 60% of the dark meat, leg quarters, drumsticks, and thighs, and back parts, are consumed, the rest is exported (National Chicken Council, n.d. b). Further, chicken paws are exported to China which consider them a delicacy (USDA, ERS, n.d. b). In 1997, leg-quarters accounted for 27% of the U.S. broiler meat exports, but 50% in 2012 (USDA, ERS, 2013). However, Sawyer (Reference Sawyer2019) asserts that changing demographics, particularly age and ethnicity, in the U.S. are causing a shift in consumer preferences from white chicken meat to dark meat, and selling dark meat domestically seems to yield higher profits compared to exporting.
In addition to production and demand changes, political and health aspects have either directly or indirectly impacted the chicken industry (Ufer et al., Reference Ufer, Padilla and Link2023). While overall exports have increased along with production, exports have contributed to market volatility. Russia was a major export market for U.S. chicken, accounting for over 40 percent of total exports in some years until banned in 2014 in response to U.S. economic sanctions imposed after Russian seized Crimea with no end in sight given the invasion of Ukraine (Ufer et al., Reference Ufer, Padilla and Link2023). Highly Pathogenic Avian Influenza has resulted in some trade volatility, although the policy of regionalization by Animal and Plant Health Inspection Service (APHIS) within the USDA has limited its effect (USDA, APHIS, 2024). This policy limits the importation of chicken from identified regions due to health concerns. Ufer et al. (Reference Ufer, Padilla and Link2023) report a 3%-point reduction in chicken exports during the 2014–2015 outbreak. More recently, COVID-19 caused meat shortages ultimately leading to an increase in retail prices (Luckstead and Devadoss, 2021). These phenomena could have changed price dynamics in the broiler industry, in particular broiler cuts. McKenzie, Goodwin, and Carreira (Reference McKenzie, Goodwin and Carreira2009) discuss awareness of the chicken market evolution is important in understanding price dynamics and forecasting.
2.1. Previous studies on chicken part price relationships
Four studies found that model different broiler cuts and whole broiler prices in a VAR type framework are Goodwin Jr., McKenzie, and Djunaidi (Reference Goodwin, McKenzie and Djunaidi2003), Djunaidi (Reference Djunaidi2005), McKenzie et al. (Reference McKenzie, Goodwin and Carreira2009), and Sims (Reference Sims2017). The assumption made, either implicitly or explicitly, in these studies is that the cuts are distinct products each with their own market, but the markets are related. Goodwin et al. (Reference Goodwin, McKenzie and Djunaidi2003) and Djunaidi (Reference Djunaidi2005) use monthly data from USDA’s poultry yearbook for wholesale broilers without giblets, boneless skinless breast, wings, leg quarters, and backs and necks. McKenzie et al. (Reference McKenzie, Goodwin and Carreira2009) and Sims (Reference Sims2017) use monthly data for the northeast U.S. from the reporting firm Urner Barry. Price data for boneless skinless chicken breast tender out, wings, leg quarters, and whole broilers without giblets are used by McKenzie et al. (Reference McKenzie, Goodwin and Carreira2009), whereas Sims (Reference Sims2017) uses drumstick, boneless skinless breast tender out, leg quarter, thigh, small wing, jumbo wing, tender, and whole bird without giblets. All studies indicated the data are stationary for the periods analyzed, therefore vector autoregressive models (VAR) are used.
Goodwin et al.i (Reference Goodwin, McKenzie and Djunaidi2003) used deseasonalized and logged data from January 1987 to December 2000. FEVDs indicate boneless breasts and whole birds are important in price discovery for most parts. One exception is leg quarters which are largely exogenous. They attribute this exogenous aspect to a subsequent amount of dark meat being exported. Wings explain about 40% of own price forecast error variance with breasts, legs, and whole birds each explaining slightly less than 20% of wings forecast error variance. Inferences from their impulse response functions are similar, suggesting breasts are the most important market for price transmissions. Using data from January 1990 to December 2002, Djunaidi (Reference Djunaidi2005) added chicken export prices to analyze the impact of exports to the dynamics of the poultry markets. He likewise concludes “white meat is the most important driving factor in the chicken business such that integrators are willing to make a trade-off between high white meat price sold in domestic markets and low dark meat export price” Djunaidi (Reference Djunaidi2005, p.16). In Djunaidi (Reference Djunaidi2005), wings are more exogenous than in Goodwin Jr., Mckenzie, and Djunaidai (Reference Goodwin, McKenzie and Djunaidi2003), explaining over 55% of their own forecast error variance at 36 months.
McKenzie et al. (Reference McKenzie, Goodwin and Carreira2009) use directed acyclic graphs (DAG) to account for contemporaneous correlations, whereas Goodwin et al. (Reference Goodwin, McKenzie and Djunaidi2003) uses Cholesky decomposition and Djunaidi (Reference Djunaidi2005) mentions contemporaneous correlation but it is not clear how it was handled. Cholesky decompositionFootnote 1 requires a predetermined order of variables in the system, whereas the DAG does not. It is noted that estimates of FEVD can vary significantly depending on variable ordering when a Cholesky decomposition is used and variables are correlated (Estima, 2004). Goodwin et al. (Reference Goodwin, McKenzie and Djunaidi2003) and Djunaidi (Reference Djunaidi2005) use the same order of boneless skinless breast, wholesale broilers, wings, leg quarters, and backs and necks in the VAR system; and they make the same conclusion such that breasts are the most important in the price discovery.
McKenzie et al.’s (Reference McKenzie, Goodwin and Carreira2009) DAG indicates contemporaneous information flows from legs, breasts, and wings to whole birds. Forecast error variance decompositions indicate the wings, breasts, and legs are exogenous to the model. Own price decompositions for these parts are over 80% at nine months ahead. Whole bird decompositions are approximately evenly split between whole birds and breasts after roughly seven months. Moreover, they note that markets for chicken cuts have become more exogenous regardless of whether Cholesky decomposition or DAG is used. McKenzie et al. (Reference McKenzie, Goodwin and Carreira2009) use exogeneity inferred from forecast error variance decompositions (FEVD) to determine whether VAR or autoregressive (AR) model should be used to select forecasting models; AR should be superior to VAR forecasts when variables are exogenous. In-sample data are January 1989 to December 1999. Out of sample forecasts for January 2000 to June 2007 indicate an AR(3) model outperformed a VAR(3) model. Sims (Reference Sims2017) updated McKenzie et al. (Reference McKenzie, Goodwin and Carreira2009)’s forecasting using prices through May 2017 for the original cuts and added several additional broiler cuts for data from January of 1998 through May 2017. His conclusion is the same as McKenzie et al. (Reference McKenzie, Goodwin and Carreira2009) conclusion, AR processes outperform VARs in forecasting.
The studies mentioned above acknowledge that the broiler industry has undergone changes, yet none have tested for the structural changes in pricing relationship between broiler cuts.
2.2. Data
Weekly prices (cents per lb.) of broiler parts (Northeastern US - delivered) for breast, legs, thighs, and wings are obtained from the USDA, ERS, (various). Each series contains 1339 observations covering the period of January 4, 1997, to August 27, 2022. The observations begin in January 1997 when the data on thigh prices became available and ends in August 2022 as some series have been discontinued. Four cuts (breasts, legs, thighs, and wings) are used in this analysis which incorporate both white and dark meat.
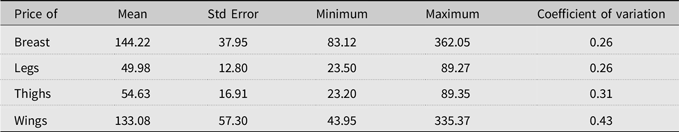
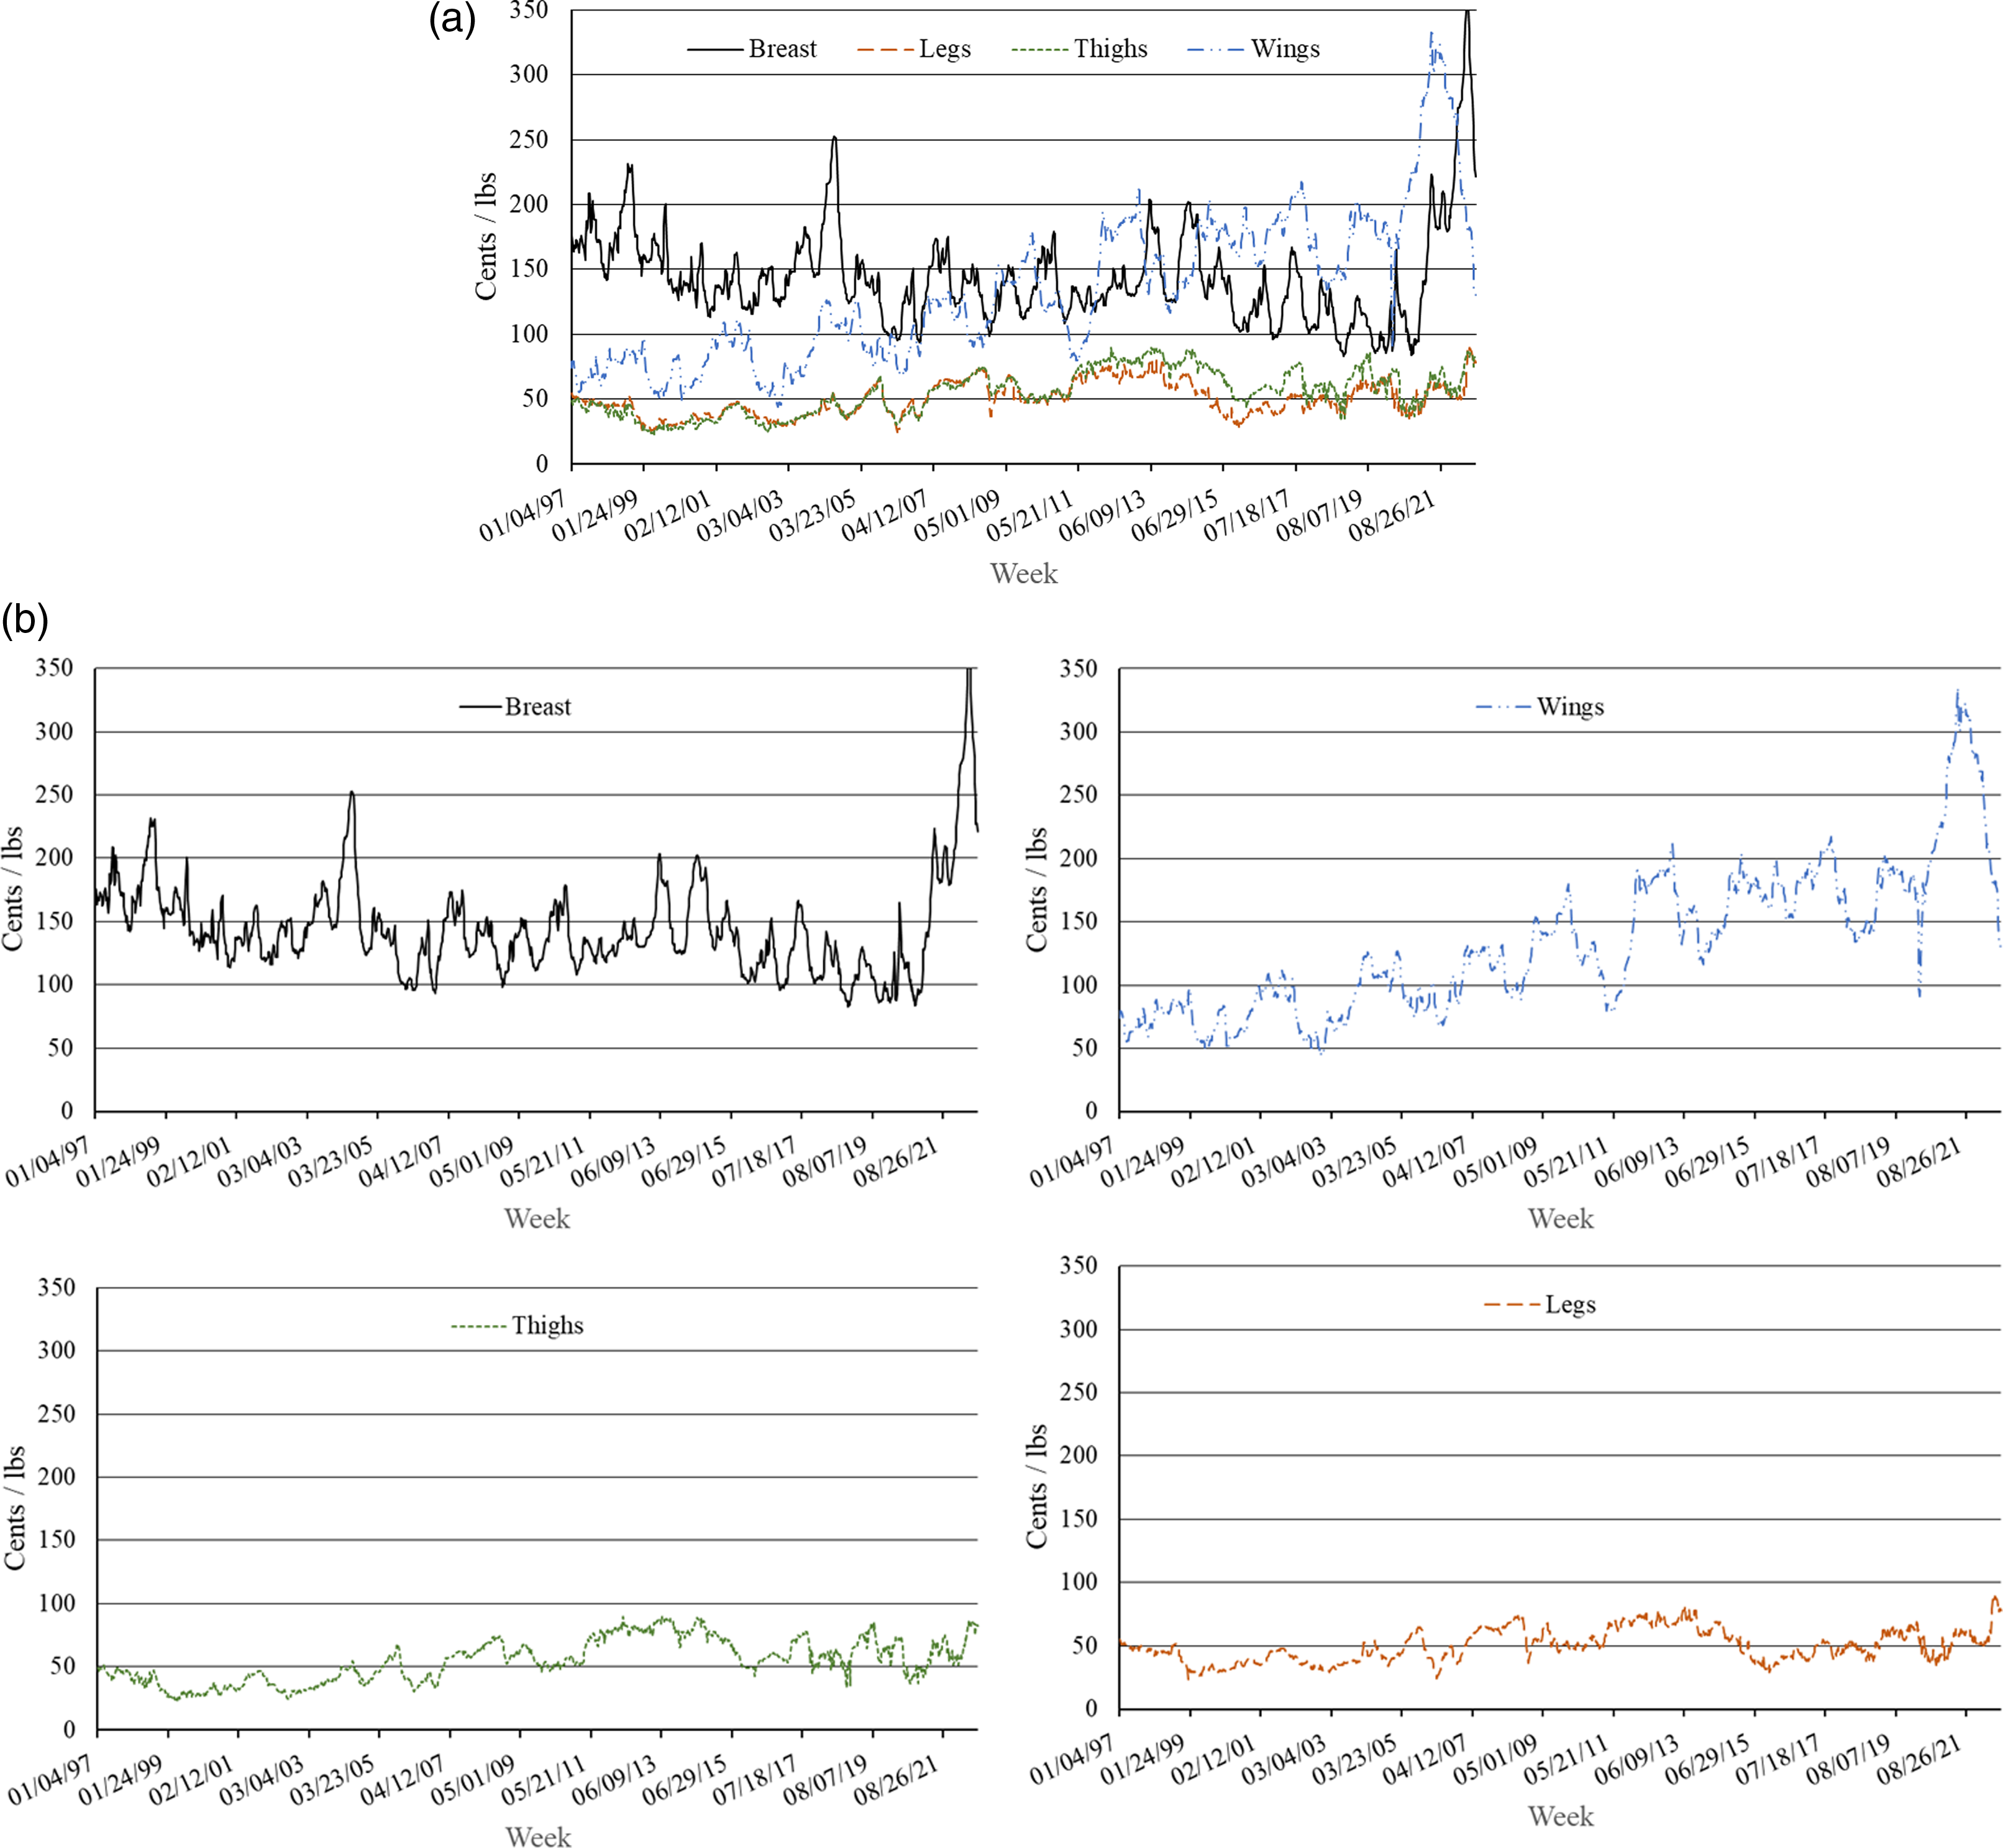
Descriptive statistics of each series are presented in Table 1. Among the four broiler cuts, breasts and wings are more expensive than legs and thighs. Wing prices which have the largest variation (standard deviations and coefficient of variation) reached their maximum in 2021 and are higher than breast prices from 2015 to 2021 (Figure 2). Prices of legs and thighs are approximately the same, except for prices during the period from 2013 to 2019 (Figure 2).
Descriptive statistics of weekly prices of breast, legs, thighs, and wings prices in cents per pound for 1339 observations covering the period of January 4, 1997, to August 27, 2022
Weekly prices in cents per pound of breast, legs, thighs, and wings from January 4, 1997, to August 27, 2022.
Further analyses are conducted using the natural logarithm of each series. Augmented Dickey-Fuller tests indicate that each series is nonstationary in its original form (levels) but becomes stationary after taking the first differences (for conciseness, the statistics are not presented).
3. Methodology
3.1. Time-varying and conventional vector error cointegration models
As noted previously, the poultry sector has experienced a variety of supply and demand changes; it is hypothesized that these changes have continuously altered the cointegrating relationships between the cuts. As such this study employs time-varying cointegration model developed by Bierens and Martins (Reference Bierens and Martins2010). Bierens and Martins’ (Reference Bierens and Martins2010) methodology allows the cointegration vector to undergo gradual and smooth changes over time rather than abrupt shifts, as suggested by Hansen (Reference Hansen2003). This approach differs from most approaches concerned with effects of structural changes on econometric models (e.g., Hansen, Reference Hansen1992; Andrews, Reference Andrews1993; Bai and Perron, Reference Bai and Perron1998; Hansen, Reference Hansen2003), the approach of Bierens and Martins (Reference Bierens and Martins2010) explicitly incorporates variations in the long-run component of a time-varying vector error-correction model while holding the short-run coefficients fixed. In this context, structural change is characterized by the gradual time variations of the cointegrating vector. This methodology particularly applies to the chicken industry as changes have continuously impacted the industry rather than a particular event abruptly changing the industry. Further, it is hypothesized that the changes in the chicken sector may gradually, not abruptly, induce changes in pricing relationship among broiler cuts. Such hypothesis aligns more with the assumption that long-run coefficients are time-varying while those of short-run are not than varying all coefficients. As admitted by Bierens and Martins (Reference Bierens and Martins2010), the assumption of long-run coefficients being time dependent but short-run being fixed is more restrictive than a model that all coefficients are time dependent. All coefficients being time dependent create a difficult model to interpret and estimate. The methodology has been used in diverse studies including energy (Mishra, Ghosh, and Kanjilal, Reference Mishra, Ghosh and Kanjilal2023), carbon dioxide emission (Apergis, Reference Apergis2016), precious metals (Bampinas and Panagiotidis, Reference Bampinas and Panagiotidis2015), and Bitcoin (Lee and Rhee, Reference Lee and Rhee2022), and agricultural commodities (Xu, Reference Xu2015).
The time-varying vector error correction model (TV-VECM) without intercepts and time trends is (Bierens and Martins, Reference Bierens and Martins2010)
 $$\Delta Y_{t}=\Pi _{{\rm t}}Y_{t-1}+\sum _{j=1}^{q-1}\Gamma _{j}\Delta Y_{t-j}+\varepsilon _{t}$$
where Y t is a (k x 1) vector of variables in the VECM, the four prices of breast, legs, thighs, and wings, ΔY t denotes the first difference of Y t , Γ j is a matrix of coefficients corresponding to lagged first-differenced prices of order j, q is an integer representing the lag order of the vector autoregressive (VAR) model, t = 1,…, T represents (weekly) time, and T = number of observations. ε t represents a vector of error terms which is assumed independent and identically distributed with zero-mean and covariance matrix Ω. Π t Y t − 1 is the time-varying correction term. In a conventional vector error correction model (VECM), the cointegrating vector is Π = αβ′ where α and β are both time-invariant (k x r) matrices and r is an integer representing rank of Π (r < k). β characterizes the long-run relationship while α and Γ j characterize the short-run structure (Johansen, Reference Johansen1995). In Bierens and Martins (Reference Bierens and Martins2010), TV-VECM, Π t = αβ t ′ where β t is time varying and approximated by a linear combination of orthogonal Chebyshev time polynomials, and rank of Π t is allowed to take different values across time. However, α, Γ j , and Ω are time invariant as assumed in a VECM.
The long-term component of the TV-VECM is approximated by (Bierens and Martins, Reference Bierens and Martins2010)
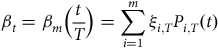 $$\beta _{t}=\beta _{m}\left({t \over T}\right)=\sum _{i=1}^{m}\xi _{i,T}P_{i,T}(t)$$
for some fixed m, where m = 1, …, T represents the degree of the Chebyshev time polynomial, $P_{i,T}\left(t\right)=\sqrt{2}\cos \left[{i\pi \left(t-0.5\right) \over T}\right]$
is the Chebyshev time polynomial, and ξ
i
are unknown k x r matrices. Under the null hypothesis of time-invariant cointegration, ξ
i, T
= 0
kxr
for all i = 1, …, T – 1; and the alternative hypothesis of time-varying cointegration, lim
T → ∞
ξ
i, T
≠ 0 for some i ≥ 1.
$P_{i,T}\left(t\right)=\sqrt{2}\cos \left[{i\pi \left(t-0.5\right) \over T}\right]$
is the Chebyshev time polynomial, and ξ
i
are unknown k x r matrices. Under the null hypothesis of time-invariant cointegration, ξ
i, T
= 0
kxr
for all i = 1, …, T – 1; and the alternative hypothesis of time-varying cointegration, lim
T → ∞
ξ
i, T
≠ 0 for some i ≥ 1.
The estimation of the model is carried out through maximum likelihood, with a likelihood ratio (LR) test statistic used to examine the hypothesis of time-invariant cointegrating vector against time-varying cointegrating vector. The asymptotic distribution of this test statistic follows a chi-square distribution with mkr degrees of freedom. Apergis and Payne (Reference Apergis and Payne2014) interpret m as the number of break events with the null hypothesis of the LR test is equivalent to m = 0 against the alternative hypothesis of m > 0. Refer to Bierens and Martins (Reference Bierens and Martins2010) for additional details on TV-VECM using Chebyshev time polynomials.
3.2. Innovation accounting techniques
To examine dynamic relationships between prices of the four broiler cuts, IRFs and FEVDs are employed. IRFs measure the reaction of a variable in a system to an innovation (shock) in another variable, showing how a variable responds over time after a sudden change (impulse) in another variable. FEVDs decompose the forecast error variance of a variable into components attributable to innovations in other variables, quantifying the proportion of the forecast error variance of a variable explained by innovations in each of the other variables in the system (Doan, Reference Doan2000).
Innovation accounting requires the contemporaneous structure of the error terms to be orthogonal, a condition that is typically unmet in economic data. Hoover (Reference Hoover2005) and Swanson and Granger (Reference Swanson and Granger1997) suggest using Directed Acyclic Graphs (DAGs) (Spirtes, Glysmour, and Scheines, Reference Spirtes, Glymour and Scheines2001) for orthogonalized in innovation accounting. Requiring no predetermined variable order, DAGs have been successfully used to identify causal relationships among variables in previous studies (Bessler and Akleman, Reference Bessler and Akleman1998; Binder and Mjelde, Reference Binder and Mjelde2017; Mjelde and Bessler, Reference Mjelde and Bessler2009). In a DAG, nodes represent variables, and directed edges between nodes indicate the direction of causality. For instance, A ➔ B presents a relationship that A is a cause of B. The linear non-Gaussian acyclic algorithm (LiNGAM) proposed by Shimizu et al. (Reference Shimizu, Inazumi, Sogawa, Hyvarinen, Kawahara, Washio, P.O.Hoyer, Bollen and Hoyer2011) is used to generate DAGs. LiNGAM does not require algorithmic parameters and reliably converges in a small, fixed number of steps; this is superior to iterative search algorithms, which may not converge within a finite number of steps (Shimizu et al, Reference Shimizu, Inazumi, Sogawa, Hyvarinen, Kawahara, Washio, P.O.Hoyer, Bollen and Hoyer2011).
4. Empirical results
4.1. TV-VECM
The TV-VECM is estimated using the entire data of weekly prices from January 1997 to August 2022. Likelihood ratio (LR) test statistics of time varying estimates with ranks (r) of cointegrating vector and lag orders of VAR (q) are presented in Table 2. Results and inferences are similar for different values for q (1, 2, 3, and 4). Time-varying LR test statistics from the models with q = 3 and 4 reveal that the null hypothesis of time-invariant cointegrating vector can be rejected at the 5% significance level when m = 1, regardless of the cointegrating rank. Regardless of the lag orders, the p-value of the time-varying LR test statistics is 0.000 for all r when the Chebyshev polynomial order (m) ≥ 2. These results indicate evidence favoring the rejection of the null hypothesis that the long-run coefficients remain constant over time. Further, when q = 2, 3, and 4, the minimum Hannan-Quinn criterion suggests the same m = 4, 1, 1, and 1 for r = 1, 2, 3, and 4 as the LR test statistics (Table 2).
Likelihood ratio test statistics of time varying estimates for one to four cointegrating ranks (R) and one to four lag (Q)
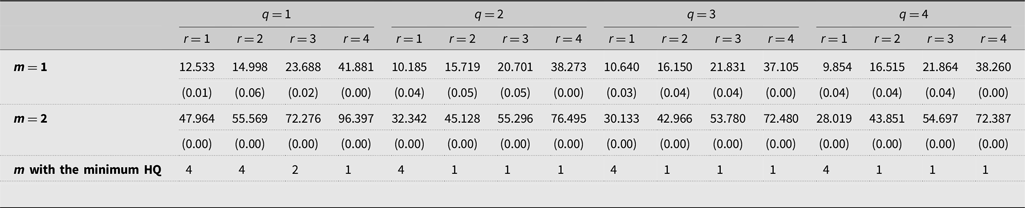
Note that figures in parenthesis are p-values.
The null hypothesis of the test is that cointegrating vector is time-invariant.
m represents the degree of the Chebychev time polynomial.
HQ refers to the Hannan-Quinn criterion.
Time-varying cointegrating coefficients, β t , associated with breast, legs, thighs, and wings’ prices are plotted in Figure 3. These coefficients are estimated using q = 3, r = 1, and m = 4. Coefficients associated with breast and wings, which are white meat, are roughly the same and smaller than the coefficients of legs and thighs, which are dark meat. Coefficients of legs (thighs) are positive (negative) over time. Variations in the leg and thigh coefficients are larger compared to those of breast and wings.
Plots of time-varying cointegrating coefficients, β_t, of breast, leg, thigh, and wing prices.
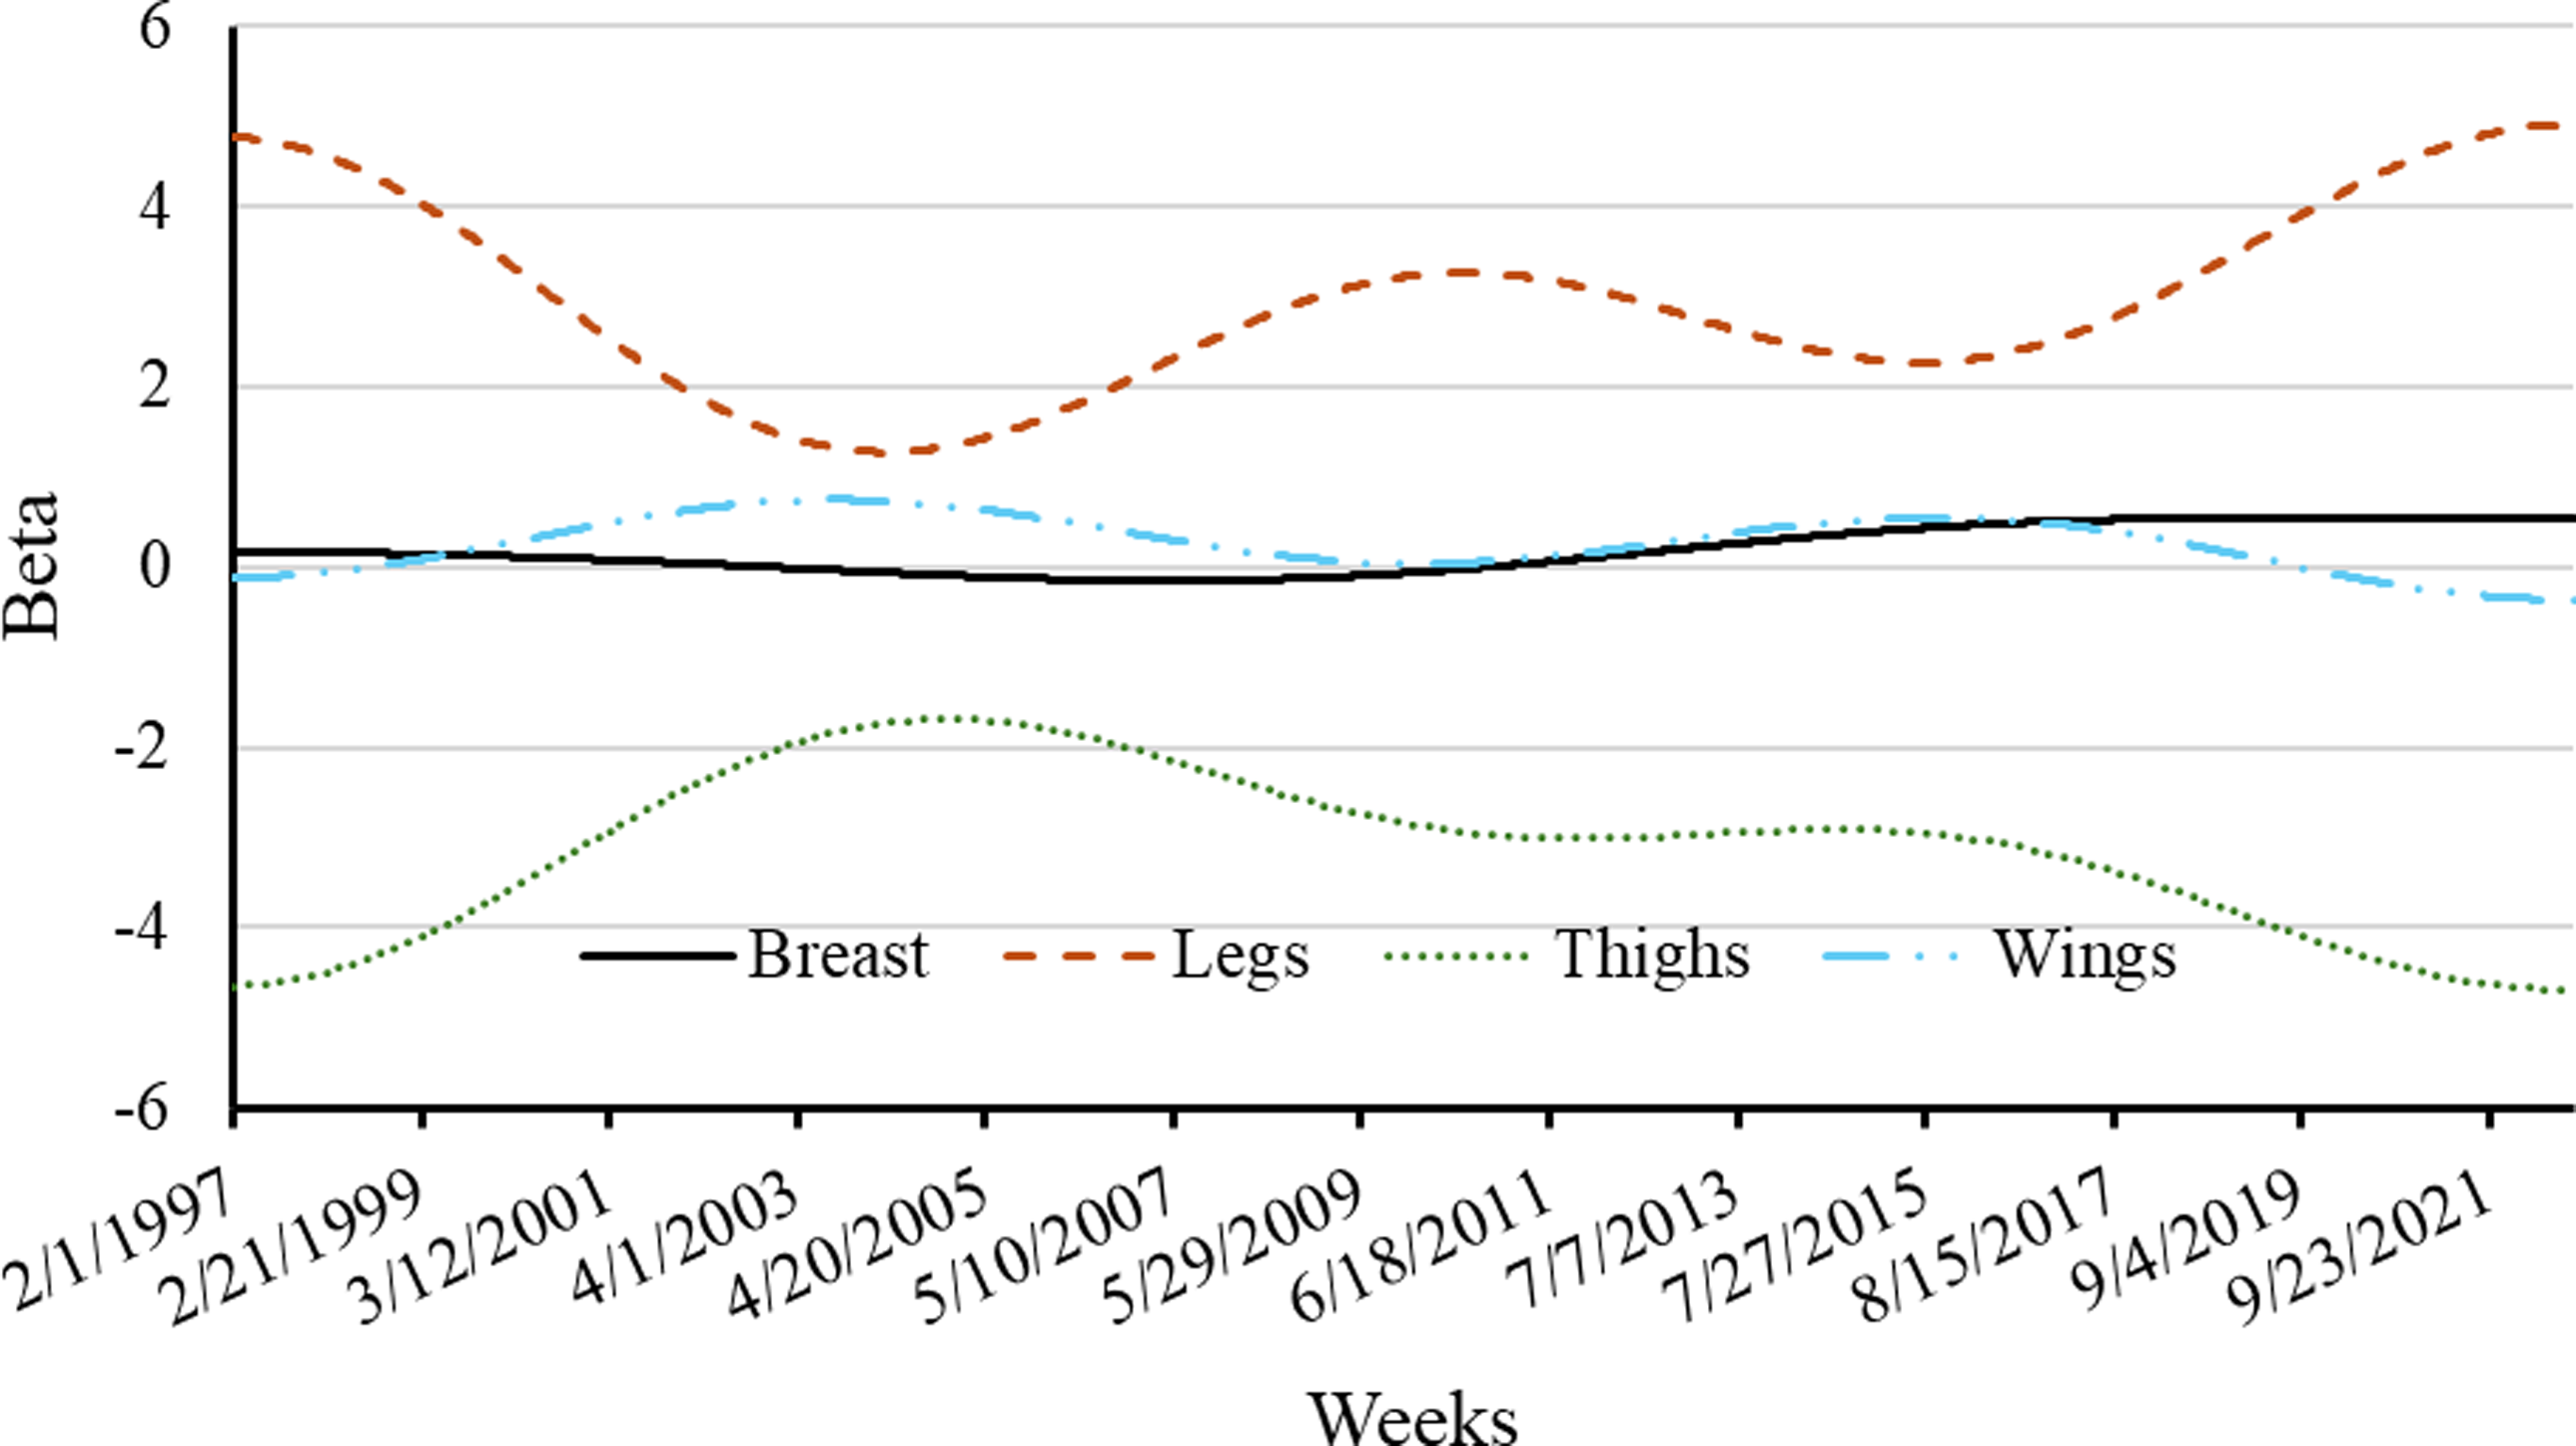
Since evidence (phenomena and statistical) is suggestive of a smooth time-varying cointegration, the remaining analysis is conducted for three periods, January 4, 1997, to December 26, 2003 (hereafter, subperiod 1), January 2, 2003, to June 26, 2015 (subperiod 2), and July 2, 2015, to August 27, 2022 (subperiod 3). Three periods allow for comparison of different periods without presenting an overwhelming number of results. Estimations and innovative accounting are performed in RATSPRO (Estima, 2024).
4.2. VECM for the three subperiods
Augmented Dickey-Fuller tests yield similar results for each subperiod as for the entire dataset: the levels are nonstationary, but the first differences are stationary. Lag length and number of cointegrating ranks are simultaneously determine by minimizing the Schwarz (SC) loss metric (Wang and Bessler, Reference Wang and Bessler2005). This measure suggests the number of cointegrating vectors (r) is equal to one for the three subperiods. Having a cointegrating vector suggests the presence of a long-run equilibrium, implying that fluctuations in the price of one cut will eventually influence the prices of the other cuts. SC loss metrics suggests two VAR lags or one VECM lag (note that transitioning from VAR to VECM, one lag is lost.) for all subperiods. With a lag order of two for VAR and one cointegrating rank, VECMs are estimated for each of the three subperiods to conduct innovation accounting.
4.3. Contemporaneous causal relationship
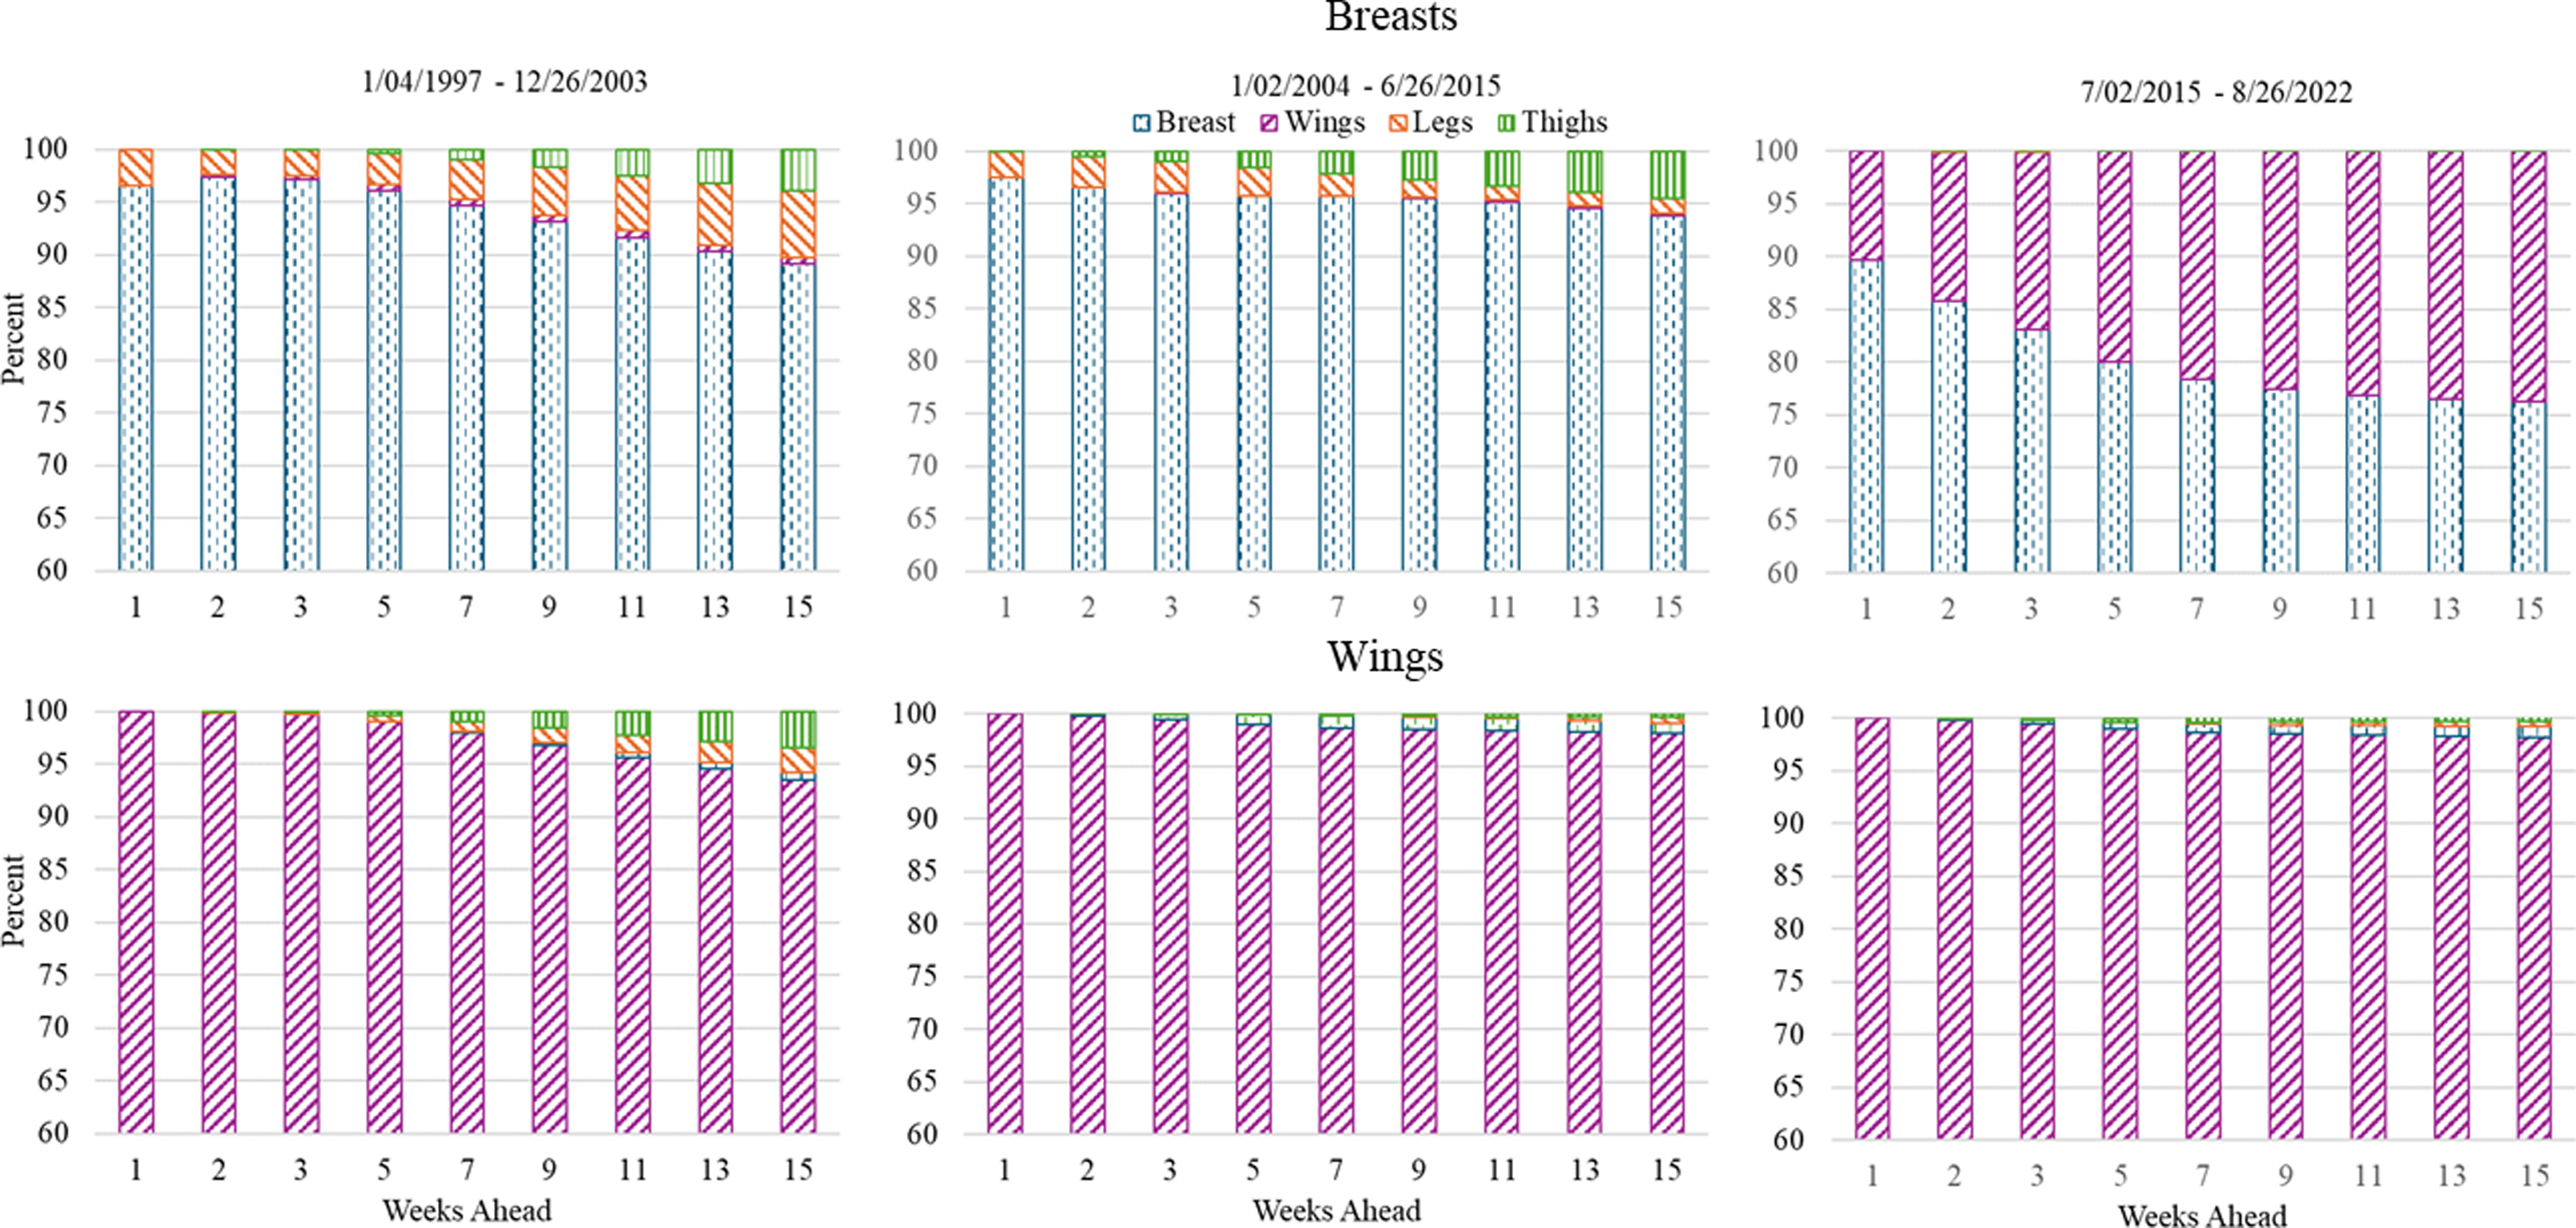
The observed innovations from the conventional VECMs are utilized to construct DAGs using LiNGAM in Tetrad (Center for Causal Discovery, 2023). DAGS in Figure 4 suggest contemporaneous causal relationships have changed over time. Price of legs contemporaneously affects prices of breast and thighs in subperiod 1 (Figure 4a). In subperiod 2, leg price continue to influence breast price, similar to subperiod 1; however, thighs start to influence leg prices (Figure 4b). In subperiod 3, thighs remain a cause of leg prices; in addition, wings become a simultaneous cause of breast (Figure 4c). In all subperiods, the breast market is an information sink; it does not contemporaneously transmit any information to the other markets. In subperiods 1 and 2 (prior to 2015), the wing market also acts as an information sink; however, in subperiod 3, wings provide information to the breast market. During subperiod 3, wing prices are higher relative to those in the other two subperiods, with most wing prices surpassing those breast prices (Figure 2). The relative cost of wings led to “boneless wings” innovation, which are made up of breast meat. This substitution effect over time is likely indicated by the information flow. The thigh market does not provide any information to the other markets in subperiod 1 but transmits information to the leg market in subperiods 2 and 3. Differences between leg and thigh prices widen after 2011 (spanning subperiods 2 and 3).
Contemporaneous casual relationships generated by DAG-Lingam for the three subperiods.
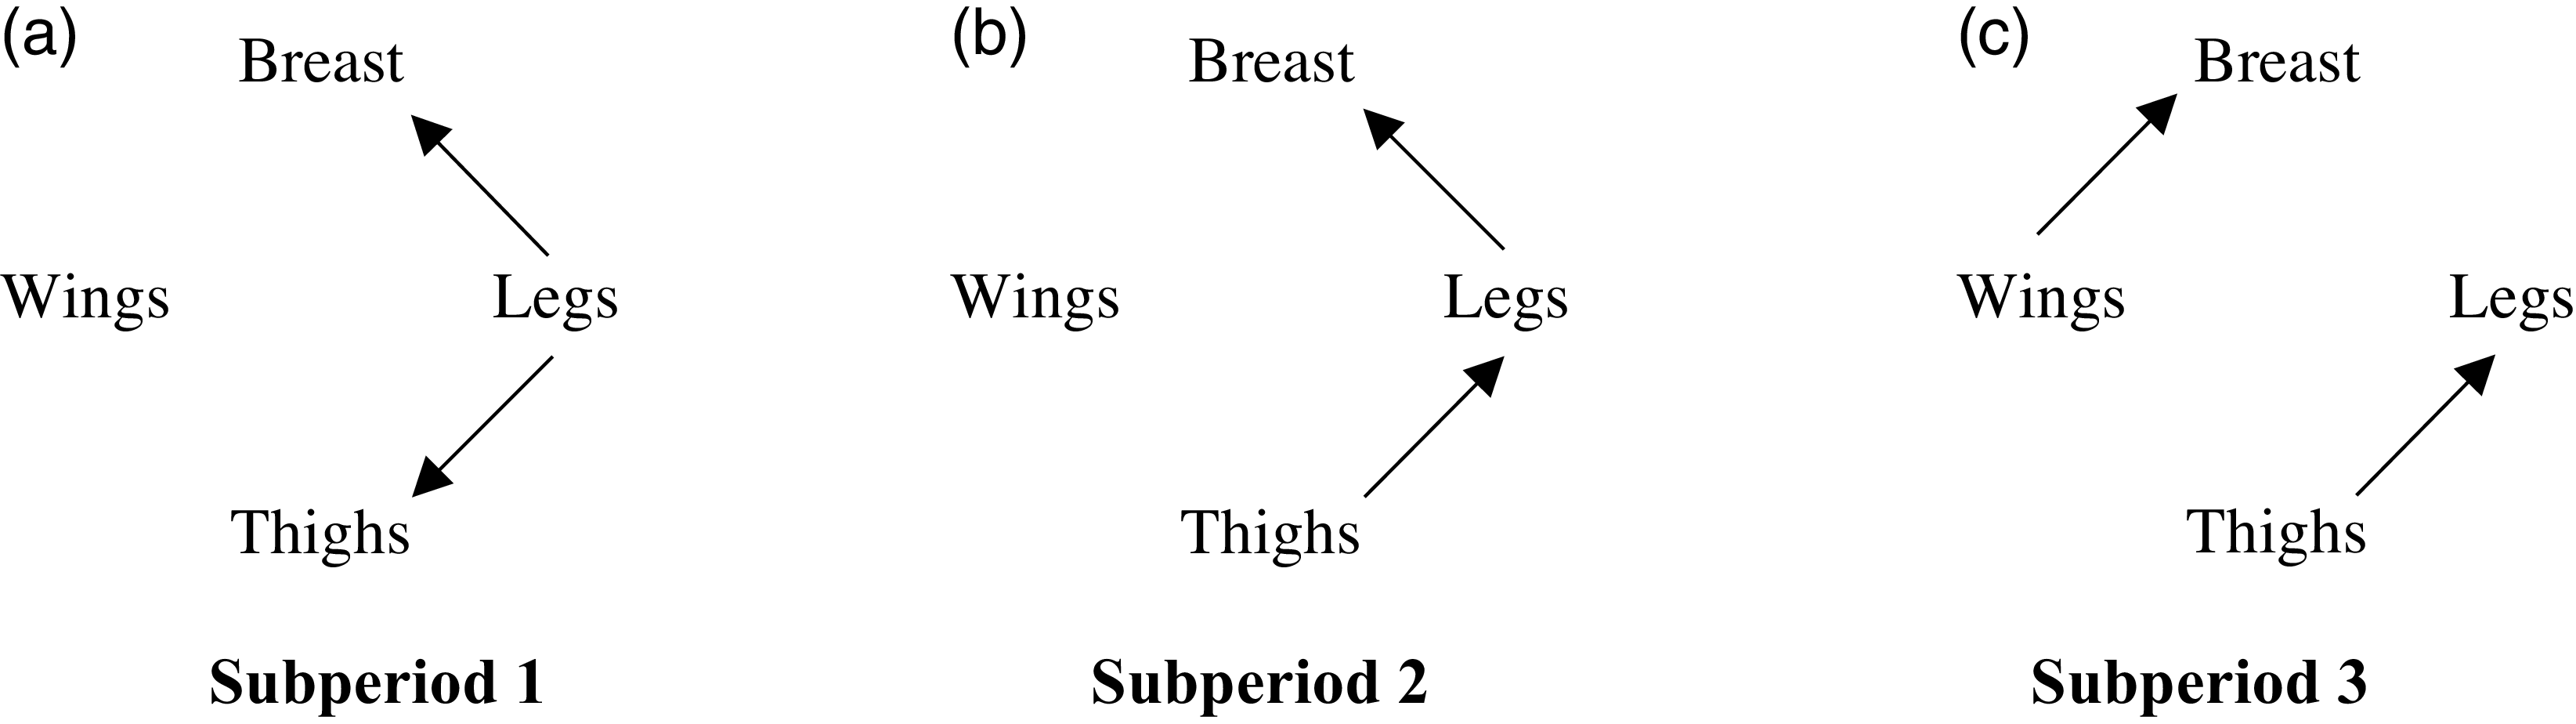
Across all subperiods, there is a lack of simultaneous information flow from white meats (breast and wings) to the dark meat markets (legs and thighs). Dark meat markets transmit information to both the white and dark meat markets in subperiods 1 and 2. However, in subperiod 3, both white and dark meat markets only share information within their respective categories.
4.4. IRFs
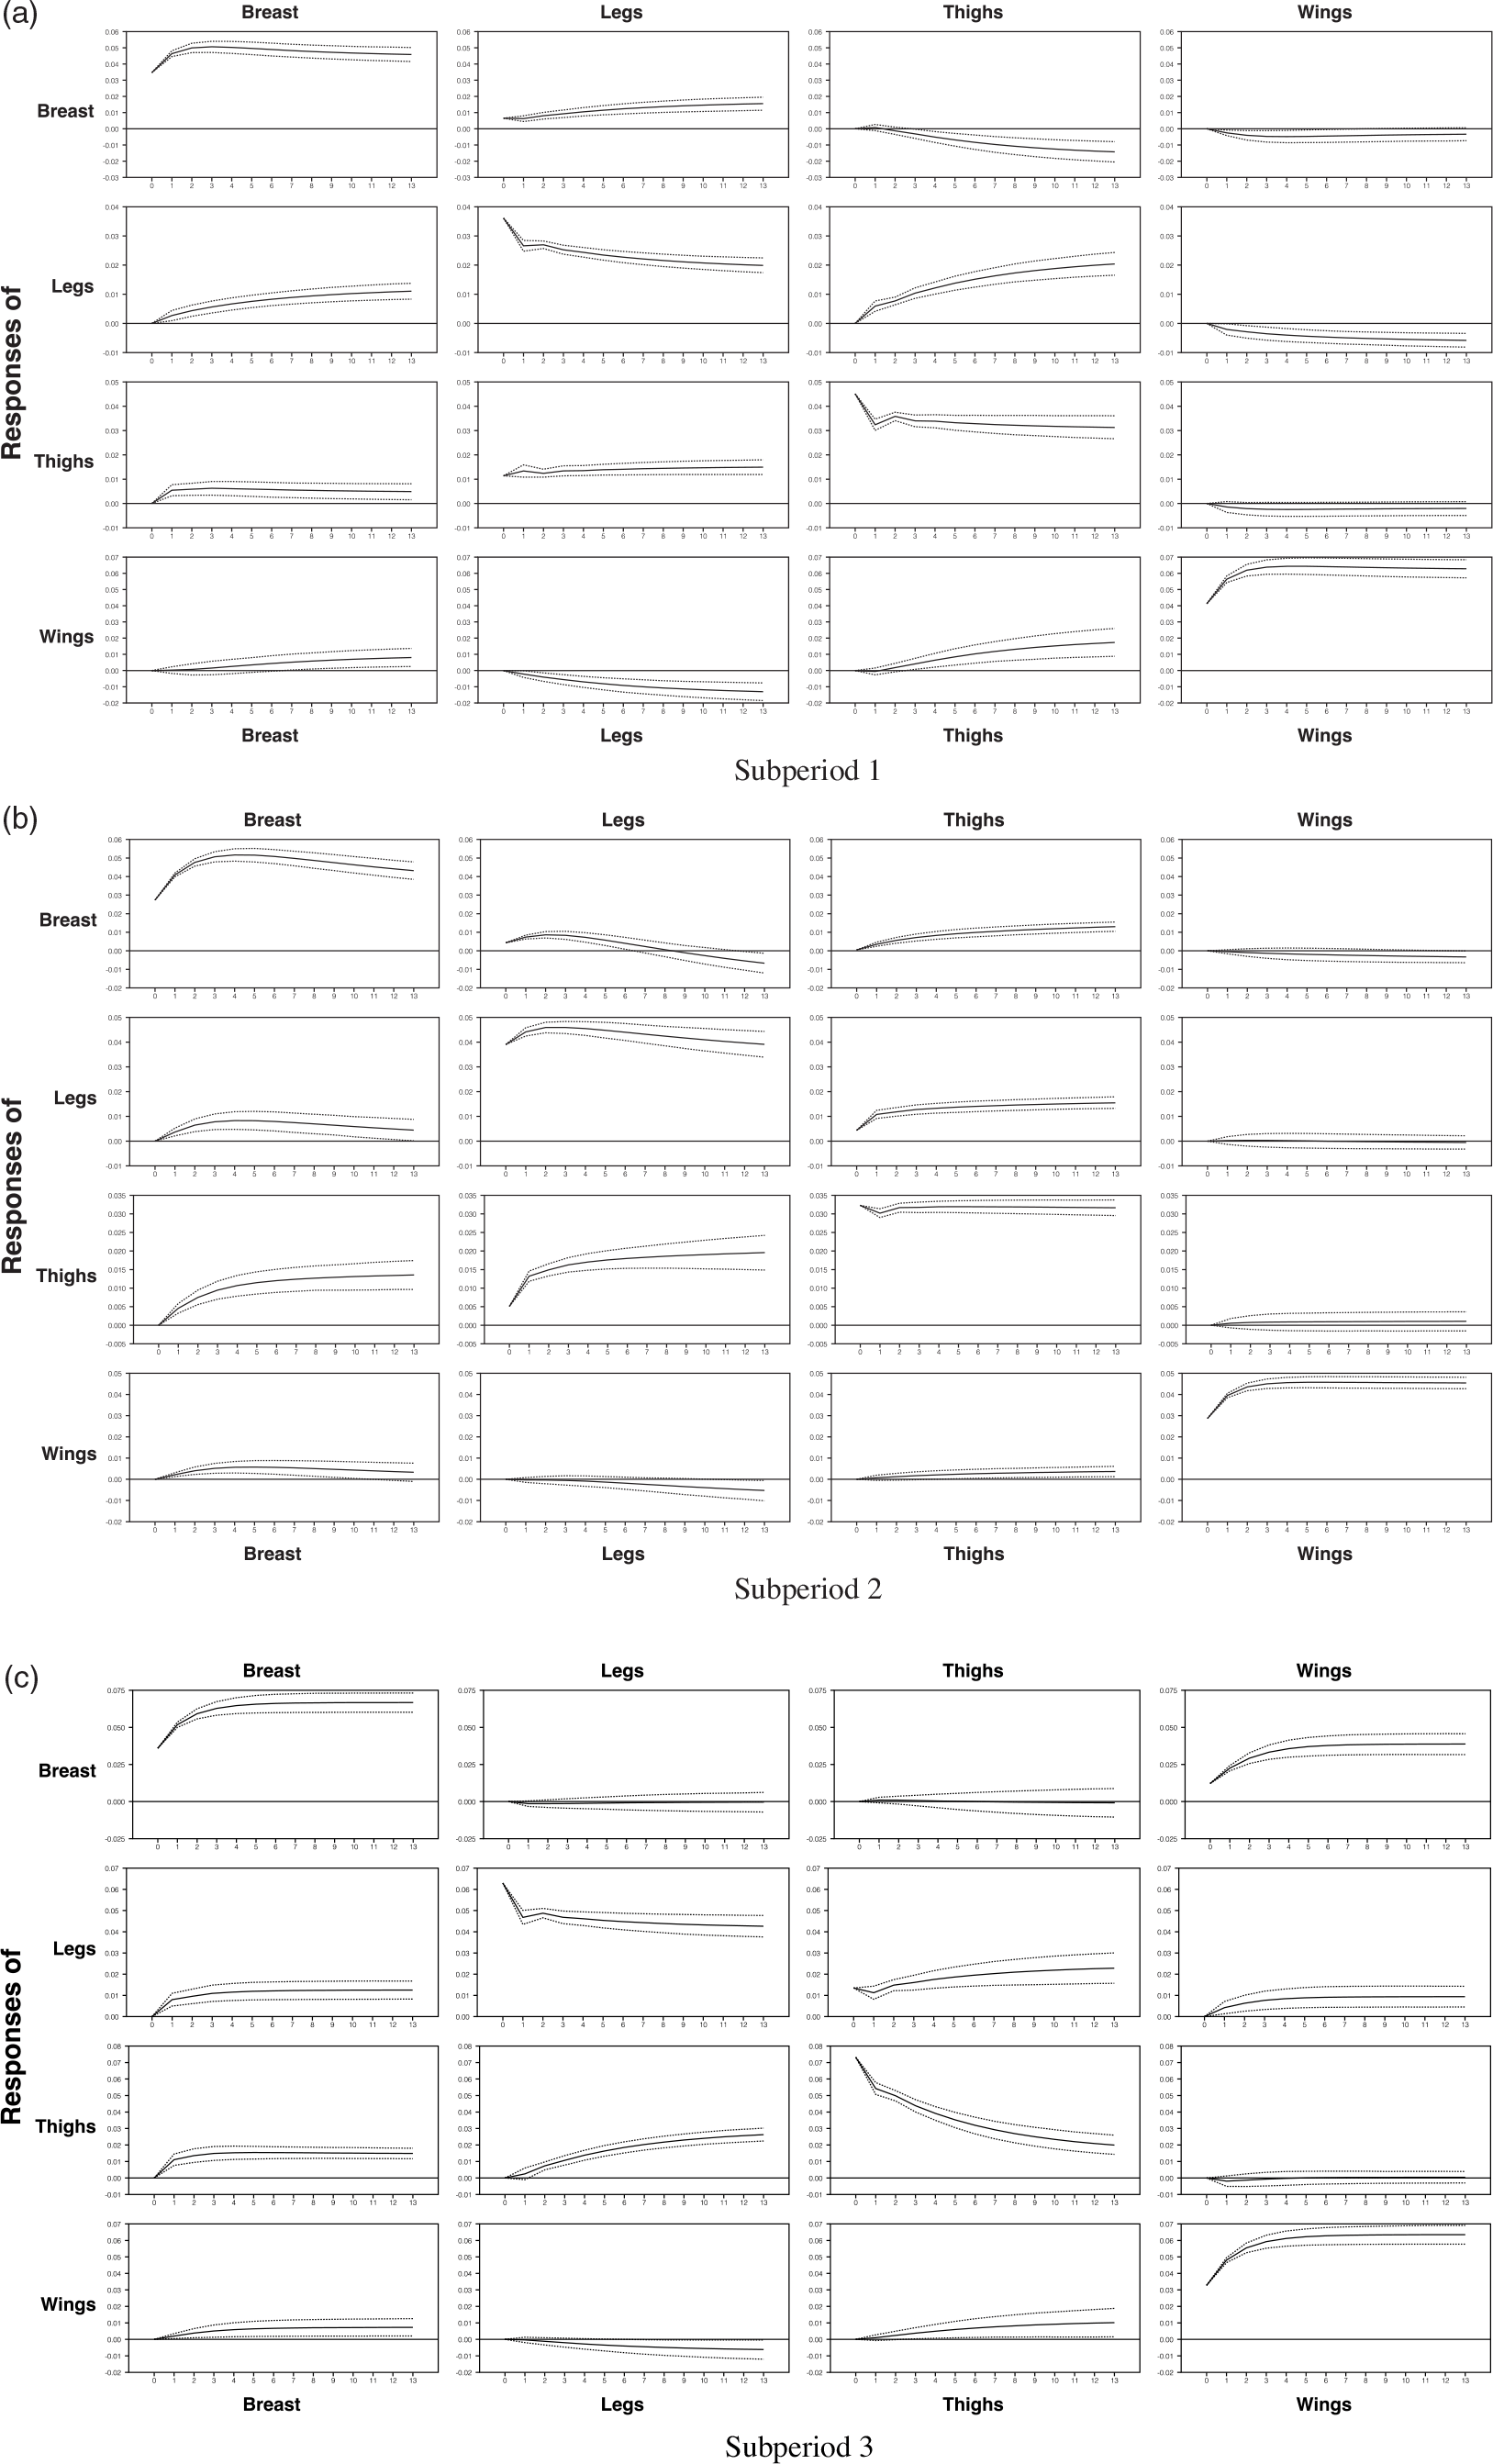
IRFs of 14 weeks (contemporaneous time and 13 weeks) (a quarter) are shown in Figure 5. Regardless of the subperiods, the four broiler cut markets respond positively and significantly to a shock in their own prices but respond relatively less to shocks in the other markets.
Breast price responds positively to a shock in the leg prices but negatively to shocks in the thigh and wing prices in subperiod 1. However, in subperiod 2, breast prices initially respond positively to a shock in leg prices, then turn negative after eight weeks. In subperiod 3, breast prices barely respond to shocks in the leg and prices markets but the reaction to a shock in the wing prices is larger compared to subperiods 1 and 2. Regardless of the subperiods, the leg, thigh, and wing prices respond positively to a shock in breast price.
Responses of the leg prices to a shock in thigh prices are positive in all three subperiods, but relatively small in subperiod 2 compared to subperiods 1 and 3. Leg prices respond negatively (positively) to a shock in wing price in subperiod 1 (3) and barely respond in subperiod 2.
Thigh prices respond positively to shocks in both breast and leg prices, with larger effects in subperiod 2 relative to subperiods 1 and 3. Further, thigh prices respond slightly negatively to a shock in wing prices in subperiod 1 but the respond in subperiods 2 and 3 is minimal. Except for itself, the responses of the wing price to shocks in the other three markets are very small in all three subperiods. In subperiod 3, it appears wings begin to play a more important role in affecting breast prices, as a shock in the wing price induces a relatively large impulse in breast prices.
Across all subperiods, the response of dark meat prices (legs and thighs) to shocks in dark meats themselves outweighs their response to shocks in white meat prices (breast and wings). Within the white meats, breasts emerge as more influential than wings, with a shock in breast prices resulting in a larger impact than a shock in wing prices.
Impulse response functions for the three subperiods. Note that upper and lower bounds are given by 0.16 and 0.84 quartiles.
4.5. FEVD
The FEVDs tell a similar story to the contemporaneous causal relationships and IRFs (Figures 6 and 7 – note the vertical axis starts at 60 for improved presentation). Relationships between white and dark meat parts are weaker than relationships within these two categories. Decompositions at each horizon give the percentage of price variation in each part that is due to innovations in each market, including itself, at time t (contemporaneous). Uncertainty in wing prices is primarily because of innovations of its own price over 93% in each subperiod. Variations in breast prices are primarily explained by its own price, but the variation explained by wing prices increases in period 3 with the importance of own price and legs and thighs decreasing. In subperiods 1 and 2 legs and thighs contribute to the variability in breast prices but in subperiod 3 their contribution becomes less than one percent.
Forecast error variance decompositions (FEVD) for white meat, breasts and wings by period for 15 weeks ahead. Note: The values for the vertical axis start at 60 to enhance the visibility of the bar chart.
Forecast error variance decompositions (FEVD) for dark meat, legs and thighs by period for 15 weeks ahead. Note: The values for the vertical axis start at 60 to enhance the visibility of the bar chart.
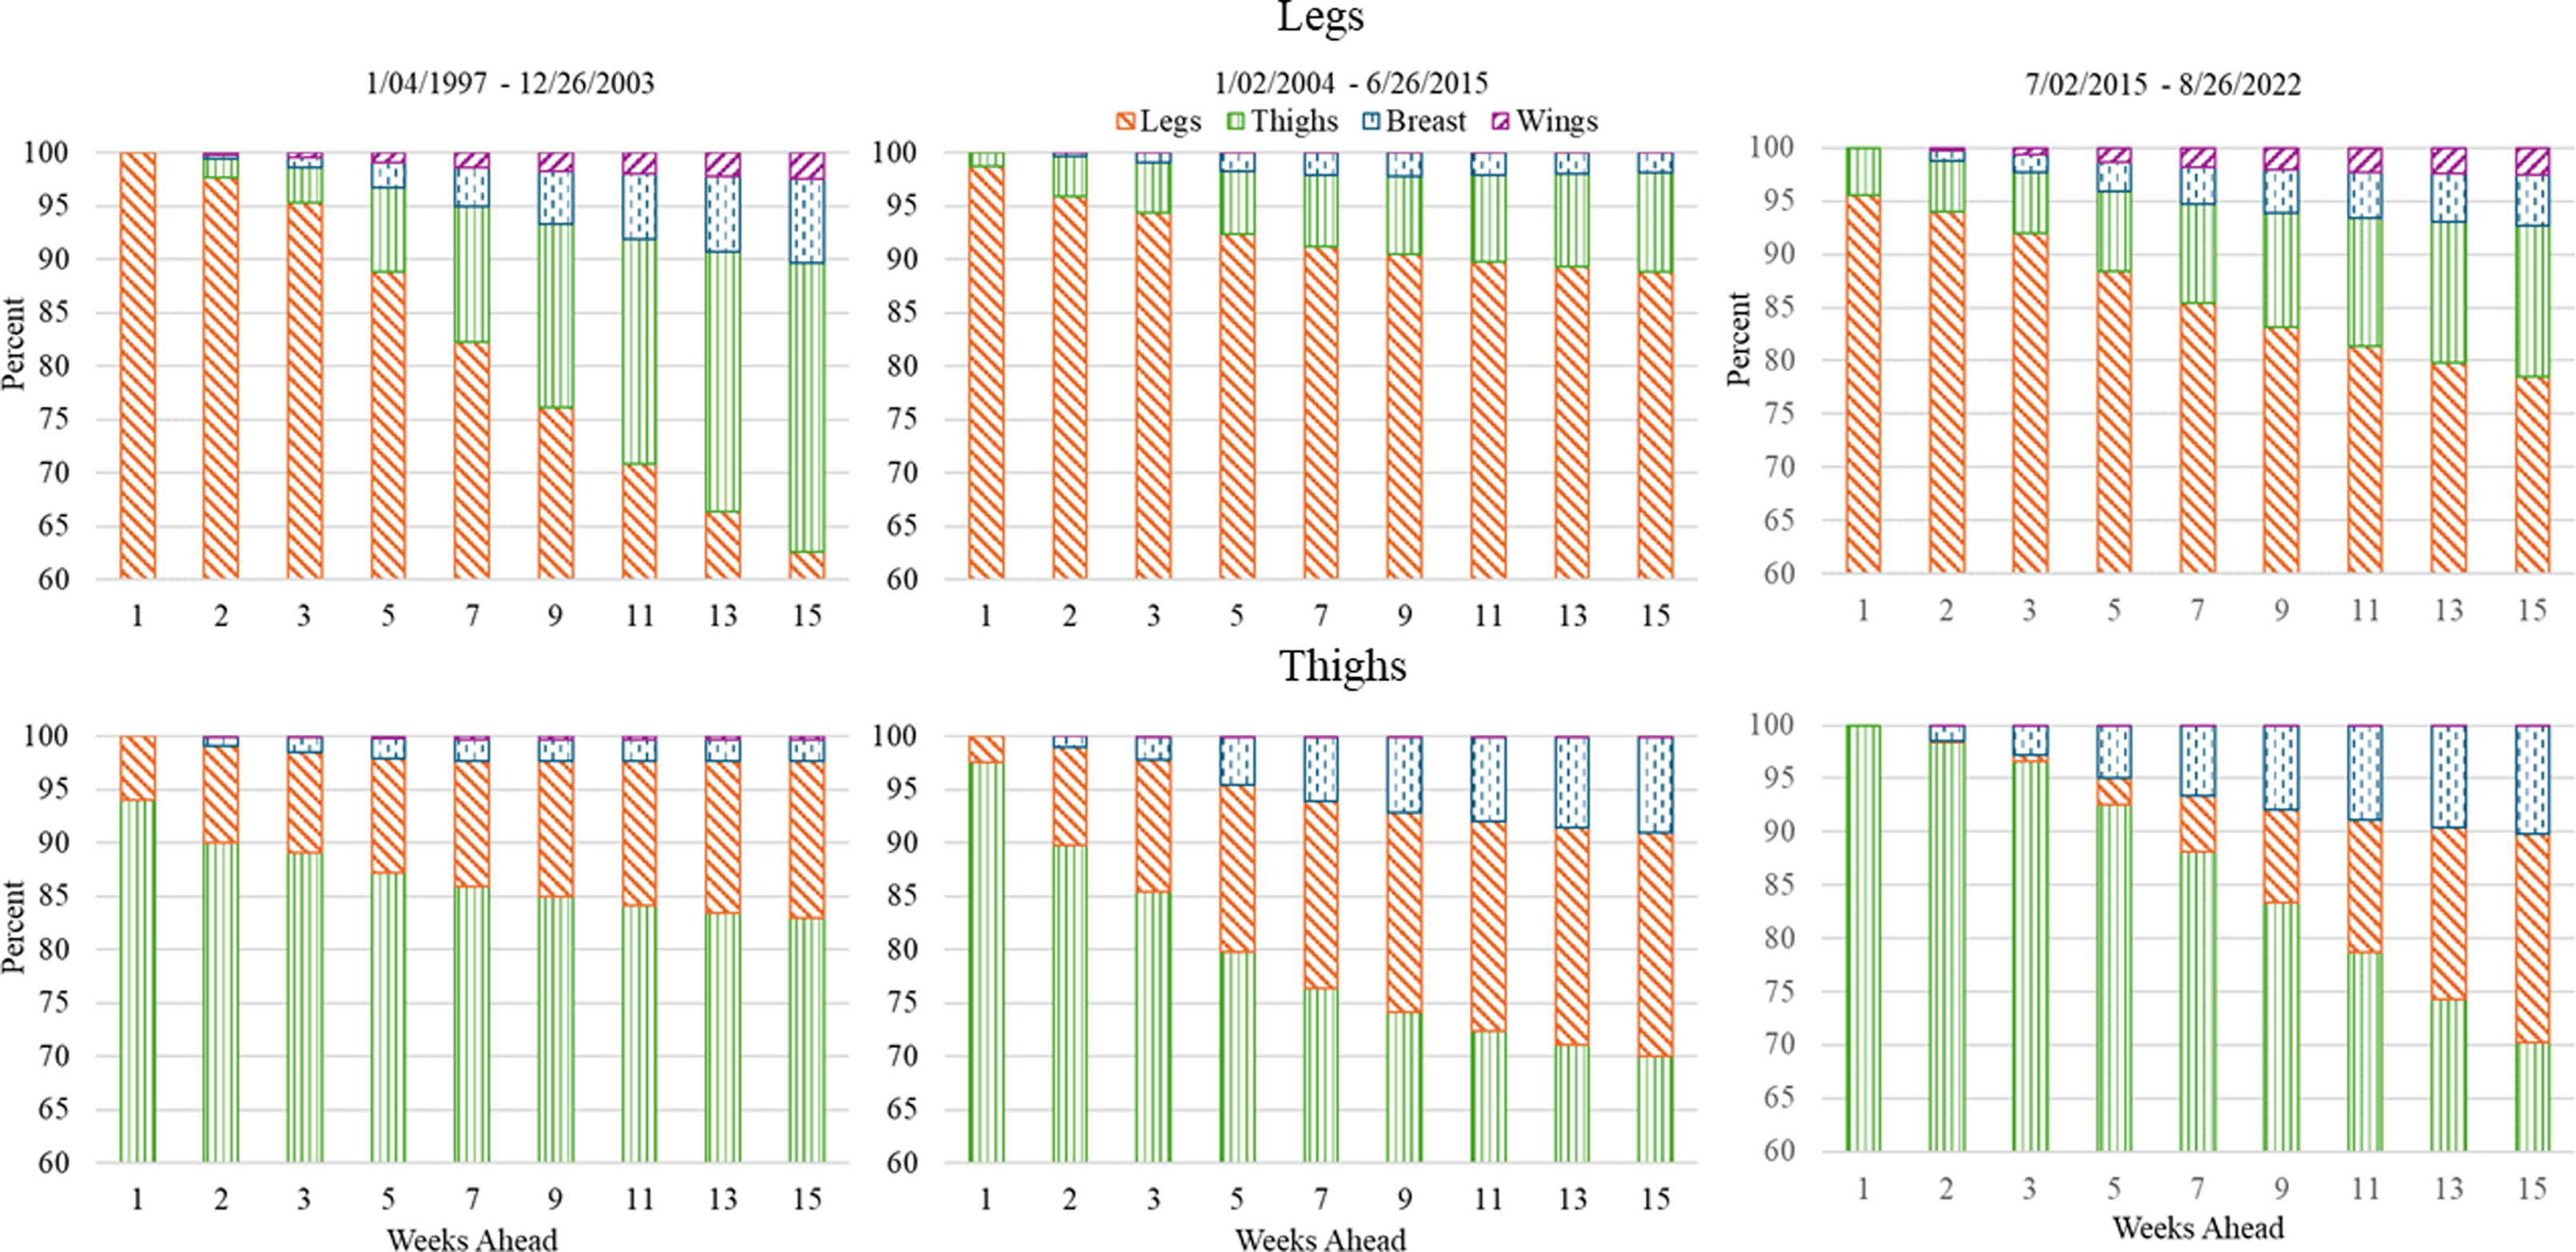
For dark meat, prices for legs, thighs, and breast help explain variation in prices for all subperiods but the percentages vary somewhat. Wing prices explain a small percentage of variation in leg prices in periods 1 and 3. Although all prices help explain variation in FEVDs, own price remains the most important price. Own price regardless of subperiod for dark meat cuts explains over 62% of the uncertainty is price.
5. Discussion
The analysis of broiler cut prices reveals significant insights into the price dynamics and inter-market relationships (each cut is considered a separate market). The price relationships between cuts change over time. Unlike previous studies that highlighted the importance of breasts in price discovery, this study reveals that the breast meat market acts consistently as an information sink across all subperiods, indicating it does not contemporaneously transmit information to other markets. The dark meat markets (legs and thighs), however, show information transmission to both white and dark meat markets in earlier subperiods, but this connectivity becomes more isolated within categories in later periods. Impulse response functions indicate that dark meat prices consistently respond more significantly to their own market shocks than to shocks from white meat prices across all subperiods. Within white meats, breast prices demonstrate greater influence than wing prices. Further, the forecast error variance decompositions show that the own price remains the dominant factor in explaining price uncertainty across all subperiods, with stronger relationships observed within white and dark meat categories rather than between them. This exogeneity of broiler cuts aligns with findings from McKenzie et al. (Reference McKenzie, Goodwin and Carreira2009).
These findings likely result from the distinct role each broiler part plays in the industry; white meats are predominantly consumed domestically, whereas dark meats are oriented towards export markets, but this may be changing. The exogeneity of wing prices probably arises from their specific culinary uses, limiting their direct relationships with other broiler cuts. Wing prices exhibit a “stand alone” nature, meaning that there is no substitute for a bone-in chicken wing. There is a boneless “wing” cut from the breast which capitalizes on the domestic consumer’s preference for white meat. The intra-category relationships can be attributed to the substitutability of these cuts in both consumption (influenced by consumer preferences) and processing contexts (there is some substitutability when cutting a bird by altering the amount of meat left on the breast or wings). Consumers who prefer dark meat typically do not substitute them with white meat, while health-conscious consumers rarely swap dark meat for white meat. For instance, when price of breasts increases, a health-conscious consumer tends to substitute breasts with wings, not legs nor thighs. However, in a restaurant setting wings are often fried with a sauce that could limit substitution for a health-conscious consumer. Boneless wings which are made from breast meat, instead of deboning chicken wings, are generally considered a close substitute for traditional bone-in wings in consumer preferences and culinary use. However, the substitutability in white meats is generally one way, breast can substitute for wings through boneless wings, but wings do not substitute for breasts. Substitutability in dark meats is more of a two-way street.
In the context of substitutability in processing, for example, when the price (or profitability) of boneless wings (made from breasts) is higher than that of bone-in wings, a processor may choose to process more breast meat for boneless wings instead of bone-in wings. There has been the introduction of new retail uses of dark meat. One such introduction is boneless thighs as an additional offering to wings, especially as wings became expensive in the wholesale and retail markets but, this innovation does not show up in price information flows between those cuts. As boneless thighs increase in popularity, further analysis on the relationships between cuts would be warranted.
This improved understanding of price variation and innovation impacts is crucial for market participants. They should understand the impact of price transmission and market shocks, recognizing that own price is the main driver of price variability. For example, a shock that affects breast meat prices will eventually influence the prices of wings due to the existence of cointegration. However, this impact may be minimal, as the own price is the primary driver of price variability. The effect on inter-market prices may be even smaller, given that stronger relationships are typically observed within categories rather than between them. Integrated companies, further processors (often the integrator), and other market participants will optimize their product offerings and marketing strategies to effectively respond to consumer preferences for both white and dark meat products. As noted, different size chickens in terms of the relative parts can be produced which affects costs. Participants do and can grow chickens of different size depending on the primary market. Further, the processing of chickens is affected by relative prices, as the amount of meat left on the breast or wing can vary depending on the price and intent of the cut.
Recognizing that stronger intra-category relationships and weaker inter-category relationships exist in broiler cut prices, integrated companies and processers implement targeted strategies to optimize pricing/marketing strategies and inventory management. For example, if demand for thighs increases, producers can slightly adjust prices for legs, given their stronger intra-category relationship, without significantly affecting white sales. They should also ensure adequate inventory of both thighs and legs to meet the increased demand. Additionally, if demand for wings increases during football season, sellers can raise wing prices without directly affecting leg and thigh prices. They could also offer promotions pairing wings with breasts to maximize white meat category sales. By leveraging these relationships, producers and sellers can fine-tune their strategies for greater profitability and customer satisfaction.
The lack of price information flows between some of the cuts suggests a lack of substitutability between cuts, especially from different categories – all chicken parts are not the same. Results highlight that chicken is not chicken but parts. That is, the perception of chicken as a singular category can be misleading in economic analysis. Instead, recognizing the diverse cuts of chicken can provide valuable insights for analyzing demand trends in other meats as well. It, for example, would be a worthwhile endeavor to analysis beef cuts in a similar fashion to the analysis conducted here. This result directed towards market analysts may be the more important finding. More comprehensive demand analyses of different meat cuts would be fruitful to the profession.
Data availability statement
Data and program are available from Kannika Duangnate.
Authors contribution
Conceptualization, K.D., J.W.M., and D.P.A.; Methodology, K.D. and J.W.M.; Formal Analysis, K.D.; Data Curation, K.D., J.W.M., and D.P.A.; Writing—Original Draft, K.D., and J.W.M.; Writing—Review and Editing, K.D., J.W.M., and D.P.A.; Supervision, NA; Funding Acquisition, NA.
Financial support
No funding was received.
AI was not used in any way in the generation of the paper.
Competing interests
The authors declare that they have no conflict of interest.
Ethical approval
This article does not contain any studies with human participants performed by any of the authors.


 Open access