





Introduction
In recent decades, the impact of agricultural intensification on biodiversity has gained attention (Dudley and Alexander, Reference Dudley and Alexander2017). Biodiversity underpins ecosystem stability and services, essential for the transition to sustainable agricultural production (Peterson et al., Reference Peterson, Allen and Holling1998; Altieri, Reference Altieri1999; Bommarco et al., Reference Bommarco, Kleijn and Potts2013). Among beneficial taxa, spiders (Araneae) are key generalist predators that contribute to natural pest regulation services (Nyffeler and Benz, Reference Nyffeler and Benz1987; Marc et al., Reference Marc, Canard and Ysnel1999; Cardoso et al., Reference Cardoso, Pekár, Birkhofer, Chuang, Fukushima, Hebets, Henaut, Hesselberg, Malumbres‐Olarte, Michálek, Michalko, Scott, Wolff and Mammola2025). However, they are strongly affected by agricultural intensification (Schmidt et al., Reference Schmidt, Roschewitz, Thies and Tscharntke2005; Prieto-Benítez and Méndez, Reference Prieto-Benítez and Méndez2011; Samu et al., Reference Samu, Szita, Botos, Simon, Gallé-Szpisjak and Gallé2023), which can reduce both their abundance and diversity.
Agro-ecology offers opportunities to counter these negative effects by restoring and maintaining biodiversity within production systems. Management practices such as maintaining semi-natural habitats at local and landscape scales (Rusch et al., Reference Rusch, Valantin-Morison, Sarthou and Roger-Estrade2010; Holland et al., Reference Holland, Bianchi, Entling, Moonen, Smith and Jeanneret2016; Betz and Tscharntke, Reference Betz and Tscharntke2017; Aguilera-Núñez, Reference Aguilera-Núñez2020), providing overwintering refuges (Sarthou et al., Reference Sarthou, Badoz, Vaissière, Chevallier and Rusch2014; Gallé et al., Reference Gallé, Császár, Makra, Gallé-Szpisjak, Ladányi, Torma, Ingle and Szilassi2018; Bannwart et al., Reference Bannwart, Gardarin and Petit2025), or increasing floral resources in margins or within fields (Sunderland and Samu, Reference Sunderland and Samu2000; Samu, Reference Samu2003; Schmidt et al., Reference Schmidt, Roschewitz, Thies and Tscharntke2005; Theron et al., Reference Theron, Gaigher, Pryke and Samways2020; Hatt and Döring, Reference Hatt and Döring2023) have all been shown to favour spider communities. Before such measures can be optimised, it is essential to establish how biodiversity is naturally structured and distributed across spatial and temporal scales in and around crop fields. Assessing the biotic and abiotic filters that shape community composition in fields and their margins is therefore required to understand their response to margin management and their dispersal capacities in agricultural landscapes. Because species differ in their responses to biotic and abiotic filters (Elmqvist et al., Reference Elmqvist, Folke, Nyström, Peterson, Bengtsson, Walker and Norberg2003; Mori et al., Reference Mori, Furukawa and Sasaki2013), and may present gender or phenological differences in their activity and feeding habits thus pest regulation potential (Framenau, Reference Framenau2005; Cuff et al., Reference Cuff, Tercel, Drake, Vaughan, Bell, Orozco‐terwengel, Müller and Symondson2022), evaluation of local and landscape drivers at population and species levels is needed.
Previous studies have examined spider distribution in winter wheat fields depending on organic vs. conventional farming (Boeraeve et al., Reference Boeraeve, Vialatte, Sirami, Caro, Thenard, Francis and Dufrêne2022), or evaluated multifactorial predictors including climate, landscape composition, and local margin types (Tougeron et al., Reference Tougeron, Couthouis, Marrec, Barascou, Baudry, Boussard, Burel, Couty, Doury, Francis, Hecq, Le Roux, Pétillon, Spicher, Hance and van Baaren2022; Henrard et al., Reference Henrard, Nève De Mévergnies and Servais2025). However, dynamic interactions between local and landscape factors across seasons have not been studied at the community and population levels in Belgian agro-ecosystems. We therefore propose to evaluate how spider distributions in crop or margin agro-ecosystem habitats are influenced by seasonality and landscape composition around these habitats. We expect spider diversity and abundance to be lower in fields than in margins in all seasons whatever the landscape composition, as fields are exposed to stronger disturbances (e.g. mechanisation, pesticide use) and may have lower resource (refuge, prey) availability than margins (Rusch et al., Reference Rusch, Birkhofer, Bommarco, Smith and Ekbom2014; Jacobsen et al., Reference Jacobsen, Moraes, Sørensen and Sigsgaard2019, Reference Jacobsen, Sigsgaard, Johansen, Thorup-Kristensen and Jensen2022; Wan et al., Reference Wan, Fu, Dainese, Kiær, Hu, Xin, Goulson, Woodcock, Vanbergen, Spurgeon, Shen and Scherber2025). Edge effects may also occur, where the interface between the crop and semi-natural margins creates an ecotone that supports higher species richness through the coexistence of both field-dwelling and edge-specialist species (Duelli et al., Reference Duelli, Studer, Marchand and Jakob1990; Samu et al., Reference Samu, Sunderland and Szinetár1999). Seasonal dynamics are also predicted to structure spider distributions through phenology, with sexes and life stages showing distinct patterns across the growing season (Schaefer, Reference Schaefer1977, Reference Schaefer and Nentwig1987; Pekár, Reference Pekár1999). Finally, as in other taxa, spider richness and density are expected to be lower in landscapes dominated by crops, which provide fewer resources and more disturbances than natural habitats (Schmidt et al., Reference Schmidt, Roschewitz, Thies and Tscharntke2005; Prieto-Benítez and Méndez, Reference Prieto-Benítez and Méndez2011; Plath et al., Reference Plath, Rischen, Mohr and Fischer2021; Samu et al., Reference Samu, Szita, Botos, Simon, Gallé-Szpisjak and Gallé2023).
In summary, the objective of this study is to assess how local and landscape factors shape ground-dwelling spider communities and their populations across seasons in Belgian cereal fields. We hypothesise that (i) margin habitats will host the highest spider diversity and activity-density, with patterns depending on species, sex, life stage, and season, and that (ii) increasing agricultural intensity at the landscape scale will negatively affect spider communities in all seasons.
Material and methods
Sampling sites
The study was conducted in 10 farms spread across the three Belgian provinces of Namur, Hainaut, and Liège in 2023 and 2024, which are characterised by a temperate oceanic climate (table 1). The targeted fields grew winter cereals (wheat and barley) in conventional farming systems (Supplementary Table S1). Each farm consisted of one, two, or three fields managed by the same farmer. Margins of selected fields were always composed of the following four strips: a grass strip, a combined grass and flower strip, a hedge strip, and a combined hedge and flower strip. Cereal types had different sowing and harvest dates. Indeed, winter barley is sown in September, while winter wheat is sown from October to December (Table S1). Each field was sampled three times (see below), with the date of the first sampling (autumn) depending on the type of cereal grown (table 1).
Average temperatures and precipitation of sampling localities, from 1991 to 2020 (IRM – meteo.Be)

Note: Autumn samplings were done at different times due to cereal type (wheat or barley). Sampling took place within the same week for spring (April) and summer (June) respectively.
Sampling design
To capture the ground-dwelling spiders, pitfall traps were used across the three sampling sessions during the cereal growing season. The traps were activated in autumn (24/10/2023–07/12/2023), in early spring (09/04/2024–12/04/2024), and in late spring (17/06/2024–21/06/2024). For the purpose of this study, these sessions are referred to as the ‘autumn’, ‘spring’, and ‘summer’ sampling periods, respectively. The pitfall traps, which were 9 cm in diameter, were filled with 0.2 L salted water (50 g/L) and odourless soap (three drops per liter) per trap. They were driven into the ground by digging a hole with an auger, so that the edge was flush with the surface. Wire mesh was placed over the traps to prevent rodents from falling into them.
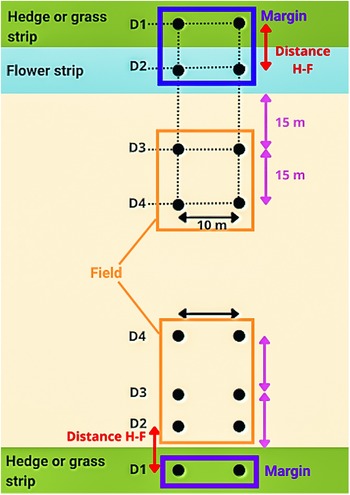
In each field and for each of the four margin types, pitfall traps were placed at four different positions from the edge towards the field centre. At each of these distances, two traps were placed 10 m apart. The first distance (D1) was located either in the hedge (20 cm inside the hedge, starting from the outermost branches) or in the grass margin (50 cm from the crop edge, or in the middle of the grass margin, if it was less than 1 m wide). The second distance (D2) was located in the centre of the flower strip (where present). In fields without flower strips, D2 was placed within the field at a distance from the edge equivalent to the width of a standard flower strip (see fig. 1 for the H-F reference). The third and fourth distances (D3 and D4) were always in the field, located 15 and 30 m from the field edge, respectively (fig. 1). In total, there were 8 pitfall traps per field for each of the four margin types, to a total of 32 individual traps per field. This study focuses on the difference between margin and field spider distribution and composition, therefore we pooled together traps from the different margins (positions D1 and D2 if a flower strip), and traps from the field (positions D3, D4, and D2 if within field) (fig. 1). Due to logistical constraints, agricultural operations, and environmental factors (e.g. flooding), sampling effort was unbalanced. Out of a total 960 theoretical traps, 601 (62.6%) were successfully processed. Traps were aggregated into a total of 207 sampling units based on site, habitat, and season (Supplementary Table S2). This yielded 53 sampling units in autumn (30 margin, 23 field), 79 in spring (40 margin, 39 field), and 75 in summer (37 margin, 38 field). After 1 week, the traps were retrieved and transported to the laboratory for analysis. The contents were emptied onto a sieve (0.5 mm mesh), and the spiders were separated from the other organisms. The spiders from each pitfall trap were preserved in glass jars with 70% ethanol and labelled with a unique code.
Experimental sampling design for each farm. D1, D2, D3, and D4 represent the four different distances for each type of strip with two traps at each distance. The ‘margin position’ groups all traps placed in the hedge (D1), the grass (D1), and the flower strips when present (D2). The ‘field position’ groups all traps from D3 and D4 distances, as well as traps from the D2 distance when no flower strip was present.

Spider identification and metrics
Spiders were identified by Arnaud Henrard, Jaime Escobar-Toledo, Johan Van Keer, and Rudy Jocqué, all Belgian spider specialists and members of Arachnologia Belgica (ARABEL), the Belgian Arachnological Society. Specimens were determined morphologically to species level whenever possible, or otherwise to genus or family level. Immatures that could not be determined to a species were dropped from the analysis. The complete species list, together with rarity status in Belgium and associated metadata, is presented in Henrard et al. (Reference Henrard, Nève De Mévergnies and Servais2025). Spider-specific richness as well as their abundance in each trap were compiled from the field samples. The sex of the adult spiders was established, and immatures were kept the analysis with as a level ‘immature’ in the term ‘Sex’. Because capture rates in passive pitfall traps depend both on the number of individuals present and their movement frequency, the results are expressed as activity-density, which records individuals per trap per sampling period. This metric provides a relative measure of population activity and abundance rather than an absolute density per unit area (Lang, Reference Lang2000).
Landscape metric
At each field and for each type of margin, the proportion of the annual crop cover surrounding the first edge position (D1, fig. 1) in a circular buffer was compiled from Eurostat’s Land Use and Coverage Area Frame Survey in 2022 (European Commission JRC, 2022; Ghassemi et al., Reference Ghassemi, Izquierdo-Verdiguier, Verhegghen, Yordanov, Lemoine, Moreno Martínez, De Marchi, van der Velde, Vuolo and d’Andrimont2024). Sentinel-1 and Sentinel-2 satellite imagery associated with a random forest machine learning approach allowed a 10-m resolution map with 79.3% precision for major land cover classes across the 27 EU countries (European Commission JRC, 2022). Landscape metrics from the 2022 data remained constant across all three sampling sessions. To characterise the landscape context of each study site, we calculated the mean proportion of annual crop cover within a 500 m radius by averaging the values from all trap positions (D1–D4) within each field. This site-level landscape metric was then assigned to all corresponding sampling units (both margin and field) within that site.
Statistical analysis
All analyses were done in R version 4.5.0 (R Core Team, 2022) using the RStudio interface (Posit Team, 2024).
Quantitative analysis: inferential GLM on spider metrics
We used generalised linear models (GLMs) from the package glmmTMB (Magnusson et al., Reference Magnusson, Skaug, Nielsen, Berg, Kristensen, Maechler, van Bentham, Bolker and Brooks2017) to evaluate how habitats across seasonal and landscape contexts affected spider distribution in cereal crop fields. A first model was used to evaluate spider activity-density (Equation 1), with explanatory variables being the sex of the spider with three levels (male, female, or immature), the field sampling position with two levels (margin or field) (fig. 1), the season with three levels (autumn, spring, and summer), and a continuous landscape metric that was the proportion of annual crop cover at 500 m around the field margin sampling point of the spiders. This model was parameterised to test for the main effects of these explanatory variables, as well as their two- or three-way interactions with spider sex.
 \begin{align}
& Spider{\text{ }}activity\,-\,density \sim Sex{\text{ }}or{\text{ }}life{\text{ }}stage \nonumber\\
&\quad \times\,\,\left( {Field{\text{ }}position \times Season{\text{ }} \times Annual{\text{ }}crop{\text{ }}cover} \right) + (1|Farm)
\end{align}
\begin{align}
& Spider{\text{ }}activity\,-\,density \sim Sex{\text{ }}or{\text{ }}life{\text{ }}stage \nonumber\\
&\quad \times\,\,\left( {Field{\text{ }}position \times Season{\text{ }} \times Annual{\text{ }}crop{\text{ }}cover} \right) + (1|Farm)
\end{align} \begin{align}
Spider{\text{ }}richness & \sim \left( {Field{\text{ }}position \times Season \times Annual{\text{ }}crop{\text{ }}cover} \right) \nonumber\\
&\quad + (1|Farm)
\end{align}
\begin{align}
Spider{\text{ }}richness & \sim \left( {Field{\text{ }}position \times Season \times Annual{\text{ }}crop{\text{ }}cover} \right) \nonumber\\
&\quad + (1|Farm)
\end{align} \begin{align}
Spider{\text{ }}& activity - density \sim Spider{\text{ }}species{\text{ }}:Sex{\text{ }}or{\text{ }}life{\text{ }}stage{\text{ }}: \nonumber\\
&\quad \left( {Field{\text{ }}position + Annual{\text{ }}crop{\text{ }}cover} \right){\text{ }} + (1|Farm)
\end{align}
\begin{align}
Spider{\text{ }}& activity - density \sim Spider{\text{ }}species{\text{ }}:Sex{\text{ }}or{\text{ }}life{\text{ }}stage{\text{ }}: \nonumber\\
&\quad \left( {Field{\text{ }}position + Annual{\text{ }}crop{\text{ }}cover} \right){\text{ }} + (1|Farm)
\end{align}A second model was then fitted to assess spider richness, which included all explanatory variables and their interaction rationale used for the spider activity-density model, except for the spider sex (Equation 2). Lastly, a third model (Equation 3) was used to evaluate spider-specific distributions for the six most abundant spider species depending on their sex, the season, the field sampling position and the proportion of annual crop cover at 500 m around the fields. For Equation 3, the immatures were dropped from the analysis due to missing data for the majority of the six most abundant species. For all models, we implemented the farm as a random factor on the intercept, this to focus on the specific interactions between local habitats (margin vs. field) and the landscape annual crop cover factors on spider metrics. All models were fitted with a negative binomial distribution due to overdispersion of the spider metrics. Also, because sampled spiders were pooled together depending on their positions in the margin or within the field and because some traps were lost or not useable due, for instance, to flooding, final sampling effort was unbalanced. This was considered by implementing the number of traps as an offset term in the spider activity-density models. The natural logarithm of the number of used pitfall traps per sampling unit was used to match the log-link of the negative binomial model (log(number of traps)). This approach standardises the response, resulting in comparable spider metrics per trap at each farm, season, and field sampling position even with unbalanced designs. Similarly, average activity-densities per trap are presented in the figures. Model diagnostics were performed to validate assumptions and assess model fit. Residual distributions and dispersion were checked using DHARMa (Hartig, Reference Hartig2017) simulation-based diagnostics. Multicollinearity among predictors was evaluated through variance inflation factors, and model explanatory power was summarised with marginal and conditional R 2 estimates. Goodness-of-fit and overdispersion were inspected with the performance package (Lüdecke et al., Reference Lüdecke, Ben-Shachar, Patil, Waggoner and Makowski2021). Significance of model predictors was evaluated using a Type II Wald χ2 test implemented in the Anova() function from the car package. To interpret significant main and interaction effects, we computed estimated marginal means and conducted pairwise post hoc contrasts using the emmeans package (Lenth, Reference Lenth2024). Significant pairwise contrasts between factors were reported and presented in the figures to disentangle the direction and strength of specific main and interactive effects. Concerning the interaction between factors and continuous variables, we evaluated and reported significant slope deviations from zero using the emtrends function from the emmeans package. Significant differences in spider activity-density were only reported for different spider sex or life stage within the same season.
Qualitative analysis: Non-metric multidimensional scaling analysis (NMDS) and PERMANOVA spider community composition analysis
We first assessed whether the multivariate dispersions (i.e. the variance in community composition) were homogeneous among groups for the season, farms, and field position using the function betadisper and permutation tests from the package vegan (Oksanen et al., Reference Oksanen, Kindt, Legendre, O’Hara, Simpson, Stevens, Wagner and Solymos2008). Then, we performed a permutational multivariate analysis of variance (PERMANOVA) using a Bray–Curtis dissimilarity matrix of Hellinger-transformed spider community data. Terms included in the model were the field position, season, proportion of annual crops at 500 m around the fields, the farm and their interactions.
Results
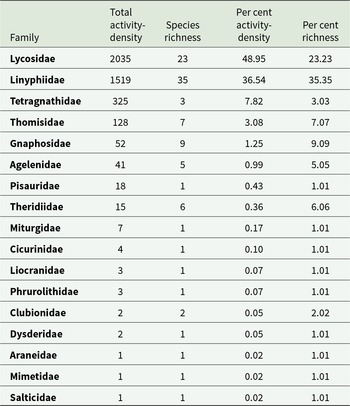
In total, 4890 individual spiders were collected, but 733 immatures were discarded from the study due to taxonomic uncertainties. Therefore, 4157 individual spiders of 99 species belonging to 17 families and 61 genera were identified and used for analysis (Henrard et al., Reference Henrard, Nève De Mévergnies and Servais2025; Supplementary Table S3). The family Lycosidae presented the highest activity-density with 2035 individuals (∼49% of the total individuals sampled) and the second highest species-rich family with 23 species (∼23% of the total species recorded) (table 2). The Linyphiidae came second in terms of activity-density (1519 individuals, ∼37%) and first regarding species richness (35 species, ∼35%). In terms of species, Pardosa pullata (Clerck, 1757) (Araneae: Lycosidae) dominated the overall community with 584 (∼14% of the total activity-density) individuals, followed by Centromerita bicolor (Blackwall, 1833) (Araneae: Linyphiidae) with 405 (∼10%) individuals and Oedothorax apicatus (Blackwall, 1850) (Araneae: Linyphiidae) with 308 (∼7%) individuals. Next came Pachygnatha degeeri Sundevall, 1830 (Araneae: Tetragnathidae) with 307 individuals (∼7%), Trochosa ruricola (De Geer, 1778) (Araneae: Lycosidae) with 297 individuals (∼7%) and Pardosa palustris (Linnaeus, 1758) (Araneae: Lycosidae) with 240 individuals (∼6%) (Table S3). The sampled community included 32 singletons (species represented by only one individual), representing around 32% of the total species recorded.
Overview of the spider families classified per total and relative (per cent) activity-density and species richness

Quantitative spider metrics analysis
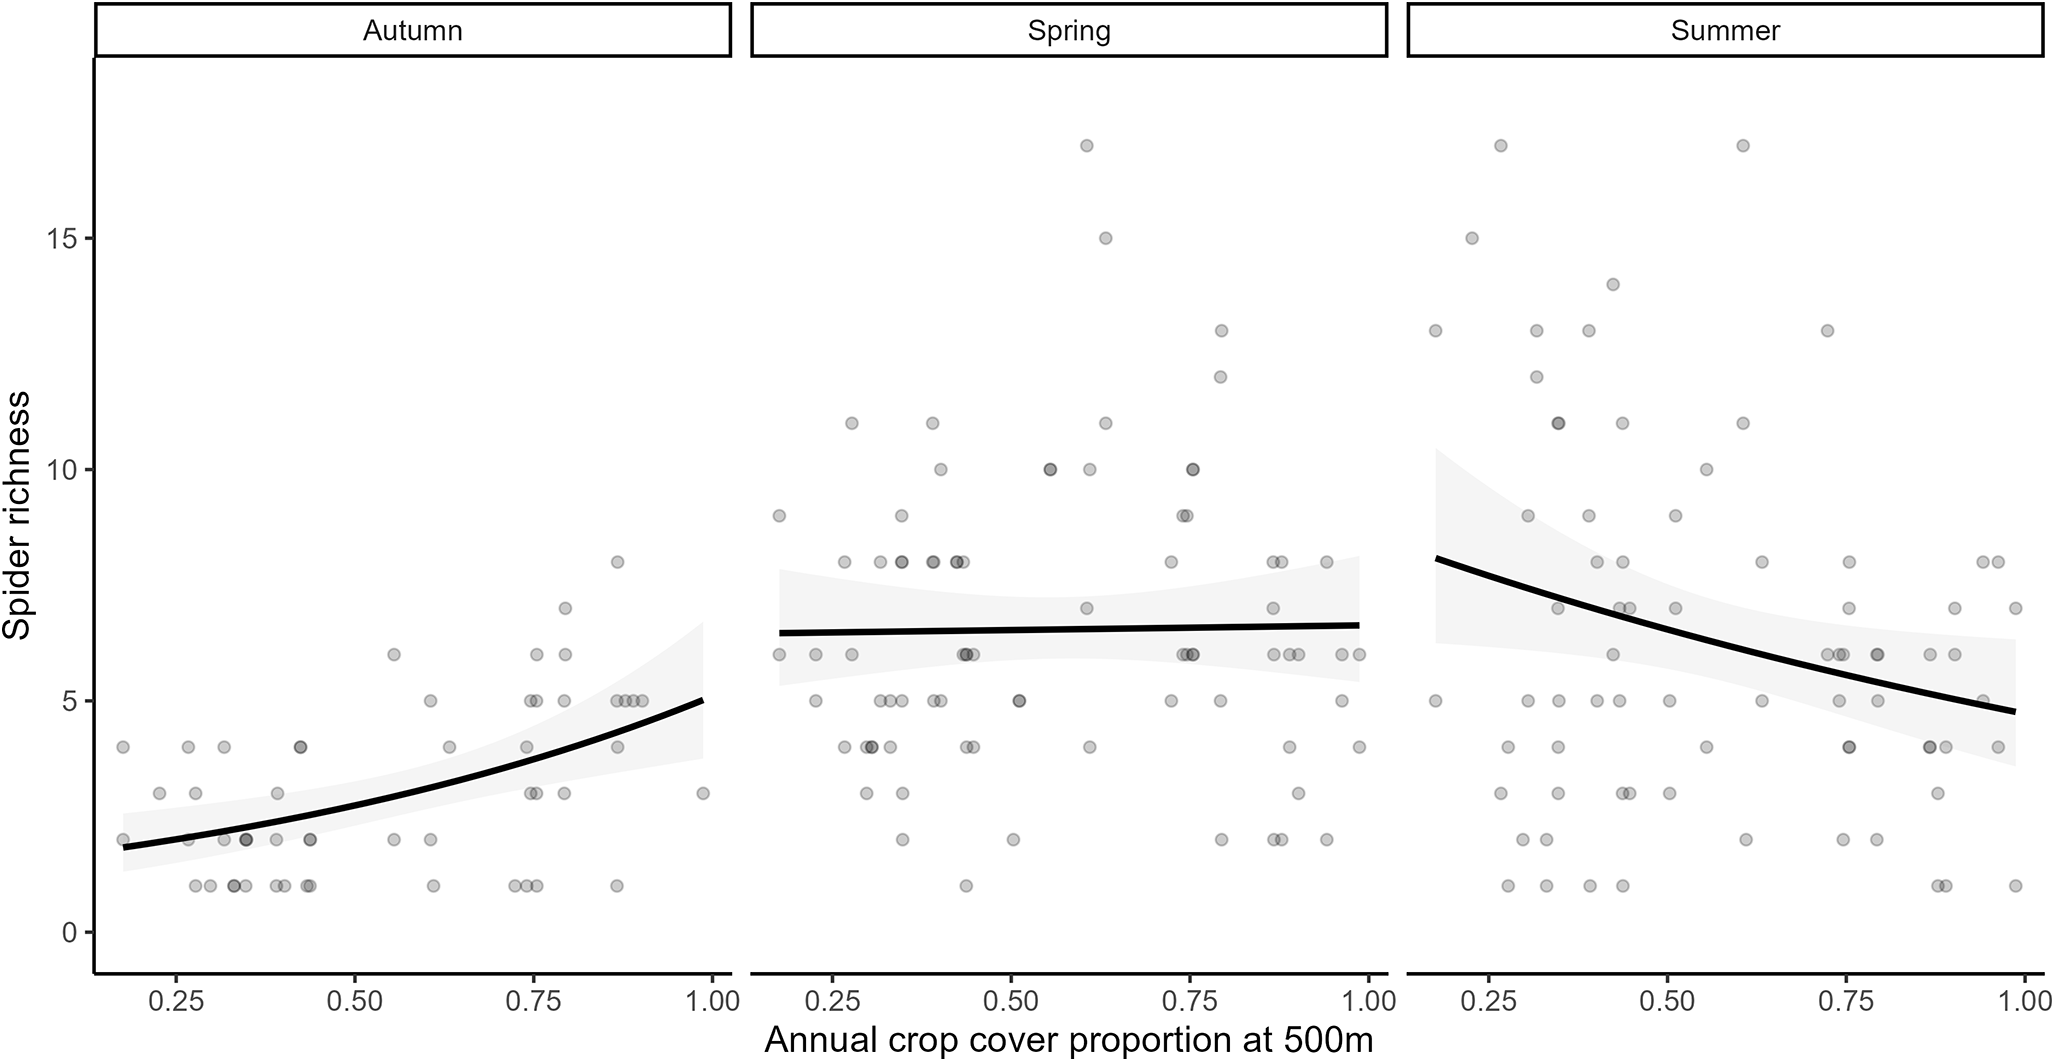
Spider species richness was significantly affected by the season (Supplementary Fig. S1A, GLM, χ2 = 61.95, df = 2, p < 0.001). Although more spider species were found in the margin (87 species) than within the crop fields (65 species), the main effects of the sampling position and the surrounding annual crop cover were not significant on spider richness. Their interaction with each other or with season was also non-significant, except for the interaction between season and annual crop cover (fig. 2, Season × Annual crop cover, χ2 = 19.44, df = 2, p < 0.001). Post hoc pairwise contrasts (Wald z-tests with Tukey adjustment) indicated that autumn samples had lower spider species richness (Fig. S1A, on average 3.06 species per trap, 31 species in total) than both spring (6.54 species per trap, 55 total, estimate = −0.82 ± 0.10 standard error (SE), z = −8.02, p < 0.001) and summer (6.32 species per trap, 68 total, estimate = −0.77 ± 0.10 SE, z = −7.48, p < 0.001) samples. Spring and summer spider richness did not differ significantly from each other. In autumn, higher annual crop cover had a significant positive effect on spider richness (slope estimate = 1.27 ± 0.45 SE, z = 2.82, p = 0.005), while the effect was neutral in spring (estimate = 0.04 ± 0.30 SE, z = 0.14, p = 0.89) and in summer the effect was significantly negative (estimate = −0.63 ± 0.31 SE, z = −1.99, p = 0.047).
Spider species richness in relation to the proportion of annual crop cover within 500 m across seasons. Points represent raw data; fitted lines show the predictions from the negative binomial GLM.

Spider activity-density differed significantly according to sex or life stage (fig. 3A, GLMM, χ2 = 519.34, df = 2, p < 0.001), field sampling position (fig. 3B, margin vs. field, χ2 = 62.61, df = 1, p < 0.001), and season (fig. 3C, χ2 = 28.48, df = 2, p < 0.001). The interaction between sex or life stage and season (fig. 3A, χ2 = 9.88, df = 4, p = 0.043), and between season and annual crop cover (fig. 3C, χ2 = 31.46, df = 2, p < 0.001) also significantly affected spider activity-density. Post hoc pairwise contrasts indicated that there were always more spiders sampled in the margin (average 85.38 per trap, total 2476) than in the field (average 60.04 per trap, total 1681; estimate = 1.16 ± 0.39 SE, z = 3.00, p = 0.003). Overall, more males were sampled than females and immatures. In autumn, males showed higher activity-density (average 8.96 males per trap, total 474 individuals) than females (average 2.92 per trap, total 155; estimate = 1.10 ± 0.19 SE, z = 5.73, p < 0.001) and immatures (average 0.25 per trap, total 13; estimate = 3.25 ± 0.34 SE, z = 9.51, p < 0.001). In spring, males (average 16.70, total 1319) had significantly more activity-density than in autumn and remained more abundant than females (average 7.54, total 596; estimate = 1.72 ± 0.18 SE, z = 9.83, p < 0.001) and immatures (average 0.13, total 10; estimate = 6.41 ± 1.66 SE, z = 3.86, p = 0.004). Females in spring were significantly more abundant than in autumn. In summer, the pattern repeated with males (average 14.70, total 1102) dominating, with significantly higher activity-density than females (average 6.29, total 472, estimate = 0.88 ± 0.13 SE, z = 7.03, p < 0.001), themselves with higher activity-density than immatures (average 0.24, total 18; estimate = 3.44 ± 0.36 SE, z = 9.45, p < 0.001). Males also showed significantly more activity-density than immatures (estimate = 4.31 ± 0.36 SE, z = 11.94, p < 0.001). Both males and females did not present significant differences in their activity-density between spring and summer samples. Season also affected the relationship between annual crop cover at 500 m and spider activity-density (fig. 3C). In autumn, higher annual crop cover tended to increase spider activity-density, although only marginally (slope = 1.23 ± 0.64 SE, z = 1.92, p = 0.055). In spring, the effect was neutral non-significant (slope = 1.78 ± 1.73 SE, z = 1.03, p = 0.304), while in summer it was negative, but also non-significant (slope = –0.90 ± 0.62 SE, z = –1.47, p = 0.142).
Spider activity-density depending on (A) their sex or life stage in each season, (B) sampling position (margin vs. field), and (C) the interaction between season and the proportion of annual crop cover within 500 m of the fields. Different uppercase letters (A, B, and C) indicate significant overall differences between spider sex or life stage independent of season (panel A), and field positions (margin vs. field) irrespective of the spider sex or life stage (panel B). In panel A, lowercase letters indicate significant differences between spider activity-densities depending on their sex or life stage within a season, or between seasons within the same sex. In all panels, points represent raw data. In panel C, fitted lines show predictions from the negative binomial GLM.

Specific-spider distributions in the field depending on their sex and the annual crop cover in the landscape
At species level, spider activity-densities of the six most sampled species in our study were significantly affected by the spider species identity (GLMM, χ2 = 20.76, df = 5, p < 0.001), the field sampling position (margin vs. field, χ2 = 20.95, df = 1, p < 0.001), but not by the independent effect of the annual crop cover at 500 m. Significant interactions were detected between species and field sampling position (fig. 4, χ2 = 79.94, df = 5, p < 0.001), between species and annual crop cover (χ2 = 24.27, df = 5, p < 0.001), and between species, annual crop cover, and sex (fig. 5, χ2 = 68.02, df = 6, p < 0.001). Post hoc pairwise contrasts revealed that spider activity-density differed among species and between margin and field positions (fig. 4). In the margin, C. bicolor and P. pullata were the most abundant taxa and had significantly more activity-density than O. apicatus, P. degeeri, and T. ruricola (p < 0.01). P. palustris also had more activity-density than O. apicatus (p < 0.01), as was P. degeeri (p < 0.05). Within the field position, species differences were weaker. Only O. apicatus had higher activity-density than P. pullata (p < 0.01), and C. bicolor (p < 0.05), while other pairwise contrasts were not significant (p > 0.05). Comparing positions for the same species showed clear edge effects: C. bicolor and P. pullata had significantly higher activity-density in the margin than in the field (p < 0.001), whereas O. apicatus had significantly more activity-density in the field than in the margin (p < 0.01). P. palustris, P. degeeri, and T. ruricola showed no differences in their activity-density between field and margin samples.
Spider average activity-density per trap (± standard error) depending on the species and the sampling position (margin or field). Lowercase letters above the boxplots denote significant differences between spider activity-densities at margin or field position. Points represent raw data.

Spider activity-density of the six most abundant spider species in relation to the proportion of annual crop cover at the 500 m scale varied among species and sex (fig. 5). Pardosa pullata and P. degeeri showed no significant trends for either sex. The activity-density of C. bicolor males increased significantly with crop cover (slope = 3.95 ± 1.25, z = 3.16, p = 0.002), whereas females showed a non-significant positive trend. Oedothorax apicatus males declined significantly (slope = –2.63 ± 0.92, z = –2.88, p = 0.004), while females showed no significant change. Both T. ruricola and P. palustris females declined significantly (T. ruricola: slope = –5.84 ± 1.18, z = –4.95, p < 0.001; P. palustris: slope = –3.30 ± 0.92, z = –3.59, p < 0.001), whereas males showed no significant trend.
Specific spider activity-density per trap explained by their sex (yellow for females, blue for males) and the average proportion of annual crop cover at 500 m around the sampling points. Points represent raw data, while fitted lines show the linear slope predictions from the negative binomial GLM. Full lines show slopes significantly different from 0 (post hoc emtrends test), while dashed lines show non-significant trends.

Qualitative spider community analysis
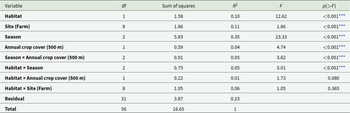
From the NMDS analysis based on Bray–Curtis dissimilarity, spider community composition varied significantly with sampling position (margin vs. field), season, and annual crop cover within 500 m of the fields (fig. 6; table 3; k = 2; stress = 0.17). PERMANOVA revealed that sampling position (margin vs. field) explained 9.5% of the community variation (p < 0.001), while season accounted for the largest share, explaining 35.0% of the variation (p < 0.001). The proportion of annual crop cover within 500 m of the fields also had a significant effect, explaining 3.6% of the community change (p < 0.001). Interactions further contributed community changes: the interaction between season and annual crop cover explained 5.4% of the change (p < 0.001), while the interaction between sampling position and season explained 4.5% (p < 0.001). In contrast, the interaction between sampling position and annual crop cover was weak (1.3%, p = 0.077), and the interaction between sampling position and farm was not significant, indicating that community composition differences between margin and field appear robust across local contexts. Farm identity alone explained 11.2% of the variation (p < 0.001), suggesting spatial heterogeneity among landscapes. Dispersion did not differ significantly among farms (p = 0.41), but a significant heterogeneity in dispersion was observed among seasons (p = 0.001), indicating greater within-season variability.
Non-metric multidimensional scaling (NMDS) ordination of the sampled spider communities based on farm-level assemblages (k = 2; stress = 0.168). Points represent individual farms, coloured by their sampling position (green = margin vs. orange = field). Coloured polygons group farms by sampling position (margin or field) within each season. Light text labels indicate farm codes coloured by sampling position. Star-shaped labels and large text represent the average position of communities (centroids) per position and season combination. Axes represent NMDS dimensions derived from Bray–Curtis dissimilarities, where closer farms indicate more similar spider community composition. Explained variance (R 2) and their significance are computed from a PERMANOVA analysis.

Results of the PERMANOVA (Bray–Curtis dissimilarity on Hellinger-transformed data) testing the effects of local habitat, season, and landscape composition on spider community structure (4000 permutations)

NMDS stress = 0.168.
Significance codes: ***p < 0.001.
Discussion
Our results confirmed strong seasonal structuring of ground-dwelling spider communities, with richness and activity-density peaking in spring and summer and declining in autumn. While spider richness of the overall community was numerically higher in the margin than in the field, this trend did not reach statistical significance, in part contradicting our initial hypothesis. However, margins consistently supported higher spider activity-density than the fields, although species and life stage–specific patterns varied across seasons. There were strong species-specific responses to edge position, with dominating lycosids (such as Pardosa spp. and C. bicolor) thriving in field margins, while smaller linyphiids such as O. apicatus preferentially occupied field habitats. Contrary to expectations, the effect of surrounding agricultural intensity was not uniformly negative, as responses to annual crop cover depended on the spider species and its sex as well as the season. Some spider species showed positive or neutral associations; and positive effects on the overall spider community for both activity-density and richness were observed in autumn. Community composition analyses further highlighted that both season and landscape context strongly shaped spider assemblages, while local habitat (margin vs. field) effects were robust across farms.
Seasonal and sexual distribution patterns
Spider richness was significantly lower in autumn compared to spring and summer samples, which is expected in temperate ecosystems. First, the phenology of most spiders is strongly dependent on seasonality, with adults either dying or hibernating in the colder months (Schaefer, Reference Schaefer1977, Reference Schaefer and Nentwig1987; Aitchison, Reference Aitchison1984; Li and Jackson, Reference Li and Jackson1996; Pekár, Reference Pekár1999). Second, resources become particularly scarce in annual crop fields, even for winter wheat as plants become dormant in winter. Overwintering arthropods therefore seek perennial refuges such as hedgerows or permanent grass strips in the landscape, which have resources such as microhabitats with suitable abiotic conditions throughout the cold seasons (Mestre et al., Reference Mestre, Schirmel, Hetz, Kolb, Pfister, Amato, Sutter, Jeanneret, Albrecht and Entling2018).
Our results show that season, sex, and life stage affected the activity-density of the spiders. In temperate ecosystems, many spiders are stenochronous (active only at a certain time of the year), reproducing in spring and summer and hibernating as immatures (Vlijm and Kessler-Geschiere, Reference Vlijm and Kessler-Geschiere1967; Richter et al., Reference Richter, den Hollander and Vlijm1971; Schaefer, Reference Schaefer1977). Our observations of a gradual increase in activity-density from autumn to early summer align with these expected phenological patterns. However, this trend was sex-specific in our data. While male activity-density rose consistently into summer, female activity-density only increased between autumn and spring before levelling off. Furthermore, contrary to the expectation that immatures would be prevalent in early-season samples when they emerge from hibernation, they were almost entirely absent from our catches throughout the year. This may indicate that immatures are scarce in or near cereal crop fields, perhaps due to disturbances linked to farming practices, consistent with findings from Schmidt and Tscharntke (Reference Schmidt and Tscharntke2005). Also, the near absence of immatures in our samples may reflect a methodological bias, as pitfall traps rely on activity and smaller, less mobile life stages may be under-represented compared to wider ranging adults (Topping and Sunderland, Reference Topping and Sunderland1992).
When comparing activity-densities between crop fields and perennial non-crop habitats vacuum-sampled in five sites of Germany, they found that species such as P. pullata and C. bicolor were significantly more abundant in non-crop habitats. This pattern was consistent with their observations of immatures from most families. Also, phenological niche shifts occur in spiders, with immatures occupying different microhabitats than adults, which may help limit competition and cannibalism (Wise, Reference Wise2006; Ávila et al., Reference Ávila, Stenert, Rodrigues and Maltchik2017; Costa et al., Reference Costa, Cardoso, Rigal and Borges2025). For example, in the genus Pachygnatha (Tetragnathidae), juveniles build webs while adults are active ground hunters (Levi, Reference Levi1980). Lastly, immature spiders may preferentially disperse by ballooning rather than by ground, thereby avoiding pitfall traps (Duffey, Reference Duffey and Selden1998; Weyman et al., Reference Weyman, Sunderland and Jepson2002).
Sexual differences in the activity-density of sampled spiders across the crop season probably result from their reproductive strategies (Schmitt et al., Reference Schmitt, Schuster and Barth1990; Harvey and Dong, Reference Harvey and Dong2023). For instance, Pardosa spp. females were found to be highly active in the early season before breeding, then become mostly inactive when they carry egg cocoons (Richter et al., Reference Richter, den Hollander and Vlijm1971). Then, when the eggs hatch and they carry immatures, they are active again, a behaviour suggested to help dispersal (Vlijm and Richter, Reference Vlijm and Richter1966). Our results show a non-significant decrease of females in early summer compared to spring. This could be linked to an increase in their activity during spring (feeding), which then decreases in late spring or early summer (cocooning). Similarly, males tend to be the ‘searching sex’ when it comes to finding a mate (Cordellier et al., Reference Cordellier, Schneider, Uhl and Posnien2020), corroborating our observations of their higher activity throughout the year compared to that of the females. Activity patterns also depend on family, genus, or specific life-traits. For instance, among the five most abundant spider species sampled, two belonged to the sheet-web weaver (Linyphiidae) family, and one to the long-jawed orb weavers (Tetragnathidae). In these weaver families, females are less motile than in cursorial families such as the wolf spiders (Lycosidae) (Framenau, Reference Framenau2005; Viera and Gonzaga, Reference Viera and Gonzaga2017; Dong et al., Reference Dong, Harvey, Steegh, Gols and Rowe2023), further explaining sexual differences (i.e. more males sampled) in observed activity-density patterns.
Local habitat distribution
Our results regarding spider richness distribution, but not activity-density, do not fully align with previous findings where beneficial arthropod diversity has generally been reported to be higher in margins or neighbouring habitats than within crops (Thomas and Marshall, Reference Thomas and Marshall1999; Clough et al., Reference Clough, Kruess, Kleijn and Tscharntke2005; Schmidt and Tscharntke, Reference Schmidt and Tscharntke2005; Öberg et al., Reference Öberg, Ekbom and Bommarco2007). Spillover from margins into fields resulting in higher field diversity may occur when spiders search for prey or avoid local competition and intraguild predation (Wagner and Wise, Reference Wagner and Wise1997; Samu et al., Reference Samu, Sunderland and Szinetár1999; Willemart and Lacava, Reference Willemart, Lacava, Viera and Gonzaga2017). In winter wheat fields across North-western Europe, Tougeron et al. (Reference Tougeron, Couthouis, Marrec, Barascou, Baudry, Boussard, Burel, Couty, Doury, Francis, Hecq, Le Roux, Pétillon, Spicher, Hance and van Baaren2022) detected increased spider richness in the field compared to the margin for both hedge and grass strip margins, but only in the hotter summer months.
In our study, field sampling positions were located at a maximum 30 m from the field edge, a distance that is within the foraging range of many cursorial ground-dwelling spiders (Samu et al., Reference Samu, Sunderland and Szinetár1999; Seer et al., Reference Seer, ElBalti, Schrautzer and Irmler2015). Thus, although activity-density was lower in fields than in margins, field samples may not have been far enough from edges to prevent dispersal and foraging from species mainly dependent on margin habitats. Also, our observations may also reflect typical edge effects from ecotones, with field samples hosting a mixture of margin and agrobiont field-dwelling species (Horváth et al., Reference Horváth, Magura, Péter and Tóthmérész2002; Gallé et al., Reference Gallé, Geppert, Földesi, Tscharntke and Batáry2020). Our spatial analysis indicated some overlap between margin and field spider communities, particularly in autumn. Some species such as the linyphiid Oedothorax apicatus reached higher densities in field samples than in margins, consistent with its known status as an agrobiont species (Samu and Szinetár, Reference Samu and Szinetár2002; Thorbek et al., Reference Thorbek, Sunderland and Topping2004; Schmidt and Tscharntke, Reference Schmidt and Tscharntke2005; Öberg et al., Reference Öberg, Ekbom and Bommarco2007). Oedothorax apicatus shows high (re)colonisation rates in field thanks to passive dispersal through ballooning, where it can then thrive due to reduced competition (Pfister et al., Reference Pfister, Schäfer, Schirmel and Entling2015; Řezáč and Řezáčová, Reference Řezáč and Řezáčová2019). In addition, this species can overwinter almost entirely in crops (Mestre et al., Reference Mestre, Schirmel, Hetz, Kolb, Pfister, Amato, Sutter, Jeanneret, Albrecht and Entling2018).
In crop fields of Germany, Plath et al. (Reference Plath, Rischen, Mohr and Fischer2021) suggest that the crop type itself influences spider diversity in both field and margin samples. They collected significantly less spider species in wheat fields than in other habitats, and like in our observations, spider richness or activity-density did not differ between wheat field and wheat margin. They hypothesised that this resulted from low floral resources in and around wheat fields, as local vegetal diversity is known to bolster predator including spider metrics thanks to cascading effects along the trophic chain (Sunderland and Samu, Reference Sunderland and Samu2000; Schmidt-Entling and Döbeli, Reference Schmidt-Entling and Döbeli2009; Theron et al., Reference Theron, Gaigher, Pryke and Samways2020; Hatt and Döring, Reference Hatt and Döring2023).
Nevertheless, our results show that overall, the spider family, genera, and specific richness were higher in the margins than in the fields. The lack of statistical significance for this trend likely stems from high variability linked to local and landscape factors that were not fully captured in our models.
Future research should evaluate more fine-scale local drivers, such as the specific vegetation height and floral diversity within the margins, as well as the quality of the surrounding semi-natural habitats (e.g. hedgerow connectivity vs. isolated grass strips). Additionally, integrating multi-scale landscape analyses (beyond a single 500 m radius as done here) may help isolate the landscape noise that often masks subtle local edge effects in highly fragmented agro-ecosystems.
Specific and seasonal landscape effects on the spider distribution
Contrary to our expectations, the annual landscape crop cover at 500 m around the fields did not always negatively affect spider metrics, as this depended on the season, the spider species and its sex. In autumn, both overall richness and activity-density increased with the proportion of annual crop cover. We can hypothesise that in fall, agricultural land may not provide enough resources in that season, increasing their activity-density as they forage. In contrast, Belgian cereal winter wheat crops in agricultural landscapes may host resources (prey and habitats) that allow subsistence of certain agrobiont spiders. However, most spiders require non-crop habitats as refuges to overwinter (Mestre et al., Reference Mestre, Schirmel, Hetz, Kolb, Pfister, Amato, Sutter, Jeanneret, Albrecht and Entling2018), before recolonising fields in spring or later (Öberg and Ekbom, Reference Öberg and Ekbom2006; Bertrand et al., Reference Bertrand, Baudry and Burel2016). Therefore, annual crop cover in the landscape may be a barrier to spider dispersal and recolonisation in spring, as trends observed in our data show. Later in the season, prey resources are probably scarcer in crops than in semi-natural areas (e.g. flower density and subsequent trophic effects), thus also prove detrimental to spider (and overall biodiversity) sustenance (Hendrickx et al., Reference Hendrickx, Maelfait, Van Wingerden, Schweiger, Speelmans, Aviron, Augenstein, Billeter, Bailey, Bukacek, BUREL, Diekötter, Dirksen, Herzog, Liira, Roubalova, Vandomme and Bugter2007; Tscharntke et al., Reference Tscharntke, Bommarco, Clough, Crist, Kleijn, Rand, Tylianakis, Nouhuys and Vidal2007; Attwood et al., Reference Attwood, Maron, House and Zammit2008; chaplin‐kramer et al., Reference Chaplin‐kramer, O’Rourke, Blitzer and Kremen2011; Marja et al., Reference Marja, Tscharntke and Batáry2022; Ferrante et al., Reference Ferrante, Liebke, Hass, Wollenweber, Zembold, Arimond, Schüler and Westphal2025).
Other authors have found a link between season, species, and landscape effects on spider metrics. Schmidt et al. (Reference Schmidt, Roschewitz, Thies and Tscharntke2005) describe a positive effect of non-crop habitats in the landscape in May, but not in July samplings, and noted that landscape effects on spider density differ among species. In a subsequent study, they further observed that landscape effects depend on the spatial scale at which they are measured, and documented contrasting species-specific responses (Schmidt et al., Reference Schmidt, Thies, Nentwig and Tscharntke2008). As stated earlier, species such as O. apicatus or P. degeeri, but also some Pardosa spp., Erigone spp. that dominated our sampling can be considered as agrobionts and thrive in crop habitats. Our results suggest that these may benefit from crop habitats not only at the local scale but also at the landscape scale. Our data did, however, not show the annual positive effects of the crop cover in the landscape on these species, as only C. bicolor males showed increased densities with crop cover. However, general seasonal effects were detected on the spider community; thus, crop cover may be beneficial to specific spider populations depending on their sex or life stage only in particular seasons. Unfortunately, we did not have enough data to fully test this hypothesis as we lacked samples per species, sex or life stage, and per season to fit a full model with interactions between all predictors. Our results could also be linked to local factors that we failed to detect that masked more subtle landscape patterns.
The exclusive use of pitfall traps as a sampling method is a limiting factor for obtaining a more comprehensive overview of the spider distribution. Many weaver species seldom disperse or forage on the ground, and some spiders such as the jumping spiders (Salticidae) may even be capable of avoiding the traps (Topping and Sunderland, Reference Topping and Sunderland1992; Hendawy, Reference Hendawy2009; Gardarin and Valantin-Morison, Reference Gardarin and Valantin-Morison2021). Such spiders have clusters of specialised setae on the tips of their feet that produce adhesion by molecular forces, allowing them to climb smooth surfaces (Roscoe and Walker, Reference Roscoe and Walker1991; Kesel et al., Reference Kesel, Martin and Seidl2003; Wolff et al., Reference Wolff, Nentwig and Gorb2013; Labarque et al., Reference Labarque, Wolff and Michalik2017). This may explain why salticids were nearly absent from our sample. Next to these considerations, some caution should be given to the results regarding specific immature spider distributions. Although highly uncertain immature identifications were discarded, some species are particularly complex to distinguish from one another and identification errors may have occurred. Additionally, our design did not allow us to distinguish ecotone species from strictly field-dwelling species, which should be considered for future sampling protocols (Öberg et al., Reference Öberg, Ekbom and Bommarco2007; Ferrante et al., Reference Ferrante, Liebke, Hass, Wollenweber, Zembold, Arimond, Schüler and Westphal2025). Other local factors, such as crop-type (Plath et al., Reference Plath, Rischen, Mohr and Fischer2021), but also margin composition, should also be evaluated, as grassy margins and hedgerows, for example, provide different microhabitats in the margins (Pywell et al., Reference Pywell, James, Herbert, Meek, Carvell, Bell and Sparks2005; Mestre et al., Reference Mestre, Schirmel, Hetz, Kolb, Pfister, Amato, Sutter, Jeanneret, Albrecht and Entling2018; Tougeron et al., Reference Tougeron, Couthouis, Marrec, Barascou, Baudry, Boussard, Burel, Couty, Doury, Francis, Hecq, Le Roux, Pétillon, Spicher, Hance and van Baaren2022). Understanding the interactions between margin and landscape compositions would also help in designing suitable agro-ecological infrastructures that can support spider conservation and enhance their role in pest regulation in agro-ecosystems (Gallé et al., Reference Gallé, Geppert, Földesi, Tscharntke and Batáry2020; quijano‐cuervo et al., Reference Quijano‐cuervo, Del‐val, Macías‐ordóñez, Dáttilo and Negrete‐Yankelevich2024).
Conclusion
In this study, we established a first overview of spider assemblages in Belgian winter cereal fields and their margins. Contrary to our initial hypothesis, species richness does not appear to differ between habitats, although activity-densities were consistently higher in margins. This suggests that margins primarily act as resource-rich refuges boosting spider numbers rather than expanding the local species pool at this spatial scale. This result further supports the value of conserving semi-natural habitats in crop margins to promote arthropod ecosystem service providers such as spiders for their biological control potential. Our second hypothesis, predicting the negative effects of crop cover at the landscape scale, was also not supported as spider responses varied by season and species, with overall spider richness and abundance even increasing with surrounding crop cover in autumn.
Overall, our results highlight that spider diversity and activity-density in agro-ecosystems are shaped by an interplay of niches in local habitats (margin vs. field), landscape, seasonal, and biological factors. Such context dependence cautions against general assumptions of uniformly positive effects of semi-natural habitats at the local or landscape scale. Effective agro-ecological strategies should explicitly account for seasonal dynamics, spider dispersal capacities linked to species life traits, sex or phenology, and the surrounding crop composition when designing and managing crop margins. This baseline understanding of the factors affecting spider distributions in Belgian agro-ecosystems provides an essential step towards their integration to pest regulation strategies at larger scales.
Supplementary material
The supplementary material for this article can be found at https://doi.org/10.1017/S0007485326100947.
Acknowledgements
The authors wish to thank the farmers who allowed sampling on their farms and Kilian Mignolet, Martin Budin, Victor Pardo, Adrien Frutsaert and Mathieu Bouillon who assisted with the fieldwork. The study was implemented within the Biodiversa+ BiodivProtect ConservES project (2023-2026) and funded by ANR (project number ANR-22-EBIP-0017-03). Work in Belgium was funded by FRS-FNRS (FNRS PINT R.8011.22).
Competing interests
The authors declare no conflict of interest.





 Open access

